R 624 - De-anchored long-term inflation expectations in a low growth, low rate environment - Banca d'Italia
←
→
Page content transcription
If your browser does not render page correctly, please read the page content below
Questioni di Economia e Finanza
 (Occasional Papers)

 De-anchored long-term inflation expectations in a low growth,
 low rate environment

 by Guido Bulligan, Francesco Corsello, Stefano Neri and Alex Tagliabracci
June 2021

 624
 Number
Questioni di Economia e Finanza
(Occasional Papers)

De-anchored long-term inflation expectations in a low growth,
low rate environment

by Guido Bulligan, Francesco Corsello, Stefano Neri and Alex Tagliabracci

Number 624 – June 2021
The series Occasional Papers presents studies and documents on issues pertaining to
the institutional tasks of the Bank of Italy and the Eurosystem. The Occasional Papers appear
alongside the Working Papers series which are specifically aimed at providing original contributions
to economic research.

 The Occasional Papers include studies conducted within the Bank of Italy, sometimes
in cooperation with the Eurosystem or other institutions. The views expressed in the studies are those of
the authors and do not involve the responsibility of the institutions to which they belong.

 The series is available online at www.bancaditalia.it .

ISSN 1972-6627 (print)
ISSN 1972-6643 (online)

Printed by the Printing and Publishing Division of the Bank of Italy
DE-ANCHORED LONG-TERM INFLATION EXPECTATIONS
 IN A LOW GROWTH, LOW RATE ENVIRONMENT

 by Guido Bulligan, Francesco Corsello, Stefano Neri and Alex Tagliabracci*

 Abstract
 This paper provides evidence of de-anchoring of long-term inflation expectations in the
euro area based on both time series and panel methods and data from the ECB Survey of
Professional Forecasters. Long-term inflation expectations recorded two sharp and permanent
declines: the first after the 2013 disinflation, the second in early 2019. Long-term inflation
expectations also started reacting to short-term developments in inflation after the 2013
disinflation. Long-term growth expectations have declined continuously since the early 2000s.
Looking forward, the increased likelihood of a low growth and low inflation environment
may reduce the monetary policy space. The positive correlation between long-term real GDP
growth and inflation expectations suggests that forecasters view future macroeconomic
developments as driven mainly by demand-side shocks. Under these circumstances, the risk
of a further de-anchoring of long-term inflation expectations remains high.

JEL Classification: E31, E52, E58.
Keywords: survey data, panel data, professional forecasters, inflation expectations, monetary
policy.
DOI: 10.32057/0.QEF.2021.624

 Contents

1. Introduction ........................................................................................................................... 5
2. Developments in survey-based long-term inflation expectations since 2013 ....................... 7
3. Level anchoring ..................................................................................................................... 8
 3.1 Level anchoring: a time series approach ........................................................................ 8
 3.2 Level anchoring: a panel approach ................................................................................. 9
4. Shock anchoring .................................................................................................................. 10
 4.1 Shock anchoring: a time series approach ..................................................................... 10
 4.2 Shock anchoring: a panel approach .............................................................................. 10
5. De-anchoring in a low growth environment ........................................................................ 12
 5.1 Long-run developments in expectations ....................................................................... 12
 5.2 The risk of a low-growth low-inflation environment ................................................... 13
 5.3 A joint assessment of the probability distribution ........................................................ 13
 5.4 Inflation and growth expectations during the Covid-19 pandemic .............................. 15
6. Conclusions and policy implications ................................................................................... 16
References ................................................................................................................................ 17
Figures and tables ..................................................................................................................... 19

_______________________________________
* Bank of Italy, Economic Outlook and Monetary Policy Directorate.
1. Introduction

Long-term inflation expectations play a key role in monetary policy. The anchoring of long-term
expectations is a necessary condition for central banks to maintain price stability, as it prevents
temporary shocks from having persistent effects on inflation. Well-anchored long-term inflation
expectations are a sign of credibility of the monetary policy strategy of a central bank.
 More generally, inflation expectations influence the ability of the central bank to stabilize
aggregate demand and inflation by adjusting its policy rate or adopting quantitative easing measures
to influence real interest rates and, in turn, households’ consumption and firms’ hiring, investment,
and wage and price setting behaviour. Cecchetti et al. (2021) describe the role that inflation
expectations play in the transmission of aggregate shocks. They also describe how econometric tools
are used at Banca d’Italia for measuring and studying inflation expectations and assessing their impact
on the decisions of households and firms.
 Well-anchored inflation expectations can also act as a tool to support the economy when the
policy rate is constrained by the effective lower bound (ELB). In these circumstances, central banks’
communication can be very effective (Coibion et al., 2020). For instance, the statement on the long-
run goals of the Federal Open Market Committee (FOMC) of the Federal Reserve acknowledges the
important role of anchored inflation expectations, as they “[…] foster price stability and moderate
long-term interest rates and enhance the Committee’s ability to promote maximum employment in
the face of significant economic disturbances […]”. 1 Naggert et al. (2021) document an upward shift
in the lower end (below 2 per cent) of the distribution of inflation expectations and a stronger
anchoring of expectations around the 2 per cent inflation goal following the announcement of the
outcome of the monetary policy review by the FOMC.
 The European Central Bank (ECB) began reviewing its monetary policy strategy in January
2020, with the aim of taking stock of how it has supported the fulfilment of the price stability mandate,
and also to consider whether any elements of the strategy need to be adjusted. 2 When the policy rates
are at their ELB for an extended period of time, recording below-target inflation for too long can lead
to a de-anchoring of long-term inflation expectations. Such de-anchoring can make reflating the
economy even harder (Lane, 2021). To avoid de-anchoring, monetary policy must be sufficiently pre-
emptive and bold to prevent inflation from staying low for too long (Lane, 2020).
 Market-based indicators of inflation expectations (inflation-linked swaps) in the United States
remain well above the corresponding indicators for the euro area (Figure 1). This pattern emerged in
2013 and has remained in place until today. While the different developments may reflect the distinct
monetary policy strategies of the Federal Reserve and the ECB, the persistent gap may suggest a
weaker anchoring of long-term inflation expectations in the euro area. Figure 1 shows that the yield

 The views expressed in this article are those of the authors alone and do not necessarily represent the positions of Banca
d’Italia or of the Eurosystem. The authors would like to thank Fabio Busetti, Michele Caivano, Marianna Riggi, Marco Taboga, Andrea
Tiseno, Giordano Zevi and Roberta Zizza for their comments and suggestions.
1 See the “Statement on Longer-Run Goals and Monetary Policy Strategy” of the FOMC released on 26 January 2021. The statement

is available at https://www.federalreserve.gov/monetarypolicy/files/FOMC_LongerRunGoals.pdf. The statement was revised after the
completion of the review of the strategy, which was announced at the Jackson Hole Symposium on 27 August 2020.
2 See the press release “ECB launches review of its monetary policy strategy” published on 23 January 2020 and available at

https://www.ecb.europa.eu/press/pr/date/2020/html/ecb.pr200123~3b8d9fc08d.en.html.

 5
on the 5y-5y inflation-linked swap in the United States has been above the corresponding yield for
the euro area since 2010. 3 Since early 2019, however, the difference between the two yields has
widened, as the euro-area inflation swap declined substantially.
 Motivated by the review of the monetary policy strategies by both the Federal Reserve, which
underlined the importance of anchored inflation expectations, and the ECB, as well as by the
persistent gap between market-based indicators of long-term inflation expectations, in this paper we
update the analyses presented in Corsello, Neri and Tagliabracci (2021; CNT, henceforth) regarding
the anchoring of long-term inflation expectations in the euro area and provide complementary
evidence based on a panel estimation approach. We also present evidence on the correlation between
long-term inflation and growth expectations, which helps us to shed light on the probability of a low
interest rate environment and on the implications for monetary policy going forward.
 The paper poses the following closely related questions. Are long-term inflation expectations
in the euro area well-anchored? Can individual survey replies provide additional information in
assessing the degree of anchoring? How do professional forecasters view the joint long-term
evolution of inflation and growth and do these expected developments pose challenges to the ECB?
In answering these questions, the paper briefly discusses developments in long-term growth and
inflation expectations since the outbreak of Covid-19.
 We use data from the ECB Survey of Professional Forecasters (SPF), which provides
information on expected inflation, real GDP growth, and unemployment rates over horizons ranging
from the current year up to five years ahead. 4 We do not consider households’ and firms’ expectations,
as to the best of our knowledge, no measures of long-term inflation expectations are available for a
sufficiently long period.
 Our contribution to the literature on inflation expectations and their anchoring is twofold. First,
we update the time series analyses presented in CNT to mid-2021, thus including data covering the
Covid-19 pandemic and exploit the panel dimension of the SPF to assess the degree of anchoring of
long-term inflation expectations. Second, we study the joint distribution of long-term real GDP
growth and inflation expectations. Both issues are highly relevant from a policy perspective. In a low
growth and low inflation environment, the effective lower bound constraint is likely to be more
frequently binding, affecting the capability of the central bank to maintain inflation on target and
therefore to preserve the anchoring of long-term inflation expectations.
 Our empirical analyses offer the following answers to our questions. Both time series and panel
data methods confirm the findings presented in CNT of de-anchored long-term inflation expectations
in the euro area. The high likelihood of low growth and low inflation expectations extending into the
medium term poses significant challenges to the ECB’s monetary policy and strengthens the case for
its strategy to focus on re-anchoring long-term inflation expectations.
 The remainder of the paper is organized as follows. Section 2 describes developments in long-
term inflation expectations and in their probability distribution. Sections 3 and 4, respectively, assess

3 Part of the difference is due to the inflation risk premiums, which may differ between the United States and the euro area. The FOMC
clarified only in January 2012 that the long-run inflation goal was 2 per cent. The inflation target of the ECB is implicitly defined as
“below, but close to, 2 per cent in the medium term”.
4
 See Garcia (2003) for a description of the SPF.

 6
the degree of level anchoring and shock anchoring. Section 5 studies the joint distribution of long-
term growth and inflation expectations, drawing the implications for the anchoring of long-term
inflation expectations. Section 6 offers some concluding remarks.

2. Developments in survey-based long-term inflation expectations since 2013

The persistently low inflation experienced around the world since the global financial crisis has
spurred a lively debate into the anchoring of inflation expectations. An extensive literature focused
on the developments in the euro area around 2013, when long-term inflation expectations showed
signs of de-anchoring. Among others, CNT uses the ECB SPF to document that long-term inflation
expectations have de-anchored from the ECB’s inflation aim since 2013. Łyziak and Paloviita (2017)
also find that SPF-based long-term inflation expectations have shown signs of de-anchoring since
2013.
 The decline in the level of inflation expectations, which began with the 2013 disinflation,
plateaued in early 2015 after the ECB launched its Asset Purchase Programme (APP). Bulligan (2018)
finds that the APP announcement coincided with the reversal of the decline of long-term inflation
expectations, with an upward revision to levels that, however, remained below those prevailing before
the most acute phase of the sovereign debt crisis in mid-2012. After the lows reached in 2016, long-
term inflation expectations gradually recovered in 2017 and 2018. By the end of 2018, expectations
had returned to levels close to the ones that prevailed before the beginning of the 2013 disinflation
(Figure 2, panel a). The increase may have reflected the improvement in the outlook for inflation
following the adoption of a package of non-standard measures by the ECB since mid-2014, among
which the APP played a key role.
 Long-term inflation expectations, however, inverted their positive trend in early 2019 (Figure
2, panel b); they declined in each of the four rounds of the SPF carried out in that year, and
cumulatively by 0.2 percentage points. Long-term expectations reached new historical minima in
2020: the mean expectation was 1.65 in July 2020, the median point expectation was 1.6 in October
2020 and the mean of the aggregate probability distribution was 1.55 in April 2020. All these
measures stood at 2 per cent in mid-2012. Since the outbreak of the Covid-19 pandemic in early 2020,
long-term inflation expectations have remained close to their historical lows.
 In parallel with the decline in point expectations, the aggregate probability distribution of long-
term inflation also experienced marked changes over time (Figure 3, panels a and b). The probability
of long-term inflation lying below 1 per cent increased from around 4 per cent in 2007 to about 13
per cent in 2014 and then to almost 20 per cent in 2020. At the same time, the probability of inflation
above 2 per cent declined from around 45 per cent in 2007 to about 37 in mid-2014 and 28 in 2020.
The probability of inflation between 1.5 and 1.9 per cent, the interval that is likely to include the
Governing Council’s inflation aim, was at around 40 per cent in 2006. 5 This probability started
declining in 2008 and hovered around 30 per cent until 2018. After having somewhat increased
between 2016 and 2018, the probability of inflation between 1.5 and 1.9 per cent has been declining

5 According to the answers to a special question on the interpretation of the ECB’s “below, but close to, 2 per cent”, SPF participants
view the inflation aim as laying in the 1.7-2.0 range. The special question was the following: “What is the level or range of inflation
that, according to your view, is in line with the ECB’s price stability objective?”. For the results, see
https://www.ecb.europa.eu/stats/ecb_surveys/survey_of_professional_forecasters/html/ecb.spf2020q4~dab5d8085d.en.html.

 7
since the end of 2018. Similarly, the probability of long-term inflation falling in the 1.0-1.4 per cent
bin, which stood at around 15 per cent in 2007, reached 40 per cent by the end of 2019. Since then,
the probability has hovered around this level.
 Until 2013, the distribution of long-term expectations was skewed to the right. The probability
of inflation outcomes below or equal to 1.4 was smaller than the probability of inflation at or above
2 per cent. With the beginning of the disinflation, the probability mass started moving to the left and
the distribution became skewed to the left.

3 Level anchoring

In this section, we evaluate how long-term inflation expectations have changed their degree of level-
anchoring, as defined in Ball and Mazumder (2011). 6 Expectations are “level-anchored” when they
remain close to the central bank’s inflation target regardless of current inflation developments. To
this purpose, we model the level of long-term inflation expectations and use break-point tests
exploiting both aggregate (time series) and disaggregate (panel) data from the SPF.

3.1 Level anchoring: a time series approach

This section provides an update on one of the analyses in CNT. Among the various approaches
considered, the authors applied the methodology developed by Bai and Perron (2003; BP2003
henceforth) to make inference about persistent shifts in the level of inflation expectations. Compared
with CNT, who use data up to 2019:Q2, we extend the sample to 2021:Q2, which includes a few
survey rounds conducted during the Covid-19 pandemic.
 The BP2003 procedure is calibrated to allow for a maximum number of = 5 structural
regime breaks. The equation is:

 = + , = −1 + 1, … , (1)

for = 1, … , , where is the number of potential breaks, is the inflation expectation, is a
regime-specific intercept and an i.i.d. error term. Evidence of a break in the intercept implies that
forecasters have switched to a new regime and have persistently revised their long-term inflation
expectations. The methodology of BP2003 is calibrated to have a minimum length of 8 quarters for
each regime , compared with 11 quarters in CNT. The smaller length allows us to capture more
easily downshifts in long-term expectations over the most recent period in which they kept falling.
Figure 4 shows the results of the estimation of equation (1) using the three measures of long-term
inflation expectations reported in Figure 2.
 Compared with CNT, our approach confirms the breaks detected in mid-2000s and at the end
of 2013, and identifies a further downward shift in the level of expectations in early 2019 for the
mean point expectations and for the mean of the aggregate probability distribution. In the case of the
median point expectations, the BP2003 methodology only detects one break in mid-2019. The
magnitude of the downward shifts in 2019 ranges between 15 and 23 basis points depending on the

6 Kumar et al. (2015) provide a finer taxonomy of inflation expectations anchoring, describing five conditions that ideally anchored
long-term inflation expectations should satisfy.

 8
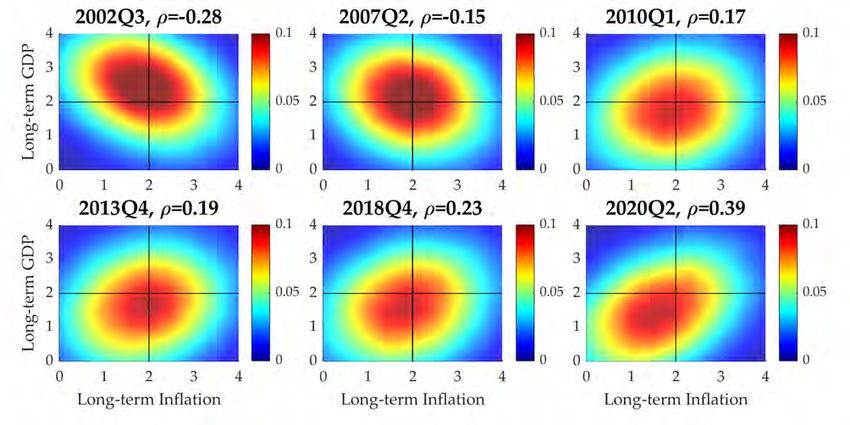
considered measure. Taking into account also the downward shift occurred in the fourth quarter of
2013, the total decline in the level of the expectations ranges between 23 and 33 basis points.
 The occurrence of a further downward shift in long-term inflation expectations since 2019
reinforces the concerns of their de-anchoring, in line with the findings in CNT. The break occurred
before the outbreak of the Covid-19 pandemic may be driven by the slowdown in global and euro-
area economic activity, which started in early 2019 and that may have been reinforced by perceptions
of a too early termination of the active phase of the APP by the ECB in December 2018.

3.2 Level anchoring: a panel approach

In this section, we further explore the behaviour of long-term inflation expectations and assess their
anchoring by exploiting the panel dimension of the SPF. In a panel context, the variation across
forecasters can be exploited to draw more accurate inference on the parameters of interest by
controlling for both individual unobserved heterogeneity and common aggregate source of variations.
 We assume that the breaks are common to all forecasters in the sample and adopt the sequential
approach developed by Bai (2010) for common breaks in the mean. Theoretically, a common break
is a more restrictive assumption than that of heterogeneous breaks. Nevertheless, when break points
are the result of common shocks or policy shifts affecting every individual, imposing the constraint
of a common break improves the precision of the estimation, without loss of realism. Furthermore,
even if each individual had its own break point, the assumption of common breaks would deliver an
estimate of the mean of the individual break points. Consistently with the model (1), we estimate the
following (individual) fixed effect model:

 = + + , = 1, … , = −1 + 1, … , , (2)

where the individual fixed effect ( ) allows to control for unobserved, time invariant, forecaster
specific characteristics and captures time variation in the forecaster specific nominal anchor
around which her long-term inflation expectations hover. As in the previous section, the index j refers
to the specific regime reflecting the assumption that changes in the anchor occur occasionally. Unlike
the time series aggregate analysis, no maximum is imposed on the number of breaks. The error term
 , is i.i.d. with constant (over time) variance. 7

 The Bai (2010) methodology identifies three break dates: 2008:Q4, 2014:Q1 and 2019:Q3.
Breaks identified in those periods occur in correspondence of the large changes in the aggregate mean
point forecast (Figure 5). At the first break date, mean expectations shifted upward by 6 basis points. 8
In 2014:Q1, instead, the downward shift amounts to, on average, 12 basis points. At the second break
point, long-term inflation expectations shifted downward by 16 basis points, bringing the overall
decline since 2014 to nearly 30 basis points, in line with the results based on the time series approach.

7
 The assumption of cross-sectional independence can be relaxed, without affecting the consistency of the estimator.
8
 This first break is only detected with the panel approach (and not with the time series one) since it relies on a more efficient inference
which allows to capture also these modest changes in the regime.

 9
4 Shock-anchoring

Borrowing from Ball and Mazumder (2011), we define long-term inflation expectations as “shock-
anchored” when they do not respond to shocks. Against this background, in this section, we focus on
the degree of sensitivity of long-term inflation expectations to inflation surprises. Our analyses
consider both aggregate and granular approaches.

4.1 Shock-anchoring: a time series approach

In this section, we measure the sensitivity of long-term inflation expectations to inflation surprises,
as indicator of shock-anchoring. The inflation surprises are measured by the difference between the
monthly flash releases of the euro area year-on-year inflation rates (based on the Harmonized Index
of Consumer Prices) and the median forecasts of the analysts surveyed by Bloomberg. 9
 Our approach is based on a rolling-window estimation, which allows assessing changes of this
sensitivity without imposing a precise sample split and is consistent with smooth modifications in the
inflation expectation formation mechanism. We estimate the following equation:

 ∆ = , + (3)

where , is the negative inflation surprises and is an i.i.d. error term. We estimate equation (3)
using a moving window of 24 quarters. The results are robust to different window sizes (20 and 28
quarters). Based on the results presented by CNT, we only consider the negative surprises (i.e.
inflation is over-predicted). 10 Figure 6 shows the results. As documented in CNT, the sensitivity to
inflation surprises becomes statistically significant when the rolling sample includes the observations
of the 2013-2014 disinflation. This sensitivity remains significant afterwards and peaks in early 2020
for all measures, at between 0.2 and 0.35. Since mid-2020, the sensitivity to the negative inflation
surprises becomes statistically not significant, with the exception of the median point expectations.
 Overall, the results suggest that long-term inflation expectations have become shock de-
anchored after the 2013 disinflation, in line with the results in CNT, which are based on data up to
2019:Q2.

4.2 Shock-anchoring: a panel approach

In this section, we assess the degree of anchoring of long-term inflation expectations on the basis of
their sensitivity to short-term news on inflation, exploiting the panel dimension of the SPF survey.
 To this end, equation (3) is modified with the subscript i to account for the panel dimension:

 ∆ = , + , (4)

where , is the inflation “news” indicator. 11 In this section the latter is either defined as short-term
inflation surprise in exactly the same way as in the previous section (i.e. as the difference between

9
 See CNT for details.
10
 The sensitivity to positive surprises appears not significant also in the last part of the sample.
11 As the model is specified in terms of revisions (i.e. changes in forecasters’ long-term inflation expectations), individual fixed effects

are dropped.

 10
the inflation release and the Bloomberg median forecast; St) or as the revision in the short-term (1-
 1
year ahead) forecaster-specific inflation expectation from the SPF ( ).

 The “news” indicator St has the advantage of precisely defining short-term inflation surprises
but, on the other hand, in a panel context imposes the assumption that all forecasters are subject to
the same surprise. 12 Under such assumption, exploiting the panel dimension of the SPF improves the
efficiency of the estimation as the number of observations is mechanically multiplied by a factor N
(where N is the number of forecasters in the SPF survey) compared to the time series exercise.
 1
 The “news” indicator has the advantage of providing us with a forecaster-specific proxy of
inflation news; the disadvantage is that it measures inflation news only indirectly and with some
degree of imprecision. To understand this point, consider the quarterly frequency of the SPF: when
new information about inflation is released between one survey round and the next, forecasters update
their short-term (1-year ahead) expectations to account for the component of the releases that was
truly unexpected. In this sense, the revisions of their expectations incorporate the “surprises” to
inflation. To the extent that each forecaster embeds the inflation surprise in a different way (for
example because of different forecasting models), the forecaster-specific revision of her short-term
expectations allows to neatly test the relationship between long-term expectations and short-term
inflation surprises using individual-specific information sets. In both cases, under the null hypothesis
that long-term expectations are well-anchored, they should not react to short-term surprises.
 For both definitions of the inflation “news” indicator, there is evidence of shock de-anchoring
of long term expectations (Table 1, row 1), as the estimated coefficient β is positive and significantly
different from zero. 13 Furthermore, we find that the co-movement between negative short-term
 1
revisions ( ) and revisions of long-term expectations is slightly stronger than that between the latter
and positive revisions (Table 1, rows 2 and 3), and significantly stronger when short-term inflation
news are measured with the Bloomberg surprise (St).
 In order to assess the robustness of the general result, we estimate the model for the groups of
experienced and inexperienced forecasters, following CNT. The former are defined as those
forecasters who have participated to at least 60 rounds of the SPF survey. In principle, these
forecasters have committed resources to the survey and are therefore interested in the accuracy of the
information it can provide. Arguably, these forecasters should revise more quickly their forecasts in
response to changes in their information set, due to policy announcements, short-term inflation
surprises and other data releases deemed relevant for assessing the degree of inflationary pressures in
the economy. In line with this intuition, we find that the correlation between (revisions of) long-term
 1
inflation expectations and revisions of short-term forecasts ( ) is primarily driven by the behaviour
of less experienced forecasters (Table 1, row 4). When using the Bloomberg inflation surprise (St),
we find evidence of shock de-anchoring for both inexperienced and experienced forecasters.

12 This assumption is in fact less stringent than it might appear. The Bloomberg survey is conducted few days before the official
inflation release and most information is by then common knowledge across survey participants.
13 The result does not vary when we introduce additional regressors such as changes in expected short-term interest rates, in the bilateral

€/$ exchange rate and in oil prices as controls.

 11
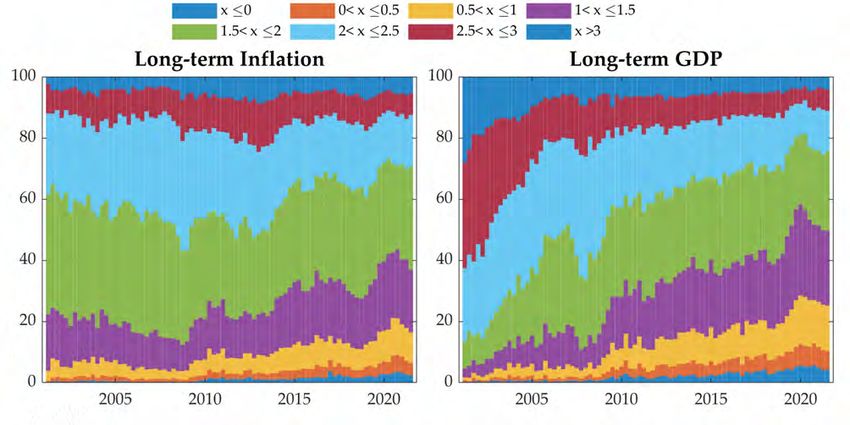
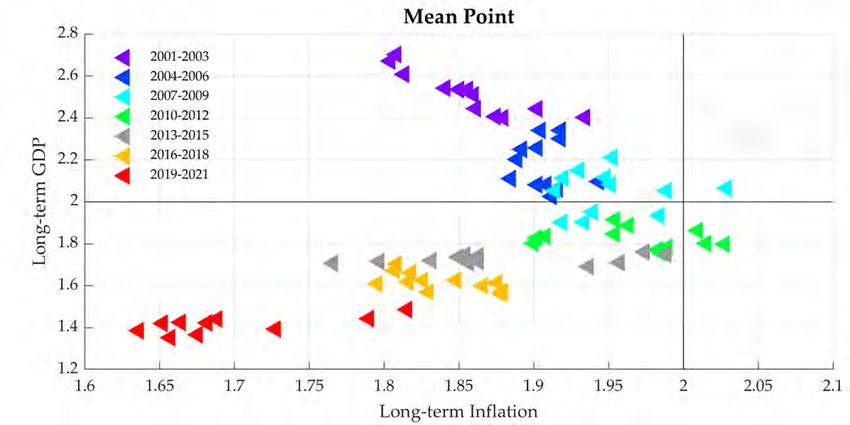
We also estimate the sensitivity of long-term inflation expectations to short-term news over
time by re-estimating the model over a rolling window of 24 quarters. In line with the time-series
evidence, we find that such sensitivity has increased significantly since 2015 (Figure 7 panels a and
b). Interestingly, while such increase is due to inexperienced forecasters, since 2019 also experienced
forecasters’ long-term expectations have become shock-de-anchored. As highlighted in CNT,
evidence of inflation de-anchoring among the more experienced forecasters raises serious concerns
regarding the credibility of the ECB in maintaining inflation at the Governing Council’s inflation aim.

5 De-anchoring in a low growth environment

The ECB SPF provides not only expectations on long-term inflation, but also on real GDP growth.
In this section, we use this information to study the joint behaviour of long-term expectations of
growth and inflation since the inception of the euro. This analysis offers important insights for
monetary policy, since the expected evolution of the growth in the long-term may influence the policy
space, through the impact on the natural rate of interest.

5.1 Long-run developments in expectations

Long-term inflation expectations (Figure 8, left panel) increased to levels close to 2 per cent in the
first decade of the monetary union and then, with the beginning of the disinflation in 2013, reached
historically low levels in late 2019. Long-term real GDP growth (Figure 8, right panel) has
persistently declined since the early 2000s, with the only exception of the period immediately before
the outbreak of the global financial crisis. Between 2002 and 2008, long-term expected growth
declined by 0.5 percentage points, on average. The global financial crisis caused a downward revision
of long-term expected growth by around 0.4 percentage points. The downward trend continued until
late 2019, when expected growth reached 1.4 per cent, followed by a stabilization thereafter. For both
growth and inflation expectations, the end-2020 levels were historically lows.
 The slow but persistent decline suggests that structural factors, such as lower total factor
productivity growth, lower business investments and adverse demographic developments, may be
responsible for the decline in long-term expected growth. The consequences of the global financial
and sovereign debt crises may have exerted further downward pressure on long-term growth.
 The joint time evolution of inflation and growth expectations is represented in Figure 9 by
means of an inflation-growth “clock”. Their developments between 2001 and 2009, with increasing
inflation expectations and declining growth expectations, suggest that SPF participants viewed long-
term prospects as driven primarily by supply-side factors. After a period of stabilisation, the
downward trend in both expectations, which began after the sovereign debt crisis, suggests that
participants switched to a view of long-term developments based on (negative) demand-side factors.
This interpretation is consistent with the evidence in Rostagno et al. (2019), who argue that the ECB’s
definition of price stability worked as a cap to long-term inflation expectations in the case of supply-
side shocks before the global financial crisis, while it offered no protection against demand-driven
disinflationary shocks after the sovereign debt crisis.

 12
The above evidence suggests the following policy considerations. An expected lower long-term
growth can lead to a lower natural rate of interest (Holston et al., 2017). 14 A low natural rate raises
the probability and duration of periods in which the policy rate is at its effective lower bound (Brandt
et al., 2018). If the central bank follows a symmetric monetary policy rule, inflation in equilibrium
will hoover at levels below the target, unless the central bank adopts non-standard measures (Coenen
et al., 2020), which are also subject to constraints. The below-target inflation is commonly referred
to as disinflationary bias. In this context, fiscal policy can support monetary policy in counteracting
the effects of recessionary shocks, and, together with structural reforms, raise potential output growth.

5.2 The risk of a low-growth low-inflation environment

In parallel with the decline in the level of expectations, the aggregate probability distributions of long-
term inflation and growth expectations have also undergone marked changes over time. 15 Figure 10
shows their time evolution (panels a and b, respectively).
 In the case of inflation expectations (left panel), the distribution changed considerably after
three main episodes: the global financial crisis, the sovereign debt crisis and the missing inflation
period (see Section 2). In 2021, about 40 per cent of the distribution lies below 1.5 per cent; the
probability of inflation below 2 is as high as 70 per cent. The pattern partially differs for the growth
distribution (Figure 10, right panel). The probabilities of the different bins have gradually declined
since the early 2000s. In the early stages of the survey, the probability of growth above 2.5 per cent
was almost 60 per cent. Then, a downward shift prevailed until the outbreak of the global financial
crisis, when the distribution changed considerably: the major change involved the probability of the
1.5-2 per cent interval, which increased at the expenses of outcomes above 2 per cent. The process of
converging to lower expected growth regained traction until the end of 2019, when the probability of
GDP growth below 2 per cent reached its maximum at 80 per cent. After the outbreak of the Covid-
19 pandemic, the probabilities of low growth outcomes (in particular of the 1-1.5 per cent bin)
marginally declined, although the overall picture still points towards an expected low-growth
environment in the long-term.
 To sum up, the probability distributions of long-term inflation and GDP growth have undergone
major changes since the early 2000s, with their mean values settling at historically low levels. A
scenario of low-inflation and low-growth represents a key challenge for the ECB’s monetary policy
in the future, as it may imply a limited policy space for both conventional and unconventional tools.

5.3 A joint assessment of the probability distribution

This section focuses on the co-movement between long-term expectations on inflation and real GDP
growth. For every round of the survey, we compute the correlation between the point forecasts of
inflation and output growth across participants.

14 In the 2013 special survey, 68 per cent of the forecasters replied that they interpret long-term forecast of real GDP growth as an
estimate of potential output growth. In the 2018 special survey, the same percentage was 93 per cent (44 per cent always, 49 sometimes).
15 In the analysis, we consider a fixed support ranging from 0 to 3%, with intervals of width equal to 0.5 p.p. and open intervals at the

two extremes. The description of the intervals can be found at the ECB webpage:
https://www.ecb.europa.eu/stats/prices/indic/forecast/shared/files/SPF_dataset_description.pdf (Annex 3).

 13
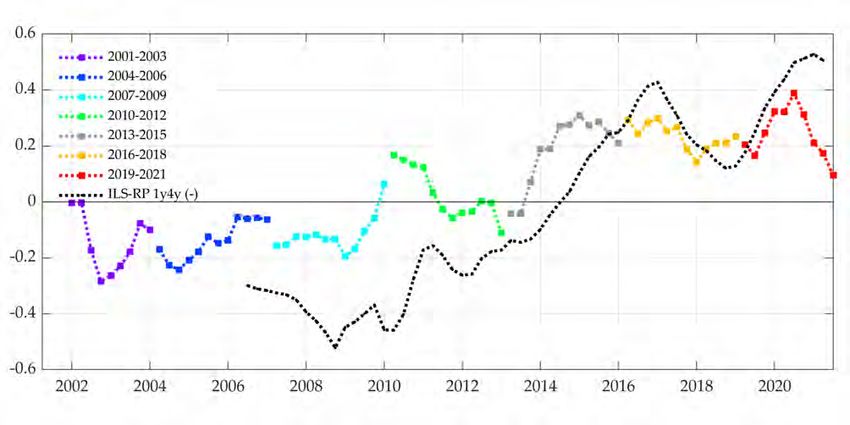
The correlation between long-term growth and inflation expectations remained negative until
the global financial crisis and turned positive (between 0.2 and 0.4) after the 2013 disinflation (Figure
11). Over time, forecasters gradually revised their long-term expectations in a way that suggests a
change in their views about the drivers of real GDP growth and inflation (Section 5.1). The change
in the correlation between inflation and growth expectations is corroborated by the change in the sign,
from positive to negative, of the inflation risk premium at a comparable horizon, estimated using a
decomposition of inflation-linked swaps. A negative risk premium indicates that investors are more
willing to pay an insurance against low inflation especially when associated to adverse economic
conditions, which is more likely in a context characterized by positive correlation between inflation
and growth in the future. The correlation between the (negative of the) inflation risk premium and the
co-movement between inflation and growth expectations is 0.8, on average.
 The low-inflation and low-growth environment arising from the SPF signals that forecasters
expect a predominance of adverse demand factors. This evidence is also in line with the findings in
Coibion et al. (2020) for Italian firms. The authors show that in a sub-sample during which the ECB’s
policy rates were constrained by the effective lower bound, Italian firms associated higher inflation
expectations with a stronger economic outlook in the short-term. On the other hand, the authors show
that households’ expectations on inflation and output growth correlate negatively, consistently with
the view that the economy is affected primarily by supply-side shocks. 16
 The evidence provided above motivates an exercise to characterize the joint aggregate density
of inflation and growth expectations, based on the time evolution of the aggregate distributions
(Figure 10) and of the correlation between the expectations, which is estimated using the cross-section
of individual point forecasts (Figure 11). Higher-order moments do not provide strong evidence
against the normality of the inflation and real GDP growth marginal distributions. These distributions
are only slightly left-skewed and displayed a modestly negative excess kurtosis that has vanished
since 2020. Hence, the assumption of a normal joint distribution does not appear too strong given the
properties of the aggregate marginal distributions, also considering the absence of information about
the joint distribution in the SPF.
 To characterize the joint density, we carry out the following simulation:
 i) for each period t (from 2001:Q1 to 2021:Q2) draw numbers from a bivariate normal
 distribution with mean zero and unitary standard deviations, and correlation , estimated
 from the cross-section;
 ii) compute the cumulative density function for each draw using the normal cdf Φ(∙);
 iii) use the inverse of the cumulative density function of the marginal distributions (obtained
 using kernel estimation) to obtain correlated draws. 17

16
 See Cecchetti et al. (2021) for a discussion of the evidence regarding households’ expectations.
17 For each t, we repeat the following steps:
 1 0 1
 a) draw from � � ~ �� � , � ��;
 2 0 1
 U Φ( 1 )
 b) calculate the standard normal cdf: � 1 � = � �;
 U2 Φ( 2 )

 14
Figure 12 shows the resulting bivariate density in six selected periods: the early years of the ECB
(2002), before and after the global financial crisis (2007 and 2010, respectively), the 2013
disinflation, late 2018, when the ECB began normalizing its monetary policy, and the Covid-19
pandemic (2020:Q2).
 The simulations allow us nicely summarising in one single chart the evidence presented in the
previous sections. Long-term inflation and growth expectations have gradually moved from the north-
west area of high growth and close to 2 per cent inflation to the south-west quadrant, with much lower
growth and well-below 2 per cent inflation.
 The evidence presented in this section bears important policy implications. The lower expected
long-term growth may be partly responsible for the decline in the natural rate in the euro area
documented in Brandt et al (2018). Indeed, considering also the effective lower bound to the ECB’s
policy rates and limits to asset purchases (either objective or self-imposed), these constraints limit the
conventional and unconventional monetary policy space. In this context, agents may question the
ability of the ECB to fulfil its mandate and gradually revise downward their inflation expectations,
further reducing the policy space for the central bank and contributing to keeping actual inflation
below the target. Fiscal policy can provide support to monetary policy in the aftermath of a deep
recession, as the one caused by the Covid-19 pandemic. At the same time, structural reforms and
fiscal measures supporting investment in R&D and infrastructure can contribute to raising potential
output growth, and thus the natural rate, eventually increasing the policy space for the central bank.

5.4 Inflation and growth expectations during the Covid-19 pandemic

In that first phase of the Covid-19 pandemic, the severe restrictions put in place by governments to
contain the diffusion of the novel coronavirus induced a halt in the supply of goods and services and
led to an unprecedented contraction in aggregate demand.
 The SPF allows us to study how forecasters assessed the implications of the pandemic for real
GDP growth and inflation expectations. Such an assessment has important implications for monetary
policy both in the short-term and in the longer-term. In the short-term, the relative importance of
demand- and supply-side effects of the pandemic may influence the effectiveness of fiscal and
monetary policies in stabilizing economic activity and inflation. In the longer-term, the relative
importance of these effects may determine the fiscal and monetary policy space, through the impact
of the Covid-19 pandemic on the natural rate of interest and potential output growth.
 Guerrieri et al. (2021) develop a theory of Keynesian supply shocks that trigger changes in
aggregate demand, rationalizing the transmission of the Covid-19 pandemic shock. Baqaee and Farhi
(2020) study how in a multi-sector new Keynesian model, inflationary supply shocks and deflationary
demand shocks emerge and propagate via input-output linkages.
 Between the January 2020 round of the SPF, when news of the virus were still scarce and
focused on China, and the April 2020 round, when several European countries locked-down their
economies, SPF forecasters revised down their point forecasts for GDP growth and inflation in 2020

 X1 −1 ( )
 c) obtain the final draws using the inverse of the cdf of the marginal distributions: � � = � 1−1 1 � .
 X2 2 ( 2 )

 15
significantly (-6.6 p.p. and -0.8 p.p., respectively, on average), indicating a recessionary shock of
unprecedented magnitude. Expectations at medium-to-long horizons were also revised but to a much
lesser extent, suggesting that forecasters interpreted the shock as having only a temporary impact on
inflation and growth, also taking into account the policy response put in place by national and
European policymakers. 18 Indeed, in terms of mean point forecasts, long-term expectations were only
marginally revised: long-term growth expectations have been hovering around 1.4 per cent since 2019
and long-term inflation expectations declined by 0.1 p.p. per cent only in the July round of the SPF.
 The correlation between long-term inflation and real GDP growth expectations discussed in
Section 5.3 reached its maximum value in 2020:Q2, consistently with forecasters’ interpretation of
the Covid-19 shock as exerting its initial impact on the economy more through the demand side than
through the supply side (Figure 11). In the first half of 2021, the progress in the vaccination campaigns
and the gradual removal of the containment measures, bolstered aggregate demand and improved the
forecasts for both economic activity and inflation in the medium-term. At the same time, persisting
disruptions in supply-chains and the shortage of raw materials continued restraining aggregate
supply. 19 A rebalancing of the relative importance between supply- and demand-side factors towards
the former may have led to a decrease in the correlation between long-term inflation and GDP real
growth expectations, which fell to the levels that prevailed in late-2013.

6 Conclusions and policy implications

 Long-term inflation expectations play a key role, as they provide a measure of the credibility
of the central bank. Moreover, well-anchored expectations preserve the effectiveness of monetary
policy.
 Both time series and panel methods confirm the previous findings (e.g. Corsello, Neri and
Tagliabracci, 2021) that long-term inflation expectations have become de-anchored since the 2013
disinflation. In a low-growth environment (where the natural rate of interest is structurally low; see
Brand et al., 2018) de-anchored inflation expectations increase the risk that the policy rates may hit
their effective lower bound more frequently, causing the economy to remain stuck in a low inflation-
low inflation expectations-low growth environment. So far, the preliminary evidence conveyed by
the SPF about the impact of the Covid-19 pandemic on inflation expectations seems to suggest that
the response of monetary, fiscal and micro- and macro-prudential authorities in the euro area has
helped to prevent a further de-anchoring of long-term inflation expectations.
 The ongoing review of the ECB’s monetary policy strategy is an opportunity to acknowledge
the risks posed by an environment characterized by a low natural rate and the presence of the ELB,
in which it would be beneficial to improve the anchoring of long-term inflation expectations by
adopting a clear and precisely defined symmetric inflation target.

18
 Expectations for GDP growth were revised downward by 3.9 pp 1-year ahead and by 1.6 pp upward 2-year ahead; for
HICP inflation they were revised by 0.3 downward 1- year ahead and were not revised at 2 years’ horizon.
19
 For instance, the Financial Times titled on 24 February 2021 “Europe’s factories raise goods prices as supply
bottlenecks bite” to document that shortages of materials and soaring shipping costs have disrupted supply chains and
manufacturers are passing higher input cost to their customers, raising concerns for potential inflation pressures.
See: https://www.ft.com/content/7aef28eb-ce0c-49a4-b7cc-06d89478c44c.

 16
References

Bai, J. (2010). “Common breaks in means and variances for panel data”. Journal of Econometrics
157, 78-92.

Bai, J. and P. Perron (2003). “Computation and analysis of multiple structural change models”,
Journal of Applied Econometrics 18, 1-22.

Ball, L. and S. Mazumder (2011). “Inflation dynamics and the Great Recession”, Brookings Papers
on Economic Activity 42, 337-405.

Baqaee, D. and E. Farhi (2020). “Supply and Demand in Disaggregated Keynesian Economies with
an Application to the Covid-19 Crisis”, NBER Working paper 27152.

Bianchi, F., L. Melosi and M. Rottner (2019). “Hitting the elusive inflation target”, Centre for
Economic Policy Research Discussion paper 14161.

Brandt, C., M. Bielecki and A. Penalver (2018). “The natural rate of interest: estimates, drivers, and
challenges to monetary policy”, European Central Bank Occasional paper 217.

Bulligan, G. (2018). “The effect of the Eurosystem expanded Asset Purchase Programme on inflation
expectations: evidence from the ECB Survey of Professional Forecasters”, Banca d’Italia Occasional
paper 455.

Cecchetti, S., D. Fantino, A. Notarpietro, M. Riggi, A. Tagliabracci, A. Tiseno and R. Zizza (2021).
“Inflation expectations in the euro area: indicators, analyses and models used at Banca d’Italia”,
Banca d’Italia Occasional paper 612.

Coibion, O., Y. Gorodnichenko and T. Ropele (2020). “Inflation Expectations and Firm Decisions:
New Causal Evidence”, The Quarterly Journal of Economics 135, 165-219.

Coibion, O., Y. Gorodnichenko, S. Kumar and M. Pedemonte (2020). “Inflation expectations as a
policy tool?”, Journal of International Economics 124, 103297.

Coenen, G., C. Montes-Galdón and F. Smets (2020). “Effects of state-dependent forward guidance,
large-scale asset purchases and fiscal stimulus in a low-interest-rate environment”, European Central
Bank Working paper 2352.

Corsello, F., A. Tagliabracci and S. Neri (2021). “Anchored or de-anchored? That is the question”,
European Journal of Political Economy. https://doi.org/10.1016/j.ejpoleco.2021.102031

García, J. A. (2003). “An introduction to the ECB’s Survey of Professional Forecasters”, European
Central Bank Occasional paper 8.

Guerrieri, V., G. Lorenzoni, L. Straub and I. Werning (2020). “Macroeconomic Implications of
COVID-19: Can Negative Supply Shocks Cause Demand Shortages?”, National Bureau of Economic
Research Working paper 26918.

Holston, K., T. Laubach and J. C. Williams (2017). “Measuring the natural rate of interest:
International trends and determinants”, Journal of International Economics 108, S59-S75.

 17
Lane, P. R. (2020). “Monetary policy, low interest rates and low inflation”, dinner remarks at the
Centre for European Reform.
available at https://www.ecb.europa.eu/press/key/date/2020/html/ecb.sp200227_3~949cf2d793.en.html.

Lane, P. R. (2021). “Inflation dynamics during a pandemic”, blog post by Philip R. Lane, Member of
the Executive Board of the ECB.
available at https://www.ecb.europa.eu/press/blog/date/2021/html/ecb.blog210401~6407b23d87.en.html

Łyziak, T. and M. Paloviita (2017). “Anchoring of inflation expectations in the euro area: Recent
evidence based on survey data”, European Journal of Political Economy 46, 52-73.

Naggert, K., R. W. Rich and J. Tracy (2021). “Flexible Average Inflation Targeting and Inflation
Expectations: A Look at the Reaction by Professional Forecasters”, Federal Reserve Bank of
Cleveland, Economic Commentary 9.
Rostagno, M., C. Altavilla, G. Carboni, W. Lemke, R. Motto, A. Saint Guilhem and J. Yiangou
(2019). “A tale of two decades: the ECB’s monetary policy at 20”, European Central Bank Working
paper 2346.

 18
Figures and tables

 Figure 1. Market-based indicators of inflation expectations: United States and euro area
 4.0 0.8

 3.5 United States Euro area difference 0.7

 3.0 0.6

 2.5 0.5

 2.0 0.4

 1.5 0.3

 1.0 0.2

 0.5 0.1

 0.0 0.0
 01/2010 01/2011 01/2012 01/2013 01/2014 01/2015 01/2016 01/2017 01/2018 01/2019 01/2020 01/2021

 Source: Reuters.

 Figure 2. Long-term survey-based inflation expectations
 Panel a) Panel b)
2.1 2.1 2.1 2.1

2.0 2.0 2.0 2.0

1.9 1.9 1.9 1.9

1.8 1.8 1.8 1.8

1.7 1.7 1.7 1.7

1.6 1.6 1.6 1.6

1.5 1.5 1.5 1.5
 2002 2005 2008 2011 2014 2017 2020 2018 2019 2020

 Mean point Median point Mean point Median point

 Mean aggregate pdf Mean aggregate pdf

 Source: ECB’s Survey of Professional Forecasters.
 Note: the long-term corresponds to roughly five years; thus, expectations refer to one-year four-year ahead inflation.

 19
Figure 3. Probability distribution of long-term inflation expectations
 Panel a) Panel b)

100% 100%

90% 90%

80% 80%

70% 70%
60% 60%
50% 50%
40% 40%
30% 30%
20% 20%
10% 10%
 0%
 0%
 2002 2004 2006 2008 2010 2012 2014 2016 2018 2020
 2018 2019 2020
 3.5

 Source: ECB’s Survey of Professional Forecasters.

 20
Figure 4. Level shifts of long-term inflation expectations

 mean point median point mean aggregate pdf
2.20 2.20 2.20 2.20 2.20 2.20

2.10 2.10 2.10 2.10 2.10 2.10

2.00 2.00 2.00 2.00 2.00 2.00

1.90 1.90 1.90 1.90 1.90 1.90

1.80 1.80 1.80 1.80 1.80 1.80

1.70 1.70 1.70 1.70 1.70 1.70

1.60 1.60 1.60 1.60 1.60 1.60

1.50 1.50 1.50 1.50 1.50 1.50

1.40 1.40 1.40 1.40 1.40 1.40
 2001
 2003
 2005
 2007
 2009
 2011
 2013
 2015
 2017
 2019
 2021

 2001
 2003
 2005
 2007
 2009
 2011
 2013
 2015
 2017
 2019
 2021

 2001
 2003
 2005
 2007
 2009
 2011
 2013
 2015
 2017
 2019
 2021
 Source: ECB’s Survey of Professional Forecasters.
 Note: the Bai and Perron (2003) procedure is calibrated to allow for a maximum of 5 structural breaks, each of a minimal
 length of 8 quarters. Sample period: 2002:2 – 2021:2.

 Figure 5. Break in mean level: panel approach

 2.10 2.10

 2.05 2.05

 2.00 2.00

 1.95 1.95

 1.90 1.90

 1.85 1.85

 1.80 1.80

 1.75 1.75
 95% confidence band estimated mean level
 1.70 1.70
 aggregate mean
 1.65 1.65

 1.60 1.60
 2002 2004 2006 2008 2010 2012 2014 2016 2018 2020

 Note: blue line: mean (across forecasters) of individual 5-year ahead point forecasts. Red solid line:
 estimated intercept of model 1 according to estimated break dates (2008:Q4; 2014:Q1 and 2019:Q3).
 Red dotted line: 95% confidence bands.

 21
Figure 6. Sensitivity of long-term inflation expectations
 to negative inflation surprises – time series approach

 mean point median point mean aggregate pdf
 0.7 0.7 0.7 0.7 0.7 0.7

 0.6 0.6 0.6 0.6 0.6 0.6

 0.5 0.5 0.5 0.5 0.5 0.5

 0.4 0.4 0.4 0.4 0.4 0.4

 0.3 0.3 0.3 0.3 0.3 0.3

 0.2 0.2 0.2 0.2 0.2 0.2

 0.1 0.1 0.1 0.1 0.1 0.1

 0.0 0.0 0.0 0.0 0.0 0.0

-0.1 -0.1 -0.1 -0.1 -0.1 -0.1

-0.2 -0.2 -0.2 -0.2 -0.2 -0.2

-0.3 -0.3 -0.3 -0.3 -0.3 -0.3
 2008
 2009
 2010
 2011
 2012
 2013
 2014
 2015
 2016
 2017
 2018
 2019
 2020
 2021

 2008
 2009
 2010
 2011
 2012
 2013
 2014
 2015
 2016
 2017
 2018
 2019
 2020
 2021

 2008
 2009
 2010
 2011
 2012
 2013
 2014
 2015
 2016
 2017
 2018
 2019
 2020
 2021
Note: blue line: estimated coefficient. Red dotted line: 95% confidence bands. The horizontal axis reports the end of
each rolling sample.

 22
Figure 7: Sensitivity of long-term expectations to inflation news – panel approach

 Panel a
 All Inexperienced Experienced

0.30 0.30 0.30 0.30 0.30 0.30

0.25 0.25 0.25 0.25 0.25 0.25

0.20 0.20 0.20 0.20 0.20 0.20

0.15 0.15 0.15 0.15 0.15 0.15

0.10 0.10 0.10 0.10 0.10 0.10

0.05 0.05 0.05 0.05 0.05 0.05

0.00 0.00 0.00 0.00 0.00 0.00

-0.05 -0.05 -0.05 -0.05 -0.05 -0.05

-0.10 -0.10 -0.10 -0.10 -0.10 -0.10
 2008
 2009
 2010
 2011
 2012
 2013
 2014
 2015
 2016
 2017
 2018
 2019
 2020
 2021

 2008
 2009
 2010
 2011
 2012
 2013
 2014
 2015
 2016
 2017
 2018
 2019
 2020
 2021

 2008
 2009
 2010
 2011
 2012
 2013
 2014
 2015
 2016
 2017
 2018
 2019
 2020
 2021
 Note: short-term inflation news are defined as the Bloomberg short-term inflation surprises, St. Rolling window.
 Starting sample is 2002:Q1-2008:Q1. In all graphs, the date refers to the last observation of the sample. Red solid
 line: estimated coefficient on inflation news; red dashed line: 2-standard deviation confidence bands. Experienced
 forecasters are those who have participated in at least 60 rounds of the SPF.

 Panel b
 All Inexperienced Experienced

0.30 0.30 0.30 0.30 0.30 0.30

0.25 0.25 0.25 0.25 0.25 0.25

0.20 0.20 0.20 0.20 0.20 0.20

0.15 0.15 0.15 0.15 0.15 0.15

0.10 0.10 0.10 0.10 0.10 0.10

0.05 0.05 0.05 0.05 0.05 0.05

0.00 0.00 0.00 0.00 0.00 0.00

-0.05 -0.05 -0.05 -0.05 -0.05 -0.05

-0.10 -0.10 -0.10 -0.10 -0.10 -0.10
 2008
 2009
 2010
 2011
 2012
 2013
 2014
 2015
 2016
 2017
 2018
 2019
 2020
 2021

 2008
 2009
 2010
 2011
 2012
 2013
 2014
 2015
 2016
 2017
 2018
 2019
 2020
 2021

 2008
 2009
 2010
 2011
 2012
 2013
 2014
 2015
 2016
 2017
 2018
 2019
 2020
 2021

 1
 Note: short-term inflation news are defined as revisions of 1-year ahead SPF inflation forecasts, . Rolling
 window. Starting sample is 2002:Q1-2008:Q1. In all graphs, the date refers to the last observation of the sample.
 Red solid line: estimated coefficient on inflation news; red dashed line: 2-standard deviation confidence bands.
 Experienced forecasters are those who have participated in at least 60 rounds of the SPF.

 23
Figure 8. Real GDP growth and inflation expectations in the long-term

Source: our computations based on the ECB’s Survey of Professional Forecasters. Note: long-term corresponds
to roughly five years. The mean of the aggregate probability distribution is obtained by aggregating forecasters’
individual distributions and computing the mean.

 Figure 9. The GDP growth and inflation expectations “clock”

 Source: ECB’s Survey of Professional Forecasters.

 24
You can also read