Identify Hidden Spreaders of Pandemic over Contact Tracing Networks
←
→
Page content transcription
If your browser does not render page correctly, please read the page content below
Identify Hidden Spreaders of Pandemic over Contact Tracing Networks

 Shuhong Huang,1, ∗ Jiachen Sun,2, ∗ Ling Feng,3, 4 Jiarong Xie,5 Dashun Wang,6 and Yanqing Hu5, †
 1
 Institute of Neuroscience, Technical University of Munich, Munich 80802, Germany
 2
 MIT Center for Collective Intelligence, Cambridge 02142, MA, USA
 3
 Institute of High Performance Computing, A*STAR, 138632 Singapore
 4
 Department of Physics, National University of Singapore, Singapore 117551
 5
 School of Data and Computer Science, Sun Yat-sen University, Guangzhou 510006, China
 6
 Kellogg School of Management, Northwestern University, Evanston, IL, USA
 (Dated: March 18, 2021)
arXiv:2103.09390v1 [physics.soc-ph] 17 Mar 2021

 The COVID-19 infection cases have surged globally, causing devastations to both the society and econ-
 omy. A key factor contributing to the sustained spreading is the presence of a large number of asymp-
 tomatic or hidden spreaders, who mix among the susceptible population without being detected or quar-
 antined. Here we propose an effective non-pharmacological intervention method of detecting the asymp-
 tomatic spreaders in contact-tracing networks, and validated it on the empirical COVID-19 spreading
 network in Singapore. We find that using pure physical spreading equations, the hidden spreaders of
 COVID-19 can be identified with remarkable accuracy. Specifically, based on the unique characteristics
 of COVID-19 spreading dynamics, we propose a computational framework capturing the transition prob-
 abilities among different infectious states in a network, and extend it to an efficient algorithm to identify
 asymptotic individuals. Our simulation results indicate that a screening method using our prediction
 outperforms machine learning algorithms, e.g. graph neural networks, that are designed as baselines in
 this work, as well as random screening of infection’s closest contacts widely used by China in its early
 outbreak. Furthermore, our method provides high precision even with incomplete information of the
 contract-tracing networks. Our work can be of critical importance to the non-pharmacological inter-
 ventions of COVID-19, especially with increasing adoptions of contact tracing measures using various
 new technologies. Beyond COVID-19, our framework can be useful for other epidemic diseases that also
 feature asymptomatic spreading.

 As the COVID-19 pandemic continues to spread at rapid challenge in the effective mitigation of the pandemic spread-
 rates [1–3], and the development of effective pharmacolog- ing. Furthermore, empirical studies have shown that such
 ical treatments is still uncertain according to WHO, non- asymptomatic infections accounts for a large proportion of the
 pharmacological interventions like isolation of the infectious population [12–18], as much as up to 80% [18]. Currently,
 through quarantines [4, 5] are the most effective and possi- estimation of the asymptomatic cases is done through exhaus-
 bly the only means of containing the continued outbreaks, as tive screening of close contacts of the known infected cases in
 it effectively reduces the person to person transmissions [6]. the contact tracing networks [17]. This untargeted method re-
 Yet, unlike other infectious diseases like SARS and Ebola, quires large amount of resources and is time consuming, that
 COVID-19 is unique in that a large portion of its infected pop- in turn leads to ineffective or delayed interventions to quar-
 ulation is mild or asymptotic [7]. Even some of the asymp- antine the asymptomatic cases. Hence, a targeted screening
 totic infections do not exhibit any clinic symptoms until self- in the contact tracing network is pertinent, such that asymp-
 recovery [8, 9]. Without being detected and subsequently tomatic individuals can be estimated with high precision for
 quarantined, the asymptomatic population (i.e. hidden spread- intervention and spreading mitigation.
 ers) sustains the ongoing spreading of the disease to the sus-
 ceptible population unknowingly [10, 11]. This poses a major Here we incorporate the empirical characteristics of the
 COVID-19 spreading dynamics into a Markovian process, i.e.
 vectors that represent the different infection stages and their
 ∗ These two authors contributed equally associated transition probabilities. By embedding the transi-
 † huyanq@mail.sysu.edu.cn tion process into a contact tracing network that includes the
2

known infected nodes (individuals), we develop a method that asymptomatic patients who carry the virus but have never
predicts the infectious states of the rest of the network with exhibited any symptoms until recovery. As a result, an in-
high precision. By combining such predictions with the net- dividual can have a total of 5 different states in the process of
work structure, we then derive the spreading power of every COVID-19 spreading (see Fig. 1a), namely, Susceptible (S),
node taking into account of both its infectious state and its Presymptomatic (P ), Asymptomatic (A), Symptomatic Infec-
specific location in the network, such that screening of the tious (I) and Recovered (R). Since the infectious duration in
asymptomatic can be prioritised accordingly. The effective- the states of P , I and A follows a specific probability dis-
ness of our method is validated by empirical data from two tribution, here we further break down the P, I and A states
COVID-19 transmission networks in Singapore. Moreover, in into finer states representing the progression in each of the 3
the simulated COVID-19 transmission experiment of contact- states, i.e., the number of days passed since the beginning of
tracing network, we find that a screening scheme designed by the states. For better clarity, we denote t as the number of days
the proposed computational framework outperforms several of the COVID-19 evolution on the entire network and d as the
machine-learning baselines designed in this work and the ran- number of days in a particular infected state for a particular
dom screening of infection neighbors. The latter was widely individual. Since an individual i can be at any stage in the
used in early COVID-19 outbreaks in China. Furthermore, process, we can use Zi (t) to represent the state probabilities
even in the realistic situation of incomplete information on the at time t:
contact tracing network, with missing links or sub networks
 Zi (t) =(Si (t), Pi1 (t), ..., Pid (t), ..., Ii1 (t), ...,
consisting of only contacts of the infected cases, our method (1)
 Iid (t), ..., A1i (t), ..., Adi (t), ..., Ri (t))
retains high accuracy. Thus our method is highly effective in
asymptomatic case estimation and can be implemented to any where Si (t) and Ri (t) is the probability that the individual i is
contact-tracing networks either constructed manually [19] or susceptible and recovered at day t, respectively. Pid (t), Iid (t)
through technological means [20] such as Bluetooth [21, 22], and Adi (t) are the probabilities that i is in the state of P , I
GPS [23] and digital check-in check-out technologies (e.g. and A for d days at the time of t. Since all of asymptomatic,
health QR codes [24] widely used in China). presymptomatic and symptomatic states are infected states,
 their total probability corresponds to that of a node is infec-
 tious, and we use Ci (t) to represent it:
 I. RESULTS
 Ci (t) = Pi (t) + Ii (t) + Ai (t) (2)

 Given the spreading of the COVID-19 occurring over the P∞ P∞
 where Pi (t) = d=1 Pid (t), Ii (t) = d=1 Iid (t), Ai (t) =
contact network, the challenge is to identify asymptomatic P∞ d
 d=1 Ai (t). Throughout this work we use Ci (t) as a key
nodes with the information of infected symptomatic individ- indicator to infer whether an individual is infected .
uals (nodes) that have been identified from a certain time T . From here, we can extract the probability transition dynam-
We approach this by estimating the probability of each node ics among the 5 different states as follows. First, for a node
being in the infected state as illustrated in Fig. 1. Specif- who is in the susceptible state S at t, its next state at t + 1
ically, we first construct the transition dynamical equations will be jointly determined by the state of its neighbors in the
among different infection stages and states based on the em- network at t. Specifically, the probability of a node i in S
pirically observation of COVID-19 disease progression. The state remains in S on day t + 1 (i.e., not infected by any of its
set of transition equations is then combined with the contact infected neighbor on the next day) is:
network topology and data on the observed infection history Y
to deduce the state of each node in the network. Si (t + 1) = Si (t) · (1 − F(t, j, β)) (3)
 j∈∂i
 As observed in many clinical studies, the hidden spread-
ers of COVID-19 fall into two different categories. One is where ∂i represents the set of neighbors (contacts) of i in the
the presymptomatic infections who are asymptomatic and in- network, F(t, j, β) represents the probability that i is infected
fected, but will later develop clinical symptoms (e.g. fever, by j. This can only happen if j is in the infected state on day t
cough, dyspnea, etc.); The other type corresponds to the (probability Cj (t)), and happens to transmit it to i (probability
3

β). Then we have: probability that the individual i is in the state of R at the time
 t + 1 is:
 F(t, j, β) = Cj (t) · β (4)
 ∞
 X FA (d) − FA (d − 1)
 Ri (t + 1) =Ri (t) + Adi ·
Here β can be estimated from the empirically observed dis- 1 − FA (d − 1)
 d=1
ease reproduction number R0 for COVID-19 and the aver- ∞
 (9)
 X FI (d) − FI (d − 1)
age number of neighbors in the contact tracing network hki. + Iid ·
 1 − FI (d − 1)
 R0 d=1
Specificaly, β = λhki , where λ is the average time a suscep-
tible person carries the virus, which can be expressed as λ = To validate our mathematical framework, we test it on
 σ2
p·µA +(1−p)·(exp(µP + 2P )+µI ), where p is the proportion a real contact-tracing network in the Infectious Stay Away
 σ2
of asymptomatic infected cases, µA , exp(µP + 2P ), µI are the exhibition[27] (ISA network, see Sec. SI 1 for data detailed
average time of the virus carried by infected individuals in A, description) with 410 individuals and average degree hki of
P and I states [25, 26] respectively. 13 (more experiments on another social network are illus-
 Next, for an individual under S state at time t, the probabil- trated in Sec. SI 5). We simulate the spreading with the em-
ity of becoming presymptomatic state P at t + 1 is: pirically observed parameters on COVID-19 spreading mech-
 Y anisms [25] (see Methods for the simulation details). From
 Pi1 (t + 1) = Si (t) · (1 − p) · (1 − (1 − F(t, j, β)) (5)
 repeated simulations, we then obtain the probability of every
 j∈∂i
 possible state of a node, and compare this baseline with the
Accordingly, we can calculate the probability that the state of theoretical results from Eqns. 3-9. Here we set the dimen-
i become A at t + 1 as: sion of Z to 77 according to the empirical temporal distribu-
 Y tions of the infected states [25, 26] (see Method for detail).
 A1i (t + 1) = Si (t) · p · (1 − (1 − F(t, j, β)) (6)
 j∈∂i From Fig. 2a and b, we can see that our theoretical result on
 the temporal evolutions of the disease in the whole network is
In the third case where a node i is in the infected state (i.e. E,
 well validated by the simulations. These show that our tran-
I or A, d ≥ 1) on day t, the transition probabilities that they
 sition probability framework is accurate in producing the real
will stay in the same state on day t + 1 are:
 spreading dynamics.
 1 − FP (d) Now we extend the proposed transition probability equa-
 Pid+1 (t + 1) = Pid (t) · ( )
 1 − FP (d − 1) tions to identify nodes with high risk of being asymptomatic,
 1 − FI (d)
 Iid+1 (t + 1) = Iid (t) · ( ) (7) assuming the infection history on symptomatic nodes is al-
 1 − FI (d − 1)
 ready known. The underlying principle is to update every
 1 − FA (d)
 Ad+1
 i (t + 1) = Adi (t) · ( ) node’s state by incorporating the information of known infec-
 1 − FA (d − 1)
 tion into Eqns.(2-9) in the subsequent days, and then deduce
 Rd Rd
where FP (d) = −∞ fP (t)dt, FI (d) = −∞ fI (t)dt, FA (d) the infection probability Ci (T ) for each node i in the net-
 Rd
= −∞ fA (t)dt are the cumulative distribution functions of work (see the details in the Method). The nodes with higher
duration length d for P, I, A states, respectively. For mathe- Ci (T ) are identified as having high risk of being infected at
matical convince, we simply set FP (0) = FI (0) = FA (0) = day T . We test the effectiveness by applying it on two sets of
0. The fourth case is that individual in the presymptomatic real COVID-19 spreading data on the contact-tracing network
state P turns into the symptomatic infectious state I at the in Singapore [19] (see Fig. 2c and d). The details of network
next day, and can be described with the following transition is provided in Method and in Sec. SI 1. We find that the
probability: ranking our Ci (T ) values are highly correlated with the date
 ∞ of infection t of nodes (Fig. 2e and f), meaning nodes with
 X FP (d) − FP (d − 1)
 Ii1 = Pid · (8) higher infection probabilities indeed have higher risk of being
 1 − FP (d − 1)
 d=1 infected in the real COVID-19 spreading data.
In the fifth case, an individual in the state I or the state A has The Singapore empirical datasets have the constraint of
a certain probability of being recovered i.e, turning into the R merely including the symptomatic individuals’ identities in
state on the next day. From the above equation, we obtain the the network. Therefore, to further evaluate our method, we
4

simulate a realistic COVID-19 spreading process on the ISA that the dynamic screening method on the various scenarios
network for T days to obtain the detailed infection history can still reliably identify the infected nodes in terms of accu-
of every node in the network, such that the exact infection racy and recall rate, as shown in Fig. 3e-h (see the robustness
history on the asymptomatic nodes can be obtained. Assum- result on the static screening method in SI Figures 14-17).
ing only the symptomatic nodes with state I are observed, Lastly, we study the effectiveness of our method in con-
we use our above method to identify those infected individ- taining the overall spread of COVID-19. In the widespread of
uals among the rest of the nodes. Specifically, we select the COVID-19, limited resource on screening constrains the num-
nodes with the highest Ci (T ) values as the mostly likely in- ber of individuals the government can screen in a given day.
fected nodes. To our best knowledge, there is few prior works Hence, targeted screening and mitigation can have significant
for estimating asymptomatic nodes in the network. Therefore, impact on ‘flattening the curve’ of daily infected cases. To
we also design several screening baselines based on the popu- study such effect, we again simulate the COVID-19 spread-
lar graph neural networks methods including Node2Vec [38], ing on the ISA network [27], and start screening/testing from
graph convolutional network [39] and graph attention net- day 10 using our method (i.e. ‘neighbor containment’). Each
works [40] to further compare our results. (Detailed method- day 2% (4% in SI Figure 20) of the whole network are tested
ologies for those methods in Sec. SI 3). for the disease, and the positive ones are immediately quaran-
 The simulations results show that our transition probabilis- tined, corresponding a transition to the state R (see details of
tic method (i.e. static screening) significantly outperforms the the containment strategy in Sec. SI 4). As shown in Fig. 4a-e,
other methods in terms of the accuracy and recall on the local our method is highly effective in suppressing the daily infec-
network where one can only observe the nearest neighbors of tion cases and total infection cases, outperforming both the
the known nodes in states I (see SI Figure 1). Such advan- baseline strategy of only quarantining the infected ones (la-
tage is still evident when we consider the alternative scenario beled as ‘infection containment’) and the strategy randomly
that one can observe the full network structure [21, 22] (see screening 2%N among the neighbors of the known infections
SI Figure 3), and the intermediate scenario when only near- (labelled as ‘neighbor containment’), where N is the network
est and second nearest neighbors are known in the network size. In addition, we find that even with up to 80% missing
(see SI Figure 2). In a more realistic setting, the screen- links, our method is still robust enough to effectively suppress
ing of the contact tracing network happens continuously in the spreading, close to that of knowing the full network struc-
time. Here one can update the set of known infected nodes ture. It shows that our method is expected to be highly effec-
after every screening, and subsequently update the infected tive in containing COVID-19 spread in practice.
risk for the rest of the network from time to time. There-
fore, we develop a dynamic screening method by updating the
evaluation of Ci (t) every time a new infected node is found II. CONCLUSION
through selective screening of the network (see the details in
the Method Section). This dynamic screening method outper- In this paper, based on the transmission rule of COVID-19
forms (see Fig. 3a-d) other screening methods and even our and the underlying physical spreading equations, we for the
previous static screening method (see Fig. 3d inset), imply- first time studied the estimation of asymptomatic infections
ing that such dynamic screening method is highly effective in in the contact-tracing network, which is a current major con-
identifying infected nodes by screening less people. cern in the prevention and containment of COVID-19 world-
 Very often, the contact tracing network collected through wide. We provided a complete computational framework of
either manual survey or digital tracking is at best incomplete, inferring latent infection on contact network. Based on this,
such that it is important to have a screening method that is we proposed a feasible method for optimal detection of la-
still robust when there is missing information on the network tent infection in combination with nodal transmission ability
structure. To test such robustness of our method, we randomly in the network. We show that the COVID-19 transmission
remove up to 80% of the edges in the ISA network, and test the can be broken in a timely and efficient manner by the pro-
accuracy of the method based on the remaining network (see posed method, which outperforms the direct contact screen-
the results on another network in SI Figures 14-19). We find ing, a typical method widely used in China. In addition, our
5

simulation on a real contact network demonstrated that, this asymptotic infection ratio p = 15% on our equations to simu-
method is robust even with incomplete network information, late the spreading. The set of values are listed in Table. 1(see
demonstrating its effectiveness in practical scenarios. We be- Sec. SI 1 for the detail description of parameters and Sec. SI
lieve that the theory and the corresponding methods in iden- 3 for the discussion of the parameter sensitivity). Each sim-
tifying COVID-19 hidden spreaders are of great practical sig- ulation corresponds to one realization of the actual spreading
nificance. In principle, it provides policymakers and front-line based on the realistic dynamics, and the actual states of each
workers in COVID-19 with important and effective guidance node at every time step can be captured. More details of the
and tools that could be deployed swiftly to fight COVID-19, simulation of COVID-19 are provided in Sec. SI 2.
and save billions of people around the world who are still Identifying infection probability Ci (T ). The goal is to
suffering as the epidemic continues to spread throughout the identify nodes with high risk of being asymptomatic with in-
world. fection history on known symptomatic nodes, and we extend
 our transition probability equations to study this problem. At
 a certain time T , given the set I of infected individuals, the
 first day of infection sj and the day of recovery rj for each
 METHOD
 individual j ∈ I, we aim to develop a method from Eqns. 2-
 10 to deduce the infection probability Ci (T ) for each node
 Singapore COVID-19 datasets. The data was collected by
 i in the network. Note that the day of recovery can also be
the Singapore government [19], and contains comprehensive
 the day of death or quarantine. The initial condition at t = 0
records on the dates of showing symptoms and confirming the
 is that every node in the network is in susceptible state, i.e.
disease, as well as their contact networks. We pick the in-
 Zi (0) = {1, 0, · · · , 0}. The day of first infection in the net-
fected nodes from the first two different time points, and set
 work is set to 1, i.e. minj∈I sj = 1, and we update every
T to January 26, 2020 and February 19, 2020 for Singapore A
 node’s state in the subsequent days depending on whether
and Singapore B, respectively. Then based on the known in-
 their infection history is known at time T . For the known
fection history of the nodes, our transition probability method
 nodes j ∈ I, we artificially assign their infection states ac-
estimates the infection probabilities Ci (T ) of every other node
 cording to the known information, meaning that j is assigned
in the networks.
 state S when t < sj , state R when t > rj , and infectious state
 The dimension of the state vector Zi (t). The dimension when sj < t < rj . For the other nodes, we evaluate their
of the state vector Zi (t) corresponds to the total number of sub state vector Zi (t) at every time step t according to the transi-
states possible during the various disease progression paths, tion probabilities in Eqns. 2-9, until the final day T , such that
i.e., the number of days that an individual can be in each of their probabilities Ci (T ) of being infected can be evaluated
the 3 different infected states. From the empirical temporal from Zi (T ).
distributions of the infected states [25, 26] (Tab. 1), we use Dynamic screening method. Every time we screen only
3 standard deviations [41] as cut off on the max number of node k that is of highest risk according to the algorithm; if
days in states P, I, A, which are 20, 20, 35 days, yielding a node k is COVID-19 positive, it is added to the known in-
dimension of 77 for Z. (S and R states have no sub states). fected nodes set I, and its neighbors are added to the unknown
 COVID-19 spreading simulation. At the starting time set, and we repeat the transition probability calculations ac-
T = 0, we select the 3 nodes with the largest degree in the cording to Eqns. 2-10 from time 0 < t ≤ T ; if k is negative,
network as initial infected nodes, whose infected states are de- its probability state vector is set to be Zk (t) = {1, 0, · · · , 0}
termined as either Asymptomatic or Presymptomatic accord- in the calculation of Eqns. 2-10. Next, the revised estima-
ing to the parameter p of Tab. 1. Then we apply the em- tions of infection probabilities for each unknown node from
pirically observed parameters on COVID-19 spreading mech- Eqns. 2-10 tells us which node is the most risky and to be
anisms [25] including reproductive number R0 = 3.50 and tested.

 [1] David S Hui, Esam I Azhar, Tariq A Madani, Francine Ntoumi, Mchugh, Ziad A Memish, Christian Drosten, et al. The continu-
 Richard Kock, Osman Dar, Giuseppe Ippolito, Timothy D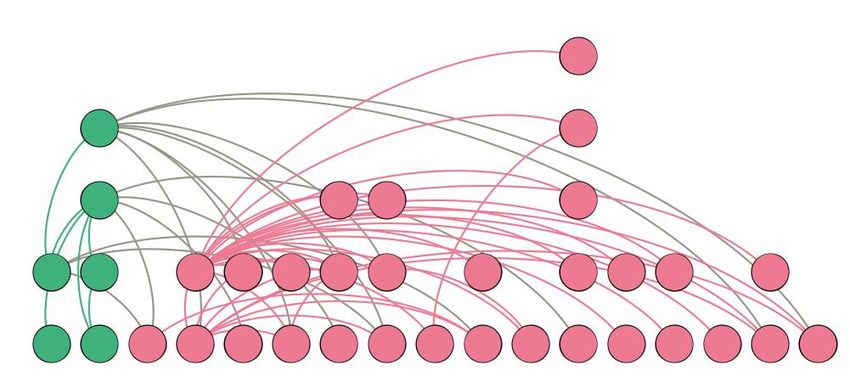
6

 ing 2019-ncov epidemic threat of novel coronaviruses to global et al. Effectiveness of airport screening at detecting travellers
 health–the latest 2019 novel coronavirus outbreak in wuhan, infected with novel coronavirus (2019-ncov). Eurosurveillance,
 china. International Journal of Infectious Diseases, 91:264– 25(5):2000080, 2020.
 266, 2020. [13] Oyungerel Byambasuren, Magnolia Cardona, Katy Bell, Justin
 [2] Scudellari Megan. How the pandemic might play out in 2021 Clark, Mary-Louise McLaws, and Paul Glasziou. Estimating
 and beyond. Nature, 2020. the extent of true asymptomatic covid-19 and its potential for
 [3] World Health Organization et al. Who director-general’s open- community transmission: systematic review and meta-analysis.
 ing remarks at the media briefing on covid-19-11 march 2020, Available at SSRN 3586675, 2020.
 2020. [14] Hiroshi Nishiura, Tetsuro Kobayashi, Takeshi Miyama, Ayako
 [4] Joel Hellewell, Sam Abbott, Amy Gimma, Nikos I Bosse, Suzuki, Sung-mok Jung, Katsuma Hayashi, Ryo Kinoshita,
 Christopher I Jarvis, Timothy W Russell, James D Munday, Yichi Yang, Baoyin Yuan, Andrei R Akhmetzhanov, et al. Es-
 Adam J Kucharski, W John Edmunds, Fiona Sun, et al. Fea- timation of the asymptomatic ratio of novel coronavirus infec-
 sibility of controlling covid-19 outbreaks by isolation of cases tions (covid-19). International journal of infectious diseases,
 and contacts. The Lancet Global Health, 2020. 94:154, 2020.
 [5] Benjamin F Maier and Dirk Brockmann. Effective containment [15] Michael Day. Covid-19: identifying and isolating asymp-
 explains subexponential growth in recent confirmed covid-19 tomatic people helped eliminate virus in italian village. BMJ:
 cases in china. Science, 368(6492):742–746, 2020. British Medical Journal (Online), 368, 2020.
 [6] Jasper Fuk-Woo Chan, Shuofeng Yuan, Kin-Hang Kok, Kelvin [16] Yang Yu, Yu-Ren Liu, Fan-Ming Luo, Wei-Wei Tu, De-Chuan
 Kai-Wang To, Hin Chu, Jin Yang, Fanfan Xing, Jieling Liu, Zhan, Guo Yu, and Zhi-Hua Zhou. Covid-19 asymptomatic
 Cyril Chik-Yan Yip, Rosana Wing-Shan Poon, et al. A famil- infection estimation. medRxiv, 2020.
 ial cluster of pneumonia associated with the 2019 novel coro- [17] Kenji Mizumoto, Katsushi Kagaya, Alexander Zarebski, and
 navirus indicating person-to-person transmission: a study of a Gerardo Chowell. Estimating the asymptomatic proportion of
 family cluster. The Lancet, 395(10223):514–523, 2020. coronavirus disease 2019 (covid-19) cases on board the dia-
 [7] Zhiru Gao, Yinghui Xu, Chao Sun, Xu Wang, Ye Guo, Shi Qiu, mond princess cruise ship, yokohama, japan, 2020. Euro-
 and Kewei Ma. A systematic review of asymptomatic infec- surveillance, 25(10):2000180, 2020.
 tions with covid-19. Journal of Microbiology, Immunology and [18] Heneghan C, Brassey J, and Jefferson T. Covid-19: What
 Infection, 2020. proportion are asymptomatic? Centre for Evidence-Based
 [8] Anne Kimball, Kelly M Hatfield, Melissa Arons, Allison Medicine, 2020.
 James, Joanne Taylor, Kevin Spicer, Ana C Bardossy, Lisa P [19] Dashboard of the covid-19 virus outbreak in singapore.
 Oakley, Sukarma Tanwar, Zeshan Chisty, et al. Asymptomatic https://www.againstcovid19.com/singapore/
 and presymptomatic sars-cov-2 infections in residents of a dashboard Accessed April 4, 2020.
 long-term care skilled nursing facility—king county, washing- [20] Haridimos Kondylakis, Dimitrios G Katehakis, Angelina
 ton, march 2020. Morbidity and Mortality Weekly Report, Kouroubali, Fokion Logothetidis, Andreas Triantafyllidis, Ilias
 69(13):377, 2020. Kalamaras, Konstantinos Votis, and Dimitrios Tzovaras. Covid-
 [9] Quan-Xin Long, Xiao-Jun Tang, Qiu-Lin Shi, Qin Li, Hai-Jun 19 mobile apps: A systematic review of the literature. Journal
 Deng, Jun Yuan, Jie-Li Hu, Wei Xu, Yong Zhang, Fa-Jin Lv, of medical Internet research, 2020.
 et al. Clinical and immunological assessment of asymptomatic [21] David A Drew, Long H Nguyen, Claire J Steves, Cristina
 sars-cov-2 infections. Nature medicine, pages 1–5, 2020. Menni, Maxim Freydin, Thomas Varsavsky, Carole H Sudre,
[10] Ying-Chu Liu, Ching-Hui Liao, Chin-Fu Chang, Chu-Chung M Jorge Cardoso, Sebastien Ourselin, Jonathan Wolf, et al.
 Chou, and Yan-Ren Lin. A locally transmitted case of sars- Rapid implementation of mobile technology for real-time epi-
 cov-2 infection in taiwan. New England Journal of Medicine, demiology of covid-19. Science, 2020.
 382(11):1070–1072, 2020. [22] Luca Ferretti, Chris Wymant, Michelle Kendall, Lele Zhao,
[11] Camilla Rothe, Mirjam Schunk, Peter Sothmann, Gisela Bret- Anel Nurtay, Lucie Abeler-Dörner, Michael Parker, David Bon-
 zel, Guenter Froeschl, Claudia Wallrauch, Thorbjörn Zim- sall, and Christophe Fraser. Quantifying sars-cov-2 transmis-
 mer, Verena Thiel, Christian Janke, Wolfgang Guggemos, sion suggests epidemic control with digital contact tracing. Sci-
 et al. Transmission of 2019-ncov infection from an asymp- ence, 368(6491), 2020.
 tomatic contact in germany. New England Journal of Medicine, [23] Serina Chang, Emma Pierson, Pang Wei Koh, Jaline Gerardin,
 382(10):970–971, 2020. Beth Redbird, David Grusky, and Jure Leskovec. Mobility net-
[12] Billy J Quilty, Sam Clifford, Stefan Flasche, Rosalind M Eggo, work models of covid-19 explain inequities and inform reopen-
7

 ing. Nature, pages 1–8, 2020. Modelling the epidemic trend of the 2019 novel coronavirus
[24] Paul Mozur, Raymond Zhong, and Aaron Krolik. In coron- outbreak in china. BioRxiv, 2020.
 avirus fight, china gives citizens a color code, with red flags. [35] Tao Liu, Jianxiong Hu, Min Kang, Lifeng Lin, Haojie Zhong,
 New York Times, 1, 2020. Jianpeng Xiao, Guanhao He, Tie Song, Qiong Huang, Zuhua
[25] Qun Li, Xuhua Guan, Peng Wu, Xiaoye Wang, Lei Zhou, Rong, et al. Transmission dynamics of 2019 novel coronavirus
 Yeqing Tong, Ruiqi Ren, Kathy SM Leung, Eric HY Lau, Jes- (2019-ncov). 2020.
 sica Y Wong, et al. Early transmission dynamics in wuhan, [36] Jonathan M Read, Jessica RE Bridgen, Derek AT Cummings,
 china, of novel coronavirus–infected pneumonia. New England Antonia Ho, and Chris P Jewell. Novel coronavirus 2019-ncov:
 Journal of Medicine, 2020. early estimation of epidemiological parameters and epidemic
[26] Fei Zhou, Ting Yu, Ronghui Du, Guohui Fan, Ying Liu, Zhibo predictions. MedRxiv, 2020.
 Liu, Jie Xiang, Yeming Wang, Bin Song, Xiaoying Gu, et al. [37] Maimuna Majumder and Kenneth D Mandl. Early transmissi-
 Clinical course and risk factors for mortality of adult inpatients bility assessment of a novel coronavirus in wuhan, china. China
 with covid-19 in wuhan, china: a retrospective cohort study. (January 23, 2020), 2020.
 The lancet, 2020. [38] Aditya Grover and Jure Leskovec. node2vec: Scalable fea-
[27] Lorenzo Isella, Juliette Stehlé, Alain Barrat, Ciro Cattuto, Jean- ture learning for networks. In Proceedings of the 22nd ACM
 François Pinton, and Wouter Van den Broeck. What’s in a SIGKDD international conference on Knowledge discovery and
 crowd? analysis of face-to-face behavioral networks. Journal data mining, pages 855–864, 2016.
 of theoretical biology, 271(1):166–180, 2011. [39] Thomas N Kipf and Max Welling. Semi-supervised classifica-
[28] Biao Tang, Xia Wang, Qian Li, Nicola Luigi Bragazzi, Sanyi tion with graph convolutional networks. In 5th International
 Tang, Yanni Xiao, and Jianhong Wu. Estimation of the trans- Conference on Learning Representations (ICLR), 2016.
 mission risk of the 2019-ncov and its implication for public [40] Petar Veličković, Guillem Cucurull, Arantxa Casanova, Adri-
 health interventions. Journal of clinical medicine, 9(2):462, ana Romero, Pietro Lio, and Yoshua Bengio. Graph attention
 2020. networks. In 6th International Conference on Learning Repre-
[29] Julien Riou and Christian L Althaus. Pattern of early human-to- sentations (ICLR), 2017.
 human transmission of wuhan 2019 novel coronavirus (2019- [41] Donald J Wheeler and David S Chambers. Understanding sta-
 ncov), december 2019 to january 2020. Eurosurveillance, tistical process control. uspc, 1992.
 25(4):2000058, 2020. [42] Thomas J DiCiccio and Bradley Efron. Bootstrap confidence
[30] Shi Zhao, Qianyin Lin, Jinjun Ran, Salihu S Musa, Guangpu intervals. Statistical science, pages 189–212, 1996.
 Yang, Weiming Wang, Yijun Lou, Daozhou Gao, Lin Yang,
 Daihai He, et al. Preliminary estimation of the basic reproduc-
 tion number of novel coronavirus (2019-ncov) in china, from
 2019 to 2020: A data-driven analysis in the early phase of the
 outbreak. International journal of infectious diseases, 92:214–
 217, 2020.
[31] N Imai, I Dorigatti, A Cori, C Donnelly, C Riley, and NM Fer-
 guson. Report 2: Estimating the potential total number of
 novel coronavirus cases in wuhan city, china. 22 january 2020-
 imperial college london. who collaborating centre for infectious
 disease modelling. mrc centre for global infectious disease anal-
 ysis, j-idea, imperial college london, uk.
[32] Zhidong Cao, Qingpeng Zhang, Xin Lu, Dirk Pfeiffer, Zhong-
 wei Jia, Hongbing Song, and Daniel Dajun Zeng. Estimating
 the effective reproduction number of the 2019-ncov in china.
 MedRxiv, 2020.
[33] Joseph T Wu, Kathy Leung, and Gabriel M Leung. Nowcasting
 and forecasting the potential domestic and international spread
 of the 2019-ncov outbreak originating in wuhan, china: a mod-
 elling study. The Lancet, 395(10225):689–697, 2020.
[34] Mingwang Shen, Zhihang Peng, Yanni Xiao, and Lei Zhang.
8

 TABLE I: COVID-19’s clinical parameters and infectious characteristics used in this work.
Parameter Meaning value Origin
R0 basic reproduction 3.50 Average from 10 researches [28–
 number 37]
p fraction of asymptomatic 15% minimal value from 5
 infections researches[13, 14, 16, 17]
fP (d) Distribution of during Logarithmic normal distribution fitted value from clinical data of
 length of Presymptomatic with µP = 0.62 and σP = 0.64 [25]
 state
fI (d) Distribution of during Normal distribution with µI = fitted value from clinical data of
 length of Symptomatic 8.8 and σI = 3.88 [25]
 state
fA (d) Distribution of during Normal distribution with µA = µA is estimated from clinical data
 length of Asymptomatic 20.0 and σA = 5.0 of [26]
 state
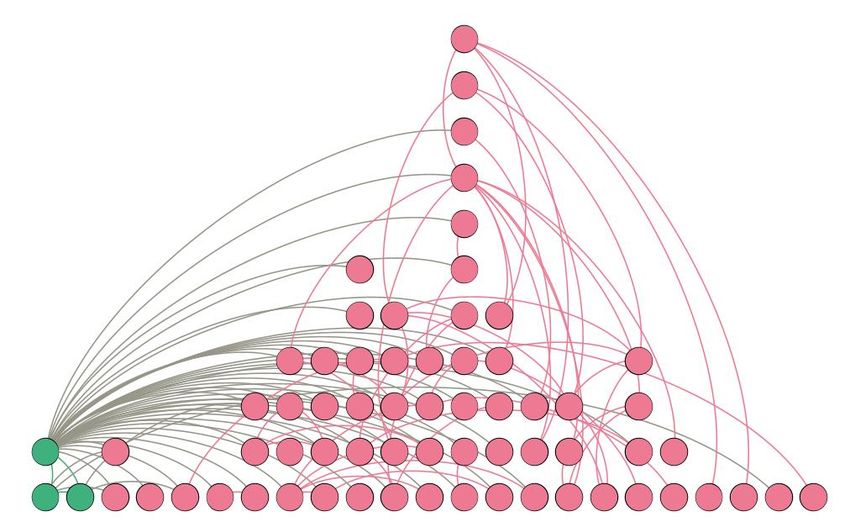
9

 (a) (b)

 Presymptomatic Symptomatic

 Susceptible Recovered

 State-known nodes
 Asymptomatic
 Susceptible Recovered Symptomatic

 (c) (d)

 i
 j Iteration
 k

 m
 l
 ( + 1)
 Low risk High risk

 FIG. 1: Identifying Asymptomatic and Presymptomatic COVID-19 Infections on Contact-tracing Networks. (a) The
 COVID-19 state transition of an individual. A susceptible will become either asymptomatic or presymptomatic after being
 infected. An asymptomatic patient will further turns to the symptomatic state after an incubation period, while an
 presymptomatic patient will never exhibit any symptoms until the recover. (b) Illustration of asymptotic/presymptomatic node
 identification problem. In a contact-tracing network, only a small fraction of the nodes’ states are known (marked with color),
 while the hidden asymptomatic/presymptomatic individuals within the population (marked with grey) are potential spreaders.
 Our purpose is to find asymptomatic/presymptomatic infected individuals in the population using the contact-tracing network
and the information of known confirmed cases. (c) Diagram of the proposed method. The state transition of an unknown node k
 is modeled as a Markov process, i.e., a vector Zk where the elements represent the probabilities of different infection stages in
 (a). The specific value of the vector Zk (t + 1) at t + 1 is determined by the infection status of known nodes at t and the
 structure of the contact network. (d) After iterations over the whole network, each unknown node will be assigned with an
 infection indicator according to the eventual values of its state vector Zk , which represents the risk of being infected.
10

(a) (b)
 Presymptomatic
 Asymptomatic
 Symptomatic

 Susceptible
 Presymptomatic
 Asymptomatic
 Symptomatic
 Recovered

(c)
 (d)
 Known patients Unknown individuals

 01/24 01/29 02/01 02/04 02/07 02/09 02/11 02/16
 02/16 02/23 02/26 02/28 03/02 03/04 03/07 03/10 03/13 03/15 03/19

 01/23 01/28 01/30 02/03 02/06 02/08 02/10 02/12 02/21 02/11 02/21 02/24 02/27 02/29 03/03 03/05 03/08 03/11 03/14 03/17 03/21

(e) (f)
 Slope = 9.39 Slope = 14.25
 Pearson = 0.48 Pearson = 0.67
 P = 0.008 P = 5 × 10⁻⁹
11

 FIG. 2: Empirical and Simulated Validation of the Proposed Model. (a) The number of people in each of the 5 states in the
 simulation process of COVID-19 spreading on the ISA network. At T = 0, we select three nodes with the maximum degree in
 the ISA network as the initial infected spreaders. Dash lines represent the theory values calculated by Eqns.(6-10). Dots
 represent the average value of 1000 simulations. (b) The theoretical probability vs. numerical frequency of each individual
being in various states on T = 10 days. Each dot corresponds to a certain state of a node in the ISA network while the errorbar
 is the 95% confidence interval obtained by the bootstrapping method [42]. (c) The topological structure of a real COVID-19
 spreading network in Singapore (Singapore A), where dots are patients and curves are contacts between patients (see Sec. SI 1
 for the description of the network). The points on the timeline indicate the date of the patient’s presence. (d) The topological
 structure of another network of Singapore (Singapore B). (e) Relationship between the individual symptomatic time and the
estimated infection probability in Singapore A. The network has a total of T = 30, from January 23, 2020 to February 21, 2020.
 Here we utilize the information of infections from the first two different time points as known set to infer the rest nodes’ states
 in the network by Eqns. (1-9). Using the obtained state vector of each unknown node, we rank them according to the infection
probability and compare with it’s real symptomatic time. Since all patients are symptomatic in the dataset, the rank is based on
 Ci (t) − Ai (t). The line denotes the linear fitted result and the shaded area denotes the 95% confidence interval. (f) Similar to
(e), the value of the rank of infection probability vs. symptomatic time in Singapore B. The network has a total of T = 40, from
 February 11, 2020 to March 21, 2020. We use infections who got infected the first two different time points for training.
12

(a) (b)

 Network Size Network Size
(c) (d)

 1-Recall
 Dynamic Method

 Network Size Network Size

(e) Remained (f)

(g) Remained (h)
13

 FIG. 3: Screening Performance Assessment. (a-d) Performance of the dynamic screening method on the ISA network
 compared with other machine-learning baselines (see details in Sec. SI 3). (a) The accuracy vs. rank of infection (divided by
 the network size). The accuracy is defined as the proportion of non-Susceptible individuals in the ranking list. Since all nodes
we screen at T do not have symptoms, here we use the value of Ci (t) − Ii (t) to rank these nodes. (b) Similar to (a), the relative
 accuracy of the machine-learning-based algorithms, which is the ratio between the accuracy of our proposed algorithm and
 other algorithms. (c) The relationship between the rank of infection and the recall rate (i.e., the proportion of successfully
 identified non-Susceptible individuals to those in the whole network. (d) Similar to (c), the relative recall rate of the
 machine-learning-based algorithms. (inset) Recall rate of the static algorithms on the 1-step neighbor subnetwork and on the
 whole network (see SI Figures 14-17), compared with the dynamic algorithm. (e-h) Performance of the dynamic screening
 method with incomplete network information. We randomly remove a fraction of links in the ISA network (see the result of
 another social network in Sec. SI 5) and then employ the proposed screening schemes on the remaining network. (e) The
 relationship between the accuracy and the ranking value of the infection probability with different proportions of the removed
 edges. Here we normalize the ranking value to range [0,1] by dividing it with the total number of individuals who have been
 screened. (f) Accuracy of the dynamic screening method vs. the proportion of the removed edges by measuring the infection
 rank with different proportions. For example, top 20% rank means the 20% nodes with the highest infection possibility which
is equal to 0.2 of norlized rank of infection in (e). (g) The dependencies of recall rate of the dynamic screening method on the
 infection rank. (h) Recall vs. the remaining edges.
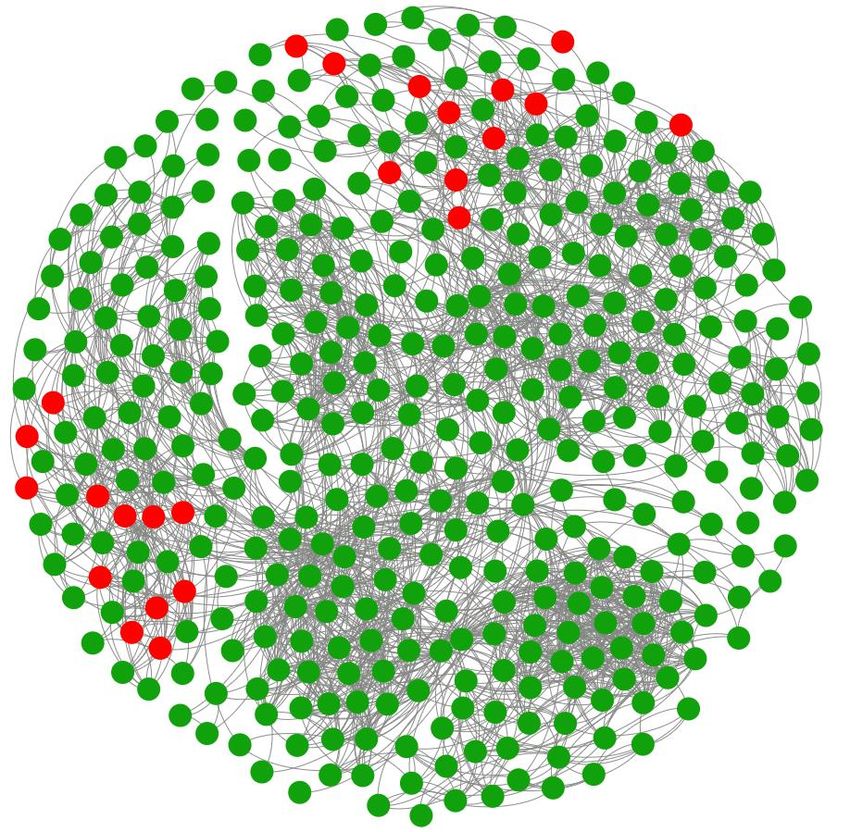
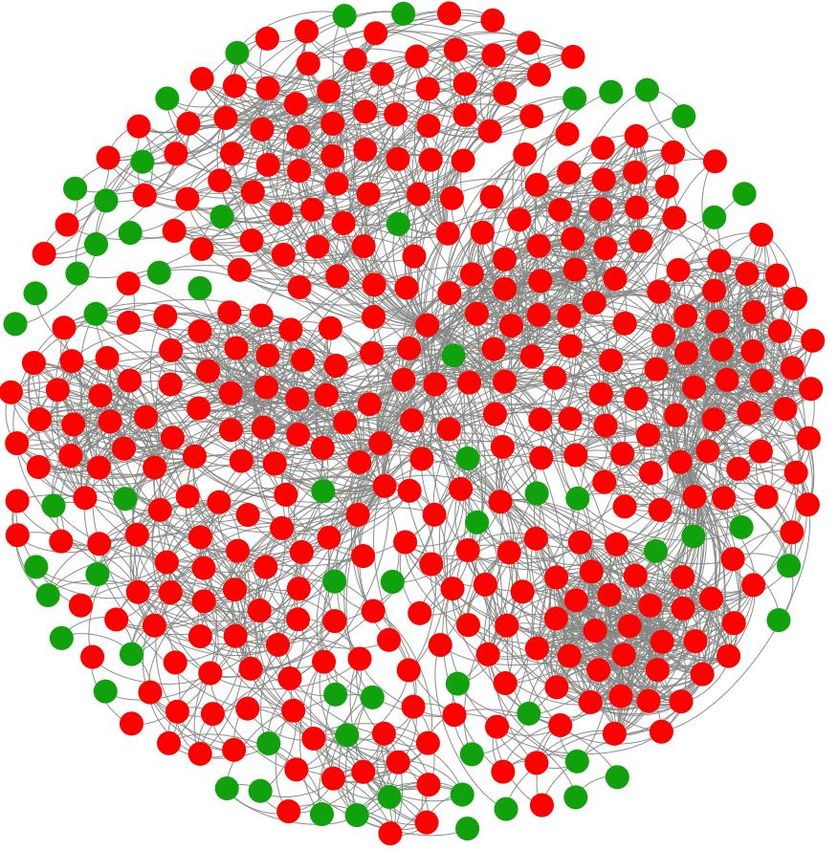
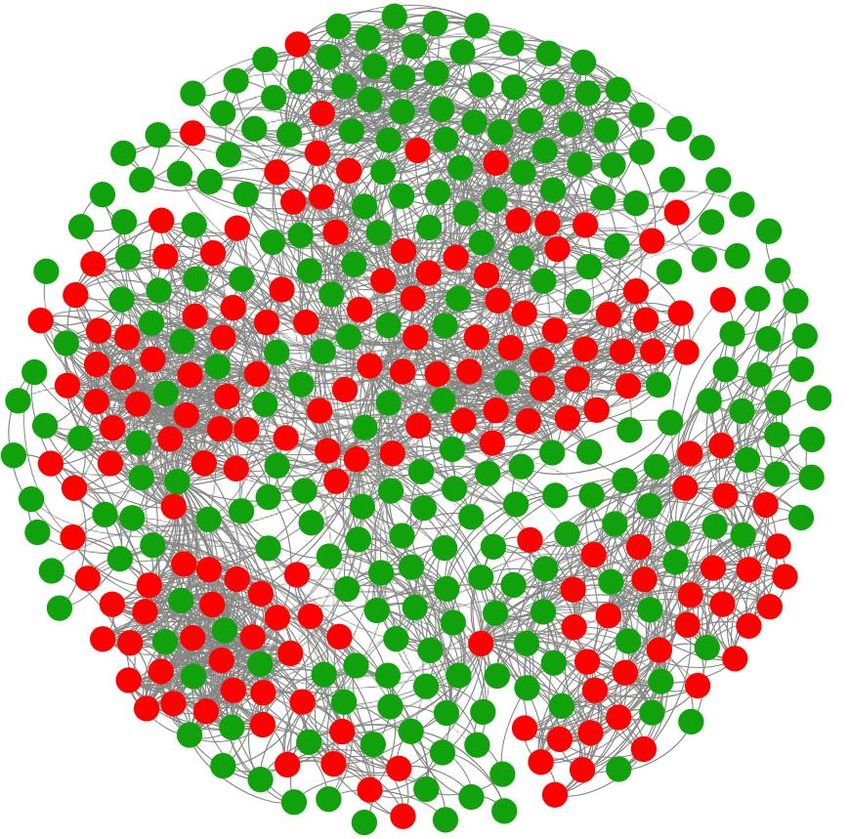
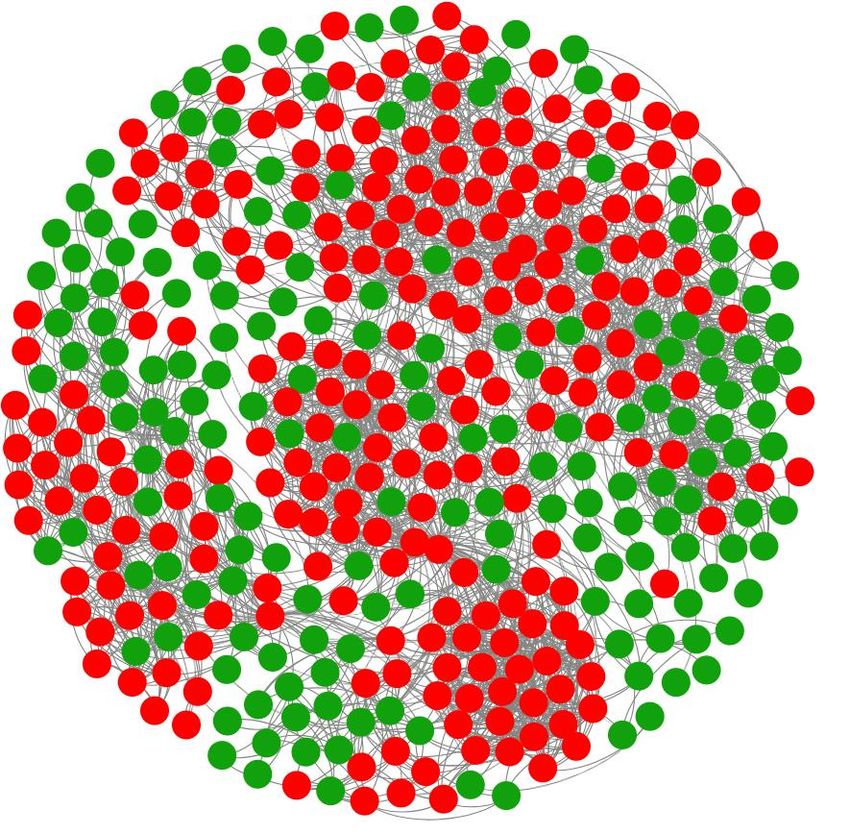
14

(a) Without Containment (b) (c) (d) Our Method
 Infection Containment Neighbor Containment

 Infected Uninfected

(e) (f)

(g) (h)
 Remained

 Remained

 FIG. 4: Containment Effectiveness of the Proposed Scheme on Simulated COVID-19 Spreading. From T = 10 of
 COVID-19 spreading simulation on the ISA network, we conduct different approaches separately to contain the pandemic,
 including the proposed method (i.e. Dynamic Containment), the Infection Containment and the Neighbor Containment (see
 Sec. SI 4 for details). For the Neighbor Containment and the proposed method, we select a total of 2%N of individuals to
 screen and then quarantine those tested positive at each time step. (a) Visualization of infected population without conducting
 any contain scheme and (b-d) the 3 different control schemes). (e) The number of daily new infections in different control
schemes. The value of each curve is divided by the highest point at that time to normalize to [0,1]. (f) The cumulative number
of infections corresponding to (e). (g-h) The performance of our control scheme under an incomplete network where a fraction
 of links are randomly removed in the detection process.
You can also read