A Random Walk based Trust Ranking in Distributed Systems
←
→
Page content transcription
If your browser does not render page correctly, please read the page content below
A Random Walk based Trust Ranking in Distributed Systems
                                                                    Alexander Stannat                                 Johan Pouwelse
                                                              Delft University of Technology                   Delft University of Technology
                                                              A.W.Stannat@student.tudelft.nl                       peer2peer@gmail.com

                                         1     Abstract                                                      A particular example of distributed systems are peer-to-
arXiv:1903.05900v1 [cs.DC] 14 Mar 2019

                                                                                                             peer networks, also known as P2P networks. A peer-to-peer
                                         Honest cooperation among individuals in a network                   network allows computers to communicate without the need
                                         can be achieved in different ways. In online networks               for a central server. Peer-to-peer file sharing refers to the
                                         with some kind of central authority, such as Ebay,                  distribution of digital media over a P2P network, in which
                                         Airbnb, etc. honesty is achieved through a repu-                    the files are located on individuals’ computers and shared
                                         tation system, which is maintained and secured by                   with other members of the network. P2P software was the
                                         the central authority. These systems usually rely on                piracy method of choice in the early 2000s with software
                                         review mechanisms, through which agents can evalu-                  programs such as LimeWire, Gnutella and the BitTorrent
                                         ate the trustworthiness of their interaction partners.              client being the most prominent applications [1]. A Supreme
                                         These reviews are stored centrally and are tamper-                  Court decision in 2005 led to the closure of many of these
                                         proof. In decentralized peer-to-peer networks, en-                  sites for illegally sharing copyrighted material, mostly music.
                                         forcing cooperation turns out to be more difficult.
                                         One way of approaching this problem is by observing
                                         cooperative biological communities in nature. One                   In a peer-to-peer file sharing network agents up- and down-
                                         finds that cooperation among biological organisms is                load files over the network to one another in a cooperative
                                         achieved through a mechanism called indirect reci-                  manner, whereby an agent that is holding a file (or at least
                                         procity [6]. This mechansim for cooperation relies                  a part of it) can offer it to other agents that require it,
                                         on some shared notion of trust. In this work we aim                 through actions called seeding and leeching. Seeders are
                                         to facilitate communal cooperation in a peer-to-peer                those who offer upload bandwidth while leechers are the
                                         file sharing network called Tribler, by introducing                 agents that download the data. While these types of sys-
                                         a mechanism for evaluating the trustworthiness of                   tems have many advantages over the standard client-server
                                         agents. We determine a trust ranking of all nodes in                model, they do have one fundamental problem: users have
                                         the network based on the Monte Carlo algorithm es-                  an obvious incentive to download, i.e. to leech, but no
                                         timating the values of Google’s personalized PageR-                 inherent incentive to seed. This results in behavior called
                                         ank vector. We go on to evaluate the algorithm’s                    lazy freeriding.
                                         resistance to sybil attacks, whereby our aim is for
                                         sybils to be assigned low trust scores.
                                                                                                             In order to avert freeriding and to incentivize its users to
                                                                                                             participate in the network reciprocally, early file sharing
                                         2     Introduction                                                  networks such as the BitTorrent protocol employ a mecha-
                                                                                                             nism called tit-for-tat [2]. Tit-for-tat is a highly effective
                                         2.1    Historical Perspective                                       strategy in game theory for the iterated prisoner’s dilemma,
                                         With the ever-growing expansion and widespread accep-               in which an agent cooperates first and then replicates it’s
                                         tance of the internet, the field of research in distributed         contender’s previous actions. In practice, this works as
                                         systems is gaining evermore importance. In its simplest             follows. Peers in the BitTorrent network have a limited
                                         definition, a distributed system is a group of different            number of upload slots to allocate. An agent will begin
                                         processors working together on a common task. These                 by exchanging upload bandwidth for download bandwidth
                                         processors have a shared state, operate concurrently and            with a number of its peers. If one of these peers turns out
                                         can fail independently. The primary advantages of a                 to be a leecher, i.e. does not reciprocate, it will be choked.
                                         distributed system over a centralized system are scalability,       This means the agent will discontinue it’s cooperation and
                                         fault-tolerance and lower latency. There are however some           assign the corresponding upload slot to another randomly
                                         drawbacks to the decentralized nature of these networks.            chosen peer in a procedure known as optimistic unchoking.
                                         The most notable being resource-management.

                                                                                                             However, we find that defecting is the dominant strategy in

                                                                                                         1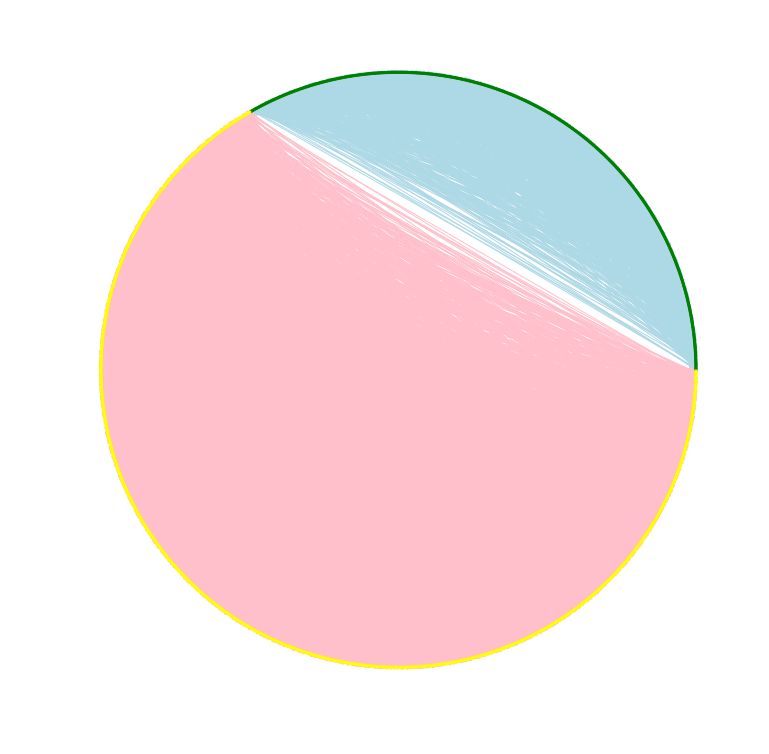
the Prisoner’s dilemma [3]. The agents’ inability to coor-           2.3    Trustchain
dinate and build expectations of their counterparts ensures
that everyone will be worse of than if they had collabo-      In order to build such a digital trust mechanism into
rated. This is also known as the tragedy of the commons.      a perfectly decentralized network, a distributed storage
Agents do not keep a memory about their peer’s reliability    space, or ledger, is required. The tools most commonly
which enables such lazy freeriding and other types of un-     used for this purpose are Blockchains. Blockchains are data
cooperative behavior. There is no mechanism with which        structures that utilize cryptographic primitives such as
peers can be evaluated based on their previous reliability    public-key cryptography to maintain a consensus on data,
or trustworthiness as nodes in the network and hence every    stored on many different processors in a distributed system.
new transaction entails the risk of the partner node defect-  Transactions between agents in the network are grouped
ing. This leads us to the main research question, the TU      in blocks which, in turn, are interlinked by a hash chain.
Delft’s Blockchain Lab focuses their study on: Is it possible Blocks are created by ”miners”, nodes in the network
to incorporate a digital counterpart to trust in a distributedthat collect and group transactions. In order to obtain a
network with no central authority?                            block, the miner needs to solve a crpytographic hash puzzle
                                                              through a protocol known as proof-of-work. If conflicting
                                                              states occur, the chain forks, and miners contribute to the
                                                              chain they believe is the valid one. At some point, one
2.2 Trust                                                     chain will overtake the other and all miners transition to
                                                              that chain. This point is determined by a certain number
Trust is a rather abstract concept which is oftentimes
                                                              of blocks by which one chain surpasses the other, which is
understood more on an intuitive level as opposed to having
                                                              based on a predetermined lower bound for the probability
a clear-cut definition. Thus there are many different
                                                              of a dishonest miner single-handedly overruling the current
possible definitions of trust. In this project we chose to
                                                              chain. The resulting chain of blocks is therefore immutable
adopt one of the definitions of trust given in Vandenheuvel’s
                                                              as well as fraud-proof[9].
Mathematics of Trust [4].

                                                                     Blockchains however have a major drawback that the
Definition 2.1 (Trust).                                              classical client-server model does not have. Consensus is
Two agents (a trustor and a trustee) have a trust relation-          maintained by miners receiving information about all trans-
ship if the trustor is uncertain about the outcome of the            actions that have transpired in the network. As the network
trustee’s actions and can only rely on previously developed          grows, the risk of transaction broadcasts not reaching cer-
expectations to predict these.                                       tain miners increases, which makes maintaining a global
                                                                     consensus more and more difficult. This fundamentally
Trust is a necessary catalyst for cooperation in networks and        limits the scalability of such blockchain based networks.
there have been many different approaches to facilitating            Another scalability issue the current proof-of-work con-
trust relationships in distributed systems. Companies like           sensus mechanism causes, lies in the fact that it requires
eBay, Uber or Airbnb utilize reputation systems based on             agents to wait for a certain number of blocks to exceed
ratings. Agents in these networks leave publicly accessible          a transaction’s block before this transaction is deemed
reviews of eachothers’ collaborators after each transaction.         trustworthy. In pursuing a more scalable alternative, the
These reviews are stored and maintained by a central                 blockchain lab has developed their own type of distributed
authority, so that no fraud can take place. Based on these           ledger, called TrustChain. TrustChain is what’s known as
reviews the network generates reputation systems for all             a fourth-generation blockchain.
nodes. Agents then decide who to interact with based on
this reputation, thereby incentivizing cooperative behavior
of all participants [5].                                              In TrustChain, all network participants maintain their own
                                                                     chain of transactions. There is no mining and no global
                                                                     consensus. The TrustChain maintains records of all inter-
The TU Delft’s Blockchain Lab aims to take this trust sys-           actions between peers in the network, in respective blocks.
tem a step further, by removing the central authority that           Each block contains data about an individual transaction
manages the network and its reputation system. In order              between two peers, such as the respective up-and download
to gain an understanding of how this is possible we look             values, the peers’ public keys and signatures as well as
into the sociological aspects of cooperative networks among          block sequence numbers and respective hashes. Blocks are
people in the real world. Nowak, Martin A. discuss what              linked to one another through hash pointers. Each block
psychological mechanisms engender cooperative networks in            is thereby connected to two preceding and two succeeding
the animal kingdom, namely kin selection, direct reciprocity,        blocks, i.e. each block is contained in the chains of both
indirect reciprocity, network reciprocity, and group selection       transaction partners. This results in many different chains,
[6]. DBL is researching the possibility of incorporating a           each corresponding to a single agent’s transaction history,
mechanism of indirect reciprocity into their p2p file sharing        see Figure 1[8].
network called tribler [7].

                                                                 2
termine which agent in the swarm it should engage with to
                                                                   maximize the likelihood of a successful transaction and a
                                                                   subsequent reciprocal relationship. We present a number of
                                                                   requirements that this trust mechanism should satisfy.

                                                                       1 Personalization
                                                                         Trust is personal. Two different agents in the network
                                                                         may have a completely different perception of their
                                                                         neighbours’ trustworthiness. This means that an algo-
  Figure 1: Trustchains of different network participants                rithm computing a trust ranking of nodes must depend
                                                                         on the node from whose perspective the trustworthiness
                                                                         is determined.
When two agents interact with one another, they make their             2 Locality
respective chains visible to each other and may even store               It’s been observed that in the BitTorrent network most
information about each other’s chains as well. This struc-               peers share a one hop relationship In [10]. Therefore
ture is strongly scalable, both in the number of agents in               we restrict the amount of indirection in between con-
the network as well as in the number of transactions per                 tributing and reciprocating peers. This makes sense in
agent. Moreover, the trustchain does not maintain a global               a social context as well. A node may trust one of its
consensus. This means that double-spends are not actually                peers, and by transitivity of trust, it will also trust this
prevented, as they are in traditional blockchains. However,              peer’s trustees, although less. A third or fourth hop will
they are made detectable and can subsequently be penal-                  reduce this amount of transitive trust to a minimum.
ized through peer rejection or even by banning dishonest
nodes from the network. Thereby fraudulent activity is not             3 Incrementality
actually prevented, but strongly disincentivized.                        The underlying graph structure of the network con-
                                                                         tinually evolves as transactions take place and new
                                                                         blocks are added to agents’ trustchains. Trust rankings
2.4    Problem Description                                               therefore develop continuously as well. Recomputing
                                                                         these trust rankings from scratch is prohibitively ex-
As discussed in subsection 2.1 (Historical Perspective) the
                                                                         pensive. We require our algorithm to be able to update
long standing issue of tribler is digitizing a method for
                                                                         the trust rankings incrementally as more information
evaluating the trustworthiness, or reputation, of agents
                                                                         arrives over time. We update the trust rankings in
in a network. Such a mechanism is meant to deter lazy
                                                                         batches, either in time intervals, or by the amount of
freeriders, i.e. agents that purposefully contribute no or
                                                                         information that has become available.
very little resources to the network, but at the same time
utilize the network for their own benefit.

                                                                   A very popular existing algorithm that is used to rank the
There have been many different approaches to this problem,         importance of pages on the world wide web is Google’s
however a viable and accurate solution has yet to be found.        pagerank algorithm. In the context of the internet, we find
The first reputation system introduced in Tribler was              that the importance ranking by google is an equivalent con-
BarterCast [11]. BarterCast was based on the voluntary             cept to our idea of trustworthiness in p2p networks. Given
reports of agents about their own transactions. However, an        the resemblance of the graph structures of both the web and
inherent problem with the BarterCast system is the issue of        the tribler network, the use of the pagerank algorithm for
deliberate misreporting of transactions, by agents that have       the assessment of agents’ trustworthiness suggests itself.
made overall negative contributions to the network. After
BarterCast, another accounting mechanism was introduced:
DropEdge, which is an implementation of BarterCast on a            3      Preliminaries
subset of the graph, ignoring all nodes that are interested
in receiving some data.                                            3.1      The Model
                                                              In order for us to model the Tribler network in a graph
In this project we aim to implement a mechanism which structure we look into the number of different models defined
enables the ranking of nodes in the tribler network based in [12] There, the concept of an ordered interaction model
on their respective reputability. Reputatbility should be a is introduced, which we will briefly recap.
measure of the impact a node has on the network. This Definition 3.1 (Ordered Interaction Model).
means that nodes with a low or negative net contribution Define an ordered interaction model as M = hP, I, aωi,
made to the network should be ranked lower than more al- which is uniquely determined by the following 4 sets:
truistic nodes. When a node is looking to query an overlay
for a file to download, it will generate this ranking and de-   • P : a finite set of agents.

                                                               3
• I a finite set of interactions.
• a : I → P × P , a function mapping each interaction to
the participants involved .
• ω : I × P → R≥0 , a function mapping an interaction
and an agent to the contribution made by the agent in
that interaction.
For any p 6∈ a(i) it must hold ω(i, p) = 0. Note that ω also
allows for negative values, in case of leeching. For any agent
the interactions involving this agent must be completely or-
dered temporally.
From this mathematical framework we now derive the Figure 2: Ordered Interaction Model
graph structure on which we will instantiate the trust mech-
anism.
structure called the TrustChain. In the TrustChain, every
Definition 3.2 (Interaction Graph). Given an ordered in- block corresponds to an interaction. We can visualize the
teraction model M = hP, I, a, ωi, we define an interaction trustchain with what [12] refers to as an ordered interaction
graph G = (V, E) by the sets graph, were every node corresponds to a block in the
• V = {vp |p ∈ P } trustchain and the edges represent the hash pointers in the
chain. However, in order for us to obtain a trust mechanism
• E = {(vp , vq )|∃i ∈ I, a(i) = (p, q)} for agents in the Tribler network by running the pagerank
algorithm, we need to transform our trustchain graph
into an interaction graph. In order to do this, we take a
closer look at the blocks contained in the tribler blockchain.
Here, the network is given by a directed graph (V, E) with
a set V of N vertices or nodes and a set E of edges. The
vertices correspond to the agents, or peers, in the network. Blocks are tables made up of the following columns:
The edges reflect interactions between agents.
• type
The edge weights for an edge (vp , vq ) ∈ E in this graph are
determined by • tx
X • public key
ω((vp , vq )) := ω(i, p)
{i∈I:a(i)=(p,q)} • sequence number
Edges are unidirectional and weighted, whereby the weight • link public key
ω(a, b) of an edge connecting vertices a and b corresponds
• link sequence number
to the net data flow between two peers, i.e. the difference
between up- and downloaded data. Two vertices are only • previous hash
ever connected by at most one directed edge. The direction
of the edge is determined by the absolute value of the net • signature
data flow in between two nodes, i.e. if node a has a surplus
of uploaded data over node b then the edge connecting the • block timestamp
two will point towards a. With each transaction, edges are
• insert time
either added to the graph or modified in their weight. This
means that, if for instance the absolute difference of up- and • block hash
downloaded data changes, such that the node that had pre-
The tx column contains a dictionary of four keys: total up,
viously seeded more than leeched, now finds itself in ”debt”,
total down, up and down. These values correspond to
then the direction of the edge is changed. An example of an
the data shared between the two nodes involved in the
interaction graph can be found in Figure 2, with agents P,Q
and R. transaction. The total up and total down values represent
the accumulated data flow in between the two nodes
over the entire time. The public key value represents
3.2 Interaction Graphs in Tribler
the public key of the requester of the transaction while
As we have already discussed in 2.3, interactions in the the link sequence number is that of the responder. The
Tribler network are recorded in a distibuted storage sequence number is the numbering of the blocks in the chain
4of the requester and the link sequence number then rep- In our case this importance to the network can also be
resents the numbering of the block in the responder’s chain. interpreted as the nodes’ trustworthiness.
In the interaction model, every node in the graph corre- The Power Iteration can be computed in an iterative man-
sponds to a public key in the network. We retrieve all nodes ner. One begins with π0 (i) = n1 for all nodes i = 1, ..., n.
in the graph from the public key and link public key fields The values are then computed iteratively as follows.
of all trustchain blocks. We then acquire the edges from the
up and down values of the ”tx” dictionary. We aggregate 1−c X πk (j)
πk+1 (i) = + c
these over all transactions involving the two agents and then n outdeg(j)
{j | (j,i)∈E}
determine the weight and subsequently the direction of the
edge in between two nodes. This is repeated for all pairs of This iteration is finished, once the difference of the consec-
nodes until we have generated an entire interaction graph. utive values passes a certain treshold ε, or the number of
We did this with the help of the Python sqlite3 module. iterations reaches a certain predetermined upper bound.
4 The Algorithm The PageRank values can be personalized to a particular
seed node. In that case the pagerank values of all nodes in
4.1 PageRank the network depend on the initial choice of the seed node.
They are, so to speak, the pageranks determined from the
Traditionally, PageRank is computed through a method
perspective of the seed node. In that case the transition
called the Power Iteration. The Power Iteration is deter-
matrix is given by
mined in the following way. Let n denote the number of
nodes in the network. Define the n × n hyperlink matrix
1
P such that if i is a node with k outgoing edges with P̃ = (1 − c)P + c Ẽ
n
respective edge weights ωij , for k nodes j connected to i
ω
then Pij = Pk ij ω and Pij = 0 if j is not connected to whereby Ẽ is a matrix of only zeros, with a column of ones
l=1 il
i at all. The entries of P can then be interpreted as the at the i-th place, with i being determined by the seed node.
probability of a random walk of the network hopping from
node i to node j, given that it has reached node i. If a page
has no outgoing links at all, it is called a dangling node and The iterative computation then follows a slightly different
the transition probability is then spread evenly among all formula. For the pagerank of the seed node it is given by
nodes, i.e. Pij = n1 .
X πk (j)
πk+1 (i) = 1 − c + c
outdeg(j)
{j | (j,i)∈E}
This can be intrepreted as a random surfer on the graph
hopping from node to node along the edges and then and for all other nodes
teleporting to a random node in the graph with some reset
probability c at every stop. It will also teleport once it
X πk (j)
πk+1 (i) = c
reaches a dangling node. outdeg(j)
{j | (j,i)∈E}
Thus, the PageRank is defined as a stationary distribution 4.2 Monte Carlo Methods for PageRank
of a Markov chain whose state space is the set of all nodes, approximations
and its transition matrix is given by
In [13] it is observed that the end-point of a random walk
1 of the network that starts from a random page and can be
P̃ = (1 − c)P + c E terminated at each step with probability 1 − c, appears to
n
be a sample from the distribution of π. Thus we find a
where E is a n × n matrix with all values equal to one and random walk based algorithm for estimating the pagerank
c ∈ (0, 1) is the reset probability. This matrix is stochastic, values of a network. By repeating the random walks of the
aperiodic and irreducible and therefore there exists a unique graph many times, an estimate of πj for j = 1, ..., n can
vector π such that be given by the number of times a run crosses j, divided
by the total number of nodes crossed by all random walks.
P̃ π = π, with π1 = 1 This method for approximating PageRank is known as the
Monte Carlo method.
This vector π is then called the PageRank vector. The
values πi can be interpreted as the probability of a random
surfer landing on page i in an infinite random walk of the The Monte Carlo method for estimating the PageRank vec-
network. It denotes the importance of nodes in the graph. tor has several advantages over the power iteration method.
5Theorem 1 in [13] states that the estimator π̄j converges to
πj as the number of random walks goes to infinity. Thus π̄
is a consistent estimator. Additionally, it is shown that this
particular Monte Carlo method achieves an error of about
1% for the highest 12 nodes. Thus, the defined π̄’s are ac-
curate approximations of the actual PageRank values π. In
[14] it was shown that this estimator is, in fact unbiased
and sharply concentrated around its expected value. We
now evaluate this algorithm based on the three requirements
listed in 2.4.
1 Personalization
Recall the primary idea behind the PageRanks of nodes
was for a node seeking to acquire data, to evaluate the
Figure 3: Monte Carlo based PageRanks peers in its vicinity. There is no central authority which
it can query for these values and it cannot necessar-
ily rely on other agents sharing information about their
Let’s recall the three requirements we defined for the trust
previous transactions with other nodes honestly. There-
algorithm in Problem Description. Personalization, locality
fore, the node must determine these values by itself. We
and incrementality. The Monte Carlo algorithm satisfies
adjust the Monte Carlo method such that all random
all three of these requirements and we will show that it
walks originate from the same node, i.e. the down-
provides a good estimation of PageRank after relatively few
loader, also known as the seed node. The PageRanks
iterations.
are then computed analogously, but from the ”perspec-
tive” of the seed node. The alternative PageRank vec-
Monte Carlo algorithms are motivated by the following for- tor obtained through this method is called personalized
mula PageRank.
1−c T
∞
1−c T X k k 2 Locality
1 [1 − cP ] =
−1
π= 1 c P Recall the second requirement we had for this algo-
n n
k=0 rithm. Nodes do not query the entire network for data.
They direct their focus primarily towards other nodes
which suggests a simple way of sampling from the PageRank
within their vicinity. This is due to transitive trust
distribution. In [13] 5 different algorithms to estimate the
declining rapidly over an increasing number of hops
personalized pagerank, motivated by the equation above, are
through the network. The Monte Carlo algorithm en-
introduced. We chose to implement the fourth algorithm.
ables exactly this, by applying random walks with rela-
We run a simple random walk (Xt )t≥0 , m times starting at
tively high reset probabilities, e.g. values in between 0.2
the seed node in the network that either stops with proba-
and 0.5 we find that the PageRanks are more focused
bility c at every node reached, or when a dangling node is
around a node’s immediate neighbourhood as opposed
reached, else it transitions along the edges as determined by
to weighting all nodes alike.
matrix P . The length of these random walks varies around
an average of 1c . According to the equation above the nodes 3 Incremental Computation
reached by these random walks then should approximate the The tribler network does not stay still. Accounts
distribution of π. Figure 3 is a visual representation of this are made as well as deleted and new transactions
particular Monte Carlo method. Let Wij be a random vari- transpire continuously. Edges are added and removed
able denoting the number of times the random walk (Xt )t≥0 or have their weight changed through transactions.
reaches node j given that it originated at node i. Formally, Consequently the PageRank values fluctuate and
"∞ # ! have to be recomputed everytime the graph structure
1{Xt =j} = x|X0 = i changes. It is simply unsustainable to recompute all
X
P(Wij = x) = P
t=0 random walks from scratch everytime the network is
updated. Small alterations made to the graph, such
Then, the estimator for π obtained by this algorithm is given as the addition or deletion of individual nodes and/or
by edges, are unlikely to impact a significant proportion
# m n −1
"m n
X X (l) X X (l) of random walks in the network. Therefore it’s just not
π̄j = Wij Wij necessary to recompute all random walks everytime
l=1 i=1 l=1 i,j=1 the graph changes.
where W (l) , l ≥ 1 are independent random variables of the Only those random walks that pass through an edge
same distribution as Wij . or node that has been altered, need to be reviewed.
6And they only need to be recomputed starting at the Theorem 4.2. For a network with m edges, if a randomly
last node they reached before they passed the modified chosen edge leaves the graph, then the expected amount of
region (edge or node). Let’s say a node is removed from work necessary to update the walk segments is at most
the network. All random walks that reach a node, the
R
removed node was connected to, are then recomputed 1X R
starting at the that node. If an edge is removed then li ≈ 2
ε i=1 ε
all random walks that reach the source node of the
removed edge are recomputed starting at the source From this we learn that the cost to keep the PageRank ap-
node. The same goes for when an edge is added. This, proximations updated is only logarithmically larger than the
of course is an alternative that is computationally far cost of the initial computation and that the marginal update
less expensive than a rerun of the entire algorithm cost decreases with later edges making it increasingly cost
everytime an edge is added or removed. effective over time, enabling real-time updates at a later
stage.
It should be noted here that it is far more common
for new edges and nodes to arrive rather than existing
edges and nodes to leave the network. 5 Implementation
We wrote a Python class implementing the algorithm.
The code can be found in https://github.com/
In [14] the following two theorems about the expected alexander-stannat/Incremental-Pagerank/blob/
amount of additional update work for arriving and disap- master/Page_{}Rank2.py
pearing edges, were proved.
Theorem 4.1. Let (ut , vt ) be the tth random edge that is 5.1 Unit Testing
added to the graph and let Mt be the random variable that In order to determine whether our algorithm runs correctly,
determines the number of random walk segments that subse- we ran a set of 5 different unit tests. In the last one, we gen-
quently need to be updated. Finally, let R denote the number erated a random graph with number of nodes in between 2
of random walks and li the length of the ith random walk. It and 10000 and 2 edges per node. We then computed the
then holds Monte Carlo pageranks as well as the results of the power
R
X πut iteration. We compare the results and assert that the two
E[Mt ] ≤ li E[ ]
outdegut (t) vectors do not diverge by more than 10%. Thereafter, we
i=1
update the graph by randomly adding and removing edges
Additionally, it holds and nodes, and then update the values of the Monte Carlo
PageRanks incrementally, as discussed in 2.4. We also re-
πu t 1 compute the values of the power iteration and compare the
E[ ]=
outdegut (t) t two values again. We find that the values never diverge by
more than 10% for any of the randomly generated graphs.
So it is
R
1X
E[Mt ] ≤ li 5.2 Convergence Testing
t i=1
Next we determine the rate at which the Monte Carlo
For each random walk segment that needs to be updated, we algorithm converges to its final values for different sets
compute a random walk from the corresponding source node. of graphs and input parameters. Again, we randomly
Hence, we can expect 1c work per recomputed random walk. generate a graph, with the number of nodes ranging from
Now, we can sum up the expected amount of update work 2 to 100. We begin with the random generation of the
over m edge arrivals and we obtain graph. This works analogously to our previous example
above in 5.1. We determine the values of the Monte
m R m
X 1X X1 Carlo pagerank for reset probabilities 0.1, 0.3 and 0.5. We
E[ Mt ] ≤ li plot the accuracy of the method relative to the power
t=1
ε i=1 t=1 t
iteration against the number of random walks ranging from
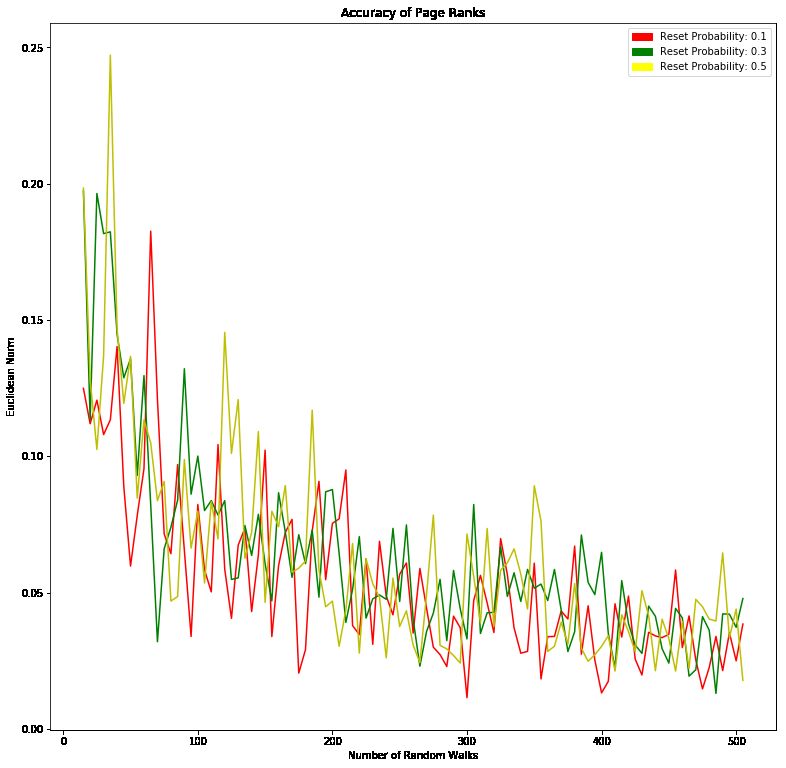
Seeing as the harmonic series is bounded from above by the 10 to 500. We obtain the following results given in Figure 4.
natural logarithm, we finally obtain
m R Figure 4 depicts the accuracy of our Monte Carlo com-
X 1X R putation of the pageranks relative to the power iteration
E[ Mt ] ≤ li ln m ≈ 2
t=1
ε i=1
ε method. We can clearly see a downward trend in the
error values over the number of random walks. It is pretty
For the counterpart of edges leaving the graph we have obvious that the Monte Carlo PageRanks become more
the following result. accurate as the number of random walks through which
7Figure 4: Accuracy of the Monte Carlo PageRanks by num- Figure 5: Accuracy of the Monte Carlo PageRanks by reset
ber of random walks probabilities
they are computed, increases. We see that the error values number of random walks increases.
for small numbers of random walks can be as high as 20%
and go down to under 5% which are reasonably accurate
values as discussed in 5.1. We also see that the reset 5.3 Sybil Resistance
probability has no effect on the accuracy, which is also In this section we discuss the properties of sybil resistance
expected. One should remark the high variance, we can of the Monte Carlo method. We randomly generate a graph
find in these values, as seen in the jaggedness of the curves. for an honest region, analogously to the method discussed
This is due to the probabilistic nature of the algorithm, i.e. in 5.1. The honest region consists of 500 random nodes
the random walks. This means the accuracy can vary quite and 2000 randomly generated interconnecting edges each
significantly for any number of random walks and any reset weighted from 0 to 10. We also generate a sybil region made
probability. up of 1000 nodes which is even more densely connected
than the honest region, with 10 edges per node. In Figure
6 the honest region is given by the green nodes and light
Next, we determine whether the reset probability of the blue edges, while the sybil region has yellow nodes and pink
random walks has any impact on the accuracy of the edges. The seed is node 0 and lies in the honest region.
algorithm. We plot three error values of the Monte Carlo
method for different numbers of random walks (10, 100, 300)
and obtain the values in Figure 5. Next, we add attack edges connecting the honest and the
sybil region in the graph. We compute the Monte Carlo
PageRanks of the given graph for every number of attack
We see in Figure 5 that the accuracy of the Monte Carlo edges in between 0 and 500. There are several attack edges
PageRanks does have a slight dependence on the reset prob- that are directly connected to the seed node 0. The Monte
ability as well as the number of random walks. For reset Carlo algorithm is run with 200 random walks and several
probabilites that are further away from the bounds, 1 and different reset probabilities. For each of those PageRank
0, we find that the error values tend to be larger. This makes vectors we create a list ”ordered nodes”, which orders
sense as well. Large reset probabilities generate short ran- the nodes in the graph according to their pageranks in
dom walks, which are less volatile than long ones. Therefore a descending order. Using this ordered vector, we deter-
there is less room for probabilistic fluctation, making them mine the ROC curve and the area under the ROC curve
more accurate. Analogously, small reset probabilites gener- as a measure of sybil resistance of the Monte Carlo method.
ate very long random walks that don’t reset at all, unless
they reach a dangling node. This means the visit times
of these random walks are more stable because they cover ROC curves are used to show the connection between sensi-
the entire graph, and therefore we obtain a smaller error. tivity and specificity for every possible cut-off for diagnostic
It should also be added that this effect is weakened as the tests. In addition, the area under the ROC curve gives an
8Figure 6: Image of a network split into an honest region and
a sybil region
Figure 7: ROC curve for 0 attack edges and reset probability
idea about the benefit of using the test in question. In our 0.3
case, it is determined as follows. We let the cut-off point
run from the first to the final node. For each, we label the
nodes beneath it as sybils and the nodes above as honest.
The abscissa of the ROC curve is then given by the false
positive rate for each cut-off point and is plotted against
the ordinate given by the corresponding true positive rate.
We determine the ROC curve for each number of attack
edges and a set of different reset probabilities (0.1, 0.3, 0.5,
0.7). We obtain the plots given in Figures 7, 8, 9.
Next, we determine the area under the ROC curve for every
ROC curve computed. The area under the ROC curve
(AUROC) of a test can be used as a criterion to measure
the test’s discriminative ability. We obtain the graphs in
Figures 10, 11, 12.
We can see in the plots above that the area under the ROC
curve decreases monotonely for random walks with reset
probability 0.1. This does not hold for shorter random
walks. When we think about this, we find that it makes per-
fect sense. Given the size of the graph and the length of the
random walks, most nodes in the honest network are never
visited by any random walk. Hence they have a pagerank of
0. This means they are at the bottom of the ordered nodes
vector and therefore labelled as sybil for almost all cut-off
points, i.e. we have a very large proportion of false nega-
tives. This does not hold for the random walks with reset Figure 8: ROC curve for 250 attack edges and reset proba-
probability of 0.1, because those random walks travers the bility 0.3
entire graph. This leads to a slightly misleading conclusion.
Overall, we get a false positives rate of in between 0.35 and
9Figure 12: Proportion of false negatives by number of attack
edges for various reset probabilities
Figure 9: ROC curve for 499 attack edges and reset proba-
bility 0.3
Figure 13: Area under the ROC curve with nodes of PageR-
ank 0 removed
0.45. The shorter the random walks, the lower this rate.
Figure 10: Area under the ROC curve by number of attack We also find that for short random walks this rate actually
edges for various reset probabilities decreases with the number of attack edges. This is because
a larger number of attack edges enables random walks that
have entered the Sybil region, to also escape it.
In order to obtain results that are more representative of
the method’s sybil resistance, we remove all nodes with
PageRanks of exactly 0 from the ordered nodes vector.
With this, we obtain the results given in Figures 13, 14, 15.
• Area under the ROC Curve
We find that the area under the ROC curve increases
quite significantly after the 5th attack edge is added.
This is because the 5th attack edge is the first attack
edge that is directly connected to the seed node. Ther-
after it decreases moderately with the number of attack
Figure 11: Proportion of false positives by number of attack
edges. For the remaining reset probabilities this does
edges for various reset probabilites
not seem to be the case. Instead the area under the
10ROC curve increases with the number of attack edges
connecting the sybil and the honest region. This is due
to the reasons we discussed above.
• False Positives
False positives are sybil nodes that are considered hon-
est according to their pageranks. We find that for the
reset probability of 0.1 the number of false positives
increases abruptly after the 5th attack edge is added,
again for the same reasons as mentioned above. The re-
maining reset probabilities exhibit rather constant num-
bers of false positives. The overall average of false pos-
itives for the algorithm in this network lies at around
35%.
• False Negatives
False negatives are honest nodes that are marked as
sybils by the algorithm. We find again that the monte
carlo algorithm with a reset probability of 0.1 exhibits
a jump in false negatives at around 5 attack edges. The
remaining PageRank values seem to be quite constant
with a minor upward trend with the number of attack
Figure 14: Proportion of false positives with nodes of PageR-
edges added. The overall average here is at around 30%.
ank 0 removed
We find that these values are not really satisfactory and
that therefore the Monte Carlo PageRank algorithm is not
practically sybil resistant. This makes sense to us. Random
walk based PageRank algorithms are rarely sybil resistant,
simply due to the random walks that they are based on.
It is easy for a random walk to end up in the sybil region
and there is no mechanism to prevent this in our current
implementation. In the future we may want to implement
a mechanism to enhance our algorithms sybil proofness, for
instance by identifying attack edges.
6 Application to the Tribler Net-
work
We now apply our implementation of the Monte Carlo algo-
rithm to the Tribler network.
6.1 Running the Algorithm
First we generate a graph of the Tribler network. We gener-
ate the graph as discussed in 4.2. There are 667124 blocks
in our data set. This corresponds to a graph of 289 nodes.
We first create our graph for all but 5 nodes and all but 20
edges. Then we compute the corresponding PageRanks. We
update the graph by adding the missing nodes and edges
to the graph. Then we update our random walks and re-
Figure 15: Proportion of false negatives with nodes of compute the PageRank values. In both cases we compare
PageRank 0 removed our values with the Power Iteration values and time the en-
tire process. We employ our Monte Carlo algorithm with
300 random walks and a reset probability of 0.3. The al-
gorithm has a runtime of 14.1710000038 seconds and we
obtain following error values: 0.3978275442360459 for the
euclidean norm and 0.19806694712219172 for the supremum
norm. This is not quite as accurate as our previous results
11for smaller graphs and we conclude that there must be some the networkx library’s approximation of the power iteration
scalability issues in the algorithm. based PageRanks may not have been the best relative
reference for our Monte Carlo PageRank. An example
6.2 Incremental Update illustrates the possible inaccuracy of the Power Iteration’s
values. If we choose a network with a completely isolated
Now, we update our graph by adding the missing edges seed node then we expect a PageRank vector consisting
and nodes. We recompute the Power Iteration PageR- only of zeros and a single value of one. However, the
anks as before, but recompute the Monte Carlo PageR- networkx power iteration returns a vector with many very
anks not from scratch, but by updating the necessary ran- small values for most nodes other than the seed node.
dom walks, as discussed in 4.2. The algorithm has a run- This perfectly illustrates where the large error values we
time of 5.17000007629 seconds and we obtain the error val- obtained originated from. The networkx power iteration
ues of 0.46419964703781746 for the euclidean norm and PageRanks have an innate inaccuracy, which accumulates
0.19798405911144684 for the supremum norm. These val- and increases as the number of edges multiplies and the
ues are slightly larger than the ones we obtained from the graph grows.
initial computation, but still reasonable.
Finally, we tested the algorithm for its sybil resistance. We
7 Conclusion generated an honest region and a sybil region connected by
a varying number of attack edges. We found that for an
In this project, we implemented an incremental personalized honest region with 500 nodes and a sybil region of 1000
PageRank algorithm for ranking nodes in a peer-to-peer nodes and a number of attack edges increasing up to 500
file sharing network, called Tribler using the Monte Carlo edges the algorithm exhibited a rather large percentage of
method. We chose algorithm 4 from [13] with a set of false positives and negatives and a relatively low ROC curve.
standard random walks on a directed graph with weighted This was to be expected, simply due to the random walk
edges. The graph of the tribler network was generated by based nature of the algorithm. In future work we may look
”flattening” the blockchain’s blocks into a unidirectional into optimizing this algorithm to account for sybil attacks.
graph with edge weights corresponding to the net data flow
in between nodes.
8 Outlook
We found that for relatively small graphs, the algorithm Within the scope of this project we deliberately neglected
is quite fast (14 seconds for the initial computation and a number of concerns and possible additions to the trust
5 seconds for the incremental updates). We find however algorithm, which we list here now. In the coming weeks and
that the error values tend to increase with the size of the months we will tackle some of these issues.
network and for the initial computation of the pageranks
of the tribler network we obtain an error of almost 40% • Sybil Resistance
and 47% for the incremental updates. One should note We have seen that our algorithm is quite susceptible
here that the application of the PageRanks is primarily to sybil attacks, especially to those in which Sybil
to rank nodes based on their trustworthiness in order to regions manage to create attack edges connecting
select the most trusted nodes to interact with. This means, directly to the seed node. Currently, we see the issue
the PageRanks of lower-ranked nodes are not as relevant lie in the fact that it is too easy for Sybils to gain
as the PageRanks of the highly-ranked nodes. An agent trustworthiness throught the transitivity of trust in
interested in a transaction will generate their trust ranking the network. In the future we might want to look into
and most likely choose a peer among the top 5 ranked making some additions to our current implementa-
nodes. This means that some of the inaccuracy is negligible tion in order to increase our algorithms sybil resistance.
so long as the ranking of nodes at the top of the ranking is
approximately correct and in the right order. Therefore the
algorithm is still applicable and returns useful results for
the Tribler application, despite the high error values. • CPU Hogging
Running the Monte Carlo algorithm 5 seconds straight,
everytime we incrementally update our values, occupies
We inspected the rate of convergence of the algorithm and the CPU for too long periods at a time. Our current
found that the accuracy of values, relative to the power system uses a single core 100% for this time span
iteration’s values improves exponentially by the number everytime it updates the trust values. These batch
of random walks and shrinks down to values close to 3% computations completely starve any other processes
for a network consisting of 15 nodes. As the network running on a user’s CPU. This is problematic and
grows these values increase as well. This is due to small should be replaced by an alterative system load profile,
inaccuracies accumulating by the iterations and thereby replacing the batch computations with continuous
growing to ever larger values. We suspect that choosing updates of the trust values of all agents in the network.
12[8] Otte, P., de Vos, M., & Pouwelse, J. (2017), TrustChain:
A Sybil-resistant scalable blockchain, Future Generation
• Accumulation of Errors Computer Systems.
We have seen in 5.2 that the algorithm’s first trust
ranking entails a rather high error value. As the [9] Nakamoto, S. (2008), Bitcoin: A peer-to-peer electronic
network continues to evolve, edges and nodes are cash system
added and removed and the trust ranking is updated
[10] Piatek, Michael, et al. (2008), File Sharing Workloads.”
incrementally in batch computations. Every update of
NSDI. Vol. 8. No. 1. 2008.
the PageRank vector adds a new error to the already
existing one and error values accumulate over time. [11] Meulpolder, M., Pouwelse, J. A., Epema, D. H., &
In order to prevent errors from getting too large, the Sips, H. J. (2009) In Parallel & Distributed Processing,
PageRank must be recomputed from scratch every so IPDPS 2009. IEEE International Symposium on (pp. 1-
often. Before deploying this algorithm in the Tribler 8). IEEE.
network it needs to be determined when and how
regularly such resets must take place. [12] Otte, P. (2016), Sybil-resistant trust mechanisms in dis-
tributed systems
[13] Avrachenkov, Konstantin, et al. (2007), Monte Carlo
• Relay Nodes methods in PageRank computation: When one iteration
The Tribler application is based on the Tor overlay net- is sufficient SIAM Journal on Numerical Analysis 45.2:
work, in order to facilitate anonymous up- and down- 890-904.
loading. This means that data transferred between
[14] Bahmani, Bahman, Abdur Chowdhury, and Ashish
two parties in the network is actually rerouted through
Goel. (2010) Fast incremental and personalized pagerank
many other nodes, acting as encryption layers. The cur-
Proceedings of the VLDB Endowment 4.3: 173-184.
rent implementation of the algorithm treats the action
of relaying equivalently to downloading and then up-
loading the same amount of data, oftentimes leading to
an increase in trustworthiness. This should not be the
case. Relaying should be treated separately from reg-
ular seeding and leeching and therefore also differently
evaluated.
References
[1] andy@torrentfreak.com, (11.02.2018) The Early Days of
Mass Internet Piracy Were Awesome Yet Awful, Tor-
rentFreak
[2] J.A. Johnsen, L.E. Karlsen, S.S. Birkeland, (2005), Peer-
to-peer networking with BitTorrent,
[3] Bravetti, A., & Padilla, P. (2018), An optimal strategy
to solve the Prisoner’s Dilemma, Scientific reports, 8(1),
1948.
[4] B. van den Heuvel, Y. Dai, (2018), Math-
ematics of Trust, Github Repository:
https://github.com/vandenheuvel/mathematics-of-trust
[5] Resnick, Paul, et al. (2000), Reputation systems Com-
munications of the ACM 43.12: 45-45.
[6] Nowak, Martin A. (2006), Five rules for the evolution of
cooperation, science 314.5805 (2006): 1560-1563
[7] Pouwelse, J. A., Garbacki, P., Wang, J., Bakker, A.,
Yang, J., Iosup, A., ... & Sips, H. J. (2008), TRIBLER: a
social-based peer-to-peer system, Concurrency and com-
putation: Practice and experience, 20(2), 127-138
13You can also read