STATE OF RHODE ISLAND AND PROVIDENCE PLANTATIONS DEPARTMENT OF ENVIRONMENTAL MANAGEMENT OFFICE OF AIR RESOURCES - Rhode Island 2018 Annual ...
←
→
Page content transcription
If your browser does not render page correctly, please read the page content below
STATE OF RHODE ISLAND AND PROVIDENCE PLANTATIONS
   DEPARTMENT OF ENVIRONMENTAL MANAGEMENT
             OFFICE OF AIR RESOURCES

Rhode Island 2018 Annual Monitoring Network Plan

             Posted for Public Review on June 28, 2018

               Submitted to EPA on August 24, 2018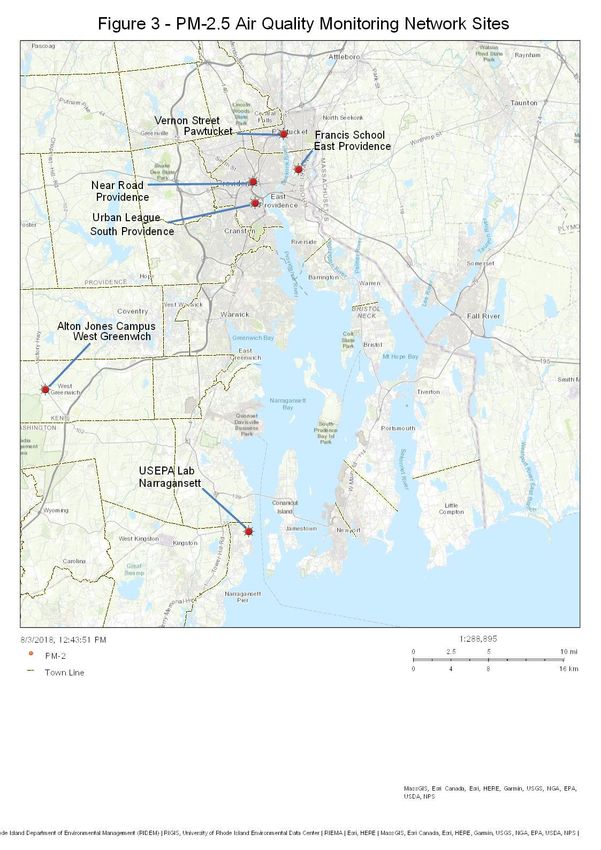
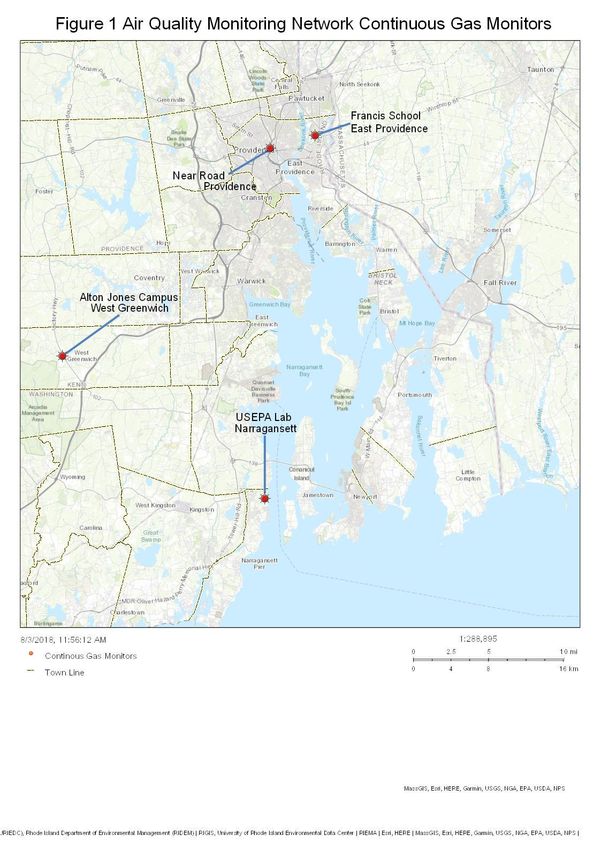
Table of Contents
Section ____ Page Number
Table of Contents.............................................................................................................................3
List of Tables ............................................................................................................... ....................3
Acronyms and Abbreviations...........................................................................................................4
Introduction and Regulatory Background………………………...............................................................5
Rhode Island Monitoring Network………..........................................................................................5
Summary of Proposed Changes in Rhode Island Monitoring Network……………………….…….....….….6
Network Evaluation………………………………..……................................................................................12
Ozone ................................................................................................................................12
Carbon monoxide...............................................................................................................14
Sulfur Dioxide ....................................................................................................................16
Nitrogen Dioxide................................................................................................................17
Particular Matter................................................................................................................19
-PM10 ...................................................................................................................19
-PM2.5…………………………………………………..............................................................20
Speciation Monitoring.......................................................................................................22
Lead (Pb)……………………………………………………………………….……………………………………..……...22
Ozone Precursor Air Toxics Measurements…………………………………….…………………………….22
-PAMS………………………………………………………………….…………………………………..……..23
- PAMS Monitoring Implementation Network Plan………………………………………….24
- Enhanced Monitoring Plans………………………………………………………………………..…28
-Air Toxics………………………………………………………………………………………………...…....32
National Core (NCORE) Multi-pollutant Monitoring Stations Network………....…………..…33
Detailed Site Information………………………………………………………………………………………………………….34
Figure 1 – Air Quality Monitoring Network Continuous Gas Monitors Site Locations…….………...41
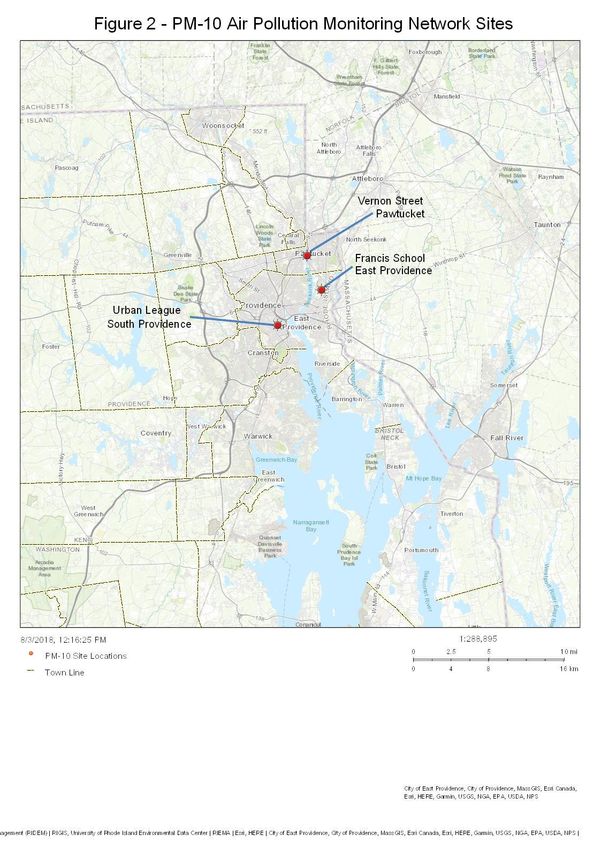
Figure 2 – PM10 Air Pollution Monitoring Network Site Locations…………………………………………...42
Figure 3 – PM2.5 Air Pollution Monitoring Network Site Locations………………….…………………..…..43
Figure 4 – RI Monitoring Network…………………………………………………………………………………………....44
List of Tables
Section Page Number
Table 1-National Ambient Air Quality Standards (NAAQS)…...……………………………………………..…..7
Table 2-Monitoring Site Information…. ….………………………………………………………………………………..9
Table 3- Monitoring Sites…………………………………………………………………………………………………....…10
Table 4-RI Ozone Monitoring Sites………………………………………………………………………………………...12
Table 5-Ozone Design Values (ppb)…………………………………………………………………………………..…..13
Table 6-Carbon Monoxide Monitoring Network…………………………………………………………………....14
Table 7-Sulfur Dioxide Monitoring Network………………………………………………...………………………..16
Table 8-Nitrogen Dioxide Monitoring Network………………………………………………………………..…….17
Table 9-PM10 Monitoring Network………………………………………………………………………………………..19
Table 10-PM2.5 Monitoring Network………………………………………………………................................20
Table 11-PAMS Target Compound List……...…………………………………………...……………………………...26
Table 12- Equipment Inventory East Providence for PAMS Plan…………………………………………..…27
3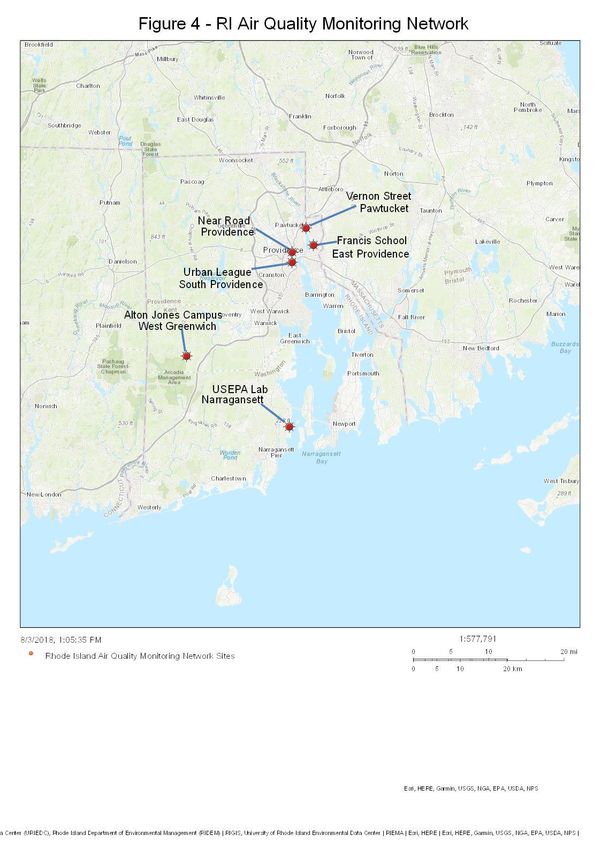
Acronyms and Abbreviations

AIRS-AQS              Aerometric Information Retrieval System - Air Quality System
AQI                   Air Quality Index
BAM                   Beta Attenuation Monitor
CAA                   Clean Air Act
CFR                   Code of Federal Regulations
CO                    Carbon Monoxide
DEM                   Department of Environmental Management (RI)
DOH                   Department of Health (RI)
EIS                   Emissions Inventory System
EMP                   Enhanced Monitoring Plan
EPA                   Environmental Protection Agency
FEM                   Federal equivalent method
FRM                   Federal reference method
GC                    Gas chromatograph
HAPs                  Hazardous air pollutants
MADEP                 Massachusetts Department of Environmental Protection
MDL                   Method detection limit
MSA                   Metropolitan statistical area
NAAQS                 National Ambient Air Quality Standards
NAMS                  National Air Monitoring Station
NATTS                 National Air Toxics Trends Station
NCORE                 National Core Multi-pollutant Monitoring Station
NO2                   Nitrogen dioxide
NOx                   Nitrogen oxides
OAQPS                 Office of Air Quality Planning and Standards
ORD                   Office of Research and Development
OTR                   Ozone Transport Region
PAMS                  Photochemical Assessment Monitoring Stations
PAH                   Polycyclic Aromatic Hydrocarbon
PM10                  Particulate matter < 10 microns
PM2.5                 Particulate matter < 2.5 microns
QAPP                  Quality assurance project plan
O3                    Ozone
SIPs                  State implementation plans
SLAMS                 State and Local Air Monitoring Station
SOP                   Standard operating procedure
SO2                   Sulfur dioxide
STN                   Speciation Trends Network
SVOC                  Semi-Volatile Compound
TSA                   Technical system audit
TSP                   Total suspended particulate
VOC                   Volatile organic compound

                                                                                     4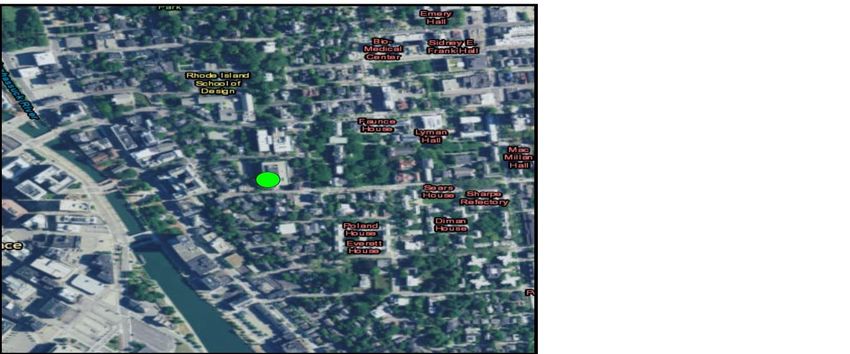
Introduction and Regulatory Background

This document will serve as Rhode Island’s 2018 Annual Monitoring Network Plan, prepared by the Rhode
Island Department of Environmental Management, in accordance with Section 58.10 (a) of Title 40 of the
Code of Federal Regulations (40 CFR 58.10(a)), which requires states to submit a monitoring network plan
to the United States Environmental Protection Agency (EPA) in July of each year. The plan provides a
description of the state’s current monitoring network, demonstrates that the network conforms to EPA
requirements, and discusses any plans to remove or move a monitoring station in the 18 months following
the plan submittal.

In addition, the recently revised monitoring rule (80 FR 65292; October 26, 2015) requires PAMS
measurements June 1 through August 31 at NCORE sites that are in Core-Based Statistical Areas (CBSAs)
with populations of 1,000,000 or more. The Providence, New Bedford, Fall River, RI-MA Statistical Area
qualifies as one of those sites. RIDEM is required to develop an implementation plan for this monitoring
rule. That implementation plan is detailed within this monitoring plan. The Annual Monitoring Network
Plan must be posted for public comment 30 days prior to submittal to the EPA. Additionally, RIDEM is
required to develop and implement Enhanced Monitoring Plans (EMPs) as required by 40 CFR Part 58,
Appendix D, 5.(h), as the state is within the Ozone Transport Region (OTR). This plan is required to be
submitted no later than October 1, 2019. The proposed EMP is detailed within this monitoring plan.

Rhode Island Monitoring Network

The Rhode Island Department of Environmental Management (RIDEM), in conjunction with the Rhode
Island Department of Health (RIDOH), operates a network of air monitoring stations to measure ambient
concentrations of pollutants for which the EPA has established a National Ambient Air Quality Standard
(NAAQS). Those pollutants, which are known as criteria pollutants, include ozone (O3), particulate matter
smaller than 10 microns (PM10), particulate matter smaller than 2.5 microns (PM2.5), nitrogen dioxide
(NO2), sulfur dioxide (SO2), carbon monoxide (CO) and lead. The criteria pollutant monitoring sites are
part of the EPA’s State or Local Air Monitoring Stations network (SLAMS).

In addition, RI DEM and RI DOH monitor ambient levels of toxic air pollutants and of ozone precursors,
which are substances that react in the atmosphere to form ground-level ozone. The State operates one
monitoring site that is part of the National Air Toxics Trends Sites (NATTS) network, one that is part of the
Photochemical Assessment Monitoring Stations (PAMS) network, one that is part of the PM2.5 Speciation
Trends Network (STN) and one that is part of the network of core multipollutant monitoring stations
(NCORE).

Table 1 summarizes the NAAQS and Table 2 lists the locations of the eight air monitoring stations that
operated in the State in 2017 or are currently operating, along with the parameters monitored and
monitoring methods used at each of the sites. Table 3 lists the sites as well as the methods used. The
locations of those sites are shown in Figures 1-4. These sites have been approved by EPA Region 1 as
meeting applicable siting criteria, as specified in Subpart B of 40 CFR Part 58. All criteria pollutants are
monitored, as required in the CFR, using Federal Reference Methods (FRMs) or Federal Equivalent
Methods (FEMs) and monitors are operated according to the procedures specified in Quality Assurance
Project Plans (QAPPs)1 that have been approved by EPA. All sites are located in the Providence-New
Bedford-Fall River, RI-MA Metropolitan Statistical Area (MSA), which encompasses all of Rhode Island as
well as Bristol County in Massachusetts.
                                                                                                           5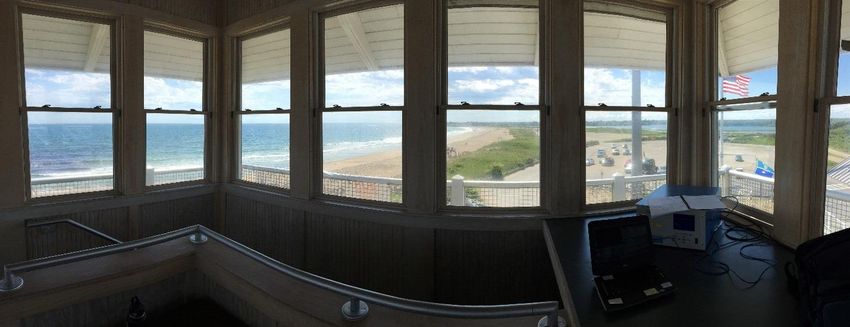
Summary of Proposed Changes in the Rhode Island Monitoring Network

In summary, RI DEM plans to modify the current monitoring network as follows:

    •   RIDEM continues to work towards relocating the PM2.5 FEM monitor and NATTS monitoring activities
        at the current Urban League building to the proposed Community College of Rhode Island (CCRI)
        location by the end of 2018.

    •   RIDEM has ceased all monitoring at the Brown University site as of December 31, 2017.

    •   When necessitated by the progression of highway construction activity to the northbound side of I-95,
        RIDEM will discontinue monitoring at the Near-Road site and will ask EPA’s approval of future Near-
        Road monitoring plans for Rhode Island. Work on the north side of the highway is currently scheduled
        to begin fall 2018 or later.

    •   Operation of the West Greenwich PM10 monitor was discontinued as of December 31, 2017.

    •   RIDEM has discontinued NO2 monitoring at the West Greenwich site as of December 31, 2017.

    •   RIDEM has discontinued the PM2.5 FRM monitor at the West Greenwich site as of December 31, 2017.
        The continuous FEM is the primary monitor.

    •   Due to logistical limitations at the proposed CCRI site at 1 Liston Street, Providence, RI is requesting
        discontinuation of FRM PM2.5 sampling currently at Urban League upon relocation. The FEM PM2.5
        monitor will be the primary and only monitor at the new location. Also, RIDEM will be monitoring
        meteorological parameters with equipment mounted on a shelter, not from a 10-meter tower.

    •   RI DEM has purchased a continuous GC and has deployed that instrument at the East Providence site
        for measuring one-hour speciated VOCs as of June 2017 as required by the PAMS program.

    •   RI DEM will implement the revised PAMS requirements as promulgated in the final ozone NAAQS,
        including the possible expansion of carbonyl monitoring.

    •   RIDEM will implement the EMP prior to June 1, 2019.

    •   The Vernon Street, Pawtucket site, which is adjacent to I-95N, characterizes and records the highest
        PM10 concentrations in the State. Although Vernon Street experiences the highest PM10 values, at no
        point has the site approached the standard. As RIDEM seeks options for cost and workload savings,
        RIDEM proposes the option to discontinue monitoring at Vernon Street during 2018 and start
        reporting PM10 mass measured at the East Providence site.

    •   RIDEM requests a waiver to allow meteorological measurements, in particular mixing height, using the
        ceilometer. It has yet to be determined if the ceilometer will be deployed at the NCORE site located
        in East Providence or the Vernon Street location, located 2.5 miles from East Providence.

RI DEM understands that all network modifications that involve discontinuation or moving of any sites are
subject to EPA approval, even if the remaining network meets EPA’s minimum requirements

1RI DEM and RI DOH, “QAPP for Criteria Pollutants Including Particulates and NCORE Parameters, Revision 1.0,”

approved by EPA October 2017 and “QAPP: Air Toxics and PAMS Monitoring Programs, Revision 6.1,” approved
by EPA October 2017.
                                                                                                              6
Table 1 National Ambient Air Quality Standards (NAAQS)

POLLUTANT                             AVERAGING TIME          PRIMARY STANDARD           SECONDARY STANDARD
 (links to historical tables of
 NAAQS reviews)

Sulfur Dioxide (SO2)               3-HourA                    None                       0.5 ppm (1300 µg/m³)

                                   1-HourB                    0.075 ppm (75 ppb)         None

                                   8-HourA                    9 ppm                      None
Carbon Monoxide (CO)
                                   1-HourA                    35 ppm                     None

Ozone (O3)                         8-HourC                    0.070 ppm (70 ppb)         Same as Primary Standard

Nitrogen Dioxide (NO2)             Annual Arithmetic Mean     0.053 ppm (53 ppb)         Same as Primary Standard

                                   1-HourD                    100 ppb                    None

Particulate Matter (PM10)          24-HourE                   150 µg/m³                  Same as Primary Standard

                                   Annual Arithmetic
                                                              12.0 µg/m³                 15.0 µg/m³
Particulate Matter (PM2.5)         MeanF

                                   24-HourG                   35 µg/m³                   Same as Primary Standard

                                   Rolling 3-Month
Lead (Pb)                                                     0.15 µg/m³                 Same as Primary Standard
                                   AverageH

      Primary standards protect against adverse health effects.
      Secondary standards protect against welfare effects such as damage to crops, vegetation, and buildings.

      A Not
              to be exceeded more than once a year.

      BA
         rule revoking the annual and 24-hour SO2 NAAQS and promulgating a new 1-hour SO2 NAAQS was signed
      on June 2, 2010. To attain the 1-hour NAAQS, the 3-year average of the 99th percentile of the daily maximum
      1-hour average SO2 level at each monitor must not exceed 75 ppb.

      C The
            ozone NAAQS is violated when the average of the 4th highest daily eight-hour concentration measured
      in 3 consecutive years exceeds 0.070 ppm (70 ppb). The 0.070 ppm NAAQS became effective December 28,
      2015.

      D To
           attain the 1-hour NO2 NAAQS, effective January 22, 2010, the 3-year average of the 98th percentile of the
      daily maximum 1-hour average NO2 concentration at each monitor must not exceed 100 ppb.

      E To
          attain the PM10 standard, the 24-hour concentration at each site must not exceed 150 µg/m³ more than
      once per year, on average over 3 years.
      F The primary annual average PM2.5 NAAQS was revised on December 10, 2012. The secondary NAAQS was

      not changed. To attain the PM2.5 annual standard, the 3-year average of the weighted annual means of the
      24-hour concentrations must not exceed the NAAQS value.

                                                                                                                  7
G
 To attain the PM2.5 24-hour standard, the 3-year average of the 98th percentile of 24-hour concentrations
must not exceed 35 μg/m3.

H
 On October 15, 2008, the Pb NAAQS was changed to 0.15 μg/m3 as a rolling 3-month average, not to be
exceeded in a 3-year period.

µg/m³ = micrograms per cubic meter
mg/m³ = milligrams per cubic meter
ppb = parts per billion
ppm = parts per million

                                                                                                        8
Table 2 - Monitoring Site Information
The ambient air monitoring sites currently operated by DEM are listed in the Table 2 below. Detailed
information for each monitoring site is provided in a later section of this plan.
Polycyclic aromatic hydrocarbons
1:6 PM2.5 super SASS (CSN),
VOCs 24 HR Canister ( NATTS, State)
PM10/PM- (Hi Vol), Collocated), 1:6
PM2.5 (FRM), 1:3 (Except AJ 1:6)
PM2.5 Carbon (URG) (CSN),1:3
PM10/PM-Coarse(lo-Vol), 1:3
PM2.5 (FRM, Collocated),1:6
Carbonyls Collocated, 1:12
PM2.5 (Continuous - FEM)
Dew Point / Rel. Humidity
Black Carbon, Collocated
PM10/PM- (Hi Vol), 1:6
Barometric Pressure
VOCs Hourly PAMS
Particle Counter
Solar Radiation
Wind Direction
Carbonyls, 1:6
NO/NO2/NOx
Temperature
UV Radiation
Black Carbon
Precipitation
Wind Speed
Speciation,
Direct NO2
NO/NOy
Ozone
(PAH),
SO2
1:3
CO
Town Site
Vernon
Pawtucket X X X X
Street
Brown
Providence T T
University
USEPA
Narragansett X S X X X
Lab
Myron
East
Francis X X X X X X X X X X X S X X X X X X X X X S S S
Providence
School
Urban X X
Providence X T X X X X X X X X X X X X
League * **
Alton
West
Jones T X T S T X X X X S X S
Greenwich
Campus
Near-
Providence X X X X X
Road Site
X = Existing
T= Terminated in 2017
S= Seasonal Meteorology (June 1-August 31) Seasonal ozone March 1-Sep 30)
* Includes metals
** Includes collocated metals 1:12
9
Table 3: Monitoring Sites

        Site             AQS ID         Latitude        Parameter               Method Of            EPA Method
                                       Longitude        Measured                 Sampling            Designation
   Vernon Trailer       440070026     41.874675            PM2.5                   Lo Vol             Reference
   Vernon Street                      -71.379953           PM10                    Hi Vol             Reference
     Pawtucket                                             VOC             Canisters, GC/FID/MS       Reference
Brown University 10     440070012     41.825556     Oxides of Nitrogen      Chemiluminescence         Reference
  Prospect Street                     -71.405278     Nitrogen Dioxide           (low range)
    Providence
                                                      Sulfur dioxide        Pulsed Fluorescence      Equivalent
**terminated 12/31/17
                                                                                 (low range)
 USEPA Laboratory       440090007      41.4950779         Ozone               U.V. Photometric       Reference
 27 Tarzwell Drive                    -71.4236587          PM2.5           Beta Attenuation/Cont     Equivalent
   Narragansett
                                                       Wind Speed               Anemometer              N/A
                                                      Wind Direction             Wind Vane              N/A
                                                      Temperature               Spot Reading            N/A
Myron Francis School 440071010        41.840920     Oxides of Nitrogen       Chemiluminescence       Reference
 64 Bourne Avenue                     -71.36094      Nitrogen Dioxide            (low range)
   E. Providence                                         NO/NOy              Chemiluminescence        Reference
                                                                                 (low range)
                                                     Carbon Monoxide        Gas Filter Correlation   Equivalent
                                                                                 (low range)
                                                       Sulfur dioxide       Pulsed Fluorescence      Equivalent
                                                                                 (low range)
                                                          Ozone               U.V. Photometric       Reference
                                                           PM2.5                    Lo Vol           Reference
                                                           PM2.5           Beta Attenuation/Cont     Equivalent
                                                      Speciated PM2.5        Speciation Monitor         N/A
                                                    Coarse PM (PM10-2.5)   Lo Vols (PM10 & PM2.5)    Reference
                                                       Black Carbon            Aethalometer             N/A
                                                           VOC              Canisters, GC/FID/MS     Reference
                                                            VOC               Continuous GC           Reference
                                                         Carbonyls           HPLC Cartridges          Reference
                                                        Wind Speed             Anemometer                N/A
                                                      Wind Direction            Wind Vane                N/A
                                                    Barometric Pressure         Barometer                N/A
                                                       Temperature             Spot Reading              N/A
                                                     Relative Humidity          Plastic Film             N/A
                                                      Solar Radiation          Pyranometric              N/A
                                                       UV Radiation          UV Photometric              N/A
                                                       Precipitation        Bucket/Continuous            N/A

                                                                                                       10
Site AQS ID Latitude Parameter Method Of EPA Method
Longitude Measured Sampling Designation
Urban League 440070022 41.807949 PM2.5 Lo Vol Reference
212 Prairie Avenue -71.415103 PM2.5 Beta Attenuation/Cont Equivalent
Providence PM10/Metals Hi Vol Reference
VOC Canisters, GC/FID/MS Reference
Carbonyls HPLC Cartridges Reference
Black Carbon Aethalometer N/A
Semi-volatiles PUF/XAD, GC/MS N/A
Wind Speed Anemometer N/A
Wind Direction Wind Vane N/A
Temperature Spot Reading N/A
Relative Humidity Plastic Film N/A
Particle Count Water Based Condensation N/A
Alton Jones Campus 440030002 41.615600 Ozone U.V. Photometric Reference
Victory Highway -71.719900 VOC Canisters, GC/FID/MS Reference
West Greenwich PM2.5 Beta Attenuation/Cont Equivalent
Wind Speed Anemometer N/A
Wind Direction Wind Vane N/A
Barometric Pressure Barometer N/A
Temperature Spot Reading N/A
Relative Humidity Plastic Film N/A
Solar Radiation Pyranometric N/A
Near-Road Site 440070030 41.829495 Oxides of Nitrogen Chemiluminescence Reference
Hayes and Park Streets -71.417457 Nitrogen Dioxide (low range)
Providence Carbon Monoxide Gas Filter Correlation Equivalent
(low range)
PM2.5 Beta Attenuation/Cont Equivalent
Black Carbon Aethalometer N/A
Particle Count Water Based Condensation N/A
11Network Evaluation
Following is a discussion, by pollutant, of:
• The current monitoring network,
• The NAAQS and a comparison of recent measurements with the NAAQS,
• Whether that network meets EPA’s monitoring criteria,
• Whether new sites are needed,
• Whether any existing sites are no longer needed, and
• Plans for modification of the network in the next 18 months.
Ozone (O3)
The sites in the current ozone monitoring network are listed in Table 4 and Figure 1:
Table 4: Rhode Island Ozone Monitoring Sites
SITE MEASUREMENT MONITORING OBJECTIVE SCHEDULE
SCALE
Alton Jones Regional Upwind background Continuous
Campus Population exposure Ozone Season
Victory Highway March-September
West Greenwich
USEPA Laboratory Regional Population exposure Continuous
27 Tarzwell Drive Ozone Season
Narragansett March-September
Myron Francis Neighborhood Maximum precursor emissions Continuous
School (PAMS, NCORE) impact Year-Round
64 Bourne Avenue Population exposure
E. Providence
The 2015 ozone NAAQS is 70 ppb over an 8-hour average. A site is in violation of that NAAQS when the
average of the 4th highest daily eight-hour ozone concentration measured in 3 consecutive years (the design
value) at that site exceeds 70 ppb.
Ozone design values for Rhode Island sites have decreased over time, but design values increased or remained
constant in 2012 and 2013, as shown in Table 5, and again in 2017. Based on 2009-2011 design values, EPA
designated Rhode Island as unclassifiable/attainment for the 75 ppb NAAQS on April 30, 2012. Note,
however, that the 2009-2011 design values were lower than normal, due to unusually cool temperatures in
the summer of 2009. In the most recent three-year period, 2014-2016, the design values for both the West
Greenwich and Narragansett sites met the 70 ppb NAAQS, while the design value for the E. Providence site
was slightly lower than that standard.
On December 20, 2017, in a letter from Deborah A. Szaro, EPA Region I Acting Regional Administrator, to
Governor Gina Raimondo, EPA preliminarily determined Kent and Washington Counties meet the 2015
ozone standard based on 2014-2016 data. This letter supplemented a prior letter from November 6, 2017
from EPA Administrator Scott Pruitt in which Bristol, Newport, and Providence Counties were designated
12Attainment/Unclassifiable. Therefore, all counties in Rhode Island have been designated as
Attainment/Unclassifiable. Note that the 2015-2017 design values have increased.
Table 5: Ozone Design Values (ppb)
W. Greenwich Narragansett E. Providence
2002 - 2004 87 90 84
2003 - 2005 84 89 82
2004 - 2006 83 85 81
2005 - 2007 86 84 84
2006 - 2008 80 81 82
2007 - 2009 77 77 77
2008 - 2010 71 76 72
2009 - 2011 73 73 71
2010 - 2012 74 78 75
2011 - 2013 74 78 76
2012 - 2014 70 74 73
2013 - 2015 70 73 70
2014- 2016 70 70 68
2015- 2017 72 71 70
Since EPA’s rules require Rhode Island to operate at least two ozone monitors, the State has one more
monitor than the minimum number required. Continued operation of all existing monitors is important for
the following reasons:
• Ground-level ozone levels have generally decreased in the past several years; however, ozone
concentrations in the State continue to reach unhealthy levels on several days each summer, and
13moderate levels on many days. In 2017, there were 6 exceedances of the 8-hour ozone standard,
and 35 days where ozone levels were in the moderate range (8-hour average between 55-70 ppb).
In 2016, there were 13 exceedance days and 42 days in the moderate range. In 2015, there were
10 exceedance days and 31 days in the moderate range.
• EPA has strengthened the ozone NAAQS to 70 ppb to protect public health effective December 28,
2015.
• The three sites represent three distinct geographical areas that are affected by different localized
weather patterns and therefore experience very different ozone levels on some days.
• The availability of real-time ozone data from the three ozone sites enables RIDEM to issue area-
specific health advisories as appropriate and to provide residents with real-time information about
ozone concentrations and associated health risks in their neighborhoods.
In 2011, RIDEM extended ozone monitoring season from April-September to March-October as to match the
monitoring seasons for Massachusetts and Connecticut. EPA had directed a change in ozone season for
those states, per 40 CFR Part 58 Appendix D Table D-3 Ozone Season (March – September). In 2011, ozone
measurements became year-round at the East Providence site, consistent with NCORE requirements.
As part of RIDEM’s EMP, additional ozone monitoring will formally occur during 2019. Please refer to the
EMP section of this monitoring plan for full details.
Carbon Monoxide (CO)
The current CO monitoring network is as shown in Table 6 and on Figure 1. All figures are at the end of the
document.
Table 6: Carbon Monoxide Monitoring Network
SITE MEASUREMENT MONITORING OBJECTIVE SCHEDULE
SCALE
Myron Francis Neighborhood Maximum precursor emissions Continuous
School impact Year-Round
64 Bourne Avenue Population exposure
E. Providence
Near-Road Site Microscale Maximum emissions Continuous
Hayes and Park Near-road Year-Round
Streets
Providence
The NAAQS for CO are:
• 35 ppm as a 1-hour average, not to be exceeded more than once per year (design value is the
highest annual 2nd maximum 1-hour concentration) and
• 9 ppm as an 8-hour average, not to be exceeded more than once per year (design value is the highest
annual 2nd maximum non-overlapping 8-hour concentration)
14The 2017 CO design values for Rhode Island are:
Near Road:
• 2.6 ppm – 1-hour average, 7.4 % of NAAQS
• 1.6 ppm – 8-hour average, 17 % of NAAQS
East Providence:
• 1.3 ppm – 1-hour average, 3.7 % of NAAQS
• 0.9 ppm – 8-hour average, 10 % of NAAQS
The CO NAAQS has not been exceeded in Rhode Island since 1984. Since 2001, all CO levels recorded in Rhode
Island have been in the “Good” category of the EPA’s Air Quality Index (AQI).
EPA’s regulations do not specify a minimum number of CO monitors that must be operated in a state,
except that CO monitoring is required at NCORE sites (40 CFR 58, Appendix D 3(b)) and EPA regulations
require a certain number of CO monitors to be operating near road based upon population. Since the
East Providence site is both a PAMS site and the State’s NCORE site, carbon monoxide monitoring will
continue at that site using a low range monitor, consistent with NCORE requirements.
On August 21, 2011, EPA issued a decision retaining the CO NAAQS at the current levels2. The decision
requires the operation of CO monitors at sites established to comply with the near-road monitoring
requirements specified in the 2010 NO2 NAAQS. Near-road sites are required in all urban areas which, like
the Providence-New Bedford-Fall River, RI-MA MSA, have a population of 1,000,000 or more. Near-road
CO monitoring was not required until January 1, 2017; however, Rhode Island began operating a low-
range CO monitor at a site adjacent to Interstate Route 95 that meets the above near-road specifications
in April 2014.
No changes to the CO monitoring network are planned in the next 18 months.
_____________________________________________________________________________________
2
US EPA, “Review of National Ambient Air Quality Standards of Carbon Monoxide: Final Rule,” Federal Register 76
(169):54294, August 31, 2011. http://www.gpo.gov/fdsys/pkg/FR-2011-08-31/pdf/2011-21359.pdf-Sulfur Dioxide
(SO2)
15With the discontinuation of the Brown University site, the remaining SO2 monitor is as shown in Table 7 and
on Figure 1:
Table 7: Sulfur Dioxide Monitoring Network
SITE MEASUREMENT MONITORING SCHEDULE
SCALE OBJECTIVE
Myron Francis Neighborhood NCORE Continuous
School Year-Round
64 Bourne Avenue
E. Providence
The NAAQS for SO2 are:
• 75 ppb, 1-hour average (primary standard effective June 2, 2010). The design value is the average of
the 99th percentile maximum daily hour measured in 3 consecutive years.
• 0.5 ppm (500 ppb), 3-hour average (secondary standard) not to be exceeded more than once per
year.
The SO2 design values recorded in the last three years (2015 – 2017) in Rhode Island are:
• 6 ppb -- 1-hour average, 8 % of primary NAAQS - Brown monitor
• 4 ppb -- 1-hour average 5 % of primary NAAQS – East Providence monitor
The SO2 NAAQS has never been exceeded in the State. One-hour design values for SO2 have been below 75
ppb, the one-hour NAAQS promulgated in 20103, since 1994. All measurements have been in the “Good”
range of the AQI since 2007. SO2 levels measured at the Brown University monitor in Providence declined
dramatically in 2013, probably due to the increased use of natural gas rather than fuel oil by nearby sources.
EPA’s 2006 amended monitoring regulation requires SO2 monitoring only at NCORE sites. However, the
2010 SO2 NAAQS rule requires at least one SO2 monitor in the Providence-New Bedford-Fall River RI, MA
MSA, which includes all of Rhode Island and Bristol County, Massachusetts. That SO2 monitor must be sited
to meet one or more of the following objectives: (1) characterizing concentrations around emissions
sources, (2) measuring the highest concentrations in an area, (3) determining population exposure, (4)
establishing general background levels and (5) evaluating regional transport.
3
An EPA rule amending the SO2 NAAQS was signed on June 2, 2010. The rule revokes the previous annual and 24-hour
NAAQS and sets a new one-hour average NAAQS at 0.075 ppm (75 ppb). Revisions of monitoring networks consistent
with the requirements in the rule must be in place by January 1, 2013.
16To meet NCORE requirements, RIDEM began operating a low-range SO2 monitor at the East Providence
site in January 2011.The Brown University SO2 monitor was updated to a low-range unit in January 2013.
RI DEM believes that the Brown University and East Providence monitors appropriately characterized
population exposure in the major urban areas in Rhode Island for 2017. RI DEM has discontinued
monitoring at the Brown University site as of December 31, 2017. Since a low-range SO2 monitor is now in
use at the East Providence site, RIDEM believes SO2 monitoring is adequately characterized with the
remaining East Providence monitor.
The State of Massachusetts operates a SO2 monitor in the Providence Warwick RI-MA MSA, in Fall River.
In prior years, the Fall River monitor was determined to be most appropriate for characterizing maximum
SO2 concentrations in the MSA, as it is situated 2 miles southeast of the Brayton Point coal fired power
plant, which was the highest SO2 emission source in the MSA. Emissions historically were substantially
higher than Central Landfill, Rhode Island’s highest emitter. Brayton Point was permanently closed in
May of 2017. With this closure, East Providence is positioned to represent the maximum concentrations
in the MSA, as it is located upwind of the City of Providence.
Nitrogen Dioxide (NO2)
The current NO2 monitoring network is shown in Table 8 and on Figure 1:
Table 8: Nitrogen Dioxide Monitoring Network
SITE MEASUREMENT SCALE MONITORING SCHEDULE
OBJECTIVE
Myron Francis School Neighborhood (PAMS) Population exposure Continuous
64 Bourne Avenue Year-Round
E. Providence
Near-Road Site Microscale Maximum emissions Continuous
Hayes and Park Streets Near-road Year-Round
Providence
In January 2013, NO2 monitors at all sites were replaced with low-range units with the exception of Brown.
The NO2 NAAQS are:
• 100 ppb – 1-hour average (effective January 22, 2010). The design value is the average of the 98th
percentile maximum daily hour measured in 3 consecutive years.
• 0.053 ppm (53 ppb) - annual average
•
The design values for 2015-2017 are:
• 58 ppb – 1-hour average, 58 % of NAAQS – Near Road
• 44 ppb – 1-hour average, 44 % of NAAQS – Brown
• 39 ppb – 1-hour average, 39 % - East Providence
• 9 ppb – 1-hour average, 9 % - West Greenwich
17The annual averages for 2017 are:
• 18 ppb annual average, 33 % of NAAQS – Near Road
• 9 ppb annual average , 16 % of NAAQS – Brown
• 7 ppb annual average, 13 % of NAAQS – East Providence
• 1 ppb annual average, 1 % of NAAQS – West Greenwich (did not meet minimum data capture criteria)
The NO2 NAAQS have never been exceeded in Rhode Island. Since there was no short-term NAAQS for NO2
until the standard was amended in 2010, this pollutant was not used for the Air Quality Index (AQI) before
that date. The amended NO2 NAAQS rule, which was published on February 9, 2010, establishes hourly
concentrations of 54 -100 ppb as the range for a “Moderate” AQI4.
The 2010 amended NO2 NAAQS requires Rhode Island to operate two NO2 monitoring sites, one at “a location
of expected highest NO2 concentrations representing the neighborhood or larger spatial scales” and a second
monitor at a near-road location where maximum microscale-representative concentrations are expected.
Since 1994, Rhode Island has used the Brown University monitor to fulfill the requirement of neighborhood
scale. As of December 31, 2017, RIDEM has ceased operations at the Brown location.
With the closure of Brown, the East Providence location will fulfill the neighborhood monitoring scale for NO2.
To fulfill PAMS requirements, NO2/NOx is also monitored at the East Providence year-round. A low-range
monitor that measures NO and NOy (total reactive nitrogen oxides) has been operated at the East Providence
site since January 2011, consistent with the NCORE requirements.
In April 2014, RIDEM began operating a near-road site on the east side of the Interstate Route 95 near
downtown Providence, monitoring for NO2/NOx, as well as CO, PM2.5 and black carbon to characterize those
pollutants specifically in the near road environment upwind of the highway. Construction of the northbound
highway and bridge, next to where the monitoring shelter is located, is estimated to begin sometime late in
2018, at which time the monitoring site will need to be relocated or discontinued. The construction of the
southbound bridge of Route 95 was completed by the start of 2017.
Although not required under the new regulations, NO2 was previously monitored at West Greenwich during
the PAMS season only. West Greenwich is no longer designated a PAMS site, and NO2 monitoring ceased
operations as of December 31, 2017 as a cost savings measure.
4
USEPA, “Primary National Ambient Air Quality Standards for Nitrogen Dioxide: Final Rule, “FR 75(26):6474, 9 February
2010. http://www.epa.gov/ttn/naaqs/standards/nox/fr/20100209.pdf
18Particulate Matter
Particles smaller than 10 microns (PM10)
The current PM10 monitoring network is as shown in Table 9 and Figure 2:
Table 9: PM10 Monitoring Network
SITE MEASUREMENT MONITORING OBJECTIVE SCHEDULE
SCALE
Vernon Trailer Middle Population exposure 24-hour
Vernon Street 1 in 6 day
Pawtucket
Urban League Neighborhood Population exposure 24-hour
212 Prairie Avenue (NATTS) Highest concentration 1 in 6 day
Providence Co-located 1 in 6
day
Myron Francis School Neighborhood Population exposure 24-hour
64 Bourne Avenue (NCORE) (Lead discontinued 1 in 3 (PM 10-2.5)
E. Providence 6/30/16) and PM10-2.5)
The PM10 NAAQS is:
• 150 µg/m3 – 24-hour average, not to be exceeded more than once per year on average over 3
years (design value is 4th high value in a 3-year period)
The highest value for PM10 recorded at a Rhode Island site for 2017 is:
• 38 µg/m3 – 24-hour average, 25.3 % of NAAQS, recorded at Vernon St.
The PM10 NAAQS has never been exceeded in Rhode Island. Since PM10 is measured using a filter-based
method, results are not immediately available and cannot be used for Air Quality Index calculations. Levels
tend to be highest at the Vernon Street site, which is adjacent to I-95, and higher at the two Providence sites
than at the rural West Greenwich site. PM10 levels appear to have slightly decreased over the past decade.
PM10 is measured at the East Providence NCORE site every sixth day using a lo-vol sampler. The PM10
measurements are used, in conjunction with PM2.5 measurements at that site, for calculating PM10-2.5 levels.
EPA’s monitoring regulations require areas like the Providence-New Bedford-Fall River, RI-MA Metropolitan
Statistical Area (MSA), which has a population greater than 1,000,000 and measured PM10 concentrations
below 80% of the NAAQS, to operate a minimum of 2 - 4 PM10 monitoring sites.
As discussed, PM10 measurements at the East Providence site are used for calculating PM10-2.5 levels and,
since this measurement is required at NCORE sites, PM10 sampling cannot be discontinued at that site.
Similarly, PM10 samples collected at the Urban League site in Providence are analyzed for metals to fulfill
NATTS requirements, so PM10 sampling at that location cannot be discontinued. The rural West
19Greenwich monitor, which previously provided information about background concentrations of PM10 in
Rhode Island, ceased operations on December 31, 2017.
The Vernon St., Pawtucket site, which is adjacent to I-95, characterizes and records the highest PM10
concentrations in the State. Although Vernon street experiences the highest PM10 values, at no point
has the site approached the standard. As RIDEM seeks options for cost and workload savings, RIDEM
proposes the option to discontinue monitoring at Vernon Street during 2018.
Even with the potential closure of Vernon Street, the 2 remaining PM10 monitors will adequately
characterize exposure of the sensitive populations in urban areas to PM10 and fulfills the minimum
requirement of 2 monitors in the Providence-New Bedford-Fall River MSA.
Fine Particulate Matter (Particulate Matter Smaller than 2.5 microns, or PM2.5)
The current Federal Reference Method/Federal Equivalent Method (FRM/FEM) PM2.5 monitoring network
is shown in Table 10 and in Figure 3:
Table 10: PM2.5 Monitoring Network
SITE MEASUREMENT MONITORING SCHEDULE
SCALE OBJECTIVE
Vernon Trailer Middle Population exposure 24-hour, 1 in 3 day FRM
Vernon Street Co –located FRM began
Pawtucket operation 4/1/17
Urban League Neighborhood Population exposure 24-hour, daily
212 Prairie Avenue Highest concentration Continuous FEM
Providence 1 in 3 day FRM sampler
2nd 1 in 6 FRM Terminated
4/1/17 (moved to Vernon)
Myron Francis School Urban Population exposure 24-hour, daily
64 Bourne Avenue Highest concentration Continuous FEM
E. Providence 1 in 3 day
FRM
Alton Jones Campus Regional Population exposure Continuous FEM
Victory Highway General/Background
West Greenwich Regional Transport
USEPA Laboratory Regional Population exposure Continuous FEM
27 Tarzwell Drive
Narragansett
Near Road Site Microscale Near-road Continuous FEM
Hayes and Park Sts.
Providence
Filter-based FRM PM2.5 units are operated as the primary sampler at Vernon and Urban League sites. FEM
continuous PM2.5 monitors are used as the primary samplers at West Greenwich, Narragansett, East
Providence, and the Near-Road site in Providence. Co-located filter-based FRM samplers are operated at
the Vernon and East Providence sites for quality assurance purposes.
20The PM2.5 NAAQS are:
• 35 µg/m3 - 24-hour average (design value is the 3-year average of the 98th percentile 24-hour
concentration)
• 12 µg/m3 - annual average (design value is calculated by averaging the daily concentrations from
each quarter, averaging these quarterly averages to obtain an annual average, and then averaging
the annual averages for three consecutive years)5
The highest PM2.5 values for 2017 are:
• 21.1 µg/m3 – 24-hour average, 60.3 % of NAAQS, recorded at East Providence.
• 8.3µg/m3 – annual average, 69.2 % of NAAQS, recorded at Near Road.
Annual average levels are consistently highest at the Vernon Street site, which is adjacent to I-95, and higher
at the East Providence and the two Providence sites than at the rural West Greenwich site. PM2.5 levels have
decreased over the past decade, although the additional data obtained from the New Road site is higher than
other sites, no conclusion can be made as to whether the levels have decreased over the past decade.
EPA regulations requires a minimum of two PM2.5 Rhode Island monitoring sites to characterize the following:
• Community-wide air quality;
• Background PM2.5 levels in the State; and
• Regional transport of PM2.5.
Although Rhode Island operates more PM2.5 sites than required, each site fulfills a specific information need
or EPA requirement. The West Greenwich site fulfills EPA’s requirements for measurement of background
and regional transport concentrations of PM2.5 into the state. The 24-hour and annual PM2.5 design values for
the Vernon Street, Pawtucket site, which is immediately adjacent to Interstate Rte. 95, tend to be higher than
those at the other sites, so that is considered a maximum impact site. The East Providence monitor cannot
be removed because PM2.5 monitoring is required at NCORE sites, and the Urban League and Narragansett
monitors fulfill the need for air quality data for urban and coastal areas of the State, respectively.
As discussed above, near road PM2.5 monitoring began in April 2014 and will continue until such time that the
site is no longer available, due to scheduled construction. The long-term future of the Urban League building
is unclear, and RIDEM continues working towards a move to the approved location at the Community
College of Rhode Island, Liston Campus. Since CCRI cannot accommodate all the equipment from the
Urban League site, the PM2.5 from that location was moved to Vernon Street for co-locating with the
existing FRM on April 1, 2017.
RIDEM has changed the FEM at the East Providence site to be the primary PM2.5 monitor and use the FEM
and FRM data from that site to evaluate FEM-FRM comparability at Rhode Island sites. The advantages
of using the East Providence, rather than the West Greenwich site for this purpose include:
5
In December 2012, EPA revised the PM NAAQS, reducing the annual average PM2.5 NAAQS from 15 to 12 µg/m3. The
rule left the PM10 NAAQS and the 24-hour average PM2.5 NAAQS and the secondary annual average PM2.5 NAAQS
unchanged.
21• PM2.5 levels at the East. Providence site, although still substantially below the NAAQS, tend to be
higher than those at the West Greenwich site.
• Since the East Providence FRM runs 1 in 3 days, it generates more comparative data than West
Greenwich.
• Historical data has demonstrated that the East Providence FEM and FRM measurements have
better correlation and less bias than is observed at the W. Greenwich site.
Operation of the Near-Road site will be disrupted at some future date when construction activity of the I-
95 northbound bridge begins, at which time RIDEM will notify EPA to discuss future plans for near-road
monitoring. RIDEM changed the PM2.5 FRM sampling frequency from every day, to 1-in-3 at Francis School
and Urban League beginning October 1, 2016. As of April 1, 2017, RIDEM moved the collocated FRM
monitor from the Urban League site to Vernon Street.
Due to budgetary considerations RIDEM discontinued the FRM monitor at Alton Jones as of December 31,
2017. When RIDEM moves the monitoring station from Urban League to its new NATTS location at CCRI
it plans to discontinue the FRM at this new location. No other changes to the PM2.5 network is anticipated
in the next 18 months.
Speciation Monitoring
The EPA’s PM2.5 Speciation Trends Network (STN) is designed to characterize metal, ion and carbon
constituents of PM2.5. In November 2008, the speciation equipment at the Urban League was replaced
by a SASS speciation unit and, in March 2009, a URG carbon sampler began operation at that location as
part of the speciation program. To conform to NCORE requirements, the speciation equipment, including
the carbon sampler, was moved to the East Providence NCORE site in January 2011 and is now being
operated there on a 1-in-3 schedule. Speciation filters are analyzed by an EPA contractor.
Lead (Pb)
As specified in the lead NAAQS rule, sampling of lead was previously conducted on a one-in-six-day
schedule. EPA deleted the requirement to monitor for non-source Pb at NCORE sites from Appendix D of
40 CFR part 58.16 and to allow monitoring agencies to request permission to discontinue non-source
monitoring following the collection of at least 3 years of data at urban NCORE sites. Since ambient lead
monitoring was conducted in the State for more than 3 years and the lead levels were consistently
considerably lower than the NAAQS since the inception of monitoring, RI DEM was granted permission to
discontinue monitoring as of June 30, 2016.
Ozone Precursor and Air Toxics Measurements
Photochemical Assessment Monitoring Stations (PAMS)
The Clean Air Act Amendments of 1990 (CAAA) required serious, severe and extreme ozone nonattainment
areas to establish enhanced monitoring networks to measure ozone and ozone precursors. In response to
that mandate, the US EPA promulgated rules in 1993 that required the establishment of a network of
Photochemical Assessment Monitoring Stations (PAMS) to measure ozone, NOx, volatile organic compounds
(VOCs), carbonyls, and meteorological parameters in serious and above nonattainment areas. This network
was designed to provide comprehensive data on trends in ambient concentrations of ozone and ozone
22precursors and to evaluate the spatial and diurnal variability of those pollutants, in order to track the
formation and transport of ozone across large areas and to evaluate the effectiveness of strategies
implemented to reduce levels of that pollutant.
The EPA rule identified four types of PAMS sites:
• Type 1 sites, located on the upwind side of the nonattainment area and used to characterize background
and transported concentrations of ozone, NOx and VOC;
• Type 2 sites, sited to measure the maximum impact of VOC and NOx emitted in the area;
• Type 3 sites, sited to measure maximum ozone concentrations occurring downwind of the area, and
• Type 4 sites, sited to measure the concentration of ozone, NOx and VOC exiting the area.
Two PAMS sites, including a Type 2 site, were required in each serious and above nonattainment area. At
that time, Rhode Island was designated a serious nonattainment area for the one-hour average ozone
standard, therefore requiring enhanced monitoring and a PAMS network. The Alton Jones monitoring
site in West Greenwich was designated as the State’s Type 1 PAMS site and the East Providence site as
the Type 2 PAMS site. In addition, the Massachusetts Department of Environmental Protection (MA DEP)
operated a site at the Blue Hills Observatory in Milton, Massachusetts (Site ID 25-021-3003) that served as
the Type 1 (upwind) site for the Boston area and as the Type 3 (downwind) site for the Providence area.
The following PAMS pollutants have been monitored in the Rhode Island network:
• 24-hour speciated VOC samples have been collected every sixth day year-round at the Alton Jones
and East Providence sites, VOC samples were collected daily during June, July and August at the East
Providence site. As of June, July and August of 2017, VOC samples were collected hourly at East
Providence using an Auto-GC.
• 24-hour carbonyl samples have been collected every sixth day year-round at the East Providence site.
Eight 3-hour carbonyl samples per day were collected every third day during June, July and August
through 2011 at that site. Note that 3-hour carbonyl samples were required only in nonattainment
areas classified as serious or above for the 8-hour ozone standard. Since Rhode Island has never had
a nonattainment classification higher than “moderate” for that NAAQS, this requirement did not apply
to the State.
• In 2017, NOx was measured continuously March through October at Alton Jones, year-round at East
Providence, and year-round at the MA DEP site in Milton, MA.
• Rhode Island has measured reactive nitrogen oxides (NO and NOy) at East Providence since January
2011 to fulfill NCORE requirements. The new EPA regulations require NO, NOy, true NO2 and mixing
height measurements at required PAMS sites during the ozone season.
• Ozone was measured March through October at the West Greenwich and Narragansett sites since
2011, and monitored March through September beginning in 2017. Ozone has been measured year-
round at East Providence to fulfill NCORE requirements.
23• Surface meteorological parameters are measured at all three Rhode Island sites year-round.
• West Greenwich is no longer designated a PAMS site, and NOx monitoring ceased operations as of
December 31, 2017 as a cost savings measure.
PAMS recently revised monitoring rule (80 FR 65292; October 26, 2015) requirements
The recently revised monitoring rule (80 FR 65292; October 26, 2015) requires PAMS measurements
June 1 through August 31 at NCORE sites that are located in Core-Based Statistical Areas with
populations of 1,000,000 or more. The Providence, New Bedford, Fall River, RI-MA Statistical Area
qualifies as one of those sites. RIDEM is required to develop an implementation plan for this
monitoring rule.
PAMS Monitoring Implementation Network Plan
RIDEM operated two Photochemical Assessment Monitoring Stations (PAMS) sites in the air
monitoring network in 2017, at the West Greenwich and East Providence sites. West Greenwich is
no longer designated a PAMS site.
Network Decision
The NCORE site located at Francis School in East Providence will serve as the location of the required
PAMS site and will measure the following parameters described below. An inventory of equipment
used at the site is provided in Table 13.
Auto GC Decision
Volatile organic compounds (VOCs) – A complete list of the targeted compounds are found in Table
12. For 2018, we will be measuring hourly speciated VOC measurements with an auto-gas
chromatograph (GC) using Chromatotec GC 866 airmo VOC.
Meteorology Measurements Decision
RIDEM will continue to measure wind direction, wind speed, temperature, humidity, atmospheric
pressure, precipitation, solar radiation, and ultraviolet radiation. RIDEM anticipates measuring
mixing height in 2019. The following instrumentation has been in operation to measure the
parameters described above:
Wind speed- Met One 014A
Wind direction – Met One 6929
Temperature and Humidity all in one – Met One 083D
Atmospheric pressure – Met One 091
Precipitation - Met One 370C
Solar radiation – LI-COR LI-200SZ pyranometer sensor
Ultraviolet radiation – EPLAB model TUVR
24RIDEM anticipates operating a ceilometer for determining mixing height, and is currently in the
process of purchasing a ceilometer.
Other Required Measurements
Carbonyls - Carbonyl sampling at a frequency of three 8-hour samples on a 1 in 3 day basis (~90
samples per PAMS sampling season). RIDEM has purchased an ATEC 8000 sampler.
A complete list of the target carbonyl compounds may be found in Table 12. The TO-11A test method,
as used in the National Air Toxics Trends (NATTS)6 program will be used.
Nitrogen Oxides – Will monitor for NO and NOy (total oxides of nitrogen) to fulfill NCore requirements.
True NO2 will be measured June, July, and August as required by PAMS. The true NO2 is required to
be measured with a direct reading NO2 analyzer, cavity attenuated phase shift (CAPS) spectroscopy
or photolytic-converter NOx analyzer. We have not yet purchased a monitor for the true NO2
measurement but plan on purchasing the TAPI T500U (CAPS). NO and NOy will be measured using a
Thermo 42iY.
PAMS Implementation Plan Waiver Requests and Rationale
Meteorological Waiver Request
We request a waiver to allow meteorological measurements, in particular mixing height, using the
ceilometer. It has yet to be determined if the ceilometer will be deployed at the NCORE site located in
East Providence or the Vernon Street location, located 2.5 miles from East Providence.
Rationale for Waiver
This request is precautionary since there may be siting issues beyond our control for this instrument. It is
initially hoped RIDEM will be able to site the ceilometer on the roof of the trailer at East Providence. If
that preferred option is not feasible, there may not be sufficient space and may be permitting issues with
the City of East Providence when trying to place this instrument at the East Providence site beyond the
current footprint of the trailer. The site at Vernon Street has sufficient space and is located 2.5 miles away.
Every effort will be made to place this instrument at the NCORE site, but this waiver is requested to ensure
that the meteorological data can be obtained nearby.
6
See NATTS Technical Assistance Document for TO-11A method
25You can also read