Group and individual level variations between symmetric and asymmetric DLPFC montages for tDCS over large scale brain network nodes - Nature
←
→
Page content transcription
If your browser does not render page correctly, please read the page content below
www.nature.com/scientificreports
OPEN Group and individual level
variations between symmetric
and asymmetric DLPFC montages
for tDCS over large scale brain
network nodes
Ghazaleh Soleimani2, Mehrdad Saviz2*, Marom Bikson3, Farzad Towhidkhah2,
Rayus Kuplicki1, Martin P. Paulus1 & Hamed Ekhtiari1
Two challenges to optimizing transcranial direct current stimulation (tDCS) are selecting between,
often similar, electrode montages and accounting for inter-individual differences in response. These
two factors are related by how tDCS montage determines current flow through the brain considered
across or within individuals. MRI-based computational head models (CHMs) predict how brain
anatomy determines electric field (EF) patterns for a given tDCS montage. Because conventional
tDCS produces diffuse brain current flow, stimulation outcomes may be understood as modulation
of global networks. Therefore, we developed a network-led, rather than region-led, approach. We
specifically considered two common “frontal” tDCS montages that nominally target the dorsolateral
prefrontal cortex; asymmetric “unilateral” (anode/cathode: F4/Fp1) and symmetric “bilateral” (F4/
F3) electrode montages. CHMs of 66 participants were constructed. We showed that cathode location
significantly affects EFs in the limbic network. Furthermore, using a finer parcellation of large-scale
networks, we found significant differences in some of the main nodes within a network, even if there is
no difference at the network level. This study generally demonstrates a methodology for considering
the components of large-scale networks in CHMs instead of targeting a single region and specifically
provides insight into how symmetric vs asymmetric frontal tDCS may differentially modulate
networks across a population.
Transcranial direct current stimulation (tDCS) is a non-invasive brain stimulation (NIBS) method based on
passing a low-intensity current (e.g. 1–2 mA) from an anode to a cathode electrode at specific scalp l ocations1–3.
Neuromodulation effects of tDCS are electrode position (montage) specific and are understood to reflect a com-
bination of different mechanisms of action from the c ellular4–7 to the large-scale functional network scale8–11.
Despite the effectiveness of tDCS, one major limitation is inter-individual differences in r esponse12–14. The
intensity and distribution current flow through the brain, reflected in the electric field (EF) magnitude across the
brain, is one main reason hypothesized for the individual v ariations15–19. Computational head models (CHMs)
are anatomically accurate models, validated by intracranial recording20,21, physiological17, and imaging studies22,23
that can estimate EFs as a function of stimulation dose and brain s tructure24.
An overarching consideration in optimizing tDCS is dose selection, specifically the electrode montage, cur-
rent intensity, and duration. Stimulation intensity25, stimulation duration26, and electrode characteristics27 can
categorically impact tDCS outcomes. Notably, it has been reported that changing the position of the so-called
“return” or “reference” electrode, will impact brain-wide current flow and outcomes of t DCS2,28,29.
The majority of previous computational modeling research to study the effects of electrode location was based
on whole-brain or anatomical regions of interest (ROIs) a nalysis30–33. However, brain regions do not operate, or
respond to brain stimulation, in isolation and many distributed regions interact with each other through the brain
networks9,34–36. As such, to effectively determine the mechanistic effects of tDCS, rather than concentrating on
1
Laureate Institute for Brain Research (LIBR), Tulsa, OK, USA. 2Biomedical Engineering Department, Amirkabir
University of Technology (Tehran Polytechnic), Tehran, Iran. 3Department of Biomedical Engineering, City College
of New York of CUNY, New York, NY, USA. *email: msaviz@aut.ac.ir
Scientific Reports | (2021) 11:1271 | https://doi.org/10.1038/s41598-020-80279-0 1
Vol.:(0123456789)
www.nature.com/scientificreports/
any given brain regions as currently pursued in modeling studies, the network-led approach for EF comparison
in the brain may represent a more productive strategy when comparing stimulation montages.
In a recent s tudy37, Fischer et al. suggested that the results of stimulating a brain target may be strengthened
or weakened by other brain regions that work together with the targeted region as a network. They hypothesized
that modulation of one brain region may impact and be impacted by other regions through the networks and
designed a novel multifocal electrode array at the subject-level that stimulate left M1 with excitatory effects, but
simultaneously inhibit activity in other remaining nodes of the motor cortex network. Their network approach
for placement of the electrodes showed a greater impact on M1 excitability than stimulating just left M1 a lone37.
In another study, through a group-level analysis of computational models, Gomez and his colleagues used a
functional atlas for parcellation of the cerebellum. They investigated how the current spreads in the cerebel-
lum networks and reported significant differences between various electrode arrangements for stimulating the
cerebellum38. However, none of the studies have taken into account the anatomical differences among subjects’
brain variability yet and it remains unclear how much the electrode location can change EF distribution patterns
across nodes of large-scale functional networks in a group of subjects with different anatomy.
To bridge this gap, in the present study, we advance a systematic pipeline to investigate EFs inside the brain
networks in a group of subjects. We have used structural data from a population with methamphetamine use dis-
orders (MUDs) for generating CHMs. Two of the most common electrode montages for modulating the DLPFC
were simulated39; an asymmetric “unilateral” montage and a symmetric “bilateral” montage. Our approach allows
identifying affected nodes in large-scale functional networks in the standard space and will be insightful for
developing hypotheses on the network modulatory effects we should expect. The results of this study provide a
better understanding of the network-based EF distribution patterns of the montages targeting DLPFC and can
be used for guiding the selection of electrode arrangements for future network-based modulation of the brain.
Methods and materials
Participants and data acquisition. Participants included 66 subjects (all-male, mean age ± standard
deviation (SD) = 35.86 ± 8.47 years ranges from 20 to 55) with methamphetamine use disorder (MUD). All sub-
jects were recruited during their early abstinence from the 12&12 residential drug addiction treatment center in
Tulsa, Oklahoma in the process of a clinical trial to measure the efficacy of tDCS on methamphetamine craving
(ClinicalTrials.gov Identifier: NCT03382379). None of the participants had a history of neurological disorders,
head injury, or other abnormalities demonstrated by sMRI. Written informed consent was obtained from all
participants prior to the scans and the study was approved by the Western IRB (WIRB Protocol #20171742).
After receiving each subject’s written consent, structural MRIs were obtained on a GE MRI 750 3T scanner. High
resolution structural images were acquired through magnetization-prepared rapid acquisition with gradient-
echo (MPRAGE) sequence using the following parameters: TR/TE = 5/2.012 ms, FOV/slice = 24 × 192/0.9 mm,
256 × 256 matrix producing 0.938 × 0.9 mm voxels and 186 axial slices for T1-weighted images and TR/
TE = 8108/137.728 ms, FOV/slice = 240/2 mm, 512 × 512 matrix producing 0.469 × 0.469 × 2 mm voxels and 80
coronal slices for T2-weighted images. Gyri-precise CHMs were generated from a combination of high-resolu-
tion T1- and T2-weighted MR images for 52 subjects. For a subset of participants (N = 14), T2-weighted MRIs
were not available and head models were created only based on T1 images. This study was conducted in accord-
ance with the Declaration of Helsinki and all methods were carried out in accordance with relevant guidelines
and regulations.
Creation of head models and tDCS simulation. The flow diagram of the modeling and data extraction
pipeline is briefly shown in Fig. 1. Head models were generated for all of the subjects to visualize how current
flows through the brain in each individual. Modeling of the EF distribution patterns was performed using the
standard SimNIBS 3.08 p ipeline40. Automated tissue segmentation was performed in SPM 12 combined with
CAT12 toolbox via the SimNIBS “headreco” function. The head volume was assigned to six major head tissues
including white matter (WM), gray matter (GM), cerebrospinal fluid (CSF), skull, scalp, and eyeballs. Segmen-
tation results were visually examined slice-by-slice to ensure correct tissue classifications. Segmented surfaces
were used to create tetrahedral volume meshes and about 3 × 10⁶ elements were assigned to each head model.
Two of the most widely studied tDCS conventional electrode montages for targeting DLPFC were simu-
lated; bipolar asymmetric and bipolar symmetric a rrangements41. For both montages, 5 cm × 7 cm rectangular
pads with 1 mm thickness were generated virtually. In the first montage, as a bipolar asymmetric arrangement
(F4–Fp1), the anode electrode was positioned over the F4 electrode location on the standard 10–20 EEG inter-
national system with the long axis of the pad pointing towards the vertex of the head. The cathode electrode was
positioned over the contralateral eyebrow (Fp1 EEG electrode site also referred to as the supraorbital position)
with the long axis of the pad parallel to the horizontal plane. In the second montage, symmetric bipolar (F4–F3),
anode and cathode electrodes were respectively placed over F4 and F3 electrode locations on EEG standard
system with the long axis of the pads pointing towards the vertex. The locations and directions of the anodes
are thus similar in both configurations and the only difference between montages is the position of the cathode
electrodes. In order to have the same electrode placement for all participants, we manually placed electrodes in
the SimNIBS simulation window to precisely check the electrode location and orientation for each individual.
For the electrode location, we used the standard EEG cap (EEG10-10_UI_Jurak_2007) for each subject to place
electrodes over F3, F4, or Fp1. In order to have a similar electrode orientation among the population, we visually
checked the orientation for each individual. We visualized simulation results in “Gmsh” software, one by one,
to make sure that all subjects have similar electrode placement in terms of electrode location and orientation.
These arrangements are also referred to as unilateral and bilateral montages in DLPFC s timulation42,43 under the
assumption the cathode is functionally inert for the asymmetric (unilateral) case.
Scientific Reports | (2021) 11:1271 | https://doi.org/10.1038/s41598-020-80279-0 2
Vol:.(1234567890)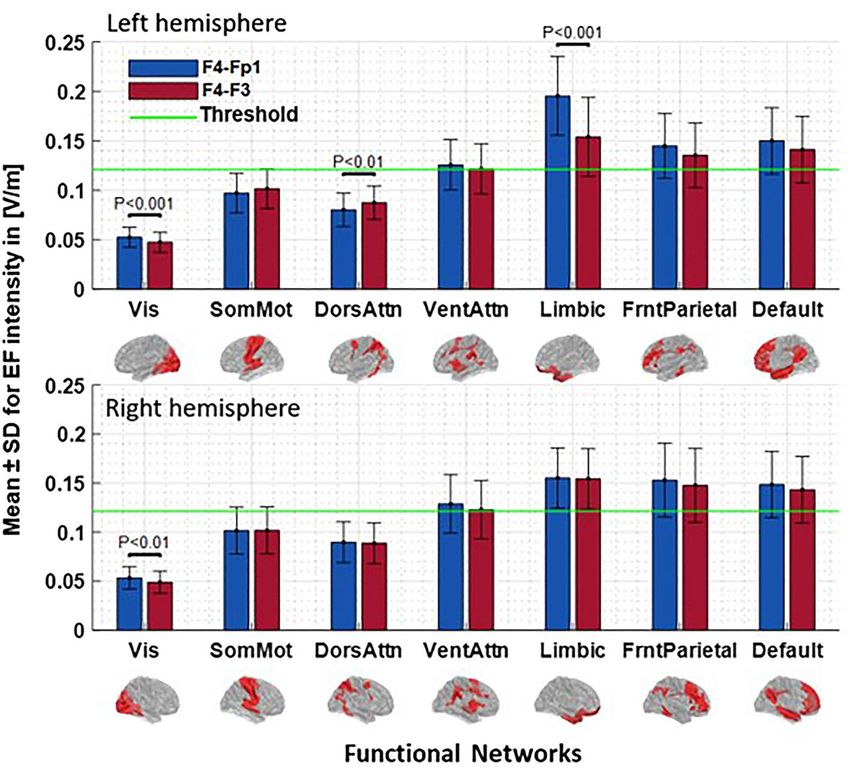
www.nature.com/scientificreports/
Figure 1. Data extraction flow diagram: (A) Using T1- and T2-weighted MR images for creating CHMs
based on segmentation of the structural images into five tissue types. (B) Mesh generation for simulation of
two typical conventional electrode montages in stimulation of the DLPFC; anode–cathode in montage1: F4–
Fp1 and in montage 2: F4–F3 in 10–20 EEG standard system with 5 × 7 cm2 electrode pads in 2 mA current
intensity. (C) Modeling of EF distribution patterns for all of the participants (66 subjects) based on FEM
method. (D) Normalization of individualized EFs to standard fsaverage space. (E) Calculation of strength and
normal component of EFs in fsaverage space for group level analyses. (F) Using resting-state functional atlas
for extracting EFs from brain networks in CHMs. (G) Comparing two montages at the level of brain networks
by considering a predefined EF threshold inside the networks. CHMs computational head models, FEM finite
element modeling, EF electric field.
After electrode placement, the simulations were run with a current amplitude of 2 mA and EFs were calcu-
lated based on the finite element method (FEM). To generate CHMs, electrical conductivities were assumed to
be constant. The assigned isotropic conductivities were based on the previously reported values; WM = 0.126,
GM = 0.275, CSF = 1.654, skull = 0.010, skin = 0.465, eyeballs = 0.5 all in S/m (siemens/meter)44. The results were
visualized using G msh45 and MATLAB (version 2019b, The Math Works, Inc.). The absolute values of the EFs
(|EF|) were calculated at each brain node. In order to make the individualized EF maps comparable, the simula-
tion results for all subjects/montages were transformed from the original native space to the standard average
surface (‘fsaverage’) of FreeSurfer (http://surfer.nmr.mgh.harvard.edu). In this way, the same coordinates in
different subjects correspond to the same location in CHMs. This normalization makes statistics possible at the
group-level and allowing for the comparison of the EF distribution patterns between two montages.
Data analysis. Functional atlas parcellation was used for comparing EFs in two montages as distributed
over large-scale brain networks. Yeo7-2011 surface-based atlas was used for extracting the topology of the seven
resting-state large-scale networks including visual (Vis), somatomotor system (SomMot), dorsal attention (Dor-
sAttn), ventral attention (VentAttn), limbic system (Limbic), executive control network (ECN), and default mode
network (DMN)46. Since each parcellated network in Yeo7 atlas covered a widely distributed area, we applied
Schaefer-100 atlas to CHMs for extracting the finer sub-regions of each functional n etwork47 to determine the
amount of current reaching different parts within a network. We then merged the areas that were placed adjacent
to each other to form the main nodes of the networks. Left VentAttn was divided into four main nodes includ-
ing tempro-occipital-parietal (TempOccPar), frontal-operculum-insula (FrOperIns), prefrontal cortex (PFC;
DLPFC node), and medial (Med) nodes. Right VentAttn network parcellated into three sub-networks including
TempOccPar, FrOperIns, and Med nodes. The limbic network has two main nodes in each hemisphere including
orbito-frontal cortex (Limbic-OFC) and temporal pole (Limbic-TempPole) nodes. The main nodes in the left
and right ECN were tempro-parietal (ECN-TempPar), ECN-PFC, and precuneus cingulate (ECN-PcunCing).
DMN was also divided into three main nodes in each hemisphere including DMN-TempPar, DMN-PFC, and
precuneus posterior cingulate cortex (PcunPCC).
In the next step, the spatial grouped-average EFs as an indicator of modulation intensity was calculated in
all of the networks and inter-individual variabilities across the subjects were quantified by standard deviations
(SDs). To exclude the networks with low average tDCS-induced EFs from the further analyses in the next steps,
we defined a threshold. 99th percentile of the EF (an indicator of hotspot inside the brain) was calculated for each
subject and, inspired b y19, 50% of the lowest 99th percentile among participants was defined as the threshold.
Subsequent calculations and comparisons were only performed at networks with mean tDCS EF magnitude
higher than this threshold.
For statistical analysis, t-tests were used to examine significant differences between the two montages.
Averaged EFs in each parcellated regions were compared between the two arrangements. False discovery rate
(FDR) correction was used to correct P-values as necessary to overcome the multiple comparisons problem and
P-value < 0.05 was considered to be significant. All data reported as mean ± standard deviation (SD).
Scientific Reports | (2021) 11:1271 | https://doi.org/10.1038/s41598-020-80279-0 3
Vol.:(0123456789)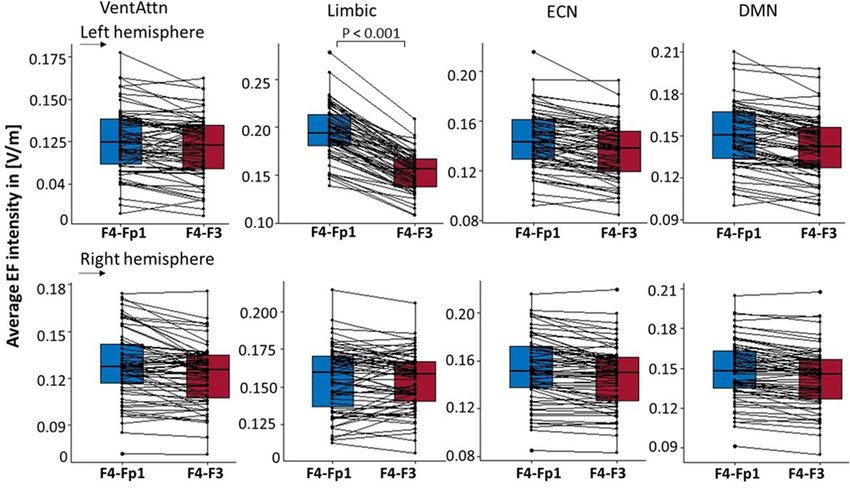
www.nature.com/scientificreports/
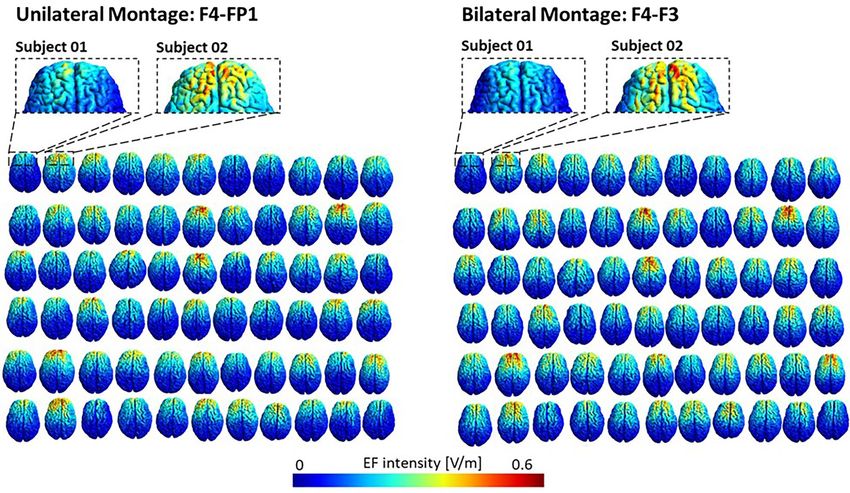
Figure 2. Individualized computational head models: Electric field distribution patterns of 66 participants for
DLPFC stimulation with the anode over F4, cathode over the supraorbital area (F4–Fp1 montage) for unilateral
montage and anode over F4, cathode over F3 for bilateral montage in subject native space. A current of 2 mA is
used in the stimulation.
Figure 3. 99th percentile of the electric field in whole-brain analysis: Boxplots show the median of the 99th
percentile and interquartile ranges of the electric fields in the whole-brain analysis. Dots represent the data for
individual subjects. Results are reported for both montages F4–Fp1 (in blue) and F4–F3 (in red) montages.
Results
Surface-based CHMs were simulated for 66 participants with F4–Fp1 and F4–F3 montages. Personalized CHMs
for F4–Fp1 and F4–F3 montages over all subjects are available in Fig. 2 which indicates a visible variation in
tDCS induced EFs within a montage among participants.
The spatial global maximum was calculated in the whole brain for each individual as an indicator of the EF
hotspot. As shown in Fig. 3, a considerable variability for maximum EF is found among subjects but there is no
significant difference between F4-Fp1 (0.41 ± 0.07 V/m; range from 0.28 to 0.58) and F4-F3 (0.39 ± 0.07 V/m;
range from 0.25 to 0.59) montages in terms of global maximum EF.
For group-level analysis, the individual EFs were transformed into the standard fsaverage template. Transfor-
mation to standard space underestimated the global peak on average by 0.3%, showing that peaks are smoothed
Scientific Reports | (2021) 11:1271 | https://doi.org/10.1038/s41598-020-80279-0 4
Vol:.(1234567890)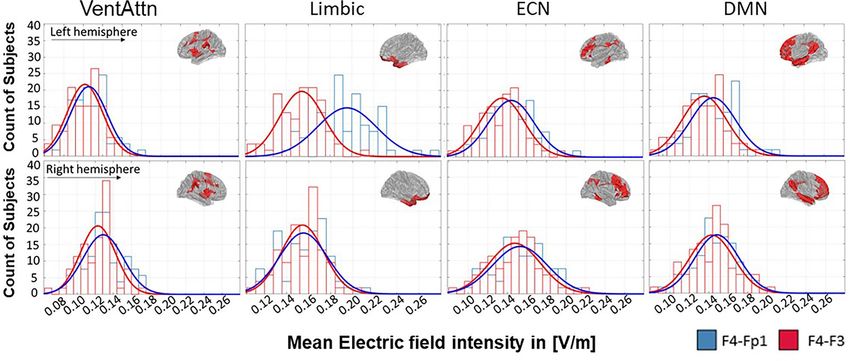
www.nature.com/scientificreports/
Figure 4. Parcellation of the average EF intensity at a current of 2 mA generate by each montage for the
large-scale brain networks. Bars show mean value and error bars show SD of the EF intensity in volt per meter
([V/m]) across the 66 participants in each large-scale network of Yeo7-2011 atlas for F4–Fp1 (blue bars) and
F4–F3 (red bars) electrode montages in the left (first row) and right hemisphere (second row). Labels below
the horizontal axis determine the name of each network in Yeo7 parcellation and small brains next to the labels
represent each network in fsaverage space. Significant differences between the two montages are shown above
the bars based on the t-test with FDR correction threshold at P < 0.05. The horizontal green line indicates EF
threshold (50% minimum value of 99th percentile of EFs in whole-brain analysis across the subjects). EF electric
field, SD standard deviation, FDR false discovery rate, Vis visual network, SomMot somatomotor network,
DorsAtn dorsal attention network, VentAtn ventral attention network, Limbic limbic system network, ECN
executive control network, DMN default mode network.
a little in the transformation to standard space. Group-averaged EF among 66 participants in standard space
can be found in Fig. 1 part (E) for both montages and it can be found that the highest EF intensity occurs in the
frontal lobe.
Results at the network level. Figure 4 represents the amount of mean EF intensity at seven large-scale
brain networks in the right and left hemispheres. The exact amount of mean EF intensity and P values for
each network are available in Table S1 in Supplementary Materials. The results show that, regardless of mon-
tage choice here, the highest EF is produced in limbic system (F4–Fp1: left = 0.1955 ± 0.04, right = 0.155 ± 0.03;
F4–F3: left = 0.1540 ± 0.03, right: 0.1544 ± 0.03) and lowest EF can be found in visual network (F4–Fp1:
left = 0.0523 ± 0.01, right = 0.0532 ± 0.01; F4–F3: left = 0.0473 ± 0.01, right = 0.0488 ± 0.01) in both montages. In
the left hemisphere, differences between two montages were statistically significant in Vis (PCorrected < 0.01), Dor-
sAttn (PCorrected < 0.01), and Limbic (PCorrected < 0.001) networks. In the right hemisphere, the difference between
the two montages was significant only in Vis (PCorrected < 0.01) network. Based on the predefined threshold, as
shown with a green horizontal line in Fig. 4, tDCS induced EFs in Vis, SomMot, and DorsAttn networks are not
above the threshold. Therefore, the left Limbic is the only network that has a significant difference between the
two montages and EF intensity crosses the threshold in this network. Inspired by19, we considered 50% of the
lowest peak as a threshold (Th = 0.125 V/m) to exclude the networks with low average EFs from further analyses
in the next steps. The threshold is now represented by the horizontal green line in all of the bar graphs.
Inspired by previous group-level CHM s tudies19,31,32,48–51, we transformed all of the personalized CHMs
to the standard space. Distortion of the EFs by transformation to the standard space can be a challenge in the
group-level analysis of CHMs. To make sure that transformation did not highly affect our results we replicated
our pipeline in the subject-space (using atlas-based parcellation in the subject-space instead of extracting EFs
Scientific Reports | (2021) 11:1271 | https://doi.org/10.1038/s41598-020-80279-0 5
Vol.:(0123456789)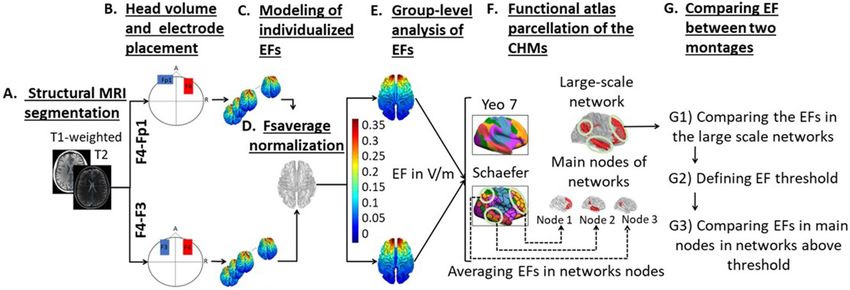
www.nature.com/scientificreports/

                                            Figure 5.  Distribution of the EF in the large-scale brain networks that receive EFs above the threshold.
                                            Distribution of the EF intensity in volt per meter ([V/m]) are represented for F4–Fp1 (blue line) and F4–F3 (red
                                            line) electrode montages in the left (first row) and right (second row) hemisphere. VentAtn ventral attention
                                            network, Limbic limbic system network, ECN executive control network, DMN default mode network.

                                            from standard space) for a part of our results. We compared our subject-space results with standard-space and
                                            we found no significant differences between these two methods at the group-level (Fig. S1). We also checked the
                                            results subject by subject and we found that there are very slight differences between EFs extracted from ROIs
                                            in the subject space compared to the standard space (Fig. S2) without reaching to any statistical significance
                                            threshold.
                                                The extent of inter-individual variability in the EF was calculated by average induced EF in each network
                                            that can be assumed to be normally distributed (Shapiro–Wilk test P > 0.05). Figure 5 shows the corresponding
                                            histograms for F4–Fp1 (blue) and F4–F3 (red) montages over 66 participants in the left and right hemispheres.
                                            Histograms display inter-individual variability in each subject’s mean EF in the targeted network. We present
                                            the distribution of the EF strength in the networks above the threshold and results showed that inter-individual
                                            variance is relatively high in all of the networks. Except for the left Limbic, for all other networks, we found a
                                            relatively similar distribution in both montages.
                                                Furthermore, inter-individual differences between subjects in the range of EF alterations by changing the
                                            electrode montage are represented in Fig. 6.

                                            Results at the sub‑network level. According to the results of the network analysis in the previous step,
                                            we showed that applied EFs in the four networks are above the threshold value. In Fig. 7, average EFs intensi-
                                            ties in the main nodes of these networks are represented separately for each hemisphere. The numerical values
                                            of averaged EFs in each node can be found in Table S2 in the Supplementary Materials. As indicated in Fig. 7,
                                            in most areas, the EF intensity generated by F4–Fp1 montage is higher than F4–F3. Statistical results indicate
                                            that there is no significant difference between the two montages in the nodes with EF above the threshold in the
                                            right hemisphere. Nonetheless, in the left hemisphere there are some main nodes with significant differences
                                            between two montages including FrOperIns (F4–Fp1: 0.1514 ± 0.03, F4–F3: 0.1385 ± 0.03; P < 0.01) node in Ven-
                                            tAttn, OFC (F4–Fp1: 0.2474 ± 0.05, F4–F3: 0.1953 ± 0.04; P < 0.001) and TemPole (F4–Fp1: 0.1342 ± 0.03, F4–F3:
                                            0.1073 ± 0.02; P < 0.001) in Limbic, and ECN-PFC (F4–Fp1: 0.1937 ± 0.04, F4–F3: 0.1661 ± 0.04; P < 0.001) that
                                            received EFs above the threshold values.

                                            Discussion
                                            In this study, we modeled the network selectivity of two tDCS protocols (F4–Fp1 “unilateral” and F4–F3 “bilat-
                                            eral” montages) that are commonly used for stimulating DLPFC. We tested the individual head models for the
                                            electric field (EF) at the group level to examine which parts of the large-scale brain networks are most likely to
                                            be stimulated by considering two conventional electrode montages. We showed that the placement of the cath-
                                            ode electrode can significantly change EF distribution patterns in specific nodes in large-scale networks even if
                                            there is no significant difference in the whole brain network. We found that in the F4–Fp1 montage, the limbic
                                            system network in the left hemisphere receives a significantly higher electrical dose. Within the network nodes,
                                            frontal-operculum-insula nodes in the ventral attention network, orbitofrontal cortex and temporal pole in the
                                            limbic system, and DLPFC node in the executive control network significantly receive higher EFs by F4–Fp1
                                            arrangement.
                                                Figure 2 visualizes the inter-individual variability in the EFs. A wide range of variation in the EF distribu-
                                            tion patterns over 66 participants supports the previous findings on the importance of considering the indi-
                                            vidual computational head modeling (CHM)18,32,38,51. Individualized head models for a group of subjects with

          Scientific Reports |   (2021) 11:1271 |                https://doi.org/10.1038/s41598-020-80279-0                                                 6

Vol:.(1234567890)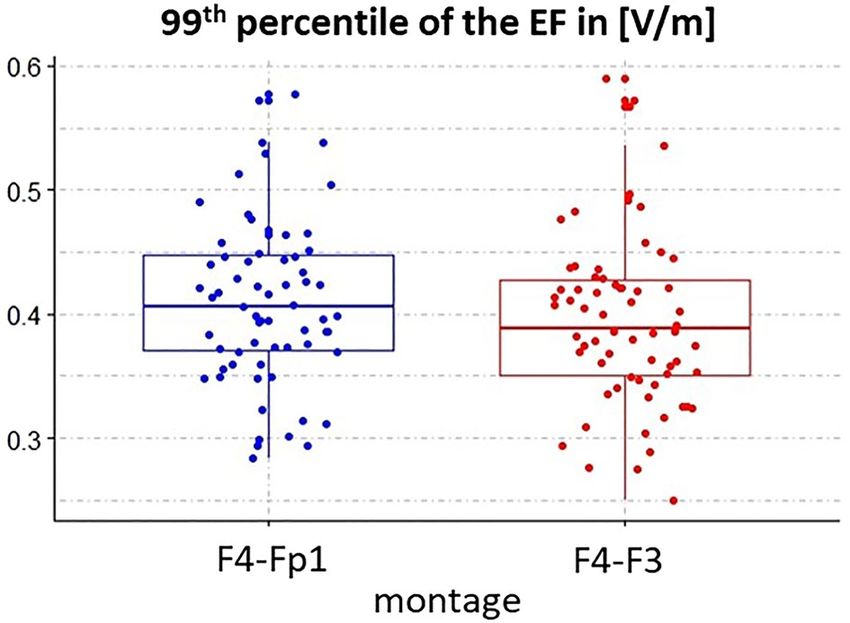
www.nature.com/scientificreports/
Figure 6. Group-averaged EF intensity for two montages: F4–Fp1 (blue) and F4–F3 (red). Average EF intensity
calculated for all 66 subjects inside the large-scale brain networks; first row for left and second row for the right
hemisphere. Results are visualized for the networks with average EF above the threshold. Boxplot showing
the effects of electrode montage on averaged EF intensity in [V/m] (n = 66 each). Dots represent the data for
individual subjects. Significant P values after FDR correction for between montage differences are reported
above boxplots. VentAtn ventral attention network, Limbic limbic system network, ECN executive control
network, DMN default mode network.
surface-based registration to standard template allowed us to use standard functional atlas parcellation for
network-level analysis of the head models.
In this work, we extracted the EF intensity inside the large-scale brain networks and their nodes (Figs. 4, 7).
Calculation of EF intensity in brain regions requires a decision about which EF measures (e.g. maximum, aver-
age, median) are appropriate to use. Gomez et al. by using network parcellation of the cerebellum reported that
in contrast to maximum, functional network analysis becomes important when average EF is u sed38.
Our results conform with previous computational modeling studies that cathode location has a significant
impact on EF distribution p atterns49,52. Previous findings reported that the effects of tDCS depend on the loca-
tions of both active and reference e lectrodes28,30.
Our results indicate that among the networks with EF intensity above the defined threshold, the differences
between the two montages were significant only in the left limbic system. Cathode locations in both arrangements
are spatially close but nonetheless cathode over the left orbit is closer to the orbitofrontal cortex (OFC) than
cathode over left DLPFC (F3). Therefore, F4–Fp1 induced higher EFs than F4-F3 inside this region as the main
node of the limbic system. Besides between montage differences, as shown in Fig. 4, we also observed within
montage variance in terms of averaged EFs inside a network (Figs. 5, 6). For instance, by changing the electrode
location from the left supraorbital area to F3 according to the 10–20 EEG electrodes placement standard, there
were some subjects whose EFs changed extremely little or oppositely compared to the grouped-average results.
For example, changes of EFs in the left limbic system, that showed a significant difference between two montages,
range from − 2 × 10⁻⁵ to 6.9 × 10⁻² [V/m] and there is one person (1.5% of total participants) whose EFs changed
in opposite direction compared to the grouped-average EFs. However, EF changes in the right limbic system
range from − 2.8 × 10⁻² to 1.7 × 10⁻², and there are 19 subjects (28.8% of total participants) whose EFs changed
in opposite direction compared to the grouped-average. With respect to previous simulation studies, these
inter-individual variations in EF distribution patterns could be explained by different anatomical factors that
can change the actual current received by different parts of the cerebral cortex14,44,51. The current distribution of
the tDCS is influenced by microarchitectural features of the brain and variation in the cortical anatomy such as
gyrus and sulcus patterns can change induced EFs between individuals53,54.
EF calculations in the main nodes are depicted in Fig. 7 and numerical results can be found in Table S2 in
Supplementary Materials. According to the brain’s compensatory response to intervention through the neural
networks, a simple hypothesis is that modulating multiple nodes of a network would be more effective than
modulating a single node in that network55. As shown in Fig. 7, the intensity of the induced EFs in distinct
nodes of a network is different. Grouped-average EF intensity is weak in some nodes in a network since they
Scientific Reports | (2021) 11:1271 | https://doi.org/10.1038/s41598-020-80279-0 7
Vol.:(0123456789)www.nature.com/scientificreports/
Figure 7. EF intensity in the main nodes of the large-scale brain networks at a current of 2 mA generate by
each montage. Bars show mean values and error bars represent SDs of the EF intensity in volt per meter ([V/m])
across 66 participants inside the main nodes of large-scale networks for F4–Fp1 (blue bars) and F4–F3 (red
bars) electrode montages in the left and right hemisphere of each network. Each network in Yeo7-atlas that
received EFs above the threshold including (A) ventral attention network, (B) limbic system network, (C)
executive control network, and (D) default mode network parcellated into subregions based on Schaefer201
8_100Parcells_7networks atlas and main nodes of each network were extracted by averaging the EFs in the
subregions of the main nodes. Labels below the horizontal axis denote the name of main nodes inside the large-
scale network and small brains next to the labels represent the spatial location of the main nodes in fsaverage
space. Significant differences between the two montages are shown above the bars based on the t-test with FDR
correction threshold at P < 0.05. The horizontal green line indicates EF threshold (50% minimum value of the
99th percentile of EFs in whole-brain analysis across the subjects). EF electric field, SD standard deviation, FDR
false discovery rate, VentAtn ventral attention network, Limbic limbic system network, ECN executive control
network, DMN default mode network, OFC orbitofrontal cortex, TempPole temporal pole, TempPar Tempro-
parietal, PFC prefrontal cortex, PcunCing precuneus-cingulate cortex, PcunPCC precuneus-posterior cingulate
cortex.
are located farther from stimulating electrodes. For example, DLPFC, as the main node of the executive control
network (ECN) was targeted in both montages in our simulations. This node was named ECN-PFC in Fig. 7 and
received the highest EF inside the network. Statistical results indicated that induced EF by F4–Fp1 in DLPFC
was significantly higher than F4–F3. However, EF intensity in other parts of the ECN, precuneus-cingulate, and
temporal-parietal nodes, is considerably low. This opens potentials for multifocal tDCS montages stimulating
etwork37.
all parts of a specific distributed n
We also found that the PFC node in the DMN network received the highest EFs inside the networks and the
amount of EFs in other nodes of this network is considerably low. The results from a tDCS-fMRI study conducted
Scientific Reports | (2021) 11:1271 | https://doi.org/10.1038/s41598-020-80279-0 8
Vol:.(1234567890)www.nature.com/scientificreports/
by Shahbabie et al. demonstrated that application of bilateral DLPFC with the anodal electrode over right DLPFC
(same as F4–F3 montage in this study) decreases functional connectivity in DMN especially in posterior parts
of the network including the middle temporal gyrus, right precuneus, and right PCC56. As represented in Fig. 7,
our calculations showed that temporoparietal and PCC nodes in DMN received a small amount of EFs. Perhaps
a significant diminishing in functional connectivity of these nodes reported by Shahbbie et al. is related to low
EF intensity in these nodes that have not yet been investigated.
Other than ECN-PFC, analysis of the main nodes revealed that, although the left limbic system is the only
network that shows a significant difference between two montages, however, frontal-operculum-insula node in
the ventral attention network and orbitofrontal cortex and temporal pole nodes in the limbic system all in the
left hemisphere are significantly different between these two montages.
These significant differences may become a matter based on the stimulation goal. For example, the frontal
operculum in the ventral attention network is a key node in the cognitive control system. In a combined TMS-
fMRI study, it was reported that the frontal operculum regulated the level of activity in the occipitotemporal
cortex. By applying TMS, they found that stimulation of this region decreased top-down selective attentional
modulation in the occipitotemporal cortex57. Based on our calculations, F4–Fp1 generated significantly higher EF
inside this node of the ventral attention network. Therefore, it might be a more effective montage than F4–F3 for
stimulating frontal-operculum-insula which is important in human cognitive tasks including directed attention
tasks. However, this is an empirical question for future trials.
As shown in Fig. 7, both OFC (within the limbic network) and DLPFC (PFC node in ECN) were stimulated
strongly regardless of electrode montage and greater EFs induced by the F4–Fp1 arrangement. These two nodes
play important role in different cognitive functions such as decision-making behavior and inhibitory control.
A previous tDCS study compared the effects of unilateral (i.e., F4–Fp1 or F3–Fp2) and bilateral (i.e., F4–F3 or
F3–F4) DLPFC stimulation on risk-taking and decision-making behaviors. Similar to our simulations, they
used 5 × 7 large electrode pads and the current strength was 2 mA. They reported that based on Balloon Analog
Risk Task (BART) as a measure of risk-taking propensity, bilateral stimulation of the DLPFC (anode–cathode
over F4–F3 or F3–F4), compared to sham, significantly reduced risk-taking behavior. While no statistically sig-
nificant difference in risk-taking score was discovered between sham and unilateral D LPFC43. In a tDCS-fMRI
study neural effects of bilateral tDCS (F3–F4) on risk-taking behavior during BART task were examined. The
authors reported that whole-brain connectivity of right DLPFC (under anodal electrode) correlated negatively
with risk-taking aversion. It was also reported that OFC activity is negatively correlated with risk and pop rates
in the BART task58. However, the authors have not investigated the relationships between the induced EFs by
unilateral or bilateral montages and neural/behavioral outcomes. Testing the effect of higher levels of EFs in ECN
and the limbic system generated by unilateral stimulation compared to the bilateral montage, that we found in
our simulations, in relationship with neural and behavioral outcomes might give us a better understanding of
the underlying mechanism of actions.
Previous research also showed that bilateral stimulation of DLPFC can affect the brain in a different way
compared to unilateral stimulation during the temporal discounting task. The temporal discounting task is a
measure of risky decision making, subjective value judgments, and the ability to delay gratification. No change in
temporal delay discounting with bilateral tDCS over DLPFC was described b y59. However, the unilateral DLPFC
stimulation (F3–Fp2) modulated temporal discounting rate60. Future tDCS studies on cognitive functions criti-
cally depend on OFC and DLPFC activities like emotion, motivation, reward or valence p rocessing61 may like
to consider the effect of inter-montage and intra-individual variations in induced EFs inside these nodes and
their corresponding network on neural and behavioral outcomes based on the analysis pipeline and the initial
findings we have introduced in this study.
Limitations and future direction
Our study has some limitations that could be addressed in future research. The main limitation is that our results
are purely based on simulation. We did not consider other outcome measures such as neural activity/connectiv-
ity or behavioral outcomes. We considered averaged EF as an indicator of stimulation intensity. Open questions
remain about how to relate EFs with behavioral or neurophysiological changes. The relationship between EF
intensity and neural/behavioral responses is not a trivial matter and there is still no clear understanding of the
underlying tDCS mechanism of action at the network l evel62. Integrating EF modeling and neuroimaging infor-
mation such as functional connectivity that incorporates the interactions within and between large-scale func-
tional networks can provide for a better understanding of tDCS effects in terms of dose–response relationships.
For example, Esmaeilpour et al. reported a significant correlation between EF obtained from CHMs and changes
in fMRI s ignals62. Kasten et al. revealed a direct link between EF variability and alpha band frequency changes
as a proxy indicator of neural activity in a transcranial alternative current stimulation (tACS) study combined
with MEG23. Combining CHMs with neuroimaging data provide critical insights about tDCS mechanistic effects.
However, it is still in an early stage of development and more analysis is needed to increase our understanding
of induced EFs and tDCS outcomes in general.
Furthermore, we did not consider network interaction in our analysis pipeline. To our best knowledge, there
is no published attempt to find the relationships between induced EFs and interaction between networks that
have a critical role in cognitive processes yet. For instance, previous tDCS studies in the treatment of addictive
disorders showed potential effects by targeting networks known to be dysregulated in SUDs such as ECN for
executive control and DMN for internal r uminations63. These two functional networks typically act in counter-
balanced order. The hypothesis is that by applying anodal stimulation to DLPFC the level of activity/connectivity
should be increased in ECN while it should be decreased in DMN64. The results from an fMRI study conducted
by Shahbabie et al. demonstrated that application of bilateral DLPFC with the anode electrode over right DLPFC
Scientific Reports | (2021) 11:1271 | https://doi.org/10.1038/s41598-020-80279-0 9
Vol.:(0123456789)www.nature.com/scientificreports/
(F4–F3) decreases functional connectivity in DMN especially in posterior parts of the network including the
middle temporal gyrus, right precuneus, and right PCC56. As represented in Fig. 7, our calculations showed that
temporoparietal and PCC nodes in DMN receive a small amount of EFs in F4–F3 montage. Integrating CHMs
with functional data at the network level can shed light on how large-scale functional networks interact with
each other by applying tDCS.
Although we calculated EFs in the main nodes of the networks, it is remained unclear which nodes outside
the DLPFC are actually important for enhancing tDCS effects on intervention outcomes. The contribution of
EF intensity in each part of the network with tDCS outcomes is ambiguous and there is not enough evidence to
conclude which nodes should be stimulated, and which ones should be inhibited to enhance stimulation outcome
measures. More physiological and behavioral information is needed to find a relationship between the main
components of the networks and tDCS inter-individual responses. This unresolved question would be critical,
especially for optimal dose selection and dose customization.
Furthermore, in this study, we only simulated conventional large electrode pads to determine induced EFs
at the network-level. Focal stimulation of the network nodes in a group of subjects by using conventional elec-
trodes is difficult. Our study suggests that the probability of interaction between large-scale networks should be
considered more carefully using conventional tDCS. Stimulating many nodes of different networks because of
the diffusivity of the current makes complexities in modeling the network level contribution in the conventional
tDCS montages. Using protocols that produce more focal stimulation such as high-definition (HD)24, or multi-
array electrodes could potentially provide the possibility to control modulatory effects at the network l evel37. In
this context, simulation of the HD and multi-array electrodes might bring new insights for the network-level
analysis of CHMs.
Another limitation is that our simulations are focused on EF intensity (magnitude of the EF) inside the
networks, which is informative of the EF strength. In the current study, we ignored EF components radial to the
cortical surface (normal components of the EF), which is informative of EF direction. The normal component
of the EF, which is perpendicular to the cortical surface, reflects injected current either entering or leaving the
cortex. Previous researches suggest that this component causes polarity-specific effects including facilitatory
(anodal like) or inhibitory (cathodal like) e ffects5.
Atlas-based parcellation provides information from a group of subjects that may be different from the per-
son’s resting-state functional networks. Parcellation of CHMs based on the individual’s functional connectivity
might be more accurate to determine EFs inside the main nodes of large-scale-networks. Furthermore, we have
only focused on the organization of large-scale distributed networks obtained from the atlas of resting-state
(task-independent) functional networks. Calculation of the EFs according to task-evoked connectivity was not
considered in the present study. Investigation of the induced EFs over task-based networks may help to target
central brain regions that play pivotal roles in the task performance. For example, a previous study showed that
under anodal tDCS (F7–Fp2 montage), during a word generation task, changing connectivity in a given task-
related network provides the basis for enhanced neural efficiency in highly specific brain areas critical for task
performance. These areas might be located under the stimulation site or distant connected r egions65. These find-
ings suggest that induced EFs in the major hubs of the task-related network may help understand the mechanistic
effects of tDCS. Moreover, targeting main hubs in the task-related networks and functionally connected regions
using CHMs may increase the effectiveness of tDCS during task performance since it is hypothesized that tDCS
acts on the networks and brain regions concurrently active.
EF modeling in this study is performed based on many assumptions. We used previously established iso-
tropic conductivities for tissues, as is common in computational studies. Suh et al. reported that the anisotropic
skull and WM conductivities significantly affect EF distribution p atterns66. However, Shahid et al. revealed that
anisotropy does not modulate significant changes in comparisons across montages67. As mentioned in another
study, modeling anisotropy is important when considering deeper target regions inside the brain68. Furthermore,
our tissue conductivities were completely static, and we did not consider the effects of applying current on tis-
sue conductivities. As mentioned i n42, electrodes, tissue, and their interfaces are not merely resistive and can be
changed by the applied current intensity that may vary over time. However, these nonlinear effects have not yet
been considered in tDCS modeling studies so far.
Next, we used automatic tissue segmentation and outcomes are strongly dependent on the quality and resolu-
tion of T1 and T2-weighted images. However, the quality of segmentation results was evaluated visually slice-
by-slice to ensure correct tissue classifications. Furthermore, warping from native space to standard fs average
space may cause a certain degree of information loss, but it’s necessary for group-level analysis.
Future work is needed to determine whether induced EFs in the main nodes of the large-scale brain net-
works link to changes in neural activities. It should be investigated that when a single brain region is targeted
for stimulation, how other nodes of that region’s network and main components of the other networks interact
with the targeted area. Combining CHMs with neuroimaging and behavioral data provides potential insights
for understanding how induced EFs interact with the functional activity of the brain at the network level and
when stimulation becomes more effective based on current density inside the main components of the net-
works. Our simulation results from a group of participants with MUDs could be integrated with their clinical
and physiological data to determine interindividual variations. Additionally, it would be possible to propose a
customized montage by considering the initial state of each individual (e.g. functional connectivity or behavioral
measurements at the baseline) and distribution of the current in personalized CHMs. Such effects have not yet
been incorporated into previous brain stimulation modeling studies.
Scientific Reports | (2021) 11:1271 | https://doi.org/10.1038/s41598-020-80279-0 10
Vol:.(1234567890)www.nature.com/scientificreports/
Conclusion
In this study, we showed that how current flows through the large-scale networks based on group-level analysis
of CHMs. In addition to inter-individual variability, we showed that the spread of the EFs in main nodes of the
large-scale networks was significantly different between two similar electrode montages for DLPFC stimulation
and cathode location can change EF distribution patterns at the network-level especially in the limbic system.
The calculation of EFs in the networks and main nodes would be informative since brain stimulation is a network
phenomenon. Knowledge about functional connectivity within and between large-scale networks and the EF
distribution inside the brain networks might help to resolve ambiguity about how much tDCS effects spread
across the brain. The proposed method in this study suggests that a network parcellation of CHMs at the group-
level can be used in future studies to understand how tDCS affects large-scale networks and how the results
might vary depending on inter-individual variations and electrode arrangements.
Data availability
The raw database and CHMs generated for this study are available on request to the corresponding author.
Code availability
EF intensity results and MATLAB codes can be found here https://osf.io/3ukbc/.
Received: 7 May 2020; Accepted: 14 December 2020
References
1. Priori, A. et al. Polarization of the human motor cortex through the scalp. NeuroReport 9(10), 2257–2260 (1998).
2. Nitsche, M. A. & Paulus, W. Excitability changes induced in the human motor cortex by weak transcranial direct current stimula-
tion. J. Physiol. 527(3), 633–639 (2000).
3. Nitsche, M. A. & Paulus, W. Sustained excitability elevations induced by transcranial DC motor cortex stimulation in humans.
Neurology 57(10), 1899–1901 (2001).
4. Fritsch, B. et al. Direct current stimulation promotes BDNF-dependent synaptic plasticity: Potential implications for motor learn-
ing. Neuron 66(2), 198–204 (2010).
5. Rahman, A. et al. Cellular effects of acute direct current stimulation: Somatic and synaptic terminal effects. J. Physiol. 591(10),
2563–2578 (2013).
6. Cancel, L. M. et al. Direct current stimulation of endothelial monolayers induces a transient and reversible increase in transport
due to the electroosmotic effect. Sci. Rep. 8(1), 1–13 (2018).
7. Kronberg, G. et al. Direct current stimulation boosts Hebbian plasticity in vitro. Brain Stimul. 13(2), 287–301 (2020).
8. Lang, N. et al. How does transcranial DC stimulation of the primary motor cortex alter regional neuronal activity in the human
brain? Eur. J. Neurosci. 22(2), 495–504 (2005).
9. Peña-Gómez, C. et al. Modulation of large-scale brain networks by transcranial direct current stimulation evidenced by resting-
state functional MRI. Brain Stimul. 5(3), 252–263 (2012).
10. Polanía, R., Nitsche, M. A. & Paulus, W. Modulating functional connectivity patterns and topological functional organization of
the human brain with transcranial direct current stimulation. Hum. Brain Mapp. 32(8), 1236–1249 (2011).
11. Reato, D. et al. Low-intensity electrical stimulation affects network dynamics by modulating population rate and spike timing. J.
Neurosci. 30(45), 15067–15079 (2010).
12. Chew, T., Ho, K.-A. & Loo, C. K. Inter-and intra-individual variability in response to transcranial direct current stimulation (tDCS)
at varying current intensities. Brain Stimul. 8(6), 1130–1137 (2015).
13. Wiethoff, S., Hamada, M. & Rothwell, J. C. Variability in response to transcranial direct current stimulation of the motor cortex.
Brain Stimul. 7(3), 468–475 (2014).
14. Li, L. M., Uehara, K. & Hanakawa, T. The contribution of interindividual factors to variability of response in transcranial direct
current stimulation studies. Front. Cell. Neurosci. 9, 181 (2015).
15. Caulfield, K. A. et al. Transcranial electrical stimulation motor threshold can estimate individualized tDCS dosage from reverse-
calculation electric-field modeling. Brain Stimul. 57, 1–46 (2020).
16. Datta, A. et al. Individualized model predicts brain current flow during transcranial direct-current stimulation treatment in
responsive stroke patient. Brain Stimul. 4(3), 169–174 (2011).
17. Edwards, D. et al. Physiological and modeling evidence for focal transcranial electrical brain stimulation in humans: A basis for
high-definition tDCS. Neuroimage 74, 266–275 (2013).
18. Gomez-Tames, J., Asai, A. & Hirata, A. Significant group-level hotspots found in deep brain regions during transcranial direct
current stimulation (tDCS): A computational analysis of electric fields. Clin. Neurophysiol. 131(3), 755–765 (2020).
19. Mikkonen, M. et al. TMS motor thresholds correlate with TDCS electric field strengths in hand motor area. Front. Neurosci. 12,
426 (2018).
20. Huang, Y. et al. Measurements and models of electric fields in the in vivo human brain during transcranial electric stimulation.
Elife 6, e18834 (2017).
21. Opitz, A. et al. Physiological observations validate finite element models for estimating subject-specific electric field distributions
induced by transcranial magnetic stimulation of the human motor cortex. Neuroimage 81, 253–264 (2013).
22. Jog, M. V. et al. In-vivo imaging of magnetic fields induced by transcranial direct current stimulation (tDCS) in human brain using
MRI. Sci. Rep. 6(1), 1–10 (2016).
23. Kasten, F. H. et al. Integrating electric field modelling and neuroimaging to explain variability of low intensity tES effects. BioRxiv
186, 126 (2019).
24. Datta, A. et al. Gyri-precise head model of transcranial direct current stimulation: Improved spatial focality using a ring electrode
versus conventional rectangular pad. Brain Stimul. 2(4), 201–207 (2009).
25. Esmaeilpour, Z. et al. Incomplete evidence that increasing current intensity of tDCS boosts outcomes. Brain Stimul. 11(2), 310–321
(2018).
26. Monte-Silva, K. et al. Induction of late LTP-like plasticity in the human motor cortex by repeated non-invasive brain stimulation.
Brain Stimul. 6(3), 424–432 (2013).
27. Opitz, A. et al. On the importance of precise electrode placement for targeted transcranial electric stimulation. Neuroimage 181,
560–567 (2018).
28. Bikson, M. et al. Electrode montages for tDCS and weak transcranial electrical stimulation: Role of “return” electrode’s position
and size. Clin. Neurophysiol. 121(12), 1976 (2010).
Scientific Reports | (2021) 11:1271 | https://doi.org/10.1038/s41598-020-80279-0 11
Vol.:(0123456789)www.nature.com/scientificreports/
29. Nitsche, M. A. et al. Shaping the effects of transcranial direct current stimulation of the human motor cortex. J. Neurophysiol.
97(4), 3109–3117 (2007).
30. Bai, S. et al. A computational modelling study of transcranial direct current stimulation montages used in depression. Neuroimage
87, 332–344 (2014).
31. Csifcsák, G. et al. Effects of transcranial direct current stimulation for treating depression: A modeling study. J. Affect. Disord. 234,
164–173 (2018).
32. Laakso, I. et al. Electric fields of motor and frontal tDCS in a standard brain space: A computer simulation study. Neuroimage 137,
140–151 (2016).
33. Russell, M. J. et al. Sex and electrode configuration in transcranial electrical stimulation. Front. Psychiatry 8, 147 (2017).
34. Keeser, D. et al. Prefrontal transcranial direct current stimulation changes connectivity of resting-state networks during fMRI. J.
Neurosci. 31(43), 15284–15293 (2011).
35. Meinzer, M. et al. Transcranial direct current stimulation in mild cognitive impairment: Behavioral effects and neural mechanisms.
Alzheimer’s Dementia 11(9), 1032–1040 (2015).
36. Reithler, J., Peters, J. & Sack, A. Multimodal transcranial magnetic stimulation: Using concurrent neuroimaging to reveal the neural
network dynamics of noninvasive brain stimulation. Prog. Neurobiol. 94(2), 149–165 (2011).
37. Fischer, D. B. et al. Multifocal tDCS targeting the resting state motor network increases cortical excitability beyond traditional
tDCS targeting unilateral motor cortex. Neuroimage 157, 34–44 (2017).
38. Gomez-Tames, J. et al. Group-level and functional-region analysis of electric-field shape during cerebellar transcranial direct
current stimulation with different electrode montages. J. Neural Eng. 16(3), 036001 (2019).
39. Dedoncker, J. et al. A systematic review and meta-analysis of the effects of transcranial direct current stimulation (tDCS) over the
dorsolateral prefrontal cortex in healthy and neuropsychiatric samples: Influence of stimulation parameters. Brain Stimul.n 9(4),
501–517 (2016).
40. Thielscher, A., A. Antunes, and G.B. Saturnino. Field modeling for transcranial magnetic stimulation: A useful tool to understand the
physiological effects of TMS? In 2015 37th annual International Conference of the IEEE Engineering in Medicine and Biology Society
(EMBC) (IEEE, 2015).
41. Nasseri, P., Nitsche, M. A. & Ekhtiari, H. A framework for categorizing electrode montages in transcranial direct current stimula-
tion. Front. Hum. Neurosci. 9, 54 (2015).
42. Bikson, M. et al. Transcranial electrical stimulation nomenclature. Brain Stimul. 12, 1349 (2019).
43. Fecteau, S. et al. Activation of prefrontal cortex by transcranial direct current stimulation reduces appetite for risk during ambigu-
ous decision making. J. Neurosci. 27(23), 6212–6218 (2007).
44. Opitz, A. et al. Determinants of the electric field during transcranial direct current stimulation. Neuroimage 109, 140–150 (2015).
45. Geuzaine, C. & Remacle, J. F. Gmsh: A 3-D finite element mesh generator with built-in pre-and post-processing facilities. Int. J.
Numer. Method Eng. 79(11), 1309–1331 (2009).
46. Thomas Yeo, B. et al. The organization of the human cerebral cortex estimated by intrinsic functional connectivity. J. Neurophysiol.
106(3), 1125–1165 (2011).
47. Schaefer, A. et al. Local-global parcellation of the human cerebral cortex from intrinsic functional connectivity MRI. Cereb. Cortex
28(9), 3095–3114 (2018).
48. Kasten, F. H. et al. Integrating electric field modeling and neuroimaging to explain inter-individual variability of tACS effects. Nat.
Commun. 10(1), 1–11 (2019).
49. Mikkonen, M. et al. Cost of focality in TDCS: Interindividual variability in electric fields. Brain Stimul. 13(1), 117–124 (2020).
50. Laakso, I. et al. Can electric fields explain inter-individual variability in transcranial direct current stimulation of the motor cortex?
Sci. Rep. 9(1), 1–10 (2019).
51. Laakso, I. et al. Inter-subject variability in electric fields of motor cortical tDCS. Brain Stimul. 8(5), 906–913 (2015).
52. Kessler, S. K. et al. Dosage considerations for transcranial direct current stimulation in children: A computational modeling study.
PLoS ONE 8(9), e76112 (2013).
53. Bikson, M., Rahman, A. & Datta, A. Computational models of transcranial direct current stimulation. Clin. EEG Neurosci. 43(3),
176–183 (2012).
54. Datta, A. Inter-individual variation during transcranial direct current stimulation and normalization of dose using MRI-derived
computational models. Front. Psychiatry 3, 91 (2012).
55. Chase, H. W. et al. Transcranial direct current stimulation: A roadmap for research, from mechanism of action to clinical imple-
mentation. Mol. Psychiatry 25, 1–11 (2019).
56. Shahbabaie, A. et al. Transcranial DC stimulation modifies functional connectivity of large-scale brain networks in abstinent
methamphetamine users. Brain Behav. 8(3), e00922 (2018).
57. Higo, T. et al. Distributed and causal influence of frontal operculum in task control. Proc. Natl. Acad. Sci. 108(10), 4230–4235
(2011).
58. Weber, M. J. et al. Prefrontal transcranial direct current stimulation alters activation and connectivity in cortical and subcortical
reward systems: A tDCS-fMRI study. Hum. Brain Mapp. 35(8), 3673–3686 (2014).
59. Kekic, M. et al. The effects of prefrontal cortex transcranial direct current stimulation (tDCS) on food craving and temporal
discounting in women with frequent food cravings. Appetite 78, 55–62 (2014).
60. Nejati, V., Salehinejad, M. A. & Nitsche, M. A. Interaction of the left dorsolateral prefrontal cortex (l-DLPFC) and right orbitofrontal
cortex (OFC) in hot and cold executive functions: Evidence from transcranial direct current stimulation (tDCS). Neuroscience
369, 109–123 (2018).
61. Peterson, E. & Welsh, M. C. The development of hot and cool executive functions in childhood and adolescence: Are we getting
warmer? In Handbook of Executive Functioning (eds Naglieri, J. & Goldstein, S.) 45–65 (Springer, New York, 2014).
62. Esmaeilpour, Z. et al. Methodology for tDCS integration with fMRI. Hum. Brain Mapp. 41, 1950 (2019).
63. Ekhtiari, H. et al. Transcranial electrical and magnetic stimulation (tES and TMS) for addiction medicine: A consensus paper on
the present state of the science and the road ahead. Neurosci. Biobehav. Rev. 108, 114 (2019).
64. Spreng, R. N. et al. Intrinsic architecture underlying the relations among the default, dorsal attention, and frontoparietal control
networks of the human brain. J. Cogn. Neurosci. 25(1), 74–86 (2013).
65. Meinzer, M. et al. Electrical brain stimulation improves cognitive performance by modulating functional connectivity and task-
specific activation. J. Neurosci. 32(5), 1859–1866 (2012).
66. Suh, H. S., Lee, W. H. & Kim, T.-S. Influence of anisotropic conductivity in the skull and white matter on transcranial direct current
stimulation via an anatomically realistic finite element head model. Phys. Med. Biol. 57(21), 6961 (2012).
67. Shahid, S. S. et al. The value and cost of complexity in predictive modelling: Role of tissue anisotropic conductivity and fibre tracts
in neuromodulation. J. Neural Eng. 11(3), 036002 (2014).
68. Wagner, S. et al. Investigation of tDCS volume conduction effects in a highly realistic head model. J. Neural Eng. 11(1), 016002
(2013).
Scientific Reports | (2021) 11:1271 | https://doi.org/10.1038/s41598-020-80279-0 12
Vol:.(1234567890)You can also read