A Hungarian and Ukrainian Competitors' Network: A Spatial Network Analysis Perspective - MDPI
←
→
Page content transcription
If your browser does not render page correctly, please read the page content below
Article
A Hungarian and Ukrainian Competitors’ Network:
A Spatial Network Analysis Perspective
György Jóna
 Department of Social Sciences, University of Debrecen, 4400 Nyíregyháza, Hungary;
 jona.gyorgy@foh.unideb.hu; Tel.: +36-42-404-411

 Received: 6 August 2018; Accepted: 22 September 2018; Published: 25 September 2018

 Abstract: In this paper, the spatial dimensions of a transboundary, coopetitive (coopetition:
 cooperation of rivals) network, established by restaurant owners, are scrutinized empirically by
 applying advanced toolkits of spatial network analysis (SpNA). The paper emphasizes that the
 coopetitive network has geographical extensions, and on the other hand, interactions between
 vertices generate network space. The new type of economic network could thus be analyzed by
 SpNA to understand the spatial characteristics of a rivals’ network at transboundary level. The paper
 may be referred to as cutting-edge research, because on one hand, it dissects a new type of economic
 network (coopetitive networks) and on the other hand, a new method is utilized (SpNA) to study the
 geographical parameters of inter-firm relationships. This approach emerges as a novel method. As a
 result, the paper provides significant, fruitful and new findings in both network science and urban
 economics as well. By employing metrics of SpNA, the main spatial traits of the coopetitive network
 can be mapped, such as the circumference, spatial structure, diameter, spatial density, spatial small
 world phenomenon, and global connectivity of the network. The results show that the coopetitive
 network possesses hub-and spoke spatial framework, in which the hub is localized far from the cluster
 of players. Moreover, the coopetitive interaction does not require face-to-face nexus, because the
 focal firm communicates with them via IT devices. The coopetitive activities contribute significantly
 to the urban economic growth. The main agent (the hub) ought to be supported by the regional
 development policy at the local and inter-urban geographical scale as well.

 Keywords: coopetitive network; inter-urban cooperation; spatial network analysis; spatial small
 world; focal firm

1. Introduction
     Numerous types of economic networks can be distinguished, such as strategic alliances (joint
venture, equity strategic alliance and non-equity strategic alliance), supply chains, industrial districts
(Marshallian industrial district, hub-and-spoke industrial district, hybrid industrial district, satellite
industrial district, Italian industrial district), as well as local networks and regional clusters [1–8].
Nowadays, a new form of business network is emerging that is regarded as coopetition [9,10].
The notion of coopetition (mixture of cooperation and competition) was coined to the terminology
system of economics by Bradenburger and Nalebuff (1996) [11] more than two decades ago. Coopetition
refers to a dynamic interplay in which rivals cooperate and compete with each other simultaneously
in business segments, in order to reach higher profit rates [9,12–15]. Among competitors, a special
partnership and collaboration can be found. The coopetition, as a new inter-firm relationship, is defined
as a network; more precisely, it appears as a rivals’ network.
     The core idea of the paper is that every type of economic network has finite geographical extension.
The size, spatial structure, vertices and edges of the business networks (and the coopetitive networks,
of course) are nested in the space; the linkages have physical distances and nodes can be localized

Urban Sci. 2018, 2, 99; doi:10.3390/urbansci2040099                          www.mdpi.com/journal/urbansci
Urban Sci. 2018, 2, 99 2 of 13
geographically as well [16–21]. Business networks therefore have to be analyzed by advanced toolkits
of spatial network analysis (SpNA) to gain a deeper understanding of spatial characteristics, functions
and complex accomplishments of economic players and their connections [22]. Interestingly, spatial
aspects of economic networks have so far been scrutinized by methods of economics, spatial statistics
or spatial econometrics [23–29], but not by toolkits of SpNA. This paper attempts to void this gap.
Basically, spatial traits of economic networks have to be examined empirically to recognize the
network space, circumference and spatial structure of linkages and territorial allocation of vertices,
geographical length of inter-firm connections, spatial small world effects, network diameter, network
density and spatial interconnectivity as well [21,22,30–32]. To reach these aims, advanced methods of
SpNA are synthesized in this paper.
In this vein, the paper utilizing primary graph datasets describes and explains the spatial
attributes of an informal, undirected (bidirectional links), unweighted, bottom-up coopetitive network
functionalizing at transboundary level in Hungary and Ukraine. The interregional competitors’
network with 69 players can be found Záhony (nine agents) (Hungary), Beregszász (40 agents)
(Ukraine) and Munkács (20 agents) (Ukraine) (network of Záhony-Beregszász-Munkács: NZBM).
As a whole, this empirical study could be defined as a cutting-edge inquiry. On one hand, a new
type of economic network is dissected, and on the other hand, a new method (so-called SpNA) is
utilized to unfold unknown segments of spatial patterns and the topology of a coopetitive network.
The paper is organized as follows. The section of theoretical background points out basic
principles, experiences and operating mechanisms of a coopetition-based business strategy. Afterwards,
the method section highlights how the primary network database was collected. Some relevant toolkits
of SpNA are demonstrated, to assist in understanding the spatial dimensions of the new economic
network. The results section details the core spatial traits of NZBM rooted from complex geospatial
datasets. The final part of paper summarizes new empirical findings and recommends some options of
intervention for the successful network-based regional economic development policy.
2. Materials and Methods
The coopeting partners could minimize the cost of transactions and mutual transportation,
share risks, material and immaterial capacities, and resources (business information) to reach a
higher profit rate. They could also realize the benefits of collective learning, knowledge spillover,
product development and technological shifts. By employing a coopetition-based business approach,
competitors are able to economize financial resources diminishing their expenditures. Thus, savings
are realized and invested in further business developments contributing significantly to the regional
economic growth. The paper stresses that competitors do not cooperate in every business sector
within a framework of coopetition but only in some (two or maximum three) fields of business life.
Coopetition does not destroy the main pillars of the market economy, since rivals’ cooperation has
been built on the rules of the globalized free market by synthesizing collaborative and competitive
advantages. Integrating both types of advantages, a higher profit rate can be realized, if only the
rigorous and severe business competition rules would be preferred by the competitors [33].
The coopetition is not just a nice theory; it functionalizes in the real economic scheme too. A large
number of coopetitive examples have appeared at different regional levels, irrespective of the size of
the company (from microenterprises to the multinational companies). Firstly, the coopetitive networks
of transnational companies should be looked at. In 2005, the owners of Toyota and Citroën formed a
coopetitive network in order to mutually improve and produce a new city car called the Peugeot 107.
Since these rivals understood they would not able to separately finance the innovation background of
the Peugeot 107, the costs of development and production were backed up by both multinational firms.
Gain has been shared according to the partial of investments [34]. Nevertheless, micro-, small- and
medium- sized enterprises (SME) have started engaging in coopetition to maximize their profit rate.
For example, in Germany, 279 rivals in the dairy industry have already established a formal inter-firm
collaboration understanding that the coopetition-based business model could lead to raising gains [35].Urban Sci. 2018, 2, 99 3 of 13
Likewise, agricultural advisory service providers working with more than 900 rivaling farmers
started collaborating for a sustainable French agricultural branch from 2009 [14]. Similar coopetitive
networks can be found in the sector of steel, pharmaceuticals and semiconductors in order to utilize
their capacities [28]. Strese et al. (2016) [36] analyze the empirically cross-functional coopetition
of 392 German project leaders and department heads of the innovation industry, highlighting how
rivals’ cooperation impacts exploitative innovation process. The notion of cross-functional coopetition
describes intra-firm coopetition for material and immaterial assets appearing regularly in multinational
companies. Bendig et al. (2018) [13] also examine, employing a web-based survey, showing how
in R&D sector 331, German managers’ cross-functional coopetition defines the accomplishment of
companies day by day. By elaborating on expert interviews, Kraus-Schmid-Gast (2017) [37] pinpointed
how coopetitive networks of SMEs in the trust industry determine trends of innovation in Lichtenstein.
Note that empirical findings reveal that intra-organizational coopetition determines the significantly
and directly multilayer performance of business entities [12,33,38,39].
Additionally, in Tyrol, Austria, a formal coopetitive network (Leisure Card Tyrol) was introduced
to integrate sectors of leisure business and tourism by 60 competitors (six museums, six ice skating
rings owners, 13 bonus partners, 12 swimming pools owners and 23 mountain railway companies).
The results of the qualitative graph database show that network agents have been able to reach a
higher gain rate by applying coopetition business plans. Additionally, the local societal relationships
(intangible asset) and the landscape (material asset) have also been reshaped basically and positively
by the effects and externalities of this coopetitive network [39]. Similar coopetitive networks can be
recognized in the tourism sectors of Canton of Ticino (Switzerland) and Basilicata (Italy) as well [40,41].
A large number of coopetitive networks have been operating in the post-communist Poland. In the
high-tech sector, 235 rivals [42], and 66 competitors in the tourism branch [33] created coopetitive
networks in order to mutually allocate their resources to eliminate expenditures.
The competitors’ cooperation has been scrutinized by economics, mathematics, game theory,
marketing and management science, notwithstanding. Its spatial perspectives and approaches were
marginalized in the scientific inquiries. The paper attempts to fill this gap by demonstrating in the
next sections the relevant spatial dimensions of two transboundary coopetitive networks based on
primary, quantitative and qualitative network datasets.
The coopetitive network model (N) embraces a finite, nonempty set V = {vi } of vertices (V) and
a finite, nonempty set E = {ei } of edges (E). The number of vertices in V is defined as i, calling the
degree (k̂) of N and the number of edges in E is referred to as j. Moreover, in the coopetitive network
model the node demonstrates the location of a firm. Meanwhile, the edge means undirected coopetitive
interactions between rivals. In this paper, every vertex demonstrates the geographical position of a
microenterprise, small- or medium- sized company. The coopetitive interaction that is depicted by an
edge is regarded to be a business communication channel in which business information flows among
competitors. The weight, strength and flow parameters of linkages are the same in both of networks.
Furthermore, in both networks the coopetitive activities are planned and coordinated by emails. Thus,
the linkage of length is defined as the Euclidian distance (non-spatial relationships); the connection
between rivals is illustrated as crow flies in the maps of inter-firm relationships.
Whereas bottom-up coopetitive networks functionalize informally, I did not have a formal
list about the geographical positions of network players. I encountered the first network agent,
by coincidence, at a social event. He provided more information on rivals’ cooperation, and as a result,
by applying a snow-ball sociological method I could map up the overarching coopetitive networks
of local restaurant owners. Sociological, semi-structured interviews were made and questionnaires
were undertaken separately with every restaurant owner (69 players). Altogether, 69 interviews
and 69 questionnaires were mustered between September 2016 and October 2017. In this inquiry,
quantitative and qualitative methods were synthesized to explore the depth and scope of territorial
patterns of the inter-firm collaboration of competitors.Urban Sci. 2018, 2, 99 4 of 13
Firstly the networked place has to be delimited geographically. To this end, by following
the Eulerian path of a network (i.e., a path that visits each node exactly once), the outermost
vertices are connected in every network to each other, obtaining the networked place. Obviously,
the networked placed is a two-dimensional, irregular polygon thus the circumference (CI) of the
network is obtained [43,44]:
CI = ∑ d1,2 + d2,3 + d3,4 . . . + d x,y
where d1,2 demonstrates the physical distance between two nodes. Simply put, the outermost nodes of
the network are interconnected to delimit the network. The network shape is recognized as an irregular
two-dimensional polygon. The CI of the irregular polygon could be calculated if the geographical
lengths of sides of the polygon are added.
Afterward, the diameter (i.e., the largest spatial distance between two vertices) of a coopetitive
network is calculated [22]. As above, the coopetitive interactions between two players appear as
non-spatial relationships that are gauged by Euclidian distance (or the shortest distance), applying
kilometer (km). The Euclidian distance refers to the non-spatial distances, which are visualized and
understood as crow flies with relative short straight lines. Thus, the connections in such a network are
not circuitous and are not too long, relatively [21]. The computing of Euclidian distance based on the
Pythagorean theorem is obtained in a simple way:
s
n
∑
2
Edij = vi − v j
i =1
where Edij means Euclidian distance between nodes [17,22]. In the practice, every length of linkages is
measured separately, and the longest is regarded as the spatial diameter of the network.
Subsequently, the spatial topology of coopetitive networks is operationalized. The paper develops
a new measurement model to gauge the empirically spatial structure of the coopetitive networks.
This network measurement model simultaneously considers the linkages of spatial architecture and the
vertices of geographical allocations as well. More precisely, the connections of the territorial structure
are measured with degree distribution. This is in order to map up the spatial layout of the inter-firm
relationships of rivals, and on the other hand, to recognize whether one or more hubs exist in the
network [43]. Nevertheless, the vertices of spatial distribution are gauged by using quadrat analysis
(i.e., the quadrat analysis focuses on spatial patterns) and the allocation of players by comparing
the number of vertices among the same sized cells; the size of a grid has no mathematical rules or
theorems, it is defined by the researcher [45–47]. Both techniques (degree distribution and quadrat
analysis) are applied simultaneously to better understand the territorial framework of the nodes and
edges of coopetitive networks.
Whereas the hub triggers spatial small world phenomenon (or six degrees of separation), referring
to how a focal firm (or hub) is able to shortcut the distance nested in the space between players [22,43],
so that competitors could collaborate in some business fields. The spatial small world (SSW) can be
estimated well SSW ≈ lnlnV hki
, where hk i means the average degree and hki = 2V E [30,43].
In addition, the spatial density (SD) of coopetitive interactions presents how business information
spread among economic actors within a certain territorial unit. SD is expressed with a well-known
formula:
2( E − V + 1)
SD =
N ( N − 3) + 2
comparing the actual connections to the potential connections [48,49].
Finally, the global connectivity index (Ci(r) ) is elaborated by [44] gauging the spatial
interconnectivity of networks. [44] If an undirected vertex i is linked in a region (r) to a vertex j
in region (p) (that is a transboundary network), this linkage can be expressed gi(r) j( p) , that takesUrban Sci. 2018, 2, 99 5 of 13
the value of one if an edge is existing, or zero if otherwise. The total number of undirected, global
connections of the network (G) could be computed:
tr tr tr
G= ∑ ∑ ∑ gi ( 1 ) j ( p ) + ∑ ∑ ∑ gi (2 ) j ( p ) + . . . + ∑ ∑ ∑ gi(tr−1) j( p)
i (1) p >1 j ( p ) i (2) p >2 j ( p ) i (tr −1) p>tr −1 j( p)
where tr stands for total number of regions. Furthermore, if a vertex i is connected to other nodes j in
the same region, the linkages are demonstrated by qi(r) j(r) that takes the value 1 if an edge is existing
and zero is otherwise. The total number of undirected, local connection of the network (L) is obtained:
L= ∑ ∑ q i (1) j (1) + ∑ ∑ q i (2) j (2) + . . . + ∑ ∑ qi(tr) j(tr)
i (1) j(1)>i (1) i (2) j(2)>i (2) i (tr ) j(tr )>i (tr )
Finally, value of the global connectivity index is computed:
∑tr
p 6 = r ∑ j ( p ) gi ( r ) j ( p )
!
Ci(r) = x ( G + L)
1 + ∑ j(r),j6=i qi(r) j(r)
The sociological, semi-structured primary interviews are elaborated with structured content
analysis and longitudinal input-output analysis. Parts of the interviews are written in italics.
To sum up, firstly the circumferences, diameters and spatial shapes of both coopetitive networks
are measured to describe their basic territorial traits. Subsequently, the spatial structures of coopetitive
networks are dissected by synthesizing two special methods of SpNA. On one hand, the spatial
topology of edges is measured by degree distribution, and on the other hand, the spatial framework of
nodes and the hub are investigated and localized with quadrat analysis. Later, the territorial functions
and features of the hub are examined by SSW detecting how the giant component shortcuts distance
among nodes. Finally, spatial patterns of the interconnectivity of coopetitive networks are gauged by
the spatial density and the global connectivity index as well.
3. Results
Firstly the general features of NZBM are demonstrated. The network agents, that are local
microenterprises or/and SMEs, cooperate with each other only in two business segments. On one
hand, they purchase different products together, the wholesalers thus provide discount to them;
savings are realized by every coopeting enterprise because they purchase in a bulk. On the other hand,
products are transported mutually that requires fewer trucks economizing financial resources. Shortly,
Coopetitive savings = savings that come from mutual purchase
+
savings that come from mutual transportation.
The coopetitive savings, which stem from two coopetitive activities, are invested in creating new
jobs and/or increasing level of income. As a result, the coopetitive network contributes to the local
economic development and growth significantly. Simply put, network agents purchase in bulk to
receive discounts from wholesalers and transport products together. These acts permit to eliminate
expenditures, and in parallel, increase revenue streams. The firms reduce their expenditures, but the
price of goods is not diminished; finally their profit rate increase.
Furthermore, NZBM was established informally after the economic crisis of 2008. It can be
explained that with growing unemployment and poverty rates, numerous firms lost an overwhelming
element of capital. Meanwhile, some went out of the business structure and capital inflow was
mitigated dramatically in the post-communist regions. Companies needed financial resources, but they
did not have them. Some firms, therefore, formed coopetitive networks to reduce their expendituresUrban Sci. 2018, 2, 99 6 of 13
and raise profit without any government interventions or other formal support. More generally,
Urban Sci. 2018, 2, x FOR PEER REVIEW 6 of 13
coopeting partners have converted their relational capital (immaterial asset) into economic capital
(material
economic asset)
capitalafter the credit
(material crisis
asset) [50].
after theBy following
credit this business
crisis [50]. strategy,
By following new financial
this business resources
strategy, new
have appeared
financial in the
resources developing
have appeared in regions without regional
the developing economic
regions without development
regional economicpolicy or other
development
foreign
policy investors. More recently,
or other foreign investors.a large
Morenumber
recently,ofadeveloped
large numberregions have already
of developed managed
regions to accept
have already
managed to
coopetition accept
based coopetition
businesses, andbased businesses,
not just and not
the emerging justThe
places. the territorial
emerging extension
places. Theof territorial
NZBM can
beextension of NZBM
seen in Figure 1. can be seen in Figure 1.
Figure 1. Networked space of NZBM. Source: Author.
Figure 1. Networked space of NZBM. Source: Author.
Besides, the NZBM incorporates a focal firm, representing it with a red point on the map. The focal
firm isBesides, thedominant
called the NZBM incorporates
firm, majora firm,
focal firm,
centralrepresenting
firm or brokerit with
by aeconomics
red point and on the map. The
management
focal firm
science. Thisis paper
calleduses
the only
dominant firm, of
the notion major
focalfirm,
firm central
for clearfirm or broker byThe
interpretation. economics
focal firmand has
management
meaningful science.
spatial This paper
functions in theuses only the notion
coopetitive network. of focal
This firm
paper,forunfortunately,
clear interpretation.
cannotThe dealfocal
with
firm in
these has meaningful
detail spatial
but focuses on functions in the coopetitive
merely describing network. This
the core functions of it.paper, unfortunately, cannot
dealRivals
with these in detail
cooperate but focuses
rarely with each on merely
other describing
in the realtheeconomy
core functions
due to of their
it. harmful, earlier
Rivals cooperate rarely with each other in the real economy due
experiences. Competitors do not trust in each other, but attempt to defeat each other, in accordanceto their harmful, earlier
experiences. Competitors do not trust in each other, but attempt to defeat
with the rules of the free market economy. The rivals loathe each other in the real economic life. each other, in accordance
with
The the rules ofwhereupon,
competitors, the free market economy.
do not interactThe
withrivals
eachloathe
other,each other rival
but every in thehas
realtrust
economic
in the life.
focalThe
firm
competitors, whereupon, do not interact with each other, but every rival
in NZBM. The focal firm bridges the gaps between network players, manages coopetitive activitieshas trust in the focal firm in
NZBM. The focal firm bridges the gaps between network players, manages coopetitive activities and
and allocates business information among rivals. The interviews highlight that the focal firm works in
allocates business information among rivals. The interviews highlight that the focal firm works in the
the networks for charity and for free; the hub’s ability to acquire links is high.
networks for charity and for free; the hub’s ability to acquire links is high.
‘I am a well-known and a successful businessman, I do not need more and more profit, I only want to
‘I am a well-known
maintain and a successful
my own business circles. Butbusinessman,
I want to help I do
to not
my need
regionmore andI use
too so moremy profit, I only want
personality and to
maintain my
connections for own business
assisting circles.
to other localBut I want to help
entrepreneurs, to my region
competitors. too be
I would sohappy
I use to
myhelp
personality
them, forand
connections
example, for assisting
I organize mutualtotransportation.
other local entrepreneurs, competitors.
It is my mission I would(second
for my region.’ be happyinterview).
to help them, for
example, I organize mutual transportation. It is my mission for my region.’ (second interview).
Obviously, the coopetitive network would not have been established and evolved if the focal firm
did not Obviously,
mediate and the interlink
coopetitive network
between would notInhave
competitors. been established
a nutshell, rivals in thisandnetwork
evolvedcommunicate
if the focal
firm did not mediate and interlink between competitors. In a nutshell, rivals in this network
and collaborate mostly through the focal firm, because they cannot stand each other but confide in the
communicate and collaborate mostly through the focal firm, because they cannot stand each other
focal firm.
but confide in the focal firm.
Since the mutual purchase and transportation emerge as a daily routine in the networks, it can
Since the mutual purchase and transportation emerge as a daily routine in the networks, it can
already be organized easily by the focal firm. Regularly, the same amount of fruit, spices, salt and sugar,
already be organized easily by the focal firm. Regularly, the same amount of fruit, spices, salt and
sugar, vegetables and meat are bought and transported together every weekday for mutual benefit.
The focal firm is able to estimate the number of used trucks for mutual transportation. The 50 orUrban Sci. 2018, 2, 99 7 of 13
vegetables and meat are bought and transported together every weekday for mutual benefit. The focal
Urban Sci. 2018, 2, x FOR PEER REVIEW 7 of 13
firmUrban
is able to estimate
Sci. 2018, the REVIEW
2, x FOR PEER number of used trucks for mutual transportation. The 50 or maximum 7 of 13
60maximum
percent of 60all the trucks
percent is enough
of all the trucks istoenough
transport differentdifferent
to transport goods for all the
goods networks.
for all On the
the networks. Onfirst
day, maximum
a half of 60 of
set percent of all
vehicles the trucks
delivers is enough
products. Theto next
transport
day, different
another goods
set of for all the
trucks networks.
transport what Onwas
thethe
first day, a half of set of vehicles delivers products. The next day, another set of trucks transport
first day, a half of set of vehicles delivers products. The next day, another set of trucks transport
missed
what previously,
was missed so every firm
previously, participates equally in the coopetitive activities. As a result, Asevery
what was missed previously,sosoeveryeveryfirmfirmparticipates
participatesequally
equallyin in the
the coopetitive
coopetitive activities.
activities. As aa
rival could
result, every receive
rival products
could and
receive spend less
products and time
spend on buying
less time ongoods.
buying Inputs
goods. are purchased
Inputs are at a lower
purchased
result, every rival could receive products and spend less time on buying goods. Inputs are purchased
unit price,
at aat
lower the
a lowerunit profit
price,
unit
rate
thethe
price,
can
profitbe increased
rate
profit can
rate canbebe and the extent
increased
increasedand andthe
ofextent
localof
theextent
pollution
oflocal
may be
localpollution
pollution may
mitigated
may be
as well.
be mitigated
mitigated
The goods
as as
well.
well. are
The The delivered
goods
goods arearetodelivered
a transshipment
delivered point in all
totoa atransshipment
transshipment pointthree
point inincities,
all
all threewhere
three products
cities,
cities, where are distributed
where products
products are
are
among players.
distributed among players.
distributed among players.
AsAsabove,
Asabove,
above, thethe
the delimitation
delimitationof
delimitation ofofthe
thenetwork
the networkcan
network canbe
can becarried
be carriedout
carried outgeographically
out geographically
geographically if
if the outermost
if the
the outermost
outermost
vertices
vertices
verticesof
of the the network
ofnetwork
the network are
are tied tied
aretotied to
each each
to other other (Eulerian
each (Eulerian path) in
other (Eulerian path) in
every
path) every
in city.
everyThecity. The
border
city. The of border of the
the
the networked
border of
networked
place networked place
is demonstratedplaceis demonstrated
is demonstrated
with red dotted with
with red
reddotted
lines dotted
in lines
Figure 2.ininFigure
lines Figure2.2.
Figure 2.2.Delimitation
Figure Delimitation of
of NZBM. Source:Author.
NZBM. Source: Author.
Figure 2. Delimitation of NZBM. Source: Author.
TheTheredred
dotted lines depict the circumference of the network as well, that is recognized as a
dotted lines depict the circumference of the network as well, that is recognized as a two-
two-dimensional,
The red dottedirregular
lines polygon
depict
dimensional, irregular polygon the (see Figure
circumference
(see Figure 3);
of circumferences
the network
3); circumferences of the
as well,
of the network
that
network can beascalculated
is recognized
can be calculated aeasily
two-
easily with
dimensional,the above
irregular mentioned
polygon method
(see Figure
with the above mentioned method of SpNA. of SpNA.
3); circumferences of the network can be calculated easily
with the above mentioned method of SpNA.
Figure
Figure 3.3.Borders
Bordersof
ofNZBM.
NZBM. Source:
Source:Author
Author.
Figure 3. Borders of NZBM. Source: AuthorUrban Sci. 2018, 2, 99 8 of 13
Urban Sci. 2018, 2, x FOR PEER REVIEW 8 of 13
According to
According to the
the empirical
empirical measurements,
measurements,the thecircumference
circumferenceofofNZBM
NZBMisis42.01 km.
42.01 Moreover,
km. Moreover,
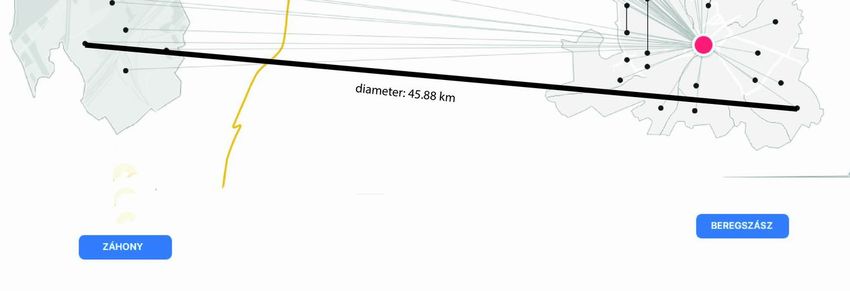
thediameter
the diameterof
of NZBM
NZBM is 45.88 km, crossing
crossing the
the Hungarian
Hungarianeast
eastnational
nationalborder
borderand
andmore statistical
more statistical
regional boundaries as well (see Figure 4).
regional boundaries as well (see Figure 4).
Figure 4. Diameter of NZBM. Source: Author.
Figure 4. Diameter of NZBM. Source: Author
Table 1 displays the average spatial length of the connection of NZBM, which is 20.82 km long.
Table 1 displays the average spatial length of the connection of NZBM, which is 20.82 km long.
Table 1. Spatial parameters of NZBM.
Table 1. Spatial parameters of NZBM.
Network The Shortest Average Global
Number Number Network CI
Diameter The Linkage Length of SSW Connectivity
of Nodes of Links Network Density (km) Global
Number Number of (km) Shortest(km)Average Length
Linkage (km)
Network CI Index
Diameter SSW Connectivity
NZBM of Nodes
69 Links
81 (km)45.88
Linkage
2.02 of Linkage (km)
20.82 Density 0.0335 7.784(km) 42.01 283.4944
Index
(km)
NZBM 69 81 45.88 2.02 Source: Author.
20.82 0.0335 7.784 42.01 283.4944
Source: Author
At this point, the question emerges: how does the highly connected focal firm sustain the
At thisconnection
coopetitive point, theamong
question emerges: in
competitors how
thedoes
long the
run,highly connected
using only emailsfocal
or/andfirm sustain the
phone?
coopetitive connection
Responding to thisamong
sharpcompetitors
question, the in the long
focal run,said
firm using only
that emails the
initially or/and phone? network
coopetitive
Responding
interactions to thison
were based sharp question,relationships.
face-to-face the focal firm said when
Later, that initially the coopetitive
more coopeting network
firms (restaurant
interactions were based on face-to-face relationships. Later, when more coopeting
owners) were attached to the network, the focal firm could not keep interacting with every agent in firms (restaurant
owners)Recently,
person. were attached to the network,
the coopetitive the focal
connection hasfirm could not
therefore been keep interacting
built on emailswith every
or/and agentcalls.
phone in
person.
The Recently, the coopetitive
telecommunication connection
devices permit has strongly
the very thereforeconnected
been built node
on emails
to beor/and
able tophone calls.
interact with
The telecommunication devices permit the very strongly
those network players that are set up far from the giant component. connected node to be able to interact with
thoseInnetwork players
the network, thatare
there arenot
set just
up far from theconnections;
hub-node giant component.
some node-node relationships can also
In the network, there are not just hub-node connections;
be found. In the practice, the focal firm in the undirected hub-node some node-node relationships
interaction, writes ancan alsoto
email
be found. In the practice, the focal firm in the undirected hub-node interaction,
rivals and receives confirmation emails from competitors. They email back and forth. Nevertheless, writes an email to
rivals and receives confirmation emails from competitors. They email back and forth. Nevertheless,
the node-node coopetitive nexus is composed of just forwarded emails, in which rivals forward the
the node-node coopetitive nexus is composed of just forwarded emails, in which rivals forward the
focal firm’s email to each other, containing the details of next mutual purchase and transportation.
focal firm’s email to each other, containing the details of next mutual purchase and transportation.
The forwarded email does not include new business information, but merely repeats the hub’s message.
The forwarded email does not include new business information, but merely repeats the hub’sUrban Sci. 2018, 2, 99 9 of 13
As a whole, the coopetitive linkage incorporates the hub-node (new information) and node-node
(forwarded email) relationships as well.
Shortly, the coopetitive linkages do not require nowadays face-to-face relationship irrespective of
immense and huge distance (see result of diameter). The IT-based coopetitive interaction system has
been functionalizing effectively and has proved to be sustainable in these post-communist regions.
‘For ages I have known A.B. (fictitious name of the focal firm in NZBM) in flash, he has an
integrative personality that is why I trust him totally. I trust his abilities to arrange our mutual
transportation, he is good in this field, he is an expert despite he did not learn such things at the school.
We keep in touch in emails, earlier we talked to each other face-to face, but now we do not need it. We
write emails to each other organizing mutual transportation. I have a restaurant another city than
A. B. lives but it does not matter because we can manage mutual business using emails. The emails
defeat the distance in the business.’ (37th interview).
As already mentioned, the spatial structures of coopetitive networks are computed by twofold
ways. On one hand, spatial patterns of coopetitive interactions (edges) are gauged by degree
distribution. On the other hand, the spatial allocation of locations of firms are examined with quadrat
analysis. Both parameters have to be taken into account at the same time. Several papers have so far
applied only degree distribution, because of the overlooked spatial dimensions of economic networks.
This paper fills this gap and empirically studies the spatial allocation of both edges and nodes as well.
Firstly, the linkages of the spatial layout have to be operationalized, since interactions constitute
network space. The results of degree distributions of coopetitive networks present the topology
of linkages (see Figure 5). The coopetitive network has hub-and-spoke-network architecture [51].
This network structure refers to how every player connects to the focal firm, so the hub has numerous
bonds in the network (more precisely, the hub has E-1 connections). In parallel, the most vertices
(the small-degree nodes) have a few connections in the network [18,21,22]. For example, in Beregszász
every agent bonds to the focal firm, however, only five linkages can be found among other nodes,
in the same town. The centralized framework of coopetitive networks similar to star graphs (i.e., a type
of network scheme in which a hub links to every node but the vertices do not connect to each other
(only to the hub), but it is not the same.
Urban Sci. 2018, 2, x FOR PEER REVIEW 10 of 13
50
Number of vertices with k connections
47
45
40
35
30
25
20 19
15
10
5
2 1
0 0
0 10 20 30 40 50 60 70 80
Number of links
Figure
Figure 5.
5. Degree
Degree distribution
distribution of
of NZBM.
NZBM. Source:
Source: Author
Author.
Notwithstanding, [19,20] highlights that dictatorial, hierarchical relationships may be formed
between the focal firm and the nodes with a few connections; the focal firm may command to every
agent and they obey to the focal firm. By contrast, results of the primary network datasets emphasize
that the focal firm never dictates to anyone. It only manages, bridges and organizes among rivals;
horizontal network structure functionalizes, and not vertical in both coopetitive networks. The hub
emerges as the Achilles Heel in the coopetitive network.
Subsequently, the vertices of spatial allocation have to be dissected by quadrat analysis. MoreUrban Sci. 2018, 2, x FOR PEER REVIEW 10 of 13
50
Number of vertices with k connections
Urban Sci.45 47
2018, 2, 99 10 of 13
40
35
Besides, the hub-and-spoke network system indicates that the coopetitive networks have a
relatively 30 high robustness and, of course, the network vulnerability is relatively low. More specifically,
if the coopetitive
25 network is attacked randomly, the network could continue to operate. This is because
in all probability,
20 those nodes will be removed out from the network that have only a few connections.
19
In contrast, when the network is attacked consciously, the focal firm will be removed from the graph.
15
The economic network whereupon will collapse and may disappear rapidly [43].
10
A further merit of the hub-and-spoke network framework is that the business information
could remain5 clean due to the focal firm providing information to rivals, and after that they send
2 1
confirmation0 0
emails or phone calls. Only the hub provides new information, the small-degree nodes
do not give0additional 10 information;
20 they30merely may 40 forward 50 the hub’s60 messages
70 to the80 rivals or
send a confirmation email to the hub. Thus,Number of links cannot be added in the network and
disinformation
misunderstandings can be avoided by everyone. The function of the hub provides effective information
circulation and less friction for5.the
Figure network
Degree players.
distribution of NZBM. Source: Author
Notwithstanding, [19,20] highlights that dictatorial, hierarchical relationships may be formed
Notwithstanding,
between the focal firm[19,20]
and the highlights
nodes withthata dictatorial, hierarchical
few connections; relationships
the focal firm may may be formed
command to every
between the focal firm and the nodes with a few connections; the focal firm may command
agent and they obey to the focal firm. By contrast, results of the primary network datasets emphasize to every
agentthe
that andfocal
theyfirm
obeynever
to the dictates
focal firm.
to By contrast,
anyone. results
It only of the primary
manages, bridgesnetwork datasets emphasize
and organizes among rivals;
that the focal
horizontal firm never
network dictates
structure to anyone. Itand
functionalizes, onlynotmanages,
verticalbridges
in bothand organizes
coopetitive among rivals;
networks. The hub
horizontal network structure functionalizes, and
emerges as the Achilles Heel in the coopetitive network. not vertical in both coopetitive networks. The hub
emerges as the Achilles Heel in the coopetitive network.
Subsequently, the vertices of spatial allocation have to be dissected by quadrat analysis. More
Subsequently, the vertices of spatial allocation have to be dissected by quadrat analysis. More
precisely, a regular grid of squares is superimposed over the map of coopetitive network and the
precisely, a regular grid of squares is superimposed over the map of coopetitive network and the
number of events falling in each grid area is counted. A cell covers a 350 × 350-m area in this study.
number of events falling in each grid area is counted. A cell covers a 350 × 350-m area in this study.
Since the territories among cities are empty cells, only the networked places are studied in the cities
Since the territories among cities are empty cells, only the networked places are studied in the cities
where enterprises were established.
where enterprises were established.
The results of quadrat analysis demonstrate that relatively big geographical distance can be found
The results of quadrat analysis demonstrate that relatively big geographical distance can be
among rivals in the same city (Figure 6). It proves that not always, but regularly, only one dot exists in
found among rivals in the same city (Figure 6). It proves that not always, but regularly, only one dot
aexists
grid,insometimes, in turn, in
a grid, sometimes, zero.
turn, zero.
70
64
60
50
Frequency
40
30
20 21
10
5
0
0 1 2 3
Number of dots
Figure
Figure6.6.Quadrat
Quadratanalysis of of
analysis NZBM. Source:
NZBM. Author.
Source: Author.
By
By concentrating
concentratingon onquadrat
quadratanalysis
analysis(in
(inwhich
whicha grid depicts
a grid 350350
depicts × 350 m) of
× 350 m)cities thatthat
of cities involve
involve
the hubs, it can be seen that there are not clustered areas of nodes close to the hub (see7).
the hubs, it can be seen that there are not clustered areas of nodes close to the hub (see Figure The 7).
Figure
The paper presupposed that numerous vertices would allocate close to the hub, but the empirical
gauges underscore that the intrinsic quality of the connection between the hub and nodes does not
depend on the geographical proximity or distance.Urban Sci. 2018, 2, x FOR PEER REVIEW 11 of 13
paper presupposed that numerous vertices would allocate close to the hub, but the empirical gauges
underscore that the intrinsic quality of the connection between the hub and nodes does not depend
Urban
on the Sci. 2018, 2, 99 proximity or distance.
geographical 11 of 13
Figure 7. Quadrat analysis of Munkács. Source: Author.
Figure 7. Quadrat analysis of Munkács. Source: Author.
To sum up, the degree distribution points out that the hub is tied to every rival while competitors
To sum
rarely connectup, the degree
to each distribution
other; points out
the coopetitive that thefollows
network hub is tied to every rivalspatial
hub-and-spoke while competitors
architecture.
rarely connect to each other; the coopetitive network follows hub-and-spoke
However, the quadrat analysis accentuates that the super-component of the network geographically spatial architecture.
However, the quadrat
and physically analysis far
exist relatively accentuates
from clustersthat ofthenodes;
super-component
the hub cannot of be
thefound
networkin thegeographically
clustered field
and
of the networks. More precisely, the focal firms were established in the core of the citiesthe
physically exist relatively far from clusters of nodes; the hub cannot be found in butclustered
rivals and
field of the networks. More precisely,
their clusters regularly were evolved in the periphery.the focal firms were established in the core of the cities but
rivals and their clusters regularly were evolved in the periphery.
The SSW describes how a focal firm as a super component shortcuts geographical, cognitive
The SSW describes
and organizational how a by
distance focal firm as aand
bridging super component
mediating amongshortcuts
rivals.geographical,
According tocognitive and
the empirical
organizational
results (see Table distance
1), inby bridging
NZBM andthe
(7.784) mediating
value ofamong SSW isrivals.
low. According
Therefore, the to the empirical towards
willingness results
(see Table 1), in NZBM (7.784) the value of SSW is low. Therefore, the willingness
coopetition cannot be called high, meaning the trust exists at a low level. Irrespective of this fact, the towards coopetition
cannot
rivals’be called high, meaning
inter-organizational the trust exists
collaboration at a low
operates level. Irrespective
positively and adequately of this because
fact, the the
rivals’ inter-
focal firm
organizational
shortcuts distancescollaboration
between operates
them. positively and adequately because the focal firm shortcuts
distances
Thebetween them.
global connectivity index (Ci(r) ) compares the interregional connectivity to the intraregional
The global connectivity index ( ( ) ) compares the interregional connectivity to the intraregional
connectivity in the network. The empirical results illustrate that NZBM functionalize as sparse
connectivity in the network.
networks, referring The empirical
to few linkages existingresults
amongillustrate that NZBMthefunctionalize
rivals, meanwhile as sparse
hub has a tremendous
networks, referring to few linkages existing among rivals, meanwhile
number of ties so as to mediate among competitors (see Table 1). The value of interconnectivity the hub has a tremendous
number
(283.4944)of is
ties so as
high; to mediate
referring to how among
the hubs competitors
have been (see able Table 1). Theand
to cooperate value
bridgeof at
interconnectivity
a transboundary
(283.4944) is high;
level among competitors. referring to how the hubs have been able to cooperate and bridge at a
transboundary level among competitors.
4. Short Conclusions
4. Short Conclusions
The paper studies the spatial traits of a Hungarian and Ukrainian interregional, coopetitive
The paper
networks studies
applying the spatial
metrics traits The
of SpNA. of a new
Hungarianresearch andfociUkrainian
provide interregional,
novel knowledge coopetitive
on the
networks applying metrics of SpNA. The new research foci provide
mechanisms and architecture of the rivals’ spatial cooperation. According to the empirical results, novel knowledge on the
mechanisms
the coopetitive andinteractions
architecture areoforganized
the rivals’byspatial
the focal cooperation.
firm based According to the empirical
on IT communication advice,results,
and not
the
bycoopetitive
a face-to-face interactions
relationship. are organized
The hub, with by theits focal firm based
outstanding on IT communication
networking roles, integrates advice, and
the entire
not by a face-to-face relationship. The hub, with its outstanding networking
network. The rivals may loathe each other, but the focal firm shortcuts different kinds of distance among roles, integrates the entire
network. The Since
competitors. rivals network
may loathe agentseach other, but the
communicate focal with
directly firm each
shortcuts
other different
seldom, the kinds of distance
network density,
among competitors. Since network agents communicate directly with
is relatively low, that is regarded as a sparse network ( E
Emax ). The global connectivity index each other seldom, the network
density,
and theisvalue
relatively low, small
of spatial that isworld
regarded as a sparse
phenomenon network
depict ( ≪
that the focal firm ). The
canglobal
manage connectivity
coopetitive
index and the
processes value of spatial
at interregional levelssmall world Finally,
efficiently. phenomenon depict that
by employing the the
newfocal firm can manage
measurement model of
coopetitive processes at interregional levels efficiently. Finally, by employing
spatial structure of the network, the degree distribution and spatial allocation of nodes could be the new measurement
model of spatial
identified structure
to measure betterofspatial
the network,
patternsthe degree distribution
of vertices and nodes. and spatial allocation of nodes
could Tobe identified
conclude, to themeasure better
coopetitive spatial patterns
networks determine of vertices and nodes.
significantly the trajectory of local economic
growth. Obviously, the regional development policy should support thetrajectory
To conclude, the coopetitive networks determine significantly the focal firm.ofThe local economic
stakeholders,
growth. Obviously,
territorial developers,the regional development
and investors ought policy
to take should support the
into account the focal
impactsfirm.andTheexternalities
stakeholders,of
territorial developers, and
coopetitive networks in the future. investors ought to take into account the impacts and externalities of
coopetitive networks in the future.
Funding: The paper was supported by the János Bólyai Research Scholarship of the Hungarian Academy
of Sciences.
Funding: The paper was supported by the János Bólyai Research Scholarship of the Hungarian Academy of
Sciences.
Conflicts of Interest: The author declares no conflict of interest.Urban Sci. 2018, 2, 99 12 of 13
References
1. Goyal, S. Connections: An Introduction to the Economics of Networks; Princeton University Press: Princeton, NJ,
USA, 2007.
2. Jackson, M. Social and Economic Networks; Princeton University Press: Princeton, NJ, USA, 2008.
3. Ji, Q.; Zhang, H.; Fan, Y. Identification of global trade patterns. Energy Convers. Manag. 2014, 85, 856–865.
4. Newman, M. Networks: An Introduction; Oxford University Press: Oxford, UK, 2000.
5. Salazar, M.; Holbrook, A. Canadian science, technology and innovation policy: The product of regional
networking? Reg. Stud. 2007, 8, 1129–1141.
6. Stone, T. International outsourcing and the global value chain. In Geographies of Growth; Karlsson, C.,
Andersson, M., Bjerke, L., Eds.; Edward Elgar: Northampton, MA, USA, 2017; pp. 265–298.
7. Vega-Redondo, F. Evolution, Games, and Economic Behavior; Oxford Press: Oxford, UK, 1996.
8. Zhang, Y.; Du, X. Network effects on strategic interactions. J. Econ. Behav. Organ. 2017, 143, 133–146.
[CrossRef]
9. Bengtsson, M.; Kock, S. Cooperation and competition in relationships between competitors in business
network. J. Bus. Ind. Mark. 1999, 3, 178–194. [CrossRef]
10. Rusko, R. Exploring the concept of coopetition. Ind. Mark. Manag. 2011, 40, 311–320. [CrossRef]
11. Bradenburger, A.M.; Nalebuff, B.J. Co-Opetition; Doubleday Currency: New York, NY, USA, 1996.
12. Akpinar, M.; Vincze, Z. The dynamics of coopetition: A stakeholder view of the German automotive industry.
Ind. Mark. Manag. 2016, 57, 53–63. [CrossRef]
13. Bendig, D.; Enke, S.; Thieme, N.; Brettel, M. Performance implications of cross-functional coopetition in new
product development. Ind. Mark. Manag. 2018, 73, 137–153. [CrossRef]
14. Compagnone, C.; Simon, B. Cooperation and competition among agricultural advisory service providers.
J. Rural Stud. 2018, 59, 10–20.
15. Ritala, P.; Golnam, A.; Wegman, A. Coopetition-based business models: The case of Amazon.com.
Ind. Mark. Manag. 2014, 2, 236–249. [CrossRef]
16. Balister, P.; Song, C.; Riordan, O.; Bollobás, B.; Barabási, A.L. Topological Phase Transition in Spatial
Networks. 2018. Available online: https://arxiv.org/abs/1806.10114 (accessed on 14 July 2018).
17. Barthélemy, M. Spatial network analysis. Phys. Rep. 2011, 499, 1–101. [CrossRef]
18. D’Alessandro, C.; Léautier, F. Spatial networks: Connecting space through leaders. In Cities and Spaces of
Leadership. A Geographical Perspective; D’Alessandro, C., Léautier, F., Eds.; Palgrave-Mcmillan: London, UK,
2016; pp. 126–143.
19. Ford, D.; Hakansoon, H. The idea of business interaction. IMP J. 2006, 1, 4–27.
20. Ford, D.; Hakansoon, H. IMP—Some things achieved. Eur. J. Mark. 2006, 3–4, 248–258. [CrossRef]
21. Törnroos, J.; Halinen, A.; Medlin, C.J. Dimensions of space in business network research. Ind. Mark. Manag.
2017, 61, 10–19. [CrossRef]
22. O’Sullivan, D. Spatial network analysis. In Handbook of Regional Sciences; Fischer, M.M., Nijkamp, P., Eds.;
Springer: Berlin/Frankfurt, Germany, 2014; pp. 1253–1273.
23. Broekel, T. The co-evolution of proximities—A network level study. Reg. Stud. 2015, 6, 921–935. [CrossRef]
24. Huggins, R. Local business cooperation and training and enterprise councils. Reg. Stud. 1998, 9, 813–826.
[CrossRef]
25. Knieps, G. Network Economics; Springer: Heidelberg, Germany, 2015.
26. McAdam, M.; Dunn, A.; McCall, C. Regional horizontal networks within the SME agri-food sector. Reg. Stud.
2016, 8, 1316–1329. [CrossRef]
27. Nijkamp, P. Entrepreneurship in a modern network economic. Reg. Stud. 2003, 4, 394–405.
28. Rodrigues, J.; Marques, A.; Wood, R.; Tukker, A. A network approach for assembling and linking input-output
models. Econ. Syst. Res. 2016, 4, 518–538. [CrossRef]
29. Strihan, A. A network-based approach to regional borders. Reg. Stud. 2008, 4, 539–554. [CrossRef]
30. Ducruet, C.; Beauguitte, L. Spatial science and network science: Review and outcomes of a complex
relationship. Netw. Spat. Econ. 2014, 14, 297–306. [CrossRef]
31. Rozenblat, C.; Puman, D. The location of multinational firms in the European urban system. Urban Stud.
1993, 10, 1691–1709. [CrossRef]Urban Sci. 2018, 2, 99 13 of 13
32. Tsiotas, D.; Polyzos, S. The complexity in the study of spatial network. Netw. Spat. Econ. 2018, 1, 1–32.
[CrossRef]
33. Czakon, W.; Czernek, K. The role of trust-building mechanisms in entering into network coopetition.
Ind. Mark. Manag. 2016, 57, 64–74. [CrossRef]
34. Gwynne, P. Automakers hope coopetition will map route to future sales. Res. Technol. Manag. 2009, 52, 2–4.
35. Schulze-Ehlers, B.; Steffen, N.; Busch, G.; Spiller, A. Supply chain orientation in SMEs as an attitudinal
construct. Supply Chain Manag. Int. J. 2014, 4, 395–412. [CrossRef]
36. Strese, S.; Meuer, M.W.; Flatten, T.C.; Brettel, M. Examining cross-functional coopetition as a driver of
organizational ambidexterity. Ind. Mark. Manag. 2016, 57, 40–52. [CrossRef]
37. Kraus, S.; Schmid, J.; Gast, J. Innovation through coopetition. Int. J. Bus. Sci. Appl. Manag. 2017, 1, 44–60.
38. Devece, C.; Ribeiro-Soriano, D.E.; Palacios-Marqués, D. Coopetition as the new trend in inter-firm alliances:
Literature review and research patterns. Rev. Manag. Sci. 2017, 1–20. [CrossRef]
39. Schnitzer, M.; Seidl, M.; Schlemmer, P.; Peters, M. Analyzing the coopetition between tourism and leisure
suppliers. Sustainability 2018, 10, 1447. [CrossRef]
40. Angeloni, S. A tourist kit ‘made in Italy’: An ‘intelligent’ system for implementing new generation destination
cards. Tour. Geogr. 2016, 52, 187–209. [CrossRef]
41. Zoltan, J.; McKercher, B. Analyzing intra-destination movements and activity participation of tourists
through destination card consumption. Tour. Geogr. 2015, 17, 19–35. [CrossRef]
42. Cygler, J.; Sroka, W. The boundaries of coopetition. In Economic Development and Entrepreneurship in Transition
Economies; Ateljevic, J., Trivic, J., Eds.; Springer: Cham, Switzerland, 2016; pp. 253–269.
43. Barabási, A.-L. Network Science; Cambridge University: Cambridge, UK, 2016.
44. Gorman, S.P.; Kulkarni, R. Spatial small worlds: New geographic patterns for an information economy.
Environ. Plan. B Urban Anal. City Sci. 2004, 2, 273–296. [CrossRef]
45. Brinkhoff, T.; Kresse, W. Databases. In Springer Handbook of Geographic Information; Kresse, W., Danko, D.M.,
Eds.; Springer: Heidelberg, Germany, 2012; pp. 61–109.
46. Pan, J.; Li, J.; Cong, Y. Quantitative geography analysis on spatial structure of A-guide tourist attractions in
China. J. Resour. Ecol. 2015, 1, 12–20.
47. Reginald, W.T. Introduction to Qaudrat Analysis; Cambridge University: Cambridge, UK, 1997.
48. Bailey, T.C.; Gatrell, A.C. Interactive Spatial Data Analysis; Wiley: New York, NY, USA, 1995.
49. Qian, X.; Wang, Y.; Zhang, G. The spatial correlation network of capital flows in China. China Econ. Rev.
2018, in press. [CrossRef]
50. Bourdieu, P. The forms of capital. In Handbook of Theory and Research for the Sociology of Education;
Richardson, J., Ed.; Greenwood Ltd.: New York, NY, USA, 1986; pp. 241–258.
51. Rozenblat, C. Opening the black box of agglomeration economies for measuring cities’ competitiveness
through international firm networks. Urban Stud. 2010, 13, 2841–2865. [CrossRef]
© 2018 by the author. Licensee MDPI, Basel, Switzerland. This article is an open access
article distributed under the terms and conditions of the Creative Commons Attribution
(CC BY) license (http://creativecommons.org/licenses/by/4.0/).You can also read


