Urban Seismic Risk Index for Medellín, Colombia, based on probabilistic loss and casualties estimations - Core
←
→
Page content transcription
If your browser does not render page correctly, please read the page content below
Urban Seismic Risk Index for Medellín, Colombia, based on probabilistic
loss and casualties estimations
Mario A. Salgado-Gálvez, Centre Internacional de Metodes Numerics en Enginyeria
(CIMNE) Universitat Politecnica de Catalunya, Barcelona, Spain. mario.sal.gal@gmail.com
Daniela Zuloaga Romero, Illinois Institute of Technology, Chicago,
United States of America. dzuloaga@hawk.iit.edu
César A. Velásquez, Centre Internacional de Metodes Numerics en Enginyeria (CIMNE)
Universitat Politecnica de Catalunya, Barcelona, Spain. cavelasquez@cimne.upc.edu
Martha L. Carreño, Centre Internacional de Metodes Numerics en Enginyeria (CIMNE)
Universitat Politecnica de Catalunya, Barcelona, Spain. liliana@cimne.upc.edu
Omar-Darío Cardona, Instituto de Estudios Ambientales (IDEA), Universidad Nacional de
Colombia Sede Manizales, Manizales, Colombia. odcardonaa@unal.edu.co
Alex H. Barbat, Centre Internacional de Metodes Numerics en Enginyeria (CIMNE)
Universitat Politecnica de Catalunya, Barcelona, Spain. alex.barbat@upc.edu

Abstract: Medellín is the second largest city of Colombia with more than 2 million
inhabitants according to the latest census and with more than 240,000 public and private
buildings. It is located on an intermediate seismic hazard area according to the seismic hazard
map of Colombia although no destructive earthquakes have recently occurred having as a
consequence low seismic risk awareness among its inhabitants. Using the results of a fully
probabilistic risk assessment of the city with a building by building resolution level and
considering the dynamic soil response, average annual losses by sectors as well as casualties
and other direct effects have been obtained and aggregated at county level. Using the holistic
evaluation module of the multi-hazard risk assessment CAPRA platform, EvHo, a
comprehensive assessment that considered the social fragility and lack or resilience at county
level was performed making use of a set of indicators with the objective of capturing the
aggravating conditions of the initial physical impact. The Urban Seismic Risk Index has been
obtained at county level being useful to communicate risk to decision-makers and
stakeholders besides making easy to identify potential zones that can be problematic in terms
of several dimensions of the vulnerability. This case study is an example of how a
multidisciplinary research on disaster risk reduction has helped to show how risk analysis can
be of high relevance for decision-making processes in disaster risk management.

Keywords: Urban seismic risk index; urban resilience; holistic risk assessment; probabilistic
seismic risk analysis.

Natural Hazards, 80(3), 2016, 1995‐2021
1   1.     INTRODUCTION
 2
 3   Several probabilistic seismic risk analysis have been conducted worldwide at different
 4   resolution levels and with different objectives, estimating the physical damage in terms of
 5   mean damage ratios (MDR), average annual losses (AAL) and probable maximum losses
 6   (PML) (Ordaz et al. 2000; Barbat et al. 2010; Lantada et al. 2010; Salgado-Gálvez et al. 2013;
 7   2014a; 2015a, Zuloaga et al. 2013; Marulanda et al. 2013; IBRD and The World Bank 2013;
 8   Cardona et al. 2014; Silva et al. 2014; Ahmad et al. 2014). Quantifying risk from a physical
 9   point of view, although important, is only the first step in a comprehensive disaster risk
10   management scheme (Cardona et al. 2008a; 2008b; Cardona 2009; Marulanda et al. 2014)
11   after which, it is important to further use those results in disaster risk management related
12   strategies. It is clear that the physical is not the only dimension and hence those results can be
13   used as input data for a comprehensive, holistic, risk analysis (Cardona 2001; Carreño 2006;
14   Carreño et al. 2007, Carreño et al. 2012; 2014). A holistic approach has also been included in
15   the MOVE framework (Birkmann et al. 2013), one that outlines key factors and different
16   dimensions to be addressed when assessing vulnerability in the context of natural hazards, as
17   considered herein.
18
19   This paper presents the complete and final results of the urban seismic risk index, USRi,
20   estimation for the city of Medellín, Colombia based on a holistic approach for which a
21   preliminary assessment had been previously conducted (Salgado-Gálvez et al. 2014b).
22   Medellín is the second largest city in Colombia with more than 2.2 million inhabitants in the
23   urban area and where many industries and financial facilities have their headquarters. The city
24   is located on a valley on the east side of the western cordillera of the North Andean zone and
25   lies on an intermediate seismic hazard zone where earthquakes associated to different active
26   seismic faults can generate important damages and disruptions on its infrastructure (AIS
27   2010; Salgado-Gálvez et al. 2010; 2014a; 2014c; 2015b). The urban area of the city is divided
28   into 16 counties (comunas), each of them with approximately the same area but with
29   important differences from a social, economic and infrastructure perspective. During recent
30   years, Medellín has experienced a rapid urban growth and transformation, and different areas
31   of the city have changed in terms of building classes, population density and availability of
32   public spaces since low rise houses have been demolished to build high-rise structures to
33   accommodate a larger amount of inhabitants, a process clearly identifiable in the medium-
34   high and high income zones of the city.
35
36   A holistic risk assessment at urban level, which accounts for the vulnerability in several of its
37   dimensions, requires a combination of the physical risk results with aspects that reflect social
38   fragility and lack of resilience. In this context, social fragility is measured by means of
39   variables that contribute to a soft risk related to the potential consequences over the social
40   context, trying to capture issues related to human welfare such as social integration, mental
41   and physical health, both at an individual and community level. On the other hand, lack of
42   resilience is related to deficiencies in coping with the disasters and in recovering from them;
43   these latest also contribute to the soft risk or the second order impact factor over exposed
44   communities. Resilience is an adaptive ability of a socio-ecological system to cope and absorb
45   negative impacts as a result of the capacity to anticipate, respond and recover from damaging
46   events; therefore, it is important to know the lack of resilience since it has been proven to be
47   an important factor of the overall vulnerability; aspects that are captured by means of a set of
48   indicators.
49
50   For this case study, all the physical risk indicators are obtained starting from damage and loss

     Natural Hazards, 80(3), 2016, 1995‐2021
51   events that can be calculated by using fully probabilistic methodologies, such as the one of the
52   CAPRA1 platform, by convoluting hazard and vulnerability for the exposed elements
53   (Cardona et al. 2010; 2012; Salgado-Gálvez et al. 2014a; Velásquez et al. 2014). For this
54   study, the probabilistic physical risk results obtained by Salgado-Gálvez et al. (2014a) using
55   CAPRA are complemented by estimating injured, deaths, homeless and unemployed on a
56   building by building basis, also based on a fully probabilistic approach and grouping the
57   results by counties.
58
59   The USRi is defined as a combination of a physical risk index, RF, and an aggravating
60   coefficient, F, in the following way: USRi = RF (1+F) where RF and F are composite
61   indicators (Carreño 2006; Carreño et al. 2007). RF is obtained from the probabilistic risk
62   results, while F is obtained from available data regarding political, institutional and
63   community organization aspects which usually reflect weak emergency response, lack of
64   compliance of existing codes, economic and political instability and other factors that
65   contribute to the risk creation process (Carreño et al. 2007; Renn 2008). This approach has
66   also been applied at different resolution levels (Daniell et al. 2010; Burton and Silva 2014)
67   and has been integrated in toolkits, guidebooks and databases for earthquake risk assessment
68   (Khazai et al. 2014; 2015; Burton et al. 2014). Since not always the same information in terms
69   of indicators is available for the area under study, each assessment constitute a challenge in
70   the way that the descriptors are selected and in some cases calculated.
71
72   The multi-hazard risk assessment CAPRA platform holistic risk assessment module, EvHo,
73   (CIMNE-RAG 2014) has been used in this work, which is a tool that incorporates directly the
74   output files of the physical risk estimation made using CAPRA-GIS (ERN-AL 2011), the
75   probabilistic risk calculator module of the CAPRA platform. The module defines factors and
76   their corresponding weights to calculate RF and F; it also incorporates a procedure based on
77   transformation functions, allowing the conversion of each factor into commensurable units
78   and calculates the aggravating coefficient for each analysis area. The USRi is obtained at
79   county level according to the flowchart of Figure 1. All these computations are made possible
80   by the modular characteristics of the CAPRA platform. Since risk analysis can be performed
81   at different resolution levels, the tool allows the selection of the desired level, and if the risk
82   has been calculated on a more detailed scale, it groups the results into the desired units.
83
84   For the social fragility (FFSi) and lack of resilience (FFRj) indexes, the user can define the
85   number of factors and assign the weights to be used in each category; as in the case of the
86   physical risk, the user can also select the transformation function in conjunction with the
87   correspondent minimum and maximum limits for each factor. Once the above mentioned
88   parameters are defined by the user, the Urban Seismic Risk Index (USRi) is calculated for the
89   selected resolution level and results can be exported into tables, charts and maps in shapefile
90   format.
91

     1
         Comprehensive Approach to Probabilistic Risk Assessment (www.ecapra.org)

     Natural Hazards, 80(3), 2016, 1995‐2021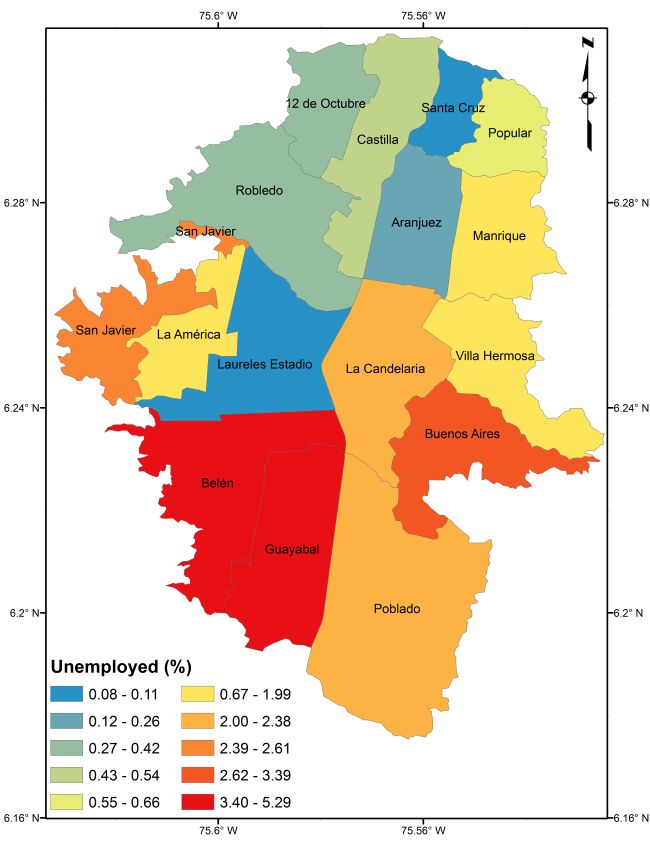
92
 93                         Figure 1 CAPRA’s holistic risk assessment module flowchart
 94
 95   The whole process is performed within a framework in which uncertainties related to the
 96   physical damage and loss assessment are also considered by using probabilistic
 97   methodologies. Scientific uncertainties become philosophical uncertainties since there will be
 98   an impact on society when a decision is made; thus, it is important to know where they are
 99   and how they have been considered or not (Caers 2011), and since the objective of this kind
100   of assessments is to derive in actions related to risk reduction, this aspect is worth to be at
101   hand.
102
103   Obtaining risk results from a holistic perspective highlights the socioeconomic factors that
104   contribute most to the aggravating coefficient, F, and they should help stakeholders and
105   policy makers in the integral disaster risk management. Measuring risk with the same
106   methodology in all counties of an urban area like Medellín allows a direct and appropriate
107   comparison of the obtained results and it can help in prioritizing the areas for developing
108   disaster risk reduction and management strategies. Also, the final result can be disaggregated
109   and the main risk drivers after the holistic risk assessment can be highlighted and in this stage
110   of the study, after complementing the preliminary results obtained by Salgado-Gálvez et al.
111   (2014a), for the first time this procedure is performed and shown for the county with the
112   highest USRi to clearly present which are the descriptors that are contributing the most in each
113   of the indexes (physical risk, social fragility and lack of resilience) and then, the results are a
114   useful basis for the development of specific strategies to improve their performance in their
115   corresponding fields of action.
116
117   Holistic evaluations of seismic risk at urban level have been performed in recent years for
118   different cities worldwide (Carreño et al. 2007; Marulanda et al. 2013) as well as at country
119   level (Burton and Silva 2014) and have proven to be a useful way to evaluate, compare and
120   communicate risk while promoting effective actions toward the intervention of vulnerability
121   conditions measured at its different dimensions. Although at first it can be seen simply as
122   another case study based on a well-known methodology, on the one hand, this study

      Natural Hazards, 80(3), 2016, 1995‐2021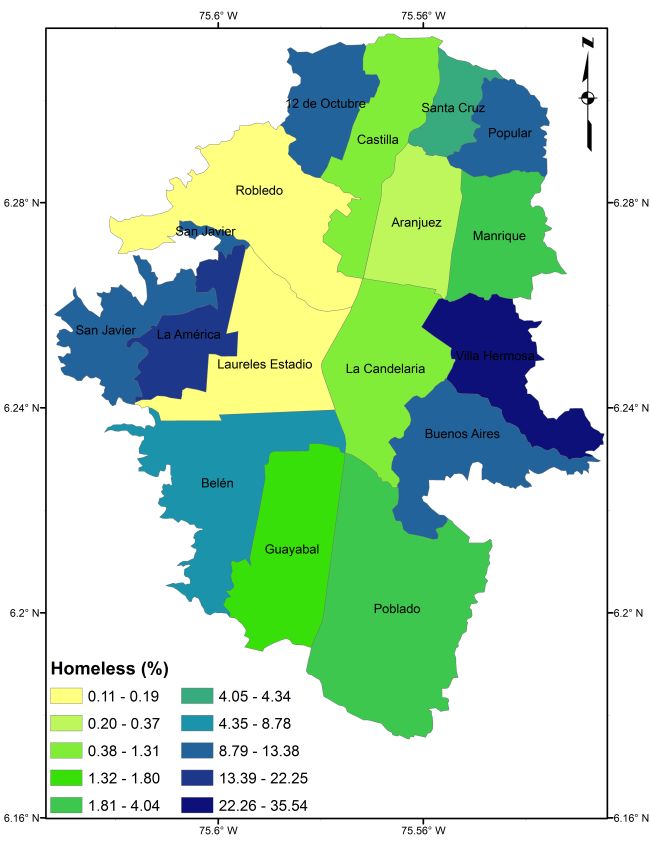
123   incorporates a set of probabilistic descriptors in the side of the physical risk that had never
124   been assessed in Medellín while, on the other hand, since the main purpose is to raise risk
125   awareness and, not a generally agreed practice on a holistic risk assessment framework exists,
126   the development of case studies that consider different methodologies (Brink and Davidson
127   2014) to obtain the input data can serve as examples for future comparisons of the
128   approaches.
129
130   This is the first time that a study following the above mentioned methodology is conducted
131   with a high resolution in all the aspects (seismic hazard, exposure and socio-economic
132   descriptors) and the results are useful to identify risk driver factors that are not associated only
133   to the physical vulnerability of the dwellings but also to social and poverty factors that should
134   be examined and tackled in an integral way, stressing out that poverty is not necessarily the
135   same as vulnerability. The importance of risk analysis has been understood at different
136   decision-making levels but the need of being incorporated as a development issue by
137   governments is still on its way. Finally, it also constitutes an example of how an integrated
138   research on disaster risk reduction can reduce the gap between the risk analysis and its
139   relevance for risk management decision-making processes (Salgado-Gálvez et al. 2014b).
140
141   2.   PROBABILISTIC PHYSICAL SEISMIC RISK AND DIRECT IMPACT
142   ASSESSMENT
143
144   The seismic risk analysis from a holistic perspective requires the calculation of a set of factors
145   that are related to the direct effects of the hazardous events on the exposed elements and to the
146   consequences in terms of the possibility of occupying the buildings after the city has been
147   struck by an earthquake. The first factor corresponds to the AAL by sector, where four
148   different categories are included (residential, commercial, institutional and industrial). The
149   other factors are related to the expected number of deaths, injuries, homeless and
150   unemployed. This section presents the methodology followed for the calculation of these
151   factors.
152
153   2.1    Physical seismic risk analysis methodology
154
155   For a fully probabilistic seismic risk analysis, different input data for the hazard, exposure and
156   physical vulnerability are required. Seismic hazard is represented by means of a set of
157   stochastic events generated using the program CRISIS 2007 (Ordaz et al. 2007), which is the
158   seismic hazard module of CAPRA; each event associated to the different seismogenetic
159   sources identified at country level (AIS 1996; 2010; Paris et al. 2000; Taboada et al. 2000;
160   Pulido 2003; Salgado-Gálvez et al. 2010; 2015b); for each event, hazard intensities in terms
161   of their first two statistical moments are obtained for different spectral ordinates to take into
162   account the fact that structures with different dynamic characteristics have different
163   earthquake solicitations for the same event. Since the city also has a seismic microzonation
164   (SIMPAD et al. 1999) it has been considered in the analysis by determining spectral transfer
165   functions for each homogeneous soil zone in order to calculate the hazard intensities at
166   ground level. The exposure database consists of the portfolio of buildings, both public and
167   private, and is comprised by 241,876 elements (Alcaldía de Medellín 2010) that have been
168   identified, characterized and associated to a building class. Physical vulnerability is
169   represented by means of vulnerability functions that allow both a continuous and probabilistic
170   representation of the loss associated to different hazard intensities, in this case corresponding
171   to the spectral acceleration for 5% damping, an intensity measure that correlates well with the
172   seismic performance of structures (Luco and Cornell 2007). More details about the employed

      Natural Hazards, 80(3), 2016, 1995‐2021
173 methodology and information for the physical risk analysis can be found in Salgado-Gálvez et
174 al. (2014a).
175
176 Since all input data have been represented using a probabilistic approach, the loss calculation
177 process can follow the methodology proposed by Ordaz (2000) and that is used in the
178 CAPRA platform, where a convolution between the hazard and vulnerability of the exposed
179 elements is performed. The main output of these assessments is the loss exceedance curve
180 (LEC) which relates loss values in monetary units, with their annual exceedance rates. The
181 LEC is calculated using the following expression (Ordaz 2000):
182
N
183 (l ) Pr( L l Event i ) FA ( Event i ) (Eq. 1)
i 1
184
185 where v(l) is the rate of exceedance of loss l, N is the total number of earthquake events that
186 comprise the stochastic set and conform with the seismic hazard in the area under analysis, FA
187 (Event i) is the annual frequency of occurrence of the ith earthquake event, while Pr(L>l|Event
th
188 i) is the probability of exceeding l, given that the i event occurred. The sum of the equation
189 includes all potentially damaging events from the stochastic set. The inverse value of v(l) is
190 the return period of the loss l, denoted as Tr. Once the LEC is obtained, other risk metrics
191 such as the AAL can be obtained by calculating the area under the LEC. This metric
192 constitutes the first physical risk factor required to be determined for the study presented
193 herein. AAL can also be directly computed, leading to exactly the same value using the
194 following expression:
195
N
196 AAL E( L Event i ) FA ( Event i ) (Eq. 2)
i 1
197
198 where E(L|Event i) is the expected loss value given the occurrence of the ith event and
199 FA(Event i) is the associated annual occurrence frequency of the same event. AAL constitutes
200 a robust indicator since it can represent risk at different resolution levels and also captures the
201 participation on the overall risk of the small and frequent events as well as the high and low
202 frequency events while also being insensitive to uncertainty as is explained later.
203
204 Uncertainties related to hazard and physical vulnerability, defined according to their
205 characteristics (temporal and spatial for the hazard and intensity-dependent for the
206 vulnerability), are considered in the loss assessment; thus the result of the calculation process
207 is a specific loss probability distribution for each hazard event. In the case of risk results in
208 terms of losses, a Beta distribution is defined through a central value (mean) and its dispersion
209 or uncertainty measure (variance). The latter is considered an appropriate probability
210 distribution for modeling losses since results are always defined between 0.0 (no loss) and 1.0
211 (total loss) and since only direct losses are considered at this stage, the maximum possible
212 loss is then the total exposed value.
213
214 2.2 Physical risk results for Medellín
215
216 Physical risk is calculated on a building by building resolution level and the obtained results
217 are grouped by counties according to the location of each dwelling. It is well known that for
218 the calculation of the AAL an arithmetical aggregation process can be applied to both
219 counties and sectors. Table 1 shows the values in relative terms to the total exposed value by
Natural Hazards, 80(3), 2016, 1995‐2021220 county and by sector in Medellín. Blank values (-) correspond to sectors that are not
221 representative in the corresponding county. AAL seeks to give an overall and comprehensive
222 representation of the risk levels, through a robust indicator and not only by loss values for
223 earthquake events. AAL is calculated considering the participation of all the events, by
224 multiplying the expected loss by its annual occurrence frequency, for each event. The AAL,
225 when calculated by means of Equation 2, cannot have associated any uncertainty measure
226 because it represents the loss results in annualized terms which, on the other hand, represent a
227 mathematical expectation, not an uncertainty measure.
228
229 Table 1 Relative AAL (‰) by county and by sector in Medellín
Sector
County
Commercial Industrial Institutional Residential
1- Popular 2.95 - - 2.65
2 - Santa Cruz 1.26 - - 1.59
3 - Manrique 2.79 - 3.11 2.67
4- Aranjuez 1.51 - 1.43 1.53
5 - Castilla 2.57 2.75 2.94 2.81
6 - Doce de Octubre 3.25 - - 3.39
7 - Robledo 1.93 - 2.20 2.21
8 - Villa Hermosa 6.68 - - 5.89
9 - Buenos Aires 6.03 - - 5.70
10 - La Candelaria 3.68 3.70 3.76 3.41
11 - Laureles Estadio 3.72 - 3.27 3.55
12 - La América 4.42 - - 4.66
13 - San Javier 3.22 - - 2.93
14 - Poblado 5.12 4.67 - 4.85
15 - Guayabal 3.80 3.38 - 3.40
16 - Belén 3.30 - 3.59 3.49
230
231
232 2.3 Death, injured, homeless and unemployed estimation for Medellín
233
234 A fully probabilistic risk analysis is normally conducted for the complete set of hazardous
235 events that comprise the hazard representation. However, for the purpose of estimating death,
236 injured, homeless and unemployed, this study has been conducted for a single event where
237 only one event is considered as N in Equation 1. By setting the annual frequency of
238 occurrence of the selected one to 1.0, Equation 1 will provide the probability of occurrence of
239 the loss given the occurrence of the selected event, and not the annual frequencies of
240 occurrence. Though the annual frequency of occurrence of it has been set equal to 1.0, and it
241 represents a deterministic approach for the temporal probability of occurrence, hazard
242 intensities are computed for the first two statistical moments representing the hazard
243 uncertainties that, together with the vulnerability uncertainties, are included in the loss
244 calculation process as explained above; therefore, the loss calculation is still probabilistic.
245
246 The event was chosen out of the more than 2,500 included in the stochastic set with the
247 selection criteria of that event generating a direct economic loss of similar order of magnitude
248 than that of a 500 years mean return period. That value is read from the LEC shown in Figure
249 2 and that return period is considered of relevance for the design of emergency plans in
250 Colombia (SDPAE 2002). It is important to bear in mind that the return period of the loss is
251 different from the return period of the seismic event since, in this case, there is correlation in
252 the losses and uncertainties in the ground motion and physical vulnerability values (Bazzurro
253 and Luco 2005; Bommer and Crowley 2006; Park et al. 2007; Crowley et al. 2008; Salgado-
254 Gálvez et al. 2014a). The expected loss for the selected return period obtained from the LEC
Natural Hazards, 80(3), 2016, 1995‐2021255 is estimated in around 12 billion USD2 which represents about 14% of the total exposed
256 value. Loss exceedance rates are calculated by using the total probability theorem and because
257 of that, for any loss level, the exceedance rate is calculated as the sum of all the events with
258 probability of exceeding said loss level. In this case, the uncertainty is being considered in the
259 calculation of the exceedance probabilities and then, the annual exceedance rates obtained
260 cannot have associated an uncertainty measure because they are probabilities calculated for a
261 specific loss value.
262
1.E+00
1.E-01
1.E-02
Exceedance rate [1/year]
1.E-03
1.E-04
1.E-05
1.E-06
1.E-07
1.E-08
1.E-09
1.E-10
$1 $10 $100 $1,000 $10,000 $100,000 $1,000,000
Loss [USD] Million
263
264 Figure 2 LEC for the portfolio of buildings of Medellín (Salgado-Gálvez et al. 2014a)
265
266 Three different sets of vulnerability functions were used to calculate the required factors. The
267 first set corresponds to the physical vulnerability functions to calculate the mean damage ratio
268 (MDR) for each element which captures the distribution of damage values in each building
269 class given a seismic intensity. If this parameter has a value higher than 20%, the building is
270 considered to be unsafe to be occupied and thus, depending on its use, its occupants are
271 considered either homeless or unemployed. The second and third sets of functions have to do
272 with the deaths and injured estimation and depend on the building class.
273
274 For the estimation of deaths and injuries, fatality rates proposed by Jaiswal et al. (2011) were
275 selected and also, a workday scenario is assumed. Given that occupation is a dynamic
276 parameter and the day and time of the earthquake cannot be established with this approach, a
277 rate of 60% occupancy, which corresponds to an average occupation according to Liel and
278 Deierlein (2012), was used for the calculation, as previously chosen in Salgado-Gálvez et al.
279 (2015c).
280
281 The selected seismic event is associated to the Romeral Fault System which is the one that
282 controls the seismic hazard level for medium and long return periods in Medellín (AIS 2010).
283 Table 2 shows the characteristics of the selected event in terms of location, depth and
284 magnitude.
285
286 Table 2 General characteristics of the selected event
Longitude -75.69°
Latitude 6.24°
Depth 12 Km
Magnitude 6.9
287 Mean return period 306 Years
2
An exchange rate of 1USD=3,000COP has been used in this study
Natural Hazards, 80(3), 2016, 1995‐2021288
289 Table 3 shows the estimated direct impact results of the selected event in terms of economic
290 loss, deaths, and injuries as well as homeless and unemployed, while Figure 3 shows the
291 shakemap in terms of the peak ground acceleration (PGA), at bedrock level, of the selected
292 event in the area of analysis. That value was modified through the transfer functions to
293 account for the local dynamic soil response. Figure 4 shows the MDR distribution for
294 Medellín.
295
296 Table 3 Result of the direct losses for the selected event
Seismogenetic source Romeral Fault System
Expected loss (Million USD) 10,963
Deaths 51,780
Injuries 68,165
Homeless 177,671
297 Unemployed 37,547
298
299
300 Figure 3 Shakemap for PGA of the selected event (cm/s2) at bedrock level
301
Natural Hazards, 80(3), 2016, 1995‐2021302
303 Figure 4 MDR (%) estimation for the portfolio of buildings in Medellín
304
305 From the obtained results it can be seen that the highest MDR occurs in Villa Hermosa
306 County which is located on the eastern part of the city where the high structural vulnerability
307 is due to the large number of masonry units combined with the amplification factors in the
308 short period range given the soil characteristics of the city (SIMPAD et al. 1999). Though
309 Aranjuez County has a significant participation of masonry dwellings, because of local soil
310 response characteristics, far less damage and losses are observed for this event. More details
311 about the characteristics of the assets as well as the assigned vulnerability functions are given
312 by Salgado-Gálvez et al. 2014a. To better understand the building stock distribution along the
313 city, Table 4 shows the percentage of building classes and the total number of dwellings by
314 County.
315
Natural Hazards, 80(3), 2016, 1995‐2021316 Table 4 Building class distribution by County
Building class
County Reinforced Reinforced Non-
Steel concrete concrete shear engineered Number of
Masonry units Wooden units units frames units wall units units dwellings
1- Popular 40.1% 30.1% - - - 29.8% 16,629
2 - Santa Cruz 65.5% 29.7% - - - 4.9% 13,016
3 - Manrique 85.0% - - 15.0% - - 21,037
4- Aranjuez 69.4% - - 30.6% - - 18,708
5 - Castilla 90.0% - - 10.0% - - 12,597
6 - Doce de Octubre 84.8% 15.2% - - - - 19,909
7 - Robledo 80.1% 10.1% - 9.7% - - 20,674
8 - Villa Hermosa 95.0% - - 5.0% - - 21,819
9 - Buenos Aires 89.9% - - 10.1% - - 17,549
10 - La Candelaria 49.9% - 14.7% 35.3% - - 11,274
11 - Laureles Estadio 29.8% - 5.1% 65.1% - - 9,832
12 - La América 90.0% - - 10.0% - - 8,868
13 - San Javier 80.2% 10.2% - 9.6% - - 18,599
14 - Poblado 20.2% - 10.1% 25.0% 44.7% - 8,747
15 - Guayabal 36.2% - 39.4% 24.4% - - 668
16 - Belén 85.0% - - 15.0% - - 21,950
317
318
319 Figure 5 shows the homeless estimation, while Figure 6 shows the unemployed estimation,
320 both at county level.
321
Figure 5 Homeless estimation for Medellín Figure 6 Unemployed estimation for Medellín
322
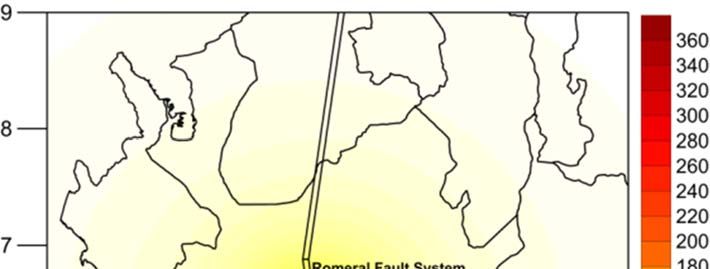
323 Figures 7 and 8 show the expected deaths and injuries estimation due to the occurrence of this
324 event where results have been grouped again at county level and per hundred thousand
325 inhabitants.
Natural Hazards, 80(3), 2016, 1995‐2021326
Figure 7 Deaths estimation for Medellín Figure 8 Injuries estimation for Medellín
327
328 It can be observed from these results that homelessness and unemployment estimations are
329 higher for Villa Hermosa, La América, Belén, Guayabal and Manrique counties, while higher
330 death rates due to the occurrence of an event with those characteristics are expected in
331 Poblado and Laureles-Estadio counties. Even though these two counties have the highest
332 income levels, they have high human density indexes and high-rise buildings with similar
333 characteristics that are more vulnerable, from the deaths and injuries point of view, if
334 compared with low-rise masonry units.
335
336 3. HOLISTIC SEISMIC RISK ASSESSMENT OF MEDELLÍN
337
338 A comprehensive risk management strategy has to be based on a multidisciplinary approach
339 that takes into account not only the physical damage and the direct impact but also a set of
340 socioeconomic factors that favour the second order effects and consider the intangible impact
341 in case an earthquake event strikes the city (Cardona and Hurtado 2000; Benson 2003;
342 Cannon 2003; Cutter et al. 2003; Davis 2003; Carreño et al. 2007; Barbat et al. 2010; Khazai
343 et al. 2014). This can be achieved by using a holistic seismic risk assessment where physical
344 damages are aggravated by a set of socioeconomic conditions allowing comprehensive risk
345 evaluations that are useful for decision-making processes. This approach also allows
346 quantifying the resilience of the analysed communities, that is, their capacity to cope with the
347 negative effects after the occurrence of an earthquake. Detailed information about this
348 methodology can be found in Carreño (2006), Carreño et al. (2007) and Barbat et al. (2011).
349
350 The methodology used in this study does not require the use of the exact same factors in each
351 case study, not even in terms of the number of descriptors used, as long as the characteristics
352 to be captured are well reflected by the ones that are chosen. The explanation is that,
353 depending on prevalent conditions of the area under analysis, some factors can be more
354 relevant than others. For this study, physical damage is obtained from the results of the
Natural Hazards, 80(3), 2016, 1995‐2021355 probabilistic approach, already shown in section 2, which is considered to have a higher
356 robustness if compared with previous holistic seismic risk evaluations performed before
357 because of the available information and its quality (Carreño et al. 2007; Marulanda et al.
358 2013).
359
360 As it was mentioned before, holistic seismic risk analysis can be performed at different scales
361 but also can account for multi-hazard approaches (Jaramillo 2014). For this study, the
362 resolution level has been set to counties and the hazard limited to earthquakes since this is the
363 only catastrophic peril expected for the city.
364
365 3.1 Methodology for the holistic risk assessment
366
367 Applying the holistic risk evaluation methodology proposed by Cardona (2001) and Carreño
368 et al. (2007), the urban seismic risk index USRi is calculated starting from a physical risk
369 index, RF, and an aggravating coefficient, F, which accounts for the socioeconomic fragility
370 and lack of resilience of the analysis area. USRi is calculated by using the equation
371
372 USRi RF (1 F ) (Eq. 3)
373
374 known in the literature as Moncho’s Equation. The physical risk index, RF, is calculated
375 considering a set of factors as well as their associated weights by means of the following
376 expression:
377
p
378 RF FRFi wRFi (Eq. 4)
i 1
379
380 where FRFi are the p physical risk factors and wRFi their corresponding weights. In this case, 8
381 factors were considered to obtain RF which were calculated from the results of the
382 probabilistic seismic risk analysis of the buildings in Medellín described in section 2, in
383 which both their structural characteristics and their mean occupation values were considered.
384
385 The aggravating coefficient, F, is calculated as follows:
386
m n
387 F FFSi wFSi FFRj wFRj (Eq. 5)
i 1 j 1
388
389 where FFSi and FFRj are the aggravating factors, wFSi and wFRj are the associated weights of
390 each i and j factor and m and n are the total number of factors for social fragility and lack of
391 resilience, respectively. For this case, 9 descriptors were used to capture the social fragility
392 conditions on each county while 6 descriptors are considered to capture the lack of resilience.
393 Most of the descriptors were obtained using data from the local authorities (Alcaldía de
394 Medellín 2012a; 2012b; Proantioquia et al. 2012; DAP 2012) with the exception of the
395 calculation of public areas and distances to the closest hospitals and health centres, where
396 geographical information system (GIS) tools were used. Figure 9 shows the summary of the
397 descriptors used in this analysis where the ones denoted as FRFi are related to the physical risk
398 index, the ones denoted as FFSi are related to the social fragility and the ones denoted as FFR1
399 are related to the lack of resilience.
400
Natural Hazards, 80(3), 2016, 1995‐2021401 The selection of the descriptors for RF was based on the outcomes that could be extracted
402 from the fully probabilistic seismic risk analysis, while existing and available indicators that
403 capture social fragility and lack of resilience issues were selected for the evaluation of F.
404
FRF1 AAL commercial sector wRF1
FRF2 AAL industrial sector wRF2
FRF3 AAL institutional sector wRF3
FRF4 AAL residential sector wRF4
FRF5 Expected injured wRF5 RF Physical risk
FRF6 Expected deaths wRF6
FRF7 Expected unemployed wRF7
FRF8 Expected homeless wRF8
FFS1 Violent deaths rate wFS1 Urban Seismic
FFS2 Quality life index wFS2 Risk Index
FFS3 Mortality rate wFS3 USRi
FFS4 Illiteracy rate wFS4
FFS5 Poor connection to electricity net. wFS5
FFS6 Poor connection to water network wFS6
FFS7 Poor connection to sewage net. wFS7
FFS8 No access to public health care wFS8 F Aggravating coefficient
FFS9 Population density wFS9
FFR1 Public area wFR1
FFR2 Distance to closest hospital wFR2
FFR3 Distance to closest health centre wFR3
FFR4 Human development index wFR4
FFR5 Development level wFR5
FFR6 Emergency operation level wFR6
405 Figure 9 Factors used for the holistic seismic risk evaluation in Medellín
406
407 It is evident that each of the factors used in the calculation of the USRi captures different
408 aspects and is quantified in different units. Because of that, certain scaling procedures are
409 needed to standardize the values of each descriptor and convert them into commensurable
410 factors. In this case, transformation functions were used to standardize the physical risk,
411 social fragility and lack of resilience factors selected for this study. Some of them are shown
412 in Figure 10. The factors and their units, as well as the [min, max] values are shown on the
413 abscissa and also, depending on the nature of the descriptor, the shape and characteristics of
414 the functions vary and, because of that, for example functions related to descriptors of the
415 physical risk have an increasing shape while those related to resilience have a decreasing one;
416 that is, the higher the value of the factors, the lower their aggravation. The transformation
417 functions can be understood as risk and aggravating probability distribution functions or as
418 the membership functions of the linguistic benchmarking of high risk or high aggravation.
419
Natural Hazards, 80(3), 2016, 1995‐2021420
421
422 Figure 10 Examples of transformation functions
423
424 The values on the abscissa of the transformation functions correspond to the values of the
425 descriptors while the ordinate corresponds to the final value of each factor, either related to
426 the physical risk or to the aggravating factor. In all cases, values of the factor lie between 0
427 and 1. Since the transformation functions are membership functions, for high risk and
428 aggravating coefficient levels, 0 corresponds to non-membership while 1 means full
429 membership. Limit values, denoted as XMIN and XMAX are defined by using expert criteria and
430 information about previous disasters in the region. Relative weights wFSi and wFRj that
431 associate the importance of each of the factors on the index calculation are obtained by using
432 an Analytic Hierarchy Process (AHP) that gives ratio scales from both discrete and
433 continuous paired comparisons (Saaty and Vargas 1991; Carreño 2006; Carreño et al. 2007).
434 AHP process was based on participation of local stakeholders and national disaster risk
435 reduction and management experts for the definition of the weights of the aggravating
436 coefficient factors, while, for the ones associated to the physical risk factors, besides the
437 above mentioned participants, the authors also participated.
438
439 Tables 5 and 6 present the associated weights for the physical risk and the aggravating
440 coefficient factors.
441
Natural Hazards, 80(3), 2016, 1995‐2021442 Table 5 Weights for the physical risk factors
Factor Weight
F RF1 0.15
F RF2 0.15
F RF3 0.15
F RF4 0.10
F RF5 0.10
F RF6 0.10
F RF7 0.20
443 F RF8 0.05
444
445 Table 6 Weights for the aggravating coefficient factors
Factor Weight
F FS1 0.03
F FS2 0.06
F FS3 0.03
F FS4 0.12
F FS5 0.05
F FS6 0.05
F FS7 0.05
F FS8 0.10
F FS9 0.07
F FR1 0.08
F FR2 0.04
F FR3 0.08
F FR4 0.08
F FR5 0.06
446 F FR6 0.10
447
448 3.2 Results of the holistic risk assessment for Medellín
449
450 This section presents the results obtained using the methodology in terms of RF, F and USRi.
451 Table 7 presents the results of this study for the 16 counties of Medellín sorted in descending
452 order according to the USRi results.
453
Natural Hazards, 80(3), 2016, 1995‐2021454 Table 7 Results obtained for Medellín
County RF F USRi
Villa Hermosa 0.31 0.28 0.39
La América 0.28 0.32 0.37
Poblado 0.28 0.20 0.34
Laureles Estadio 0.24 0.27 0.31
La Candelaria 0.22 0.33 0.29
Buenos Aires 0.22 0.28 0.28
Guayabal 0.18 0.29 0.23
Belén 0.17 0.20 0.21
Aranjuez 0.12 0.32 0.16
San Javier 0.10 0.41 0.15
Castilla 0.10 0.30 0.13
Robledo 0.09 0.31 0.12
Manrique 0.08 0.33 0.10
Doce de Octubre 0.07 0.28 0.08
Popular 0.06 0.34 0.08
Santa Cruz 0.02 0.29 0.02
455
456
457 Since the results have been obtained using a GIS tool, maps with the distribution of the results
458 can be built and could be of help to decision-makers for communicative and comparison
459 purposes among them. For each index, a ranking has been generated to classify each result
460 into low, medium-low, medium-high, high and very high categories. Figure 11 shows the RF
461 at county level. The highest RF values are found in Villa Hermosa and Poblado while the
462 lowest values are found in Popular and Santa Cruz. This is an interesting finding since the
463 two lowest results correspond to low-income areas and can be explained by the low injury and
464 death rates associated to the building classes in these areas since they correspond to non-
465 engineered systems, typically made from light materials, that do not represent, in general
466 terms, harm to the inhabitants. Another finding of interest is that, even though Poblado has
467 the best socioeconomic conditions, a disorganized urbanization process has been developed in
468 the area and high rise structures, not always complying with the requirements established by
469 the Colombian earthquake resistant building code, have been built. Its large RF value is
470 explained by the high physical vulnerability and the consequences in terms of expected
471 deaths, injured and homeless in it. In terms of the categories used to aggregate the results,
472 only Villa Hermosa has a high physical risk index category, while medium-high values are
473 found at Poblado, Laureles Estadio, La Candelaria, La América and Buenos Aires.
474
475 In all counties, the descriptors that, after considering their relative weights, contribute the
476 most to RF are the ones that account for deaths and homeless. The estimation of these
477 descriptors is directly related to the physical damage of the dwellings and, thus, a reduction on
478 these descriptors can be achieved through the development of retrofitting schemes of at least
479 essential buildings such as hospitals and schools, while also decreasing the physical
480 vulnerability of new infrastructure by enforcement on the use of the earthquake building code.
481 Reducing the existing vulnerability is an ideal approach, but incentives to do so must be
482 created, even more when seismic risk perception is low because of the low occurrence rate of
483 earthquakes in Medellín.
484
Natural Hazards, 80(3), 2016, 1995‐2021485
486 Figure 11 Physical risk index by county level for Medellín
487
488 Figure 12 shows the aggravating coefficient, F, at county level. The highest F is found at San
489 Javier which constitutes a problematic area of the city from the social, urban planning and
490 security perspective. Additionally, marginal areas, such as the ones that exist in Villa
491 Hermosa and Popular, contribute to the large aggravating coefficients. Better characteristics
492 can be found in Laureles-Estadio, and Poblado which are the wealthiest and more urban
493 developed areas, though not necessarily organized, of Medellín. Belén constitutes an
494 interesting case because, despite the fact that it does not have the best economic conditions, it
495 presents a low aggravating coefficient because of the presence of several hospitals and
496 medical centres.
497
498 From the results, the descriptors for social fragility and lack of resilience that most contribute
499 to the aggravating coefficient, F, are the population density and the public area, respectively.
500 These issues can be addressed by integrating the results with urban planning actions that can
501 account for the improvement of today’s conditions regarding those topics and need to be
502 included in the development plans of the city. The population density captured here is not
503 proportional to the casualties estimation performed for the estimation of RF since the
504 vulnerability functions vary from building class to building class and, as shown in Table 4,
505 that distribution has significant variations along different areas of the city.
506
Natural Hazards, 80(3), 2016, 1995‐2021507
508 Figure 12 Aggravating coefficients by county for Medellín
509
510 Figure 13 shows the USRi at county level. The highest USRi is found in Villa Hermosa
511 followed by Poblado since a high RF value is combined with an intermediate F, whereas
512 important increases in the final results are observed in La América, Laureles Estadio, Buenos
513 Aires and La Candelaria, reflecting the importance of accounting for socioeconomic
514 characteristics, additional to the traditional physical seismic risk results. From here, it can be
515 concluded that even if income levels are useful to determine the vulnerability of a certain
516 area, from either the physical or social dimension, it is not the only driver that influences the
517 final result. Finally, Figure 14 shows the ranking in terms of the USRi to better understand the
518 differences on the results between the counties.
519
Natural Hazards, 80(3), 2016, 1995‐2021520
521 Figure 13 USRi results by county for Medellín
522
Villa Hermosa
La América
Poblado
Laureles Estadio
La Candelaria
Buenos Aires
Guayabal
Belén
Aranjuez
San Javier
Castilla
Robledo
Manrique
12 de Octubre
Popular
Santa Cruz
0.00 0.05 0.10 0.15 0.20 0.25 0.30 0.35 0.40 0.45
USRi
523
524 Figure 14 USRi ranking for Medellín
525
Natural Hazards, 80(3), 2016, 1995‐2021526 3.3 Disaggregation of the holistic assessment of risk at county level
527
528 Given that the USRi is a composite indicator, after obtaining the final result it is possible to
529 disaggregate it and to see the contribution of the different descriptors related to the physical
530 risk and/or the social fragility and lack of resilience. This disaggregation can be made for the
531 16 counties of Medellín. As an example, the mentioned disaggregation is presented for the
532 Villa Hermosa County, the one with the highest USRi.
533
534 For RF, as it can be seen in Figure 15, the descriptor with higher participation is the FRF7
535 (using the same notation as Figure 9) which is related to the number of homeless which, as
536 was explained above, is directly related to the calculated MDR given the occurrence of the
537 selected earthquake event. For the social fragility descriptors, the one with higher
538 participation is FFS1 related to the violent deaths rate, as it can be seen in Figure 16. Finally,
539 for the lack of resilience descriptors, the one with higher overall participation is FFR1,
540 associated with the available public space, as shown in Figure 17.
541
FRF8
FRF7
FRF6
Descriptor
FRF5
FRF4
FRF3
FRF2
FRF1
0.00 0.05 0.10 0.15 0.20 0.25
FRFi*wRFi
542
543 Figure 15 FRFi disaggregation for Villa Hermosa County
544
FFS9
FFS8
FFS7
FFS6
Descriptor
FFS5
FFS4
FFS3
FFS2
FFS1
0.00 0.01 0.02 0.03 0.04 0.05 0.06
FFSi*wFSi
545
546 Figure 16 FFSi disaggregation for Villa Hermosa County
547
Natural Hazards, 80(3), 2016, 1995‐2021FFR6
FFR5
FFR4
Descriptor
FFR3
FFR2
FFR1
0.00 0.02 0.04 0.06 0.08 0.10 0.12
FFRj*wFRj
548
549 Figure 17 FFRi disaggregation for Villa Hermosa County
550
551 Besides allowing identifying the factors that mostly contribute to the USRi either in overall
552 terms or by category, the disaggregation process highlights the necessity of a multi-
553 disciplinary approach in a comprehensive seismic risk assessment framework since the risk
554 drivers may be related to different origins such as building code compliance and enforcement,
555 urban planning and territorial management, as it has been explained for the Villa Hermosa
556 County. The results of this study can be integrated into other assessments related to the
557 performance of the disaster risk management strategies in the city, such as the one developed
558 by López (2010). Also, incorporating these aspects in the disaster risk management scheme at
559 local level is of high importance in a city where the perception of seismic hazard and risk is
560 low by its inhabitants, but, where not only because of the geological and tectonic conditions
561 but to the social, economic and urban planning ones, the occurrence of an earthquake can lead
562 to disastrous consequences.
563
564 4. CONCLUSIONS
565
566 Probabilistic risk assessment methodologies, such as the one used by the CAPRA Platform,
567 include advanced tools to quantify expected losses on a portfolio of exposed assets given the
568 occurrence of hazardous events. These tools must be understood as models that are intended
569 to represent a reliable order of magnitude of the expected losses and not to predict events and
570 exact amounts. It is important to obtain physical risk results using a probabilistic approach,
571 considering the inherent uncertainties, but it is also essential to move towards the use of the
572 results within a multidisciplinary disaster risk management framework, such as the one of this
573 study. When calculating physical losses with this approach, it is important to take into account
574 the correlation between the losses since its exclusion may lead to underestimation of them;
575 details about how this issue is dealt with, within the CAPRA Platform, can be found in
576 Salgado-Gálvez et al. (2014a).
577
578 Regarding the risk identification process, building by building information is useful since the
579 individual location of a dwelling in a large city such as Medellín can lead to significant
580 changes on its individual expected damages and losses due to geographical variations on the
581 hazard intensities, a fact that is heightened when a seismic microzonation study is included.
582 On the other hand, when communicating aggregated risk through maps, results should be
583 grouped in larger divisions such as counties in order to avoid misleading conclusions.
Natural Hazards, 80(3), 2016, 1995‐2021584 Catastrophe risk models are based on the large numbers law, where a statistically significant
585 number of elements are required to obtain a reliable estimation of the risk results but seen as a
586 whole and not on an individual basis. For that reason the physical risk results have been
587 grouped at county level which constitutes the administrative division for Medellín. Grouping
588 results on administrative areas can also facilitate the decision-making process since
589 comprehensive schemes can be developed by establishing actions that, in overall, can reduce
590 today’s risk conditions.
591
592 It is relevant to quantify seismic risk from both a physical and a holistic perspective because
593 even though earthquakes are not the most common hazardous event in the city if compared to
594 flash floods or landslides (which are not considered catastrophic); an event like this can lead
595 to correlated damages and deaths, as well as to important disruptions occurring at the same
596 time in different zones within the city. Also, though the uncertainties related to the physical
597 seismic risk assessment have been accounted for, future research is needed in order to
598 incorporate the ones existing in the considered socio-economic characteristics (Burton and
599 Silva 2014). Those cannot be handled by means of probability distributions but nevertheless it
600 is important to highlight that within the methodology explained and used herein, sensitivity
601 tests on input data, weight and transformation functions using Monte Carlo simulations have
602 shown how, at urban level, the risk rankings and risk level ranges derived from the composite
603 indicator are robust (Marulanda et al 2009).
604
605 Seismic risk assessed from a hard, soft or holistic approach is intended to contribute to the
606 effectiveness of management strategies which largely depend on the decision-making process.
607 Though this methodology can be understood as a simplified representation of the seismic risk
608 at urban level, it performs a multidisciplinary approach that accounts not only for the physical
609 damage but for social, institutional, economic and organizational issues that influence the risk
610 results. Vulnerability is not only seen as a risk factor determined by the physical
611 characteristics of a group of buildings, but also as being related to social fragility and lack of
612 resilience of the exposed communities, while poverty must be understood as a vulnerability
613 driver and not vulnerability itself.
614
615 A disaster risk reduction management scheme must involve an interdisciplinary process and
616 the holistic evaluation contributes to this process, not only by considering the socioeconomic
617 factor but by being a useful way to communicate risk through the identification of the critical
618 areas of a city where the vulnerability is assessed considering different perspectives.
619
620 Finally, these kind of evaluations can be periodically updated to evaluate the effectiveness of
621 the prevention and mitigation strategies defined for the area of analysis whilst highlighting the
622 most important measures to be taken that are needed to decrease either the physical
623 vulnerability, the social fragility conditions and/or the lack of resilience.
624
625 ACKNOWLEDGMENTS
626
627 The authors are grateful for the support of the Ministry of Education and Science of Spain
628 “Enfoque integral y probabilista para la evaluación del riesgo sísmico en España”—
629 CoPASRE (CGL2011-29063). Also to the Spain’s Ministry of Economy and Competitiveness
630 in the framework of the researcher’s formation program (FPI) and the support of the "Paul C.
631 Bell, Jr." risk management program of the Florida International University (FIU). This work
632 has also been partially sponsored by the European Commission (project DESURBS-FP7-
Natural Hazards, 80(3), 2016, 1995‐2021633 2011-261652). Finally the authors would like to thank an anonymous reviewer whose
634 comments helped to improve the original version of the manuscript.
635
636 REFERENCES
637
638 Ahmad N., Ali Q., Crowley H. and Pinho R. (2014). Earthquake loss estimation of residential
639 buildings in Pakistan. Nat. Hazards. DOI: 10.1007/s11069-014-1174-8.
640
641 Alcaldía de Medellín, (2012a). Encuesta de calidad de vida 2011. Departamento Administrativo de
642 Planeación.
643
644 Alcaldía de Medellín, (2012b). Indicadores básicos. Situación de salud en Medellín 2011. Secretaría
645 de Salud de Medellín.
646
647 Alcaldía de Medellín. (2010). Geonetwork.
648 http://poseidon.medellin.gov.co/geonetwork/srv/es/main.home Accessed January 12th 2013.
649
650 Asociación Colombiana de Ingeniería Sísmica-AIS. (2010). Estudio General de Amenaza Sísmica de
651 Colombia. Comité AIS-300. Bogotá D.C., Colombia.
652
653 Asociación Colombiana de Ingeniería Sísmica-AIS. (1996). Estudio General de Amenaza Sísmica de
654 Colombia. Comité AIS-300. Bogotá D.C., Colombia.
655
656 Barbat A.H., Carreño M.L., Cardona O.D. and Marulanda M.C. (2011). Evaluación holística del riesgo
657 sísmico en zonas urbanas Revista int. de métodos numér. para calc. y diseño en ing. 27(1):3-27.
658
659 Barbat A.H., Carreño M.L., Pujades L.G., Lantada N., Cardona O.D. and Marulanda M.C. (2010).
660 Seismic vulnerability and risk evaluation methods for urban áreas. A review with application to a
661 pilot area. Struct. and infraestruct. eng. 6(1-2):17-38.
662
663 Bazzurro P. and Luco N. (2005). Accounting for uncertainty and correlation in earthquake loss
664 estimation. ICOSSAR. ISBN 90 5986 040 4.
665
666 Benson C. (2003). The economy-wide impact of natural disasters in developing countries. Thesis.
667 University of London.
668
669 Birkmann J., Cardona O.D., Carreño M.L., Barbat A.H., Pelling M., Schneiderbauer S., Kienberger S.,
670 Keiler M., Alexander D., Zeil P. and Welle T. (2013). Framing vulnerability, risk and societal
671 responses: the MOVE framework. Nat. Hazards 67:193-211. DOI: 10.1007/s11069-013-0558-5.
672
673 Bommer J.J. and Crowley H. (2006). The influence of ground-motion variability in earthquake loss
674 modelling. Bull. of earthq. Eng. DOI: 10.1007/s10518-006-9008-z.
675
676 Brink S.A. and Davidson R.A. (2014). Framework for Comprehensive Assessment of a City’s Natural
677 Disaster Risk. Earthq. spectra. DOI: 10.1193/021914EQS031M. In press.
678
679 Burton C.G., Khazai B. and Silva V. (2014). Social vulnerability and integrated risk assessment within
680 the Global Earthquake Model. Proceedings of the Tenth U.S. National conference on Earthquake
681 Engineering. Anchorage, United States of America.
682
683 Burton C.G. and Silva V. (2014). Integrated risk modelling within the Global Earthquake Model
684 (GEM): Test case application for Portugal. Proceedings of the Second European Conference on
685 Earthquake Engineering and Seismology. Istambul, Turkey.
686
687 Caers J. (2011). Modeling Uncertainty in the Earth Sciences. Wiley-Blackwell.
Natural Hazards, 80(3), 2016, 1995‐2021688
689 Cannon T. (2003). Vulnerability analysis, livelihoods and disasters components and variables of
690 vulnerability: modelling and analysis for disaster risk management. Universidad Nacional de
691 Colombia. Manizales.
692
693 Cardona O.D. (2009). La gestión financiera del riesgo de desastres: Instrumentos financieros de
694 retención y transferencia para la Comunidad Andina. PREDECAN. Lima, Perú.
695
696 Cardona O.D. (2001). Estimación holística del riesgo sísmico utilizando sistemas dinámicos
697 complejos. Ph.D. Thesis. Universidad Politécnica de Cataluña. Barcelona, Spain.
698
699 Cardona O.D. and Hurtado J. (2000). Holistic seismic risk estimation of a metropolitan center. 12th
700 World Conference on Earthquake Engineering, Auckland, New Zealand.
701
702 Cardona O.D., Ordaz M., Mora M., Salgado-Gálvez M.A., Bernal G.A., Zuloaga-Romero D.,
703 Marulanda M.C., Yamín L. and González D. (2014). Global risk assessment: A fully probabilistic
704 seismic and tropical cyclone wind risk assessment. Int. j. of disaster risk reduct. 10:461-476.
705 DOI:10.1016/j.ijdrr.2014.05.006.
706
707 Cardona O.D., Ordaz M., Reinoso E., Yamín L.E. and Barbat A.H. (2012). CAPRA – Comprehensive
708 Approach to Probabilistic Risk Assessment: International Initiative for Risk Management
709 Effectiveness. 15th World Conference on Earthquake Engineering. Lisbon, Portugal.
710
711 Cardona O.D., Ordaz M., Reinoso E., Yamín L.E. and Barbat A.H. (2010). Comprehensive Approach
712 to Probabilistic Risk Assessment (CAPRA); International initiative for disaster risk management
713 effectiveness. 14th European conference on earthquake engineering, Ohrid, Macedonia.
714
715 Cardona O.D., Ordaz M.G., Yamín L.E., Marulanda M.C. and Barbat A.H. (2008a). Earthquake loss
716 assessment for integrated disaster risk management. J. of earthq. eng. 12(S2):48-59.
717
718 Cardona O.D., Ordaz M.G., Marulanda M.C. and Barbat A.H. (2008b). Estimation of probabilistic
719 seismic losses and the public economic resilience – An approach for macroeconomic impact
720 evaluation. J. of earthq. eng. 12(S2):60-70.
721
722 Carreño M.L. (2006). Técnicas innovadoras para la evaluación del riesgo sísmico y su gestión en
723 centros urbanos: Acciones ex ante y ex post. Doctoral Thesis. Universidad Politécnica de
724 Cataluña, Barcelona, Spain.
725
726 Carreño M.L., Cardona O.D. and Barbat A.H. (2007). Urban seismic risk evaluation: a holistic
727 approach. Nat. Hazards. 40(1):137-172.
728
729 Carreño M.L., Cardona O.D. and Barbat A.H. (2012). New methodology for urban seismic risk
730 assessment from a holistic perspective. Bull. of earthq. eng. 10(2):547-565.
731
732 Carreño M.L., Cardona O.D. and Barbat A.H. (2014). Método numérico para la evaluación holística
733 del riesgo sísmico utilizando la teoría de conjuntos difusos. Revista int. de métodos numér. para
734 calc. y diseño en ing. 30(1):24-34.
735
736 CIMNE-RAG (2014). Holistic risk evaluation tool EvHo V1.0. Program for computing holistic risk at
737 urban level. Centro Internacional de Métodos Numéricos en Ingeniería, CIMNE, Risk Assessment
738 Group, RAG, Barcelona, Spain.
739
740 Crowley H., Stafford P.J. and Bommer J.J. (2008). Can earthquake loss models be validated using
741 field observations? j.of earthq. Eng. 12:1078-1104.
742
Natural Hazards, 80(3), 2016, 1995‐2021You can also read