Individuals at increased risk for development of bipolar disorder display structural alterations similar to people with manifest disease
←
→
Page content transcription
If your browser does not render page correctly, please read the page content below
Translational Psychiatry                                                                                                                               www.nature.com/tp

ARTICLE                  OPEN

Individuals at increased risk for development of bipolar
disorder display structural alterations similar to people with
manifest disease
                  ✉
Pavol Mikolas 1 , Kyra Bröckel1, Christoph Vogelbacher2,3,4, Dirk K. Müller1,5,6, Michael Marxen 1,5, Christina Berndt1,
Cathrin Sauer , Stine Jung1, Juliane Hilde Fröhner 1,5, Andreas J. Fallgatter7, Thomas Ethofer7,8, Anne Rau7, Tilo Kircher2,3,4,
              1

Irina Falkenberg 2,3,4, Martin Lambert9, Vivien Kraft 9, Karolina Leopold10, Andreas Bechdolf10, Andreas Reif 11, Silke Matura11,
Thomas Stamm12,13, Felix Bermpohl12, Jana Fiebig12, Georg Juckel14, Vera Flasbeck 14, Christoph U. Correll15,16,17, Philipp Ritter 1,
Michael Bauer 1, Andreas Jansen2,3,4 and Andrea Pfennig1

© The Author(s) 2021

    In psychiatry, there has been a growing focus on identifying at-risk populations. For schizophrenia, these efforts have led to the
    development of early recognition and intervention measures. Despite a similar disease burden, the populations at risk of bipolar
    disorder have not been sufficiently characterized. Within the BipoLife consortium, we used magnetic resonance imaging (MRI) data
    from a multicenter study to assess structural gray matter alterations in N = 263 help-seeking individuals from seven study sites. We
    defined the risk using the EPIbipolar assessment tool as no-risk, low-risk, and high-risk and used a region-of-interest approach (ROI)
    based on the results of two large-scale multicenter studies of bipolar disorder by the ENIGMA working group. We detected
    significant differences in the thickness of the left pars opercularis (Cohen’s d = 0.47, p = 0.024) between groups. The cortex was
    significantly thinner in high-risk individuals compared to those in the no-risk group (p = 0.011). We detected no differences in the
    hippocampal volume. Exploratory analyses revealed no significant differences in other cortical or subcortical regions. The thinner
    cortex in help-seeking individuals at risk of bipolar disorder is in line with previous findings in patients with the established disorder
    and corresponds to the region of the highest effect size in the ENIGMA study of cortical alterations. Structural alterations in
    prefrontal cortex might be a trait marker of bipolar risk. This is the largest structural MRI study of help-seeking individuals at
    increased risk of bipolar disorder.

    Translational Psychiatry (2021)11:485 ; https://doi.org/10.1038/s41398-021-01598-y

INTRODUCTION                                                                               associated with a disease burden comparable to psychotic
In recent years, there has been an increasing effort to define and                          disorders [4], the populations at risk have not been sufficiently
characterize individuals at risk for psychiatric disorders. These                          identified and characterized [5].
efforts gave rise to specialized early recognition services, which                            Bipolar disorder has been associated with brain structural
provide risk-stratifications and targeted interventions for help-                           alterations. Whereas earlier structural magnetic resonance imaging
seeking individuals at risk [1, 2]. As an example, cumulative                              (MRI) studies focused on cortical volume, more specific segmenta-
evidence from epidemiological, genetic, neuroimaging, and                                  tion methods allowed for its discrete and developmentally distinct
interventional studies led to the establishment of the psychosis                           quotients—cortical thickness and surface area [6–8]. Up to date, the
risk syndrome, which is now included as a diagnostic category in                           ENIGMA group performed two large-scale multicenter studies,
the Diagnostic and Statistical Manual of Mental Disorders (DSM-5)                          which analyzed structural differences between individuals with
[3]. Although bipolar disorder remains similarly prevalent and is                          bipolar disorder and healthy participants [9, 10], thereby

1
 Department of Psychiatry and Psychotherapy, Carl Gustav Carus University Hospital, Technische Universität Dresden, Dresden, Germany. 2Core-Facility Brainimaging, Faculty of
Medicine, University of Marburg, Marburg, Germany. 3Department of Psychiatry, University of Marburg, Marburg, Germany. 4Center for Mind, Brain and Behavior (CMBB),
University of Marburg and Justus Liebig University Giessen, Marburg, Germany. 5Neuroimaging Center, Technische Universität Dresden, Dresden, Germany. 6Institute for Medical
Informatics and Biometry, Carl Gustav Carus Faculty of Medicine, Technische Universität Dresden, Dresden, Germany. 7Department of Psychiatry and Psychotherapy, Tübingen
Center for Mental Health, University of Tübingen, Tübingen, Germany. 8Department for Biomedical Resonance, University of Tübingen, Tübingen, Germany. 9Department of
Psychiatry and Psychotherapy, University Medical Center Hamburg-Eppendorf, Hamburg, Germany. 10Department of Psychiatry, Psychotherapy and Psychosomatic Medicine,
Vivantes Hospital Am Urban and Vivantes Hospital Im Friedrichshain, Charité-Universitätsmedizin Berlin, Berlin, Germany. 11Department of Psychiatry, Psychosomatic Medicine
and Psychotherapy, University Hospital, Goethe University, Frankfurt, Germany. 12Department of Psychiatry and Neurosciences, Charité Campus Mitte, Charité -
Universitätsmedizin Berlin, Berlin, Germany. 13Department of Clinical Psychiatry and Psychotherapy, Brandenburg Medical School Theodor Fontane, Neuruppin, Germany.
14
  Department of Psychiatry, Psychotherapy and Preventive Medicine, LWL University Hospital, Ruhr-University, Bochum, Germany. 15Department of Child and Adolescent
Psychiatry, Charité Universitätsmedizin Berlin, Berlin, Germany. 16Department of Psychiatry, Northwell Health, The Zucker Hillside Hospital, Glen Oaks, NY, USA. 17Department of
Psychiatry and Molecular Medicine, Donald and Barbara Zucker School of Medicine at Hofstra/Northwell, Hempstead, NY, USA. ✉email: pavol.mikolas@uniklinikum-dresden.de

Received: 1 July 2021 Revised: 6 August 2021 Accepted: 25 August 2021
P. Mikolas et al.
2
overcoming typical limitations of single studies or traditional meta- bipolar disorder and healthy controls, respectively, and published
analyses, such as low power, publication bias, or comparability of the lists of effect sizes for particular regions. From those data, we
results [11]. In the first study, Hibar et al. [10]. investigated selected one cortical and one subcortical ROI based on the largest
subcortical structures in 4304 participants and found reduced effect size in the given study. More specifically, we selected the
volumes of hippocampus, amygdala, and thalamus among left inferior frontal gyrus—pars opercularis (a region within the
individuals with bipolar disorder. In the second large-scale study, broader ventrolateral prefrontal cortex (VLPFC)) from Hibar et al.
the authors [9] investigated cortical structures in a sample of 6503 [9] and hippocampus from Hibar et al. [10]. As Hibar et al. [9]
participants and identified a pattern of significant reductions of identified differences only in cortical thickness and not in the
cortical thickness in frontal, temporal, and parietal regions, with surface area, we analyzed the differences in cortical thickness
maximum effect size in the left inferior frontal gyrus—pars between the bipolar risk groups for pars opercularis. As the above-
opercularis (see below). Moreover, the reductions of cortical mentioned modalities do not apply for subcortical structures, and
thickness correlated with illness duration. This study detected no in accordance with Hibar et al. [10]. We analyzed the differences in
differences in the surface area. According to a recent meta-analysis, gray matter volume in the case of hippocampus. Lastly, we also
volumetric studies in patients in early stages of illness consistently aimed to detect possible widespread differences in cortical
reported reduced volume of the bilateral pregenual anterior thickness or subcortical volumes in exploratory analyses outside
cingulate cortex [12]. the pre-specified ROIs. To our knowledge, the present study is the
Structural MRI studies in people at risk for bipolar disorder have largest structural MRI study of help-seeking individuals at
so far exclusively focused on genetic risk, i.e. studying the affected increased risk of bipolar disorder.
or unaffected first-degree relatives of bipolar patients. Interest-
ingly, in contrast to patients with established disease, individuals
with genetic risk seem to display rather increased cortical volume,
particularly in the right inferior frontal gyrus, lingual gyrus, and MATERIALS AND METHODS
superior temporal gyrus [13–15]. Higher cortical volume of the Participants
In this study, we analyzed the MRI and baseline clinical data acquired in a
inferior frontal gyrus was proposed as a trait for genetic risk and subsample of the ongoing Early-BipoLife study. Details of the study
may diminish as a result of disease progression or other protocol can be found elsewhere [25, 26]. Briefly, the Early-BipoLife study is
1234567890();,:
contributing risk factors [14–16]. Regarding subcortical structures, a multicenter, naturalistic, prospective-longitudinal observational cohort
there has been meta-analytical evidence for reduced amygdala study performed at ten German universities and teaching hospitals with
volumes in adults with genetic risk while detecting no significant early detection centers/facilities and specialized in- and outpatient care.
effects in other subcortical structures including hippocampus, Although Early-BipoLife is an ongoing study, the baseline acquisition of
striatum, and thalamus [13, 17]. clinical and MRI data has been completed. Of the total N = 1 229 recruited
Although a positive family history was shown to be the most adolescents and young adults (age 15−35) at risk, N = 313 volunteered to
receive an MRI (recruited at seven of the ten study sites: Berlin, Bochum,
robust risk factor for bipolar disorder, only a fraction of individuals
Frankfurt, Hamburg, Dresden, Marburg, Tübingen) [27]. In order to include
with first-degree relatives will develop bipolar disorder (4.5 all proposed risk factors for bipolar disorder, we recruited the participants
−22.4%) [18–20], some may actually develop other disorders, in three recruitment pathways: N = 123 were consulting early detection
such as major depression. Additionally, most bipolar patients do centers/facilities and were screened positive for an indication of ≥1
not have a reliable positive family history. Beyond the genetic risk, proposed risk factor for bipolar disorder, N = 146 were young in- and
several non-genetic risk factors were suggested to be associated outpatients with a depressive syndrome and N = 44 had an established
with an increased risk for bipolar disorder. These include specific diagnosis of ADHD. For the complete inclusion criteria for each recruitment
subsyndromal manic symptoms, depressive syndromes, mood pathway see Supplementary Note 2. Participants were phenotyped in
swings, changes in sleep and circadian rhythm, anxiety disorders, depth including the above-mentioned instruments to assess the risk for
attention deficit hyperactivity disorder (ADHD), specific character developing bipolar disorder. For the demographic characteristics of the
sample, see Table 1 and Supplementary Tables 2, 3.
traits, stressful life events, or substance abuse [5, 21]. Based on Exclusion criteria for study enrollment were as follows: diagnosis of
studies of these risk factors, several risk-assessment tools have bipolar disorder, schizoaffective disorder, schizophrenia; diagnosis of
been developed: Bipolar-at-risk (BAR) criteria [22], Extended BAR anxiety, obsessive-compulsive, or substance dependence disorder that
criteria (BARS) [23], Bipolar Prodrome Symptom Interview and fully explained the whole symptomatology; limited ability to comprehend
Scale prospective version (BPSS-P) [24], Early Phase Inventory the study; implied expressed negative declaration of intent to participate
for Bipolar Disorders (EPIbipolar) [21] (see also Supplementary in the study by a minor; acute suicidality. The study was approved by the
Table 1). Ethics Committee of the Medical Faculty of the Technische Universität
In contrast with traditional studies of first-degree relatives, in Dresden (No: EK290082014), as well as local ethics committees at each
study site. We obtained a written informed consent after comprehensive
this study, we investigated structural alterations of the brain in
information about study aims and procedures.
help-seeking individuals at increased risk of bipolar disorders. This
approach goes beyond the genetic risk approach to search for
neural correlates of genetic, as well as non-genetic risk for bipolar
Assessment of bipolar risk
disorder. We focused on the cortical thickness for the following We used the EPIbipolar interview for the primary analyses presented here.
reasons: 1. High-grade evidence for reduced cortical thickness in EPIbipolar integrates the broadest range of early and late risk factors for
bipolar disorders in a large-scale multicenter study [9], 2. We bipolar disorder [21]. EPIbipolar is a semi-structured interview, which
hypothesized that the neural alterations in help-seeking indivi- classifies the participants according to the presence of main and secondary
duals may represent a diverse pattern of factors beyond genetics risk factors into no-risk, low-risk, and high-risk groups (for an overview see
which may be associated with structural alterations rather similar Supplementary Table 4). In this study, we used a modification of the
to those in patients with established disease (i.e. reduced cortical original risk categories according to Leopold et al. [21], which accounts for
thickness). the low sensitivity of the original high-risk category. In this analysis, the
original high-risk and ultra-high risk groups were fused, as the high-risk
In order to perform an analysis of cortical and subcortical
group contained a disproportionally low number of participants (3.2%).
structural alterations and simultaneously attain a sufficient EPIbipolar was primarily designed as a risk stratification tool for the
statistical power, we performed a ROI approach (for details on purposes of targeted clinical intervention within early recognition services.
the power calculation see Supplementary note 1). We based our From the clinical perspective, individuals with up to one secondary risk
choice on the two above-mentioned large-scale ENIGMA multi- factor, or more secondary risk factors in a bipolar non-specific constellation
center studies available at the time [9, 10]. Those studies detected might not benefit from a targeted intervention [21]. For this reason,
cortical and subcortical differences between individuals with these participants were assigned to the ‘no-risk’ category. The EPIbipolar
Translational Psychiatry (2021)11:485P. Mikolas et al.
3
Table 1. Socio-demographic characteristics. In order to assess the risk-associated structural alterations in help-seeking individuals, we divided the
participants into no-risk, low-risk, and high-risk groups using the EPIbipolar assessment tool.
No-risk Low-risk High-risk Test Post hoca
N (%) (Ntotal = 263) 32 (12.2) 130 (49.4) 101 (38.4)
Demographic
Sex female/male (%) 10/22 (31.3/68.8) 60/70 (46.2/53.8) 57/44 (56.4/43.6) χ2 = 6.642 No-risk ≠ high-risk;
p = 0.036* χ2 = 6.166
p = 0.039*
Age (SD) 24.13 (3.08) 24.78 (4.55) 25.13 (4.42) F(2,102.393) =
1.028
p = 0.361
Education
1. No degree/attending school (%) 0 (0.0) 8 (6.3) 4 (4.0) p = 0.633b
2. Secondary school (%) 6 (18.8) 18 (14.1) 18 (18.0)
3. High school (%) 26 (81.3) 102 (79.7) 78 (78.0)
Recruitment pathway
1. Early recognition (%) 15 (46.9) 48 (36.9) 50 (49.5)
2. Depression (%) 5 (15.6) 68 (52.3) 41 (40.6)
3. ADHD (%) 12 (37.5) 14 (10.8) 10 (9.9)
Psychiatric medication
Yyes (%) 11 (34.4) 82 (63.6) 53 (53.0) χ2 = 9.432 No-risk ≠ low-risk;
1. Antidepressants (%) 5 (15.6) 67 (51.5) 40 (39.6) p = 0.009** χ2 = 8.955 p = 0.009**
2. Antipsychotics (%) 1 (3.1) 25 (19.2) 11 (10.9)
3. Mood stabilizers (%) 0 (0.0) 7 (5.4) 4 (4.0)
4. Anxiolytics & Sleep (%) 1 (3.1) 8 (6.2) 7 (6.9)
5. Psychostimulants (%) 5 (15.6) 6 (4.6) 10 (9.9)
Substance use
Smoking status
1. Never smoked (%) 18 (56.3) 63 (48.5) 39 (38.6) p = 0.079b
2. Current smoker (%) 9 (28.1) 59 (45.4) 52 (51.5)
3. Past smoker (%) 5 (15.6) 8 (6.2) 10 (9.9)
Cannabis present
0. No use (%) 26 (81.3) 90 (69.2) 74 (73.3) p = 0.830b
1.P. Mikolas et al.
4
interview is being further developed and currently undergoing a we used the bilateral mean hippocampal volume as a dependent variable,
longitudinal validation within the BipoLife study [25, 26]. while controlling for all above mentioned covariates/factors, as well as for
As there might be an overlap between bipolar risk and psychosis risk the total estimated intracranial volume. We assessed the homogeneity of
syndromes, we screened for the presence of a possible psychosis risk variances between the groups using the Levene test (p = 0.146, p = 0.145
syndrome using PQ-16 self-report questionnaire [28]. In all participants for pars opercularis and hippocampus respectively). We corrected the p-
scoring 6 or above, we evaluated psychosis risk status using the Structured values for two comparisons (for two ROIs analyzed) using the false
Interview for Psychosis Risk Syndromes (SIPS) [29]. discovery rate (FDR) correction [35].
We performed the following post hoc analyses: first, we tested for a
linear effect of the risk on the cortical thickness. More specifically, we
MRI scanning conducted a multiple regression analysis with bipolar risk, sex, current
The BipoLife neuroimaging consortium involved seven study sites with
psychiatric medication, smoking status, present cannabis use, and study
different hardware and software configurations. At six sites, data were
site as independent variables, and thickness of the left parsopercularis as
acquired at Siemens Magnetom MR scanners (Trio, Skyra, Prisma). One site the dependent variable. The bipolar risk was established as ordinale values
had a Philips Achieva scanner. A detailed description of the scanning 0, 1, and 2 corresponding to the EPIbipolar risk groups no-risk, low-risk, and
protocol (including details on participating study sites, MR scanners, high-risk respectively. We then continued to generate the regression
specific hardware configurations) can be found in Vogelbacher et al. [27]. equation considering all significant independent variables. To create the
Pulse sequence parameters were standardized across all sites to the extent
diagram showing the linear effect of EPIbipolar risk on the thickness of the
permitted by each platform.
left parsopercularis while holding the other independent variables
All subjects were assessed with a large neuroimaging battery, involving constant, we inserted the sample means of the remaining significant
both high-resolution structural T1-weighted images and functional independent variables (relative frequencies for dummy variables) into the
measurements (for an overview, see Ritter et al. [26]). In the present regression equation and plotted the resulting equation (Supplementary
study, we focused on the analysis of the T1-weighted MRI data. A detailed Fig. 1). Second, we performed a whole-brain exploratory analysis using the
description of the pulse sequence parameters of all sites is given in Freesurfer Qdec tool available in FreeSurfer 6.0. We used a general linear
Vogelbacher et al. [27].
model (GLM) to estimate the differences in cortical thickness at each vertex
For quality assurance, the MRI images were analyzed using the MRIQC
of the surface between the EPIbipolar risk groups. We used age and sex as
tool [30]. MRIQC can qualify structural and functional MR images and covariates. We corrected the analysis for multiple comparisons using the
highlights the results in a human-readable report. This report contains FDR correction (p < 0.05). Third, we performed an exploratory analysis of
several metrics including a movement plot and a plot of the background the bilateral mean volumes of other subcortical structures (thalamus,
noise. For this dataset, a visual inspection by two authors was performed. amygdala, nucleus accumbens, caudate, globus pallidus, putamen) using
The focus of this inspection was the general quality of the data. A set of
generalized linear models as described above for hippocampal volume.
23 subjects was excluded from further analysis due to strong movement,
The p-values were adjusted using FDR correction (p < 0.05). Finally, we
ghosting, or fold-over artifacts. A detailed description of the MRI quality repeated the primary ROI-based analyses of left pars opercularis and
control protocol is described elsewhere [27]. hippocampus using the risk defined by BARS and BPSS-P criteria (for
details on the risk criteria see Supplementary Table 1). In accordance with
MRI preprocessing the previous study [22], we used a modified variable representing the
We used the freely available FreeSurfer 6.0 software to perform the cortical presence or absence of any BARS/BPSS-P criterion respectively (NBAR+ =
and subcortical segmentations [6, 31]. To speed up the preprocessing with 186 (70.7%), NBPSS-P+ = 56 (21.3%)).
FreeSurfer, the computation was conducted in parallel and distributed
using the NICePype [32]. For the cortical parcellations, we used the
Desikan-Killiany atlas [31, 33], obtaining cortical thickness values for 68 (34 RESULTS
left and 34 right) cortical regions. For the segmentation of subcortical ROI based primary analyses of left pars opercularis and
regions, we used the standard volumetric segmentation atlas available in hippocampus
Freesurfer [29], obtaining gray matter volumes of 14 subcortical structures
(7 left and 7 right). We detected a significant difference in the mean thickness of the
Finally, we performed a standardized quality control of the cortical and left pars opercularis [F(2, 245) = 4.475, p = 0.024 (FDR-corrected)]
subcortical segmentations and parcellations according to the established between the bipolar-risk groups (Fig. 1 and Table 2) with medium
protocols of the ENIGMA working group (http://enigma.ini.usc.edu/ effect size (Cohen’s d = 0.47). Post-hoc tests revealed a significant
protocols/imaging-protocols). Briefly, we visually inspected the segmented difference between the no-risk and high-risk individuals (p =
regions according to the internal and external surface methods and 0.012, FDR-corrected) (Fig. 1). The low-risk individuals displayed
performed statistical outlier detection. The outliers were subjected for numerically thinner cortex of the left pars opercularis compared to
further visual inspection. We discarded those subjects, who did not pass the no-risk individuals as well, while showing a greater thickness
the quality control or displayed major segmentation errors (N = 3). This than the high-risk individuals. However, both these pairwise
number was rather low, potentially due to the preceding, thorough quality
assessment using MRIQC (see above). comparisons were not statistically significant (p = 0.08 and p =
0.106 respectively, FDR-corrected).
We detected no significant difference in the mean volume of
Statistical analysis hippocampus [F(2, 244) = 0.640, p = 0.528 (FDR-corrected)]
We performed the primary, ROI-based statistical analyses using extracted between the bipolar-risk groups (Table 3).
cortical thickness values of the left pars opercularis and hippocampal
volume in IBM SPSS Statistics (version 27). After quality assessment and
discarding participants with missing values for the risk scores, N = Secondary regression analysis of left pars opercularis
263 subjects were available for the statistical analysis. In our primary A post hoc analysis using a multiple regression revealed a
analysis, we analyzed structural differences between the three EPIbipolar significant regression equation (F(13, 249) = 3.502, p < 0.001, R2 =
risk groups (no-risk, low-risk, and high-risk) in two á priori selected ROIs— 0.16) with a linear effect of the risk score on the thickness of the
left pars opercularis and hippocampus (defined as bilateral mean pars opercularis (β = −0.037, p = 0.004) (Supplementary Fig. 1).
hippocampal volume, see below) using generalized linear models. For
the left pars opercularis, in accordance with prior ENIGMA study of cortical Secondary ROI based analysis using BARS and BPSS-P criteria
structures in bipolar disorder [9], we used cortical thickness as the There were no significant differences between the participants
dependent variable, while controlling for age, sex, current medication (yes/
no), smoking status (current/past smoker/never smoked), lifetime and fulfilling vs. not fulfilling any BARS criterion in the thickness of pars
present (P. Mikolas et al.
5
A. B.
2.85
*
Mean cortical thickness (mm)
2.80
2.75
2.70
No-risk Low-risk High-risk
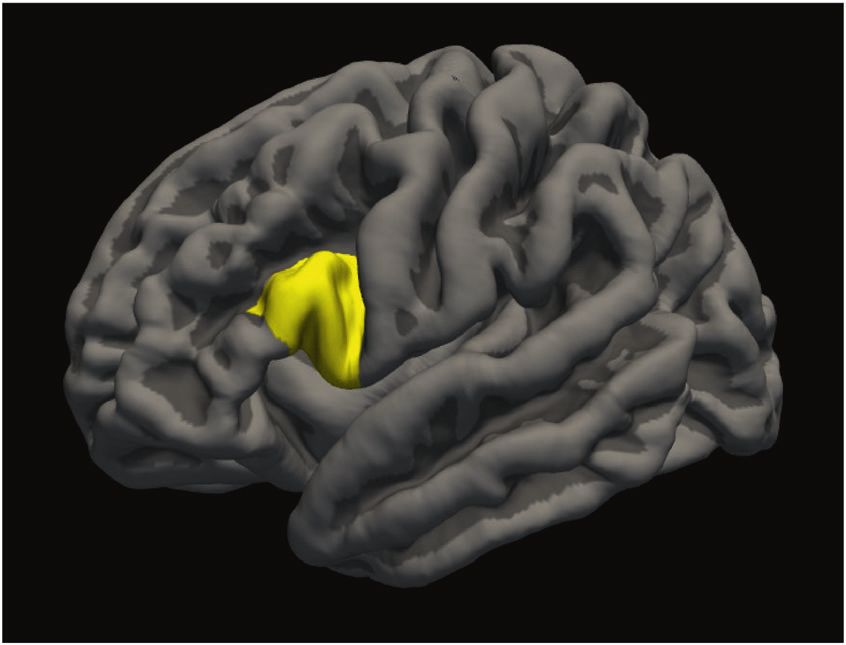
Fig. 1 ROI-based analysis of cortical thickness by individuals at increased risk for development of bipolar disorder. A Left inferior frontal
gyrus—pars opercularis as defined by the Desikan−Killiany atlas. B Mean thickness of the left pars opercularis. The post hoc tests revealed a
significantly thinner cortex of the left pars opercularis between no-risk and high-risk groups. The low-risk group tends to have lower thickness
than the no-risk group, while having a greater thickness than the high-risk group. However, these differences were not significant. * denotes
statistical significance at p = 0.012 (FDR-corrected). Error bars represent the 95% confidence intervals.
volumes (FDR-corrected): amygdala [F(2, 244) = 0.721, p = 0.487],
caudate [F(2, 244) = 1.135, p = 0.485], putamen [F(2, 244) = 1.727,
Table 2. Results of the generalized linear models using the thickness
p = 0.36], nucleus accumbens [F(2, 244) = 4.439, p = 0.078],
of the left pars opercularis as an independent variable.
thalamus [F(2, 244) = 1.914, p = 0.36], pallidum [F(2, 246) =
Measure F p-value Partial Eta squared 0.875, p = 0.487].
EPIbipolar risk 4.475 0.012 0.035
Sex 1.417 0.235 0.006
Smoking status 0.336 0.715 0.003 DISCUSSION
In this study of help-seeking individuals at risk of bipolar disorder,
Medication 2.171 0.142 0.009
we detected a significantly thinner left inferior frontal gyrus—pars
Site 3.489 0.002 0.079 opercularis in the high-risk individuals compared to the no-risk
Age 9.152 0.003 0.036 individuals. Moreover, there was a negative trend in the low-risk
Cannabis present 1.069 0.302 0.004 individuals. A post hoc analysis revealed an inverse linear effect of
the risk group on the thickness of the left pars opercularis. There
Cannabis lifetime 0.106 0.745 0.000
were no differences in the cortical thickness in the whole-brain
The significance test displays uncorrected p-values. exploratory analysis. We either did not detect any differences in
the volume of the hippocampus and other subcortical regions.
In accordance with the studies of established bipolar disorder,
this study reports thinner cortex in help-seeking individuals at risk
Table 3. Results of the generalized linear models using the of bipolar disorder. A previous, large-scale multicenter study
hippocampal volume as an independent variable. detected a pattern of reduced thickness of frontal, temporal, and
parietal cortex [9]. The significantly thinner cortex of the left pars
Measure F p-value Partial Eta squared
opercularis in high-risk individuals in our study corresponds to the
EPIbipolar risk 0.640 0.528 0.005 region of reduced thickness with maximum effect size in the
Sex 9.821 0.002 0.039 patients of established disease in Hibar et al. [9]. Other multicenter
Smoking status 0.677 0.509 0.006 studies detected a similar pattern of reduced cortical thickness in
patients with schizophrenia, but not in other disorders, such as
Medication 1.335 0.249 0.005
major depression, ADHD, obsessive-compulsive disorder, or
Site 11.566 0.000 0.221 autism [11, 36]. This suggests, that individuals at risk of bipolar
Age 0.947 0.332 0.004 disorder display structural alterations similar to the bipolar/
Cannabis present 0.094 0.760 0.000 schizophrenia spectrum.
Structural and genetic similarities between bipolar disorders
Cannabis lifetime 0.197 0.868 0.004
and schizophrenia are well known [11, 36, 37]. The symptoms of
ICV 108.688 0.000 0.308 psychosis prodrome might also overlap with bipolar prodrome
The significance test displays uncorrected p-values. ICV—estimated total [38]. However, in our sample, we specifically recruited participants
intracranial volume. with bipolar risk factors, while manifest psychotic disorders were
an exclusion criterion. Of all included participants, only six (2.3%)
fulfilled the psychosis-risk status using the SIPS assessment tool.
Exploratory analyses For this reason, we do not consider psychosis risk being a
The whole-brain exploratory analysis of cortical thickness showed cofounder in our analysis.
no significant clusters displaying differences between the risk Our findings of the thinner cortex are in contrast with previous
groups (FDR-corrected). The exploratory analysis of the volumes of studies of individuals at risk for bipolar disorder, which focused
the subcortical structures showed no significant differences in exclusively on affected and/or non-affected first-degree relatives
Translational Psychiatry (2021)11:485P. Mikolas et al.
6
of bipolar patients. These identified possible structural biomarkers education status, as the majority of individuals in all groups
of genetic risk, such as increased volume of the right inferior attended high-school. Correcting for cannabis use might be
frontal gyrus, superior temporal gyrus, or increased intracranial misleading, as substance abuse is one of the risk factors in
volume [13–16]. At the same time, significantly more participants EPIbipolar. However, here the corresponding risk-defining item is
with genetic risk were assigned into the high-risk category in our not equivalent, as it evaluates increasing, periodic substance
sample. This might be counterintuitive, however, from the abuse, which is only one aspect of possible patterns of cannabis
neuroimaging point of view, the early markers of a genetic risk use. This criterion was met only in a few (1.5%) subjects in our
for bipolar disorder seem to follow a trajectory towards reduction sample. On the other hand, chronic cannabis use was associated
of volume/thickness, as the prodromal state or the disease with patterns of cortical thickness reductions also in prefrontal
progress. The above-mentioned findings of increased cortical regions, including left pars opercularis [40–42]. For that reason,
volume are the likely biomarkers of genetic risk, especially before correcting for cannabis use in this structural MRI study is still
the manifestation of psychiatric symptoms. During the disease appropriate.
progression, other, non-genetic factors might override those early A considerable amount of individuals in our sample had Axis I
markers. The volume of the right inferior frontal gyrus was the diagnoses other than bipolar disorder. We also intentionally
largest in non-affected participants with genetic risk, and included young patients with diagnosed depression and/or ADHD.
correlated inversely with illness duration in a combined group of As these have been associated with increased risk for bipolar
affected participants with genetic risk and young subjects with disorders, pooling these participants is an appropriate way to
bipolar disorder [15]. Interestingly, in a machine learning study study bipolar risk. This is also in line with previous MRI studies
using structural MRI, non-affected individuals with genetic risk which analyzed affected participants with genetic risk, who met
were more accurately differentiated from healthy controls than the criteria for mood disorders [15]. As a result of the population
individuals with genetic risk who already displayed clinical design of this study, the resulting risk groups were not matched
symptoms [39]. Finally, large-scale analysis suggests rather a according to the recruitment pathway, resulting in more
widespread reduction of cortical thickness in manifest bipolar participants with diagnosed depression in the low-risk and the
disorder [9, 11]. In order to study a comprehensive composition of high-risk group. On the other hand, there were no significant
risk factors beyond the genetic risk, the Early-BipoLife study reductions of cortical thickness in the VLPFC/inferior frontal gyrus
included young help-seeking individuals with symptoms. For this in major depression according to the ENIGMA working group
reason, in our primary hypothesis, we expected structural [11, 43]. Patients with ADHD displayed reduction of average
alterations more typical for a disease progression, rather than cortical thickness [11, 44], however, in our sample there were no
for genetic risk. Although we did not test for differences in cortical differences in the number of participants recruited over the ADHD
volume, our finding of reduced cortical thickness in the left recruitment pathway between the risk groups.
inferior frontal gyrus (pars opercularis) makes a potential finding Interestingly, in a secondary analysis, we did not detect
of increased volume less likely. For this reason, we conclude, that differences in cortical thickness of pars opercularis or hippocampal
we do not observe structural alterations directly associated with volume between individuals meeting and not meeting any BARS
genetic risk in our analysis. criterion. However, in our sample, the BARS positive group consisted
We detected a negative linear relationship between risk almost exclusively of participants who fulfilled the criterion for
category and cortical thickness of the left pars opercularis. This depressive symptoms. According to a recent multicenter study,
suggests, that the cortical thickness is associated with the total there was no involvement of VLPFC alterations in major depression
number of risk factors, i.e. the magnitude of the risk. Cortical [43]. However, several studies described differences in hippocampal
thickness was shown to decrease with age in a linear manner in volume [45, 46]. On the other hand, these might be missing in
young individuals, while different genes may contribute to cortical young individuals without recurrent episodes, who are predomi-
change in different ages [8, 16]. This phenomenon might be nantly represented in our sample [47]. Similarly, we did not detect
locally accelerated in individuals at risk for bipolar disorders. any significant structural differences using BPSS-P. Interestingly, the
Longitudinal, structural MRI, and genetic analyses are necessary to p-value for pars opercularis was rather small, which might indicate a
assess the dynamic changes in individuals at risk. statistical trend towards reduction. However, in this case, only 21.3%
In our statistical model, the effect size of the thinner cortex was of participants fulfilled the criterion for any risk state.
moderate (as defined by Cohen’s d of 0.47). This is higher than the The mean age of individuals in our sample was higher than the
effect sizes in other above-mentioned multicenter studies of typical onset of bipolar disorder (24.84 (SD = 4.4)), which might
patients with established disease (Cohen’s d ≤ 0.293) [9, 10]. suggest, that we were looking at individuals with a degree of
Compared to the multicenter studies mentioned, here we present resilience. Approximately 70% of all individuals would develop
a sample of adolescents and young adults in the early stages of bipolar disorder by the age of 21 [48, 49]. However, the time-to-
the potential development of bipolar disorder with a low diagnosis by bipolar disorder is typically long. Depending on the
cumulative dose of medication. Whereas those studies pooled structure of psychiatric services, it might take 8.7−12.4 years from
datasets acquired within independent single studies, the recruit- the appearance of the first symptoms to establish the diagnosis
ment and data acquisition in our study was performed in each [47–50]. Due to the predominance of depressive symptoms, as
center according to the same study protocol. These factors might well as difficulties to recognize hypomania, the most typical false
have contributed to the effect size. As the expected effect sizes diagnosis is unipolar depression [24, 48, 49]. For this reason, we
were small, we performed a literature-based, hypothesis-driven cannot make conclusions on resilience. On the other hand, we can
ROI analysis. There might be other affected regions as well (for assume that some individuals with depression in our sample
example the widespread prefrontal or temporal cortices), how- might have an unrecognized bipolar disorder.
ever, our sample would not have significant power to detect weak Inferior frontal gyrus has been implicated as an important
effects in a whole-brain exploratory analysis. functional hub in emotion regulation and cognitive control.
Collecting data using the same study protocol for each center Several studies detected aberrant functional activation and/or
under close supervision enabled us to control for diverse factors, functional disconnection of this region. Task-based fMRI studies
which might contribute to differences in cortical thickness. showed lower activation of the inferior frontal cortex, particularly
Beyond age, sex, and current medication, we also controlled for in response to emotionally salient stimuli in youth at high risk of
smoking status, past and present cannabis use. The cortical bipolar disorder [51]. Functional disconnection of the inferior
thickness reduction of pars opercularis stayed significant even frontal gyrus was detected in young individuals with bipolar
with correcting for these confounders. We did not correct for disorder using resting-state fMRI [52]. From the functional point of
Translational Psychiatry (2021)11:485P. Mikolas et al.
7
view, an impaired inhibitory function of the inferior frontal cortex, presenting with subthreshold bipolar symptoms: results from a prespecified
may represent a trait marker of vulnerability to bipolar disorder interim analysis of a multicenter, randomized, controlled study. Bipolar Disord.
[51, 53]. 2020. https://doi.org/10.1111/bdi.12894.
Functionally, cortical thickness reflects the volume of cells in a 3. Salazar de Pablo G, Catalan A, Fusar-Poli P. Clinical validity of DSM-5 attenuated
psychosis syndrome: advances in diagnosis, prognosis, and treatment. JAMA
cortical column, the basic cortical functional unit [16]. Most of the
Psychiatry. 2020;77:311–20.
anatomical connectivity takes place within cortical columns, rather 4. Ferrari AJ, Stockings E, Khoo JP, Erskine HE, Degenhardt L, Vos T, et al. The
than amid brain regions. Cortical thickness was also shown to be prevalence and burden of bipolar disorder: findings from the Global Burden of
more dependent on local or intrinsic factors, rather than on the Disease Study 2013. Bipolar Disord. 2016;18:440–50.
input from subcortical structures [8]. Our results, therefore, 5. Faedda GL, Baldessarini RJ, Marangoni C, Bechdolf A, Berk M, Birmaher B, et al. An
suggest, that the reduced cortical thickness in VLPFC/pars International Society of Bipolar Disorders task force report: precursors and pro-
opercularis might be an early trait marker of risk for bipolar dromes of bipolar disorder. Bipolar Disord. 2019;21:720–40.
disorders, rather than a secondary effect of structural alterations in 6. Fischl B, van der Kouwe A, Destrieux C, Halgren E, Ségonne F, Salat DH, et al.
other, functionally connected (for example subcortical) structures. Automatically parcellating the human cerebral cortex. Cereb Cortex. 2004;14:11–22.
7. Fischl B, Sereno MI, Dale A. Cortical surface-based analysis: II: Inflation, flattening,
Our work has several limitations. We used the risk for bipolar
and a surface-based coordinate system. NeuroImage. 1999;9:195–207.
disorder according to the EPIbipolar interview for our analyses. We 8. Wierenga LM, Langen M, Oranje B, Durston S. Unique developmental trajectories
do not know yet, which participants will in the future develop of cortical thickness and surface area. NeuroImage. 2014;87:120–6.
bipolar disorder. However, the composition of risk factors giving 9. Hibar DP, Westlye LT, Doan NT, Jahanshad N, Cheung JW, Ching C, et al. Cortical
rise to the risk categories was based on state-of-the-art evidence abnormalities in bipolar disorder: an MRI analysis of 6503 individuals from the
in the field. We also used other instruments (BARS, BPSS-P) with ENIGMA Bipolar Disorder Working Group. Mol Psychiatry. 2018;23:932–42.
better validated psychometric properties; however, the validation 10. Hibar DP, Westlye LT, van Erp TG, Rasmussen J, Leonardo CD, Faskowitz J. et al.
studies lack longitudinal validation (BPSS-P) [24, 54], were Subcortical volumetric abnormalities in bipolar disorder. Mol Psychiatry.
performed in small samples (BAR), or lack replication (BARS) [22]. 2016;21:1710–6.
11. Ching C, Hibar DP, Gurholt TP, Nunes A, Thomopoulos SI, Abé C, et al. What we
However, as the early recognition of bipolar disorder is an
learn about bipolar disorder from large‐scale neuroimaging: findings and future
emerging field, the risk assessment tools are being further directions from the ENIGMA Bipolar Disorder Working Group. Hum Brain Mapp.
developed [25] (Supplementary Table 1). In our secondary analysis, 2020. https://doi.org/10.1002/hbm.25098.
there was a discrepancy between the statistically significant 12. Keramatian K, Chakrabarty T, Saraf G, Pinto JV, Yatham LN. Grey matter
results among the risk assessment instruments. Future studies abnormalities in first‐episode mania: a systematic review and meta‐analysis of
with more power are necessary, to evaluate the reproducibility of voxel‐based morphometry studies. Bipolar Disord. 2020. https://doi.org/10.1111/
significant structural findings among the various risk instruments. bdi.12995.
As this was a naturalistic, population-based observational study, 13. Cattarinussi G, Di Giorgio A, Wolf RC, Balestrieri M, Sambataro F. Neural signatures
a control group was not included. As a result, most of the of the risk for bipolar disorder: a meta‐analysis of structural and functional
neuroimaging studies. Bipolar Disord. 2019;21:215–27.
participants displayed at least minor symptoms. Analyzing
14. de Zwarte S, Brouwer RM, Agartz I, Alda M, Aleman A, Alpert KI, et al. The
population-based samples using severity subgroups is a reason- association between familial risk and brain abnormalities is disease specific: an
able approach, which may bring relevant information [55]. ENIGMA-relatives study of schizophrenia and bipolar disorder. Biol Psychiatry.
Including control groups in future studies is essential to determine 2019;86:545–56.
the specificity of the findings. Although the generalized linear 15. Hajek T, Cullis J, Novak T, Kopecek M, Blagdon R, Propper L, et al. Brain structural
models approach is suitable for analyses of unequal groups, the signature of familial predisposition for bipolar disorder: replicable evidence for
resulting sample size of the no-risk group was relatively small for a involvement of the right inferior frontal gyrus. Biol Psychiatry. 2013;73:144–52.
neuroimaging study. 16. Drobinin V, Slaney C, Garnham J, Propper L, Uher R, Alda M, et al. Larger right
In summary, we detected structural alterations similar to inferior frontal gyrus volume and surface area in participants at genetic risk for
bipolar disorders. Psychol Med. 2019;49:1308–15.
patients with manifest bipolar disorder, which correlate with the
17. Fusar-Poli P, Howes O, Bechdolf A, Borgwardt S. Mapping vulnerability to bipolar
amount of known risk-factors. We detected reduced cortical disorder: a systematic review and meta-analysis of neuroimaging studies. J Psy-
thickness in a region, which has been functionally implicated as a chiatry Neurosci. 2012;37:170–84.
potential biomarker of bipolar risk [51, 53]. Subcortical structures 18. Hafeman DM, Merranko J, Goldstein TR, Axelson D, Goldstein BI, Monk K, et al.
might not be structurally affected. Our secondary analyses, as well Assessment of a person-level risk calculator to predict new-onset bipolar spec-
as large-scale multicenter studies of psychiatric disorders, do not trum disorder in youth at familial risk. JAMA Psychiatry. 2017;74:841–7.
suggest, that our finding of the thinner cortex was due to another 19. Post RM, Altshuler LL, Kupka R, McElroy SL, Frye MA, Rowe M, et al. Multi-
diagnosis. generational transmission of liability to psychiatric illness in offspring of parents
As this is an emerging field, the concept of the risk for bipolar with bipolar disorder. Bipolar Disord. 2018;20:432–40.
20. Kerner B. Genetics of bipolar disorder. Appl Clin Genet. 2014;7:33–42.
disorders is being further developed. We based the risk definition
21. Leopold K, Ritter P, Correll CU, Marx C, Özgürdal S, Juckel G, et al. Risk con-
on the presence of known risk factors according to a systematic stellations prior to the development of bipolar disorders: rationale of a new risk
literature review. Longitudinal studies, as well as studies including assessment tool. J Affect Disord. 2012;136:1000–10.
healthy controls, are necessary, to evaluate the exact predictive 22. Bechdolf A, Ratheesh A, Cotton SM, Nelson B, Chanen AM, Betts J, et al. The
validity and specificity of our findings. An interesting approach for predictive validity of bipolar at-risk (prodromal) criteria in help-seeking adoles-
future studies would be to include patients with psychosis risk, in cents and young adults: a prospective study. Bipolar Disord. 2014;16:493–504.
order to identify specific structural differences between risk 23. Fusar-Poli P, De Micheli A, Rocchetti M, Cappucciati M, Ramella-Cravaro V, Ruti-
syndromes displaying possibly overlapping structural differences. gliano G, et al. Semistructured interview for bipolar at risk states (SIBARS). Psy-
Machine learning studies may provide a tool to extract the chiatry Res. 2018;264:302–9.
24. Correll CU, Olvet DM, Auther AM, Hauser M, Kishimoto T, Carrión RE, et al. The
information from cortical thickness into individual risk-
bipolar prodrome symptom interview and scale-prospective (BPSS-P): description
stratification and/or risk-prediction tools [9, 56, 57]. and validation in a psychiatric sample and healthy controls. Bipolar Disord.
2014;16:505–22.
25. Pfennig A, Leopold K, Martini J, Boehme A, Lambert M, Stamm T, et al. Improving
REFERENCES early recognition and intervention in people at increased risk for the develop-
1. Fusar-Poli P, Rutigliano G, Stahl D, Davies C, Bonoldi I, Reilly T, et al. Development ment of bipolar disorder: study protocol of a prospective-longitudinal, naturalistic
and validation of a clinically based risk calculator for the transdiagnostic pre- cohort study (Early-BipoLife). Int J Bipolar Disord. 2020;8:22.
diction of psychosis. JAMA Psychiatry. 2017;74:493–500. 26. Ritter PS, Bermpohl F, Gruber O, Hautzinger M, Jansen A, Juckel G, et al. Aims and
2. Leopold K, Bauer M, Bechdolf A, Correll CU, Holtmann M, Juckel G, et al. Efficacy structure of the German Research Consortium BipoLife for the study of bipolar
of cognitive‐behavioral group therapy in patients at risk for serious mental illness disorder. Int J Bipolar Disord. 2016;4:26.
Translational Psychiatry (2021)11:485P. Mikolas et al.
8
27. Vogelbacher C, Sommer J, Schuster V, Bopp MHA, Falkenberg I, Ritter PS, et al. 52. Roberts G, Lord A, Frankland A, Wright A, Lau P, Levy F, et al. Functional dys-
The German Research Consortium for the Study of Bipolar Disorder (BipoLife): A connection of the inferior frontal gyrus in young people with bipolar disorder or
Magnetic Resonance Imaging Study Protocol. In Review, 2021. https://doi.org/ at genetic high risk. Biol Psychiatry. 2017;81:718–27.
10.21203/rs.3.rs-339978/v1. 53. Breakspear M, Roberts G, Green MJ, Nguyen VT, Frankland A, Levy F, et al. Net-
28. Ising HK, Veling W, Loewy RL, Rietveld MW, Rietdijk J, Dragt S, et al. The validity of work dysfunction of emotional and cognitive processes in those at genetic risk of
the 16-item version of the prodromal questionnaire (PQ-16) to screen for ultra bipolar disorder. Brain. 2015;138:3427–39.
high risk of developing psychosis in the general help-seeking population. Schi- 54. Van Meter A, Guinart D, Bashir A, Sareen A, Cornblatt BA, Auther A, et al. Bipolar
zophrenia Bull. 2012;38:1288–96. prodrome symptom scale—abbreviated screen for patients: description and
29. McGlashan TH, Walsh B, Woods S. The psychosis-risk syndrome: handbook for validation. J Affect Disord. 2019;249:357–65.
diagnosis and follow-up. New York, Oxford University Press; 2010. 55. Haddad L, Schäfer A, Streit F, Lederbogen F, Grimm O, Wüst S, et al. Brain
30. Esteban O, Birman D, Schaer M, Koyejo OO, Poldrack RA, Gorgolewski KJ. MRIQC: structure correlates of urban upbringing, an environmental risk factor for schi-
advancing the automatic prediction of image quality in MRI from unseen sites. zophrenia. Schizophrenia Bull. 2015;41:115–22.
PLoS One. 2017;12:e0184661. 56. Dwyer DB, Falkai P, Koutsouleris N. Machine learning approaches for clinical
31. Fischl B, Salat DH, Busa E, Albert M, Dieterich M, Haselgrove C, et al. Whole brain psychology and psychiatry. Annu Rev Clin Psychol. 2018;14:91–118.
segmentation: automated labeling of neuroanatomical structures in the human 57. Nunes A, Schnack HG, Ching C, Agartz I, Akudjedu TN, Alda M, et al. Using
brain. Neuron. 2002;33:341–55. structural MRI to identify bipolar disorders—13 site machine learning study in
32. Müller DK, Küttner R, Hannig R. NICePype: a web-based pipeline manager for 3020 individuals from the ENIGMA Bipolar Disorders Working Group. Mol Psy-
processing neuroimaging data based on Nipype. Proc Intl Soc Mag Reson Med. chiatry. 2020;25:2130–43.
2015;23:3743.
33. Desikan RS, Ségonne F, Fischl B, Quinn BT, Dickerson BC, Blacker D, et al. An
automated labeling system for subdividing the human cerebral cortex on MRI ACKNOWLEDGEMENTS
scans into gyral based regions of interest. NeuroImage. 2006;31:968–80. Early-BipoLife is funded by the Federal Ministry of Education and Research (BMBF,
34. Cohen J. Statistical power analysis for the behavioral sciences. New York, Psy- grant numbers: 01EE1404A, 01EE1404E, and 01EE1404F). M.M. was supported by the
chology Press; 2009. Deutsche Forschungsgemeinschaft (DFG grant Nos. 178833530 [SFB 940] and
35. Benjamini Y, Hochberg Y. Controlling the false discovery rate: a practical and pow- 402170461 [TRR 265].
erful approach to multiple testing. J R Stat Soc Ser B Methodol. 1995;57:289–300.
36. van Erp T, Walton E, Hibar DP, Schmaal L, Jiang W, Glahn DC, et al. Cortical brain
abnormalities in 4474 individuals with schizophrenia and 5098 control subjects
via the enhancing neuro imaging genetics through meta analysis (ENIGMA) AUTHOR CONTRIBUTIONS
consortium. Biol Psychiatry. 2018;84:644–54. A.P., M.B., P.R., and A.J. designed the study. K.B., C.B., J.H.F., S.J., A.J.F., T.E., A.Rau, T.K.,
37. The International Schizophrenia Consortium. Common polygenic variation con- I.F., M.L., V.K., K.L., A.B., A.Reif, S.M., T.S., F.B., J.F., G.J., V.F., and C.U.C. participated in the
tributes to risk of schizophrenia and bipolar disorder. Nature. 2009;460:748–52. patient recruitment. C.V., D.K.M., and P.M. performed the MRI pre-processing and
38. Mennigen E, Bearden CE. Psychosis risk and development: what do we know quality assessment. P.M., M.M., C.S., and S.J. performed the MRI data analyses and
from population-based studies? Biol Psychiatry. 2020;88:315–25. statistics. P.M., C.V., and A.P. wrote the article. M.M., D.K.M., K.B., C.B., J.H.F., A.J.F., T.E.,
39. Hajek T, Cooke C, Kopecek M, Novak T, Hoschl C, Alda M. Using structural MRI to A.Rau, T.K., I.F., M.L., V.K., K.L., A.B., A.Reif, S.M., T.S., F.B., J.F., G.J., V.F., C.U.C., M.B., and
identify individuals at genetic risk for bipolar disorders: a 2-cohort, machine P.R. revised it critically for important intellectual content. All of the authors reviewed
learning study. J Psychiatry Neurosci. 2015;40:316–24. and approved the paper for publication. Open Access funding enabled and
40. Epstein KA, Kumra S. Altered cortical maturation in adolescent cannabis users organized by Projekt DEAL.
with and without schizophrenia. Schizophr Res. 2015;162:143–52.
41. Manza P, Yuan K, Shokri-Kojori E, Tomasi D, Volkow ND. Brain structural changes in
cannabis dependence: association with MAGL. Mol Psychiatry. 2020;25:3256–66. COMPETING INTERESTS
42. Wittemann M, Brielmaier J, Rubly M, Kennel J, Werler F, Schmitgen MM, et al. The authors declare no competing interests.
Cognition and cortical thickness in heavy cannabis users. Eur Addict Res.
2020;27:1–8. https://doi.org/10.1159/000509987.
43. Schmaal L, Hibar DP, Sämann PG, Hall GB, Baune BT, Jahanshad N, et al. Cortical ADDITIONAL INFORMATION
abnormalities in adults and adolescents with major depression based on brain Supplementary information The online version contains supplementary material
scans from 20 cohorts worldwide in the ENIGMA Major Depressive Disorder available at https://doi.org/10.1038/s41398-021-01598-y.
Working Group. Mol Psychiatry. 2017;22:900–9.
44. Hoogman M, Muetzel R, Guimaraes JP, Shumskaya E, Mennes M, Zwiers MP, et al. Correspondence and requests for materials should be addressed to Pavol Mikolas.
Brain imaging of the cortex in ADHD: a coordinated analysis of large-scale clinical
and population-based samples. AJP. 2019;176:531–42. Reprints and permission information is available at http://www.nature.com/
45. Koolschijn PCMP, van Haren NEM, Lensvelt-Mulders GJLM, Hulshoff Pol HE, Kahn reprints
RS. Brain volume abnormalities in major depressive disorder: a meta-analysis of
magnetic resonance imaging studies. Hum Brain Mapp. 2009;30:3719–35. Publisher’s note Springer Nature remains neutral with regard to jurisdictional claims
46. Mikolas P, Tozzi L, Doolin K, Farrell C, O'Keane V, Frodl T. Effects of early life in published maps and institutional affiliations.
adversity and FKBP5 genotype on hippocampal subfields volume in major
depression. J Affect Disord. 2019;252:152–9.
47. Schmaal, Veltman DJ, van Erp TG, Sämann PG, Frodl T, Jahanshad N, et al. Sub-
cortical brain alterations in major depressive disorder: findings from the ENIGMA
Major Depressive Disorder working group. Mol Psychiatry. 2016;21:806–12. Open Access This article is licensed under a Creative Commons
48. Merikangas KR, Jin R, He JP, Kessler RC, Lee S, Sampson NA, et al. Prevalence and Attribution 4.0 International License, which permits use, sharing,
correlates of bipolar spectrum disorder in the world mental health survey adaptation, distribution and reproduction in any medium or format, as long as you give
initiative. Arch Gen Psychiatry. 2011;68:241–51.funded by the Federal Minis appropriate credit to the original author(s) and the source, provide a link to the Creative
49. Lambert M, Bock T, Naber D, Löwe B, Schulte-Markwort M, Schäfer I, et al. Die Commons license, and indicate if changes were made. The images or other third party
psychische Gesundheit von Kindern, Jugendlichen und jungen Erwachsenen – Teil material in this article are included in the article’s Creative Commons license, unless
1: Häufigkeit, Störungspersistenz, Belastungsfaktoren, Service-Inanspruchnahme indicated otherwise in a credit line to the material. If material is not included in the
und Behandlungsverzögerung mit Konsequenzen. Fortschr Neurol Psychiatr. article’s Creative Commons license and your intended use is not permitted by statutory
2013;81:614–27. regulation or exceeds the permitted use, you will need to obtain permission directly
50. Pfennig A, Bschor T, Falkai P, Bauer M. The diagnosis and treatment of from the copyright holder. To view a copy of this license, visit http://creativecommons.
bipolar disorder. Deutsches Aerzteblatt Online. 2013. https://doi.org/10.3238/ org/licenses/by/4.0/.
arztebl.2013.0092.
51. Roberts G, Green MJ, Breakspear M, McCormack C, Frankland A, Wright A, et al.
Reduced inferior frontal gyrus activation during response inhibition to emotional © The Author(s) 2021
stimuli in youth at high risk of bipolar disorder. Biol Psychiatry. 2013;74:55–61.
Translational Psychiatry (2021)11:485You can also read