Investor Presentation - June 2020 - Collier Creek

Page created by Johnnie Lambert
 
CONTINUE READING
Investor Presentation - June 2020 - Collier Creek
℠

Investor Presentation
June 2020
Investor Presentation - June 2020 - Collier Creek
Disclaimer
This investor presentation (“Investor Presentation”) is for informational purposes only to assist interested parties in making their own evaluation with respect to the proposed business combination (the “Business Combination”)
between Collier Creek (“CCH”) and Utz Quality Foods, LLC (“Utz” or the “Company”). The information contained herein does not purport to be all-inclusive and none of CCH, Utz or their respective affiliates makes any representation
or warranty, express or implied, as to the accuracy, completeness or reliability of the information contained in this Investor Presentation.
This Investor Presentation does not constitute (i) a solicitation of a proxy, consent or authorization with respect to any securities or in respect of the proposed Business Combination or (ii) an offer to sell, a solicitation of an offer to
buy, or a recommendation to purchase any security of Utz, CCH, or any of their respective affiliates. You should not construe the contents of this presentation as legal, tax, accounting or investment advice or a recommendation. You
should consult your own counsel and tax and financial advisors as to legal and related matters concerning the matters described herein, and, by accepting this presentation, you confirm that you are not relying upon the information
contained herein to make any decision.
The distribution of this Investor Presentation may also be restricted by law and persons into whose possession this Investor Presentation comes should inform themselves about and observe any such restrictions. The recipient
acknowledges that it is (a) aware that the United States securities laws prohibit any person who has material, non-public information concerning a company from purchasing or selling securities of such company or from
communicating such information to any other person under circumstances in which it is reasonably foreseeable that such person is likely to purchase or sell such securities, and (b) familiar with the Securities Exchange Act of 1934,
as amended, and the rules and regulations promulgated thereunder (collectively, the "Exchange Act"), and that the recipient will neither use, nor cause any third party to use, this Investor Presentation or any information contained
herein in contravention of the Exchange Act, including, without limitation, Rule 10b-5 thereunder.
Forward-Looking Statements. Certain statements in this presentation may be considered forward-looking statements. Forward-looking statements generally relate to future events or CCH’s or the Company’s future financial or
operating performance. For example, projections of future Adjusted Net Sales, Adjusted EBITDA, Pro Forma Adjusted EBITDA and other metrics are forward-looking statements. In some cases, you can identify forward-looking
statements by terminology such as “may”, “should”, “expect”, “intend”, “will”, “estimate”, “anticipate”, “believe”, “predict”, “potential” or “continue”, or the negatives of these terms or variations of them or similar terminology. Such
forward-looking statements are subject to risks, uncertainties, and other factors which could cause actual results to differ materially from those expressed or implied by such forward looking statements.
These forward-looking statements are based upon estimates and assumptions that, while considered reasonable by CCH and its management, and Utz and its management, as the case may be, are inherently uncertain. Factors that
may cause actual results to differ materially from current expectations include, but are not limited to: (1) the occurrence of any event, change or other circumstances that could give rise to the termination of negotiations and any
subsequent definitive agreements with respect to the Business Combination; (2) the outcome of any legal proceedings that may be instituted against CCH, the combined company or others following the announcement of the
Business Combination and any definitive agreements with respect thereto; (3) the inability to complete the Business Combination due to the failure to obtain approval of the shareholders of CCH, to obtain financing to complete the
Business Combination or to satisfy other conditions to closing; (4) changes to the proposed structure of the Business Combination that may be required or appropriate as a result of applicable laws or regulations or as a condition to
obtaining regulatory approval of the Business Combination; (5) the ability to meet the NYSE’s listing standards following the consummation of the Business Combination; (6) the risk that the Business Combination disrupts current
plans and operations of Utz as a result of the announcement and consummation of the Business Combination; (7) the ability to recognize the anticipated benefits of the Business Combination, which may be affected by, among other
things, competition, the ability of the combined company to grow and manage growth profitably, maintain relationships with customers and suppliers and retain its management and key employees; (8) costs related to the Business
Combination; (9) changes in applicable laws or regulations; (10) the possibility that Utz or the combined company may be adversely affected by other economic, business, and/or competitive factors; (11) Utz’s estimates of expenses
and profitability; and (12) other risks and uncertainties set forth in the section entitled “Risk Factors” and “Cautionary Note Regarding Forward-Looking Statements” in CCH’s Annual Report on Form 10-K for the fiscal year ended
December 31, 2019.
Nothing in this presentation should be regarded as a representation by any person that the forward-looking statements set forth herein will be achieved or that any of the contemplated results of such forward-looking statements will
be achieved. You should not place undue reliance on forward-looking statements, which speak only as of the date they are made. Neither CCH nor the Company undertakes any duty to update these forward-looking statements.
Non-GAAP Financial Information. In this presentation, CCH and the Company may refer to certain non-GAAP financial measures, including Adjusted Net Sales, Adjusted EBITDA and Pro Forma Adjusted EBITDA, among others.
Please refer to footnotes where presented on each page of this presentation or to the appendix found at the end of this presentation for a reconciliation of these measures to what the Company believes are the most directly
comparable measure evaluated in accordance with generally accepted accounting principles in the U.S. (“GAAP”). This presentation also includes certain projections of non-GAAP financial measures. Due to the high variability and
difficulty in making accurate forecasts and projections of some of the information excluded from these projected measures, together with some of the excluded information not being ascertainable or accessible, the Company is unable
to quantify certain amounts that would be required to be included in the most directly comparable GAAP financial measures without unreasonable effort. Consequently, no disclosure of estimated comparable GAAP measures is
included and no reconciliation of the forward-looking non-GAAP financial measures is included.
Use of Projections. This Investor Presentation contains financial forecasts of the Company. Neither the Company’s independent auditors, nor the independent registered public accounting firm of CCH, audited, reviewed, compiled, or
performed any procedures with respect to the projections for the purpose of their inclusion in this Investor Presentation, and accordingly, neither of them expressed an opinion or provided any other form of assurance with respect
thereto for the purpose of this Investor Presentation. These projections should not be relied upon as being necessarily indicative of future results.
Industry and Market Data. In this Investor Presentation, CCH relies on and refers to certain information and statistics obtained from third-party sources which it believes to be reliable, including reports by market research firms.
Neither CCH nor Utz has independently verified the accuracy or completeness of any such third-party information.
This presentation may contain trademarks, service marks, trade names and copyrights of other companies, which are the property of their respective owners. Solely for convenience, some of the trademarks, service marks, trade
names and copyrights referred to in this presentation may be listed without the TM, SM, ©, ® or ™ symbols, but Collier Creek and Utz will assert, to the fullest extent under applicable law, the right of the applicable owners, if any, to
these trademarks, service mark, trade names and copyrights.
Additional Information. In connection with the proposed Business Combination, including the domestication of CCH as a Delaware corporation, CCH intends to file with the SEC a registration statement on Form S-4 containing a
preliminary proxy statement and a preliminary prospectus of CCH, and after the registration statement is declared effective, CCH will mail a definitive proxy statement/prospectus relating to the proposed Business Combination to its
shareholders. This Investor Presentation does not contain all the information that should be considered concerning the proposed Business Combination and is not intended to form the basis of any investment decision or any other
decision in respect of the Business Combination. CCH’s shareholders and other interested persons are advised to read, when available, the preliminary proxy statement/prospectus and the amendments thereto and the definitive
proxy statement/prospectus and other documents filed in connection with the proposed Business Combination, as these materials will contain important information about Utz, CCH and the Business Combination. When available, the
definitive proxy statement/prospectus and other relevant materials for the proposed Business Combination will be mailed to shareholders of CCH as of a record date to be established for voting on the proposed Business
Combination. Shareholders will also be able to obtain copies of the preliminary proxy statement/prospectus, the definitive proxy statement/prospectus and other documents filed with the SEC, without charge, once available, at the
SEC’s website at www.sec.gov, or by directing a request to: Collier Creek Holdings, 200 Park Avenue, New York, NY 10166.
Participants in the Solicitation. CCH and its directors and executive officers may be deemed participants in the solicitation of proxies from CCH’s shareholders with respect to the proposed Business Combination. A list of the names of
those directors and executive officers and a description of their interests in CCH is contained in CCH’s annual report on Form 10-K for the fiscal year ended December 31, 2019, which was filed with the SEC and is available free of
charge at the SEC’s web site at www.sec.gov, or by directing a request to Collier Creek Holdings, 200 Park Avenue, New York, NY 10166. Additional information regarding the interests of such participants will be contained in the
proxy statement/prospectus for the proposed Business Combination when available.
The Company and its directors and executive officers may also be deemed to be participants in the solicitation of proxies from the shareholders of CCH in connection with the proposed Business Combination. A list of the names of
such directors and executive officers and information regarding their interests in the proposed Business Combination will be included in the proxy statement/prospectus for the proposed Business Combination when available.

           ℠
Investor Presentation - June 2020 - Collier Creek
Today’s Participants

                            Collier Creek Holdings                                              Utz

           Roger Deromedi          Chinh Chu           Jason Giordano     Dylan Lissette                 Cary Devore

                                                                         Chief Executive                Chief Financial
 Current      Co-Founder           Co-Founder             Co-Founder
                                                                             Officer                        Officer

                                                                         Chief Executive                Chief Financial
 New Utz       Chairman           Special Advisor           Director
                                                                             Officer                        Officer

           • Former Chairman,   • Founder and Sr.      • Sr. Managing   • CEO of Utz since            • EVP & CFO, with
             Pinnacle Foods       Managing Director,     Director, CC     2012                          Utz since 2016
                                  CC Capital             Capital

           • Former CEO,        • Former Sr.           • Former         • At Utz since                • Former Managing
             Kraft Foods          Managing               Managing         1995; worked in a             Director,
                                  Director,              Director,        variety of                    Metropoulos & Co.
                                  Blackstone             Blackstone       capacities prior to
                                                                          becoming CEO
                                                                                                      • 25 years in private
                                                                                                        equity, investment
                                                                                                        banking, and
                                                                                                        public accounting

     ℠                                                                                                                        1
Investor Presentation - June 2020 - Collier Creek
Today’s Agenda

 I        Introduction & Investment Thesis

 II       Business Overview

III       Value Creation Strategy

IV        Financial Overview

      ℠                                      2
Investor Presentation - June 2020 - Collier Creek
I. Introduction & Investment Thesis
Investor Presentation - June 2020 - Collier Creek
Utz is a Perfect Business Combination for Collier Creek

                                                                                                                                                                                      ℠

    Completed $440 million IPO in October 2018 to                                                                  Leading manufacturer, marketer, and distributor of
       establish a new CPG “platform” company                                                                          branded snacks in the U.S., including potato chips,
                                                                                                                       pretzels, cheese snacks, pork skins, pub/party mixes,
    Over 125 years of CPG and investing experience,                                                                   and veggie snacks
      including:
      – Several former executives of Pinnacle Foods led                                                             Strong portfolio of national and regional brands,
        by Roger Deromedi                                                                                              including Utz, Good Health, Boulder Canyon, Zapp’s,
      – Proven operating playbook and track record of                                                                  and Golden Flake
        shareholder value creation in food industry
                                                                                                                    99-year-old family company with deep heritage and
    Objective at IPO to find Pinnacle 2.0: an attractive                                                              authenticity
      platform asset well suited for its value creation
      strategies:                                                                                                   Over 43 years of consecutive Adjusted Net Sales
      – Accelerate topline growth                                                                                      growth(1)
      – Improve margins
      – Make strategic acquisitions                                                                                 #2 salty snack company in its core geographies;
                                                                                                                       #4 nationally
    $35 million co-investment by Sponsors alongside
       public investors (in addition to receiving promote                                                           2020E Net Sales of $910 million and Pro Forma Adj.
       shares)                                                                                                         EBITDA of $124 million

1). Source: Management estimates and internal data. Represents Adjusted Net Sales growth (before changes to independent DSD operator discounts) for 2017-2019 and Net Sales prior to 2017. Please see page
40 for reconciliation of Adjusted Net Sales.

            ℠                                                                                                                                                                                                3
Investor Presentation - June 2020 - Collier Creek
Why CCH is So Excited About This Opportunity
1
      Attractive and                             $26 billion in U.S. Retail Sales with 4.3% CAGR Over Last Five Years(1)
      Growing Salty
                                                 Resilient to Economic Downturns (4% CAGR from 2007-2010)(2) with Attractive
     Snack Category
                                                  Defensive Characteristics

2
         Significant                             Iconic Brands with Strong and Growing Positions
         Competitive
           Moats                                 Competitively Advantaged Manufacturing and Distribution Network

3                                                Organic Sales Growth (Strengthened Marketing, Increased Distribution, Geographic
                                                  Expansion, and Further Sub-Category Penetration)
       Multiple Ways
          to Win                                 Margin Enhancement (Significant Cost Savings, Revenue Management, Mix)
                                                 Platform for Value-Enhancing Acquisitions
 4                                               Commitment by Collier Creek and the Rice/Lissette Family to Long-Term Value Creation
          Significant
         Shareholder                             Alignment on Utilizing CCH Playbook
          Alignment                              Retention of 90% of Existing Equity by Rice/Lissette Family, Representing 50.2% Initial
                                                  Economic Ownership
5
                                                 11.6x 2021E Pro Forma Adj. EBITDA Multiple Represents a 1.7x Discount to 1-Year
      Attractive Entry                            Peer Average(3)
         Valuation
                                                 17.8x 2021E Adj. P/E Multiple Represents 2.7x Discount to 1-Year Peer Average(3)
1). IRI MULO+C data (for 5-year period ended 12/29/2019). 2). Euromonitor International data. 3). Peer 1-year averages as of June 1, 2020. Utz 2021E multiples compared to peer NTM+1 multiples.

           ℠                                                                                                                                                                                       4
Investor Presentation - June 2020 - Collier Creek
Transaction Overview
   Enterprise Value of $1,561 million(1)

   Pro forma for the transaction Utz expected to have 2020E Net Debt of ~$385 million or ~3.1x 2020E Pro
        Forma Adj. EBITDA

   Transaction will be structured as an Up-C with the Company entering into a customary tax receivable
        arrangement with Utz owners as part of the transaction

   Expected transaction closing in Q3’20

                                                                  Expected Cash Sources and Uses ($ in mm)

        Collier Creek Cash in Trust Account(2)                                                    $453                 Cash Consideration to Existing Owners                                                        $60
        Sponsor Co-Investment(3)                                                                       35              Repay Existing Debt and Preferred Units                                                      376
                                                                                                                       Transaction Fees                                                                               52
        Total Sources                                                                              $488                Total Uses                                                                                 $488

1). Enterprise value calculated based upon $1,151 million equity value and $409 million of Net Debt based on 12/31/19 balance. Equity value includes 115.1 shares outstanding. Excludes shares underlying warrants ($11.50 strike price)
and seller and sponsor performance shares (which vest at $12.50 and $15.00 per share). Ascribes no value to net present value of net operating losses or other potential tax attributes.
2). Assumes no redemptions from CCH trust account.
3). Investment pursuant to forward purchase agreement with Collier Creek Partners, LLC (“Sponsor”) and independent directors.

             ℠                                                                                                                                                                                                                       5
Investor Presentation - June 2020 - Collier Creek
CCH Team with Proven Track Record in Food Industry
                                                                                            Pinnacle Foods: Case Study
                           Pinnacle Foods Original Brands
                                                                                                                                                 Stock Appreciation CAGR
                                                                                                                                       350          from PF IPO to Sale
                                                                                                                                              Pinnacle Foods        24.1%
                                                                                                                                                                                                                +233.3%
                                                                                                                                       320    S&P 500               10.3
                                                                                                                                              Consumer Staples      6.0
                                                                                                                                       290

                                                                                                          Share Price Rebased to 100
                                                                                                                                       260

                                                                                                                                       230

                                                                                                                                       200

                                                                                                                                                                                                                 +72.4%
                                                                                                                                       170
      Net Sales ($mm)                                        Adj. EBITDA                  ($mm)(1)
                                                                                                                                       140                                                                       +38.1%
                                 $3,144
                                                                                               $675
                                                                                                                                       110

                                                                                                                                        80
         $1,514                                                                                                                          Mar-13 Nov-13 Jun-14 Feb-15 Sep-15 Apr-16 Dec-16   Jul-17   Mar-18 Oct-18

                                                                       $231
                                                                                                                                                   Pinnacle Foods           S&P 500         Consumer Staples

                                                                                                                                             Met or Exceeded Consensus EPS Estimates 22 Consecutive
          2007                    2017                                 2007                        2017
                                                                                                                                                            Quarters from 2013 – 2018

    Source: Company filings, proxies, investor presentations, press releases.
    1). During this time period, net income (loss) grew from ($115.4) million to $532.2 million.

7
               ℠                                                                                                                                                                                                     6
Investor Presentation - June 2020 - Collier Creek
Utz a Perfect Fit for Executing CCH’s Operating Playbook

                                                                                     Support Top Management

                                                                                                                                                                 Productivity Process
         Fully Integrated
                                                                                                                                                                 Capacity Optimization
         Strong Synergies
                                                                                                                                                                 High ROI Investments
         Multiple Enhancing                                        Build
                                                                                                                                           Reduce                Lean Overhead
                                                                  Platform
                                                                                                                                          Costs and
                                                                    with
                                                                                                                                           Expand
                                                                  Strategic
                                                                                                                                           Margin
                                                        ℠        Acquisitions                                                                                                                ℠

                   2007 - 2017            2011 - 2019                                                                                                                2007   2017   Today Future
    Acq.                                                                                                                                                   Prod. %
    Made                  5                     11                                                                                                                   ~2%    ~4%
Salty Snacks Among the Best Categories in CPG
                                                                         2010 – 2019 U.S. Retail Sales Growth(1)

           4.3%
                                                                            3.7%                                                                       3.8%
                                                                                                                                                                  3.5%

                                                                                             2.6%
                                            2.2%                                                             2.3%
                                                                                                                              2.0%         1.8%
                                                                                                                                                                            1.4%

                       (2)                 Total                           Sweet            Non-                            Baked        Ice Cream   Alcoholic   Beauty /   Home
       Salty Snacks                                                                                        Confect.
                                         Packaged                         Biscuits /      Alcoholic                         Goods           and       Drinks     Personal   Care
                                           F&B                           Snack Bars        Drinks (3)                                      Frozen                  Care
                                                                                                                                          Desserts

Source: Euromonitor International.

                                              Supported by Strong Consumer Trends and Category Dynamics

 95% of U.S. Population Snacking At Least Once Per Day                                                          Category leaders compete primarily with marketing and innovation
                                                                                                                      versus price
 Average American Snacks 2.6x Times Per Day
                                                                                                                 Low penetration by Private Label at 5-6% and flat for the last
                                                                                                                      decade
 ~50% of U.S Eating Occasions are Snacks
                                                                                                                 Provides exposure to faster growing distribution channels
 ~50% of U.S. Consumers Replacing Meals With Snacks

Source: IRI, the Hartman Group, and The Consumer Goods Forum.
1). Represents CAGR. 2). Defined as Euromonitor U.S. Savory Snacks category with Savory Biscuits removed. 3). Excludes dairy products.

            ℠                                                                                                                                                                      8
Utz Consistent Sales Growth Even During Economic Downturns
                                                                                    Net Sales ($ in millions)(1)

                                                                                                                                                                                                        COVID-19/
                     2001 –        2019(3)       CAGR                                                                                                                                          $866
                                                                                                                                                                                                        Recession

                                                                                                                                                                                                            Q1 2020
                     Total                            8%                                                                                                                                                     YoY
                                                                                                                                                                                        $772
                                                                                                                                                                                                            Growth
                                                                                                                                                                                                            +12%(4)
                     Organic(2)                       4%                                                                                                                         $707

                                                                                                                                                                          $656
                                                                                                                                                            $618

                                                                                                                                                 $559
                                                                                                                                      $535
                                                                                                                           $513

                                                                                                                $468
                                                                                       Recession
                                                                                          $398       $403

                                                                               $359

                                                                    $318
                                                         $290
          Recession                           $266
                                   $254
              $222      $228
  $216

                                                                                                                                                                                                      (3)
   2001       2002       2003       2004       2005       2006       2007       2008      2009       2010       2011       2012       2013       2014       2015          2016   2017   2018   2019
1). Source: Internal financials. Figures for 2001 – 2019 represent Net Sales.
2). Based on management estimates for growth excluding acquisitions.
3). 2019 pro forma for the full year impact of Conagra Snacks and Kitchen Cooked acquisitions. Periods prior to 2019 are actual.
4). Represents growth over the comparable pro forma Q1 2019 net sales, including the impact of the Conagra Snacks and Kitchen Cooked acquisitions. See pages 30 and 40.

          ℠                                                                                                                                                                                                     9
Attractive Value Creation Potential

                                                                    Long-Term Organic Growth Model

                                                                             In-Line with Category
          Net Sales                                                                                  Power Brands Focus
                                                                                     3 – 4%
                                                                                           (1)

          Adj. EBITDA                                                                  6 – 8%        Productivity / Margin Enhancements

          Adj. EPS                                                                     8 – 10%       Deleveraging

                                                                 (2)
          Exp. Dividend Yield                                                           ~2%          ~40% Target Payout Ratio
                                                                                                     Initial Annualized Dividend of
                                                                                                     $0.20 Per Share for FY 2020

          Total Shareholder Return                                                    ~10 – 12%

                                         Plus Additional Upside From Strategic Acquisitions

1). Based on management estimates.
2). Does not include potential incremental dividends from excess tax distributions.

             ℠                                                                                                                            10
II. Business Overview
Nearly 100-Year Old Family Company with Tremendous Heritage
                                                                          National Scale Multi-Branded
                Rich Heritage and Regional Expansion
                                                                            Snack Platform Created                            Today
                             (1921–2011)
                                                                                   (2011–2019)

     1921 – Founding by Bill              1990s-2010 – Geographic     2017 – National Warehouse Distribution
     and Salie Utz in                     Expansion Throughout        and DSD Transformation
     Hanover, PA                          Northeast
                                                                                                                      2020

                            1940s-1960s – First Dedicated
                            Manufacturing Plant (1947)
                            and Expansion of Production
                            Capabilities                                                                           Today – Largest Privately-Held
                                                                                                                   Branded Salty Snack Company
                                                                                                                   in the US
                                                                                                                   – 5+ million Pounds of Snacks
                                                                                                                       per Week
                                                                                                                   – Reaching 75,000+ Retail
                                                                                                                       Stores Across the Country
1920
                                                                     2011-2019 – Rapid Geographic and Brand
                                                                     Portfolio Expansion Driven by Strategic M&A
                                                                      –            in 2011 (South/Southeast)
     1920s-1930s – Iconic                1970s-1980s – Expansion
     “Little Utz Girl” Born              into Other Salty Snack       –            in 2014 (BFY)
                                         Sub-Categories, Including
                                         Pretzels and Cheese          –            in 2016 (Southeast)

                                                                      –            in 2017 (BFY/West)

                                                                      –            in 2019 (Pacific Northwest)
                                                                          Snacks
Source: Management estimates.

            ℠                                                                                                                                  11
Scale Player in Salty Snacks and #2 in Core Geographies
                                                                   2019 U.S. Salty Snack Retail Sales ($ in millions)

                                                                                                                                                (1)
                                                                                                                                        Core                                   U.S.
                                                                                                                               Rank            Share                  Rank             Share
                      $16,047                                                                  Total Salty Snacks                 #2               7%                   #4                4%

                                                                                                    Potato Chips                  #2             12%                    #4                6%            ~$2,000

                                                                                                    Pork Skins                    #1             23%                    #3             12%
                                                                                                                                                                                                                     $1,459
                                   $1,235
                                                                                                       Cheese                     #2               7%                   #2                4%
                                               $1,094
                                                                                                       Pretzels                   #2             17%                    #3             10%
                                                           $972

                                                                         $569
                                                                                   $492
                                                                                               $400

                                                                                                           $260
                                                                                                                       $196        $195        $187        $171       $170         $145        $116

                                                                  (2)                                                                                                        (3)
                      Pepsi Campbell’s
                     PepsiCo Campbell Kellogg’s
                                       Kellogg              Utz         General          Hershey's Hain
                                                                                   Grupo Hershey’s                     Arca       Herr's      Truco       Gruma     Conagra        Mars    Old Dutch All Other       Private
                                                                   ℠
                                                                         Mills     Bimbo           Celestial
                                                                                                   Celestial           Cont.                                                                         Branded          Label

     DSD(4)                                                                               ~           ~                                ~                      ~                      
   Category
Diversification(4)       Y           Y           N           Y            N          Y          N           Y           Y           Y          N           N           Y           N           Y

                                                                                                            DSD Network          ~ Utilizes Partner’s DSD Network  No DSD Network
      Source: IRI MULO-C data (52-week period ended 12/29/2019).
      1). Core geographies mean legacy Northeast and Mid-Atlantic regions of Connecticut, Delaware, Maine, Maryland, Massachusetts, New Hampshire, New Jersey, New York, Pennsylvania, Rhode Island, Vermont, Virginia, and
      Washington D.C. as well as Alabama, Illinois, Oregon, and Washington where Utz has acquired strong regional brands and distribution capabilities in recent years. See page 25.
      2). Adjusted to include the full year impact of the Conagra Snacks and Kitchen Cooked acquisitions.
      3). Adjusted to exclude the full year impact of brands acquired by Utz.
      4). Based on management estimates and judgement.

                ℠                                                                                                                                                                                                              12
Strong Brand Portfolio with Focus on Power Brands

                                                                                   Power Brands (71% of Sales)

              Iconic Heritage                                                   Craft                                            Better For You                   Licensed

                                                                                            Pork Skins

                                                                              Foundation Brands (29% of Sales)

                                                                          Regional                                                                                Other

                                                                                                                                                        • Partner Brands
                                                                                                                                                        • Private Label

                                                                             Chips/Cheese

Note: Sales represent invoiced sales, which represent net sales before the impact of certain trade deductions and independent DSD operator discounts.

          ℠                                                                                                                                                                  13
Broad Distribution Across Channels and Customers…

                        2019 Utz Sales by Channel(1)                                                       Illustrative Customers

                                                        (2)
                                       Other
                                  Drug 6%
                                   2%
                        Club
                        6%

           Mass
           14%

                                                                            Food
                                                                            52%

                C-Store
                 20%

                                                                                               No Customer Represents More than 10% Of Sales

                                                                                               15+ Year Average Relationship with Top Customers

1). Source: IRI MULO-C data (52-week period ended 12/29/2019). 2). Includes dollar/discount.
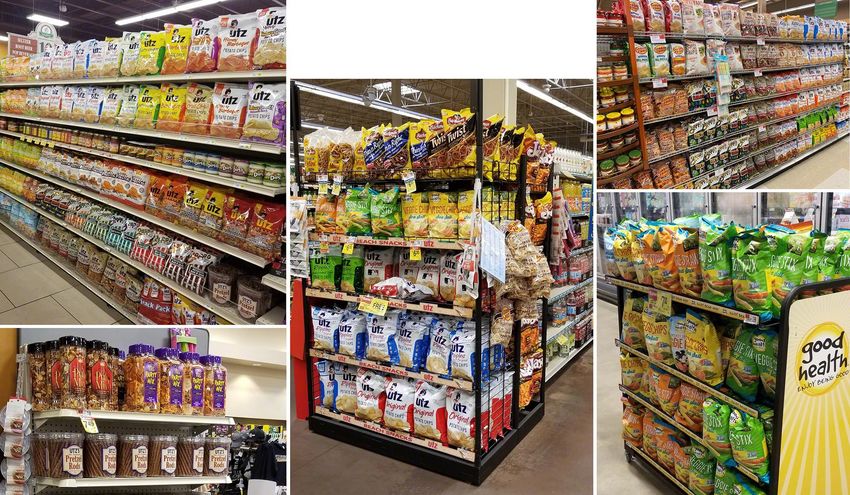
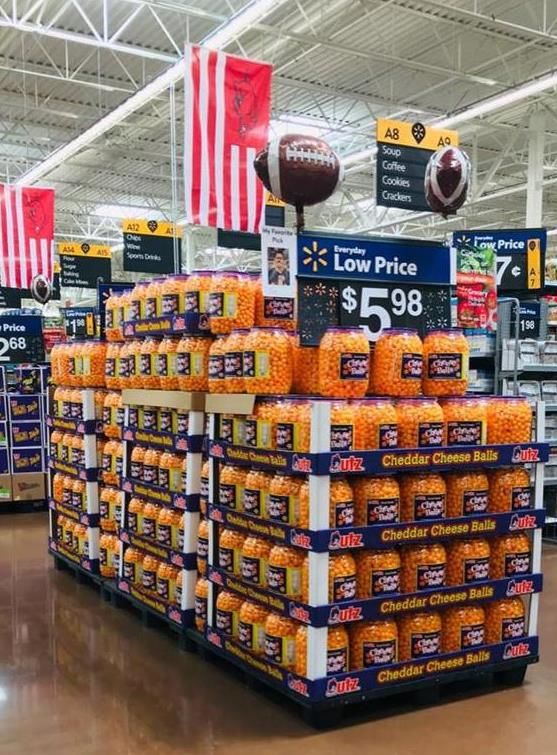
          ℠                                                                                                                                  14
With Excellent Retail Shelf and Display Presence

                                       ℠

   ℠                                               15
Flexible, Efficient DSD and Warehouse Distribution System

                             Direct to Warehouse                                 Direct to Store (DSD)

              ~17,000 Doors                                                       75,000+ Doors
              ~350 Retailer Distribution                                          ~1,645 Total Routes
                                     Centers
                                                    Direct to
                                                   Warehouse
                                                      25 %       Direct to
                                                                                            3 of the Top 4
                                                                  Store               Salty Snacking Companies
                                                                  (DSD)                Operate DSD Networks(1)
                                                                 Network
                             Distributor                           50 %
                                                   Distributor
                                                      25 %                                   Utz Transition to IOs

              ~15,000 Doors                                                           % of Routes       2016         2019

                                                                                    Company-Owned       67%          23%

                                                                                      Independent
                                                                                                        33%          77%

              ~635 Routes
                                                                                     Operators (IO)

                                                                             Completed Transition Expected in 2021

1). Sourced from management estimates.

          ℠                                                                                                                 16
National Manufacturing Footprint with Broad Capabilities

                   14 Manufacturing Facilities
                                                                                                                                                                      (4)

            400 Million Lbs. Annual Capacity(1)
            ~69% Capacity Utilization(1)
            Strong Quality and Safety Record

                      Processes                                                                     Ingredients                                        Packaging

  Continuous                                                                    Avocado Oil              Olive Oil           Gluten-Free    Bags        Barrels    Multipacks
                             Kettle              Extruded
    Chips                    Chips

    Popped                  Baked                 Sheeted                          Organic                 Veggie                 Pork     Seasonals      Trays    Resealables

1). Based on management estimates of available capacity in 2019 over a seven-day work schedule, excluding weekly clean-up time.

          ℠                                                                                                                                                                     17
Track Record of Accretive and Well-Integrated Acquisitions

                                                                                          Pre-Synergy                                      Post-Synergy        Cost Synergy
                     Year                                   Target
                                                                                      Adj. EBITDA Multiple                              Adj. EBITDA Multiple   % of Revenue

                    2019                                                                             11.2x                                     7.4x               5.8%
                                                          Snacks

                    2017                                                                               NM                                    10.2x(1)            13.8%

                    2016                                                                             15.8x                                     7.6x               9.6%

                    2013                                                                             13.2x                                     5.7x               8.7%

                     2011                                                                             8.0x                                     5.6x               7.0%

                                                                                  All Acquisitions(2)                                          7.4x               8.1%

Source: Management estimates. Table excludes smaller tuck-in acquisitions details.
1). Purchase price net of NPV of step-up tax amortization benefits expected to be realized from the transaction.
2). All acquisition statistics based on weighted average and includes 6 additional smaller tuck-in acquisitions completed since 2011.

           ℠                                                                                                                                                                  18
Highly Experienced Management Team

         Name                Title             Years at Utz   Background

         Dylan                                  24 Years
                    Chief Executive Officer
        Lissette                                                           ℠

         Cary            EVP & Chief             4 Years
        Devore         Financial Officer

         Mark                                    3 Years
                    EVP, Sales & Marketing
       Schreiber

        Tucker        EVP, Chief Supply         15 Years
       Lawrence         Chain Officer

         Ajay                                    3 Years
                   EVP, Finance & Accounting
        Kataria

         Todd           EVP & Chief             23 Years
         Staub       Administrative Officer

   ℠                                                                           19
III. Value Creation Strategy
Goal: Be Fastest Growing Pure-Play Branded Snack Platform of Scale in U.S.

                                                                                 Reduce
                             Continue
                                                                                Costs and
                             Strategic
                                                                                Enhance
                            Acquisitions
                                                                                 Margins

  A. Focus on Branded                                                                              A. Drive Productivity
                                                                     ℠
     Snacking in the U.S.                                                                          B. Optimize Revenue and
  B. Deliver Strong                                 Value Creation                                    Trade
     Synergies                                        Strategies                                   C. Improve Margin Mix

                                                      Reinvest to
                                                      Accelerate
                                                       Revenue
                                                       Growth

                            A. Accelerate Power Brands Through Enhanced Marketing and Innovation
                            B. Expand Distribution in Underpenetrated Channels and Customers
                            C. Continue National Geographic Expansion
                            D. Increase Presence in Key Salty Snack Sub-Categories and Adjacencies

    ℠                                                                                                                        20
Reduce Costs and Enhance Margins

                     Company Positioned for Significant Ramp-Up in Cost Savings and Margins

                                    Eleven Acquisitions Successfully Integrated               Utz Adj. EBITDA Margin(2)
   Business                          – 4 to 14 Manufacturing Facilities
 Transformation                      – SKU Count Expanded ~50%, Net of Rationalizations                         Mid-Teens
                                    DSD Converted to Independent Operators

     People,
                                    Upgraded Management and Dedicated Continuous                   12.4%
                                        Improvement Resources
   Processes,
  and Systems                       Manufacturing and Trade Management Systems Implemented
    in Place
                                    Single, Upgraded ERP System Underway

                                    Constrained by High Leverage as Private Company
       Capital
      Available                     After SPAC Business Combination, Capital Reallocated to
                                        High ROI Productivity Initiatives                           2019A         Target
                                                                                                 Pro Forma(1)

                                                                                                  Margin Target Reflects
      CCH                           CCH Proven Productivity and Cost Savings Playbook             Planned Increase in
   Partnership                                                                                        Marketing and
                                    CCH Team to Actively Partner with Utz Management                Brand Support

1). Represents 2019A Pro Forma Adj. EBITDA as % of Pro Forma Net Sales.
2). See page 40 for reconciliation.

        ℠                                                                                                                   21
Reduce Costs and Enhance Margins (Cont’d)
                                                                                             Expected
                                                                                          Financial Impact

                                               e-Auctions
                           Procurement         Group Purchasing
                                               Product Design
                                               LEAN/CI Projects
                           Manufacturing
                            Processes
                                               Raw Materials Waste/Giveaways
                                               Forecasting and Scheduling          Ongoing Annual Productivity
                                                                                      $50 Million of Identified
                                                                                     Savings of 3-4% of COGS
                                                                                      Opportunities Over Next
                           Manufacturing                                                   Three Years
 A. Drive Productivity       Footprint
                                               Plant Optimization
                                                                                    Supply Chain Opportunities
                                                                                    Ongoing Annual Productivity
                                                                                     Identified with $50 million
                                                                                     Savings of 3-4% of COGS
                                                                                     Potential Over Three-Year
                                               Network Optimization                           Period
                            Distribution
                                               Route-to-Market Efficiencies

                                               Final IO Conversion
                                G&A
                                               ERP Efficiencies

                          New Trade Management Software in 2020
 B. Optimize Revenue                                                                 ~25bps per Annum Over 3
                          Leverage Insights from ERP Rollout
    and Trade                                                                                 Years
                          Price Pack Architecture Initiatives

 C. Improve Margin        Grow Higher-Margin Power Brands
                                                                                                   annum
                                                                                        ~30bps per Annum
    Mix                   De-emphasize Lower-Margin Private Label/Partner Brands

   ℠                                                                                                               22
Accelerate Power Brands Through Enhanced Marketing and Innovation
                            Increase Marketing Spend                                                                              Strong Momentum in Key Power Brands

                           Advertising Expense % of Sales                                                                                       Retail Sales ($mm)                        ACV Distribution (%)
                                                                                                                                                                        $563                                        61%
                     LT Target: ~3-4%                                        3.8%                                                                                                              47%

                                                                                                                                                   $495

                                                                                                                                                    2014                2019                   2014                 2019

                                                                                                                                                                        $46

                           2019: ~1%
                                                                                                                                                                                                                    44%
                                                                                                                                                    $23
                                Utz                                  Peer
                                                                   Peer   Average (1)
                                                                        Average
                                          ℠                                                                                                                                                    18%

                  Improve Brand Marketing Execution                                                                                                2014                 2019                   2014                 2019
                                                                                                                                                                        $48

       Shift from “push” to “pull” marketing orientation                                                                                                                                      33%
                                                                                                                                                                                                                    37%

       Reallocate existing spend to higher ROI marketing                                                                                           $13

       Leverage consumer research and insights                                                                                                    2014                 2019                   2014                 2019

                                                                                                                                                                        $63
       Enhance new product innovation capabilities
                                                                                                                                                    $37
       Improve sales execution with analytics and
        technology                                                                                                                                                                              9%
                                                                                                                                                                                                                    14%
                                                                                                                          Pork Skins

Source: Company filings, Management estimates. IRI MULO-C data for 2014 and 2019 calendar years.                                                      2014               2019                     2014               2019
1). Represents last reported fiscal year advertising expense as a % of Net Sales per most recent form 10-K reviewed as of April 29, 2020. Peers include Campbell’s, Flowers Foods, General Mills, Hain, Hershey, Hostess, J&J Snack Foods,
Kellogg, Mondelez, and PepsiCo.

           ℠                                                                                                                                                                                                                     23
Expand Distribution in Underpenetrated Channels and Customers
                                                            Share by Channel                                              C-Store and Mass Strategies
                                  56.9%                                                                                Expand C-Store presence through
                                                        7.3%                                                            strengthened master distributor and
      Food                                                                   4.7%               3.6%
                                                                                                           1.9%
                                                                                                                        redistributor relationships

                                                                                     ℠
                                                                                                                       Drive Mass distribution by
                                               4.7%
                                                                                                                        leveraging new national scale and
                                  68.1%
                                                                                                                        expanded brand portfolio
    C-Store                                             4.2%                 3.9%               3.5%       3.2%        Develop channel specific packages
                                                                                                                        and display units
                                                                                                                  ℠

                                  66.3%                         4.7%

      Mass                                              4.9%
                                                                             3.1%               2.4%       2.1%           Rapidly Growing E-Commerce
                                                                                                       ℠
                                                                                                                                          2019(1)   Q1 2020(1)
                                  57.6%
                                                                                                                        % of Net Sales    1.2%        2.0%
       Club                                             5.3%                 4.4%               3.8%       3.6%
                                                                                                                        YoY Growth         83%        106%

                                                                                     ℠

                         4.7% Share in C-Store and Mass Represents
                             $210mm of Incremental Retail Sales
Source: IRI MULO-C data (52-week period ended 1/26/2020) for salty snack category by channel.
1). Pro Forma for Conagra Snacks and Kitchen Cooked acquisitions.

          ℠                                                                                                                                                      24
Continue National Geographic Expansion
                                      Geographic Priorities                                                                                      Strategies

                  WA
                                                                                                                             Focus on Large Population Markets
                                       MT        ND                                                                  ME

              OR
                                                           MN
                                                                                                               VT
                                                                                                                 NH
                                                                                                                                – “Expansion” Markets: Florida, Texas, Mid-West
                            ID                   SD                   WI                                  NY          MA
                                      WY                                             MI                         CT

                                                 NE
                                                            IA                                      PA
                                                                                                                NJ
                                                                                                                       RI
                                                                                                                                – “Emerging” Markets: California, Arizona
                       NV                                                                 OH
                                                                           IL   IN                               DE
                                 UT
                                        CO                                                     WV
                                                                                                                MD
                                                                                                     VA
                                                                                                                             Expand DSD Route Network
             CA                                       KS        MO
                                                                                     KY                         DC
                                                                                                    NC
                                                                                TN
                             AZ                       OK
                                      NM                        AR                              SC

                  HI
                                                                           MS   AL         GA
                                                                                                                             Drive Power Brands via National Warehouse
                                                  TX
                                                                 LA
        AK                                                                                                      Core
                                                                                                                Expansion
                                                                                                    FL
                                                                                                                Emerging
                                                                                                                             Make Tuck-in Acquisitions

                                      Significant Opportunity for Growth in Expansion and Emerging Geographies

                                                                                                                Utz $
                                             % 2019 Utz
                                                                                Rank                           Market
                                             Retail Sales
                                                                                                               Share
                                                                                                                               Each One Point Share Gain in
       Core                                     59%                              #2                             7.4%            Expansion/Emerging Geographies
                                                                                                                                Represents $180mm of Incremental Retail
       Expansion                                31%                              #4                             3.2%            Sales

       Emerging                                 10%                              #6                             1.2%           7.4% Share Nationally Represents
                                                                                                                                $890mm of Incremental Retail Sales
       National                                 100%                             #4                             3.8%

Source: IRI MULO-C data (52-week period ended 12/29/2019).

          ℠                                                                                                                                                                       25
Increase Presence in Key Sub-Categories and Adjacencies
         3.8% Share in Tortillas and RTE Popcorn                                                         Strategies
      Represents $235mm of Incremental Retail Sales
                                                                                 Introduce New Brands                  License Brands

                                     % of Total
        Sub-                        Salty Snack                 Utz
      Category                       Category                  Share

  Potato Chips                              30%                6.1%

  Tortilla                                  22%                0.3%    3.8%

                                                                               Line Extend Existing Brands            Make Acquisitions
  Cheese                                    11%                4.2%

  RTE Popcorn                                6%                1.4%    3.8%

  Pretzel                                    5%                10.4%

  Pork Skins                                 2%                12.4%
                                                                                     Other Adjacent Snack Category Opportunities
      Total(1)                                                 3.8%
                                                                               BFY / Healthy Snacks          Bagel / Cracker Chips

                                                                               Protein Snacks                Nuts / Trail Mix

                                                                               Baked Snacks                  Salsa / Dips

Source: IRI MULO-C data (52-week period ended 12/29/2019).
1). Total market share includes corn and other salty snacks.
                                                                               Pita / Rice Snacks

          ℠                                                                                                                               26
Continue Strategic Acquisitions

                                                               Near-Term Acquisition Criteria

Proven Track   Acquisition-Savvy Management Team
                                                         A. Focus on Branded Snacking in the U.S.
   Record      and Experienced Board
                                                            with Concentration on Salty Snacks

                                                              – Facilitate Geographic Expansion
                                                              – Increase Presence in Sub-Categories

  Scalable     Significant Synergy Opportunities
                                                              – Enhance Growth
    M&A        Driven by Highly Leverageable
                                                         B. Deliver Strong Synergies
  Platform     Manufacturing and Distribution System

                                                                     Financial Priorities
   Robust      Utz is Logical Consolidator in Category
 Pipeline &    with Numerous Opportunities                  Accretive and Multiple Enhancing
  Favorable
                    Smaller Tuck-ins
 Competitive
                                                            Consistent with Target Leverage Policy
 Dynamics           Transformative / RMT Vehicle

    ℠                                                                                                 27
IV. Financial Overview
Utz Growth During COVID Significantly Better than Competitors
     Owned manufacturing network with available capacity and durable supplier relationships allowed for flexible and
          efficient production scale-up to meet significantly increased demand

     DSD distribution system with superior execution facilitated fast shelf replenishment and greater in-stocks
     Consumers reassured by strong brand recognition in Core geographies
     Significant growth delivered across key retail channels with less exposure to COVID-impacted channels
     Utz Brands annual retail sales exceeded $1 billion for first time (52 weeks ended 4/19/20)(1)

                                                                      2020 YoY Salty Snacks Retail Sales Growth(1)
           4-Week Period Ended 2/23/20                                                                                12-Week Period Ended 5/17/20
                                                                                                                                                          By Channel
                                               Pre-COVID-19                     Post-COVID-19
                                                                                                                                                                    38%           Total SS
                                                                                                                                                        36%

                                                                                                                                                                                  Utz Brands

                                                                                                                24%                               26%
                                                                                                                                            24%                                 24%
                                                                                                     20%                                                                  20%
                                                                                                                                                              18%
                                                                                         14%   14%                                    14%
                                                                                                                             10%
          5%                      5%      6%                                                               9%
                   4%                                    5%
                                                 4%
                          3%

         Total    Campbell's             Utz        Private Label
     Salty Snacks                       Brands

                                                                                                                      (7%)
                                                                                                                                                                                              (10%)
                                                                                                                                                                                      (11%)

1). Retail Sales based on IRI Salty Snacks category for MULO+C unless otherwise noted.                                                 MULO+C      Food        Mass        Club       Convenien ce

               ℠                                                                                                                                                                                      28
COVID Favorable Longer-Term for Utz Brands
                                                 Stay-at-home orders reintroduced at-home cooking and eating experience
      Longer-Term                                Due to safety concerns, people will spend more time at home and avoid offices, restaurants, and
       Increase in                                 public gatherings, with a potential enduring shift to “work-from-home”
      At-Home Food                               Recession favors at-home versus away-from-home consumption
      Consumption
                                                 Salty snack category growth driven by actual consumption given perishability and therefore more
                                                   resilient than broader CPG to de-stocking issues

                                                Mainstream brands like Utz more attractive during a recession
                                                Strengthened customer relationships from ability to supply and provide retail coverage during
    Accelerated Utz                               COVID
     Sales Growth
    and Share Gains                             Trial generated during COVID creating satisfied new Utz consumers given excellent product
      Longer-Term                                 quality, with household penetration already increasing ~12% or ~2.7 million HH(1)
                                                Reduced competition from smaller salty snack competitors that are less well-capitalized and
                                                  more reliant on co-manufacturers and third-party distribution

                                                                                     2020 YoY Retail Sales Growth

          4-Week Period Ended 3/22/20                                                 4-Week Period Ended 4/19/20                                    4-Week Period Ended 5/17/20

         33%
  31%
                                     27%           29%
                       22% 21%              21%                                                                                                                                 24%
                                                                 20%                                                         21%
                                                                                                                16%                                                  17%
                                                                                                                                                     15%
                                                                                    11%                  10%                                               12% 12%
                                                           9%                                      9%
                                                                                                                                                                           6%                 7%
                                                                                                                                           4%
                                                                                                                                                2%

                                                                                                                      (0%)
                                                                             (5%)                                                                                                     (10%)
                                                                                                                                   (19%)

Source: IRI MULO-C data.
1). Based on IRI panel survey for the 12-week period ended May 17, 2020. 2). Excludes household cleaning products.

          ℠                                                                                                                                                                                    29
Utz Phenomenal Q1 Performance
 More than half of Q1 year-over-year EBITDA growth generated pre-COVID
   – Strong performance from recent Conagra Snacks acquisition (Q1 year-over-year Net Sales and Adjusted EBITDA
     +10% and +28%, respectively)
                                                                                                                                  Pro Forma Adjusted EBITDA ($mm)(2)
                                  Net Sales ($mm)(1)
                                                                                                                                         (% Net Sales Margin )
   YoY % Growth                                                                                                       YoY % Growth
                                                                                  +5%                                                                                                    +15%
                                                                                                                       YoY $ Growth
                                                                                          $910
                                                                                                                                                                                         +$16
                                                                              $866
                                                                                                                                                                   +9%
                                                                                                                                                                                                $124

                                                 +3%                                                                                                               +$8                  $108
                                                         $682
                                             $661                                                                                                                          $94
                                                                                                                                                               $86

                                                                                                                                +40%

                                                                                                                                  +$8
                                                                                                                                          $30
               +12%
                                                                                                                              $22
                                                                                                                                                                           14%                  14%
                        $228
             $204                                                                                                                         13%                 13%
                                                                                                                                                                                        12%
                                                                                                                            11%
              Q1 (3)Q1 Q1 (3)             Q2-Q4
                                              Q2 - Q2-Q4
                                                   Q4                         FYFull Year
                                                                                       FY                                    Q1 (3)Q1 Q1 (3)                 Q2-Q4
                                                                                                                                                                Q2 - Q2-Q4
                                                                                                                                                                     Q4                  FY       FY
                                                                                                                                                                                          Full Year
             2019     2020                 2019     2020                     2019     2020                                  2019     2020                    2019     2020              2019     2020
1). Pro Forma for the acquisitions of Conagra Snacks and Kitchen Cooked. 2020 numbers exclude the impact of the 53 rd week.
2). Pro Forma for the acquisitions of Conagra Snacks and Kitchen Cooked. Includes full run rate synergies and public company costs. 2020 numbers exclude the impact of the 53rd week.
3). See pages 39 and 40 for reconciliation.

         ℠                                                                                                                                                                                              30
Summary Financials
                                                                                                                                                       Pro Forma Adj. EBITDA                                                               100.0%
                                               Net Sales
                                                                                                                                                       (% Net Sales Margin )
                                                                                                                                                                                                                                           90.0%
       ($ in mm)                                                                                                                                                                                                        $134
                                                                          $910                 $928                                                                                               $124                                     80.0%
                                                     $866
                                                                                                                                                                             $108                                                          70.0%
                                $772
           $707                                                                                                                                                                                                                            60.0%
                                                                                                                                                         $80
                                                                                                                                                                                                                                           50.0%
                                                                                                                                   $73

                                                                                                                                                                                                                                           40.0%

                                                                                                                                                                                                                                           30.0%

                                                                                                                                                                                                                                           20.0%

                                                                                                                                                                                                  13.6%                14.4%               10.0%
                                                                                                                                                                            12.4%
                                                                                                                                  10.4%                10.4%
                                                                                                                                                                                                                                           0.0%
                                                             (1)                  (1)                                                                                                (2)                  (2)                   (2)
           2017                 2018                 2019                 2020                 2021                                2017                 2018                 2019                  2020                 2021

Net Sales                                                                                                (3)     Pro Forma Adj.
Growth                           9.2%                12.1%                 5.1%                 2.0%             EBITDA Growth                          9.6%                34.3%                 15.1%                 8.1%

Organic Retail
Sales Growth (4)                 3.5%                 2.6%                  5+%                 3+%

    1). Pro forma for the acquisitions of Conagra Snacks and Kitchen Cooked. Excludes impact of Utz’s 53 rd week. See pages 39 and 40 for reconciliation.
    2). Pro forma for the acquisitions of Conagra Snacks and Kitchen Cooked. Excludes impact of Utz’s 53 rd week. Includes full run rate synergies. See pages 39 and 40 for reconciliation.
    3). Growth rate reflects the impact of final IO conversions, which reduce Net Sales from independent DSD operator discounts and improve Adjusted EBITDA Margins from the elimination of fixed selling and administrative costs.
    4). IRI MULO+C data (calendar years ending 2017-2019). Excludes the impact of acquired brands until a full year of Utz ownership is in the baseline.

             ℠                                                                                                                                                                                                                        31
Significant Profit-Enhancing Capex Opportunities; Strong FCF Conversion
                                                                                   Capital Expenditures ($ in mm)

              New ERP Implementation
              Profit Enhancing                                                                                                                              $28.3
              Maintenance
                                                                                                                                                                                    $25.0

                                                                                                                                                            $10.0

                                                                                                                $18.6
                                                                                                                                                                                    $15.0
                         $15.2                                                                                    $4.7
                                                                     $13.1                                                                                   $8.4
                           $3.2
                                                                      $1.8
                                                                                                                  $5.4
                                                                                                                                                                            $18.3
                                                                                                                                        $13.9
                          $12.1                                      $11.3
                                                                                                                                                             $9.9                   $10.0
                                                                                                                  $8.6

                                   (3)
                         2017A                                       2018A                                      2019A                                       2020E                   2021E

% of
Net Sales
          (1)             2.2%                                        1.7%                                       1.6%                                        2.0%                   2.7%

FCF        (2)             79%                                        84%                                         87%                                        85%                    81%
Conversion

   1). Calculation excludes ERP Implementation capex and is based on Pro Forma Net Sales. See page 40 for reconciliation.
   2). Represents (Pro Forma Adjusted EBITDA – Capex) / Pro Forma Adjusted EBITDA. Calculation excludes ERP Implementation capex. See page 40 for reconciliation.
   3). Excludes $6.4 million of non-recurring capex primarily related to the rebuild of the company’s fire damaged FL plant that was subsequently sold later in the year.

            ℠                                                                                                                                                                               32
Capital Focused on Driving Growth

                             Cash Flow Priorities                                                                                                  Target Leverage

                                           Business Growth
       1                                   (Including M&A)
                                                                                                                      •      2020E Net Debt / PF Adj. EBITDA of 3.1x

                                                                                                                      •      Target Net Leverage of 3 – 4x

                                                                                                                      •      Higher Net Debt / Adj. EBITDA Possible for
                                                                                                                             Strategic Acquisitions, Returning to Target
       2                                     Debt Reduction                                                                  Range within 1 – 2 Years

                                                                                                                                            Expected Deleveraging(1)

       3                                  Dividend Increase                                                                                3.1x

                                                                                                                                                                     2.6x

       4                                     Share Buyback

                                                                                                                                           2020E                     2021E

1). Represents Net Debt / Pro Forma Adjusted EBITDA. Please see pages 39 and 40 for reconciliation of Pro Forma Adjusted EBITDA to GAAP.

         ℠                                                                                                                                                                   33
Appendix
Transaction Overview
 Enterprise Value of $1,561 million(1) (11.6x 2021E PF Adj. EBITDA)(2)
 Pro forma 2020E Net Debt / PF Adj. EBITDA of 3.1x (all First-Lien)
 Existing Utz owners to be paid $60 million in cash consideration and issued 57.8 million rollover shares at close(3)
 Company to enter into tax receivable arrangement with Utz owners as part of transaction
 Collier Creek to convert 2 million Founder Shares to Performance Shares vesting at $12.50 and $15.00; rollover Utz
     owners to receive 3.5 million Performance Units with identical terms
 Transaction Closing expected in Q3’20

                               Pro Forma Valuation ($ in mm)                                                                   Expected Cash Sources and Uses ($ in mm)

 Collier Creek Illustrative Share Price                                                                  $10.00            Collier Creek Cash in Trust Account(5)              $453
                                                                                                                                                   (6)
                                                                                                                           Sponsor Co-Investment                                  35
 Pro Forma Shares Outstanding (mm) (1)                                                                     115.1
                                                                                                                           Total Sources                                        $488
 Equity Value                                                                                            $1,151
 Net Debt (1)                                                                                                  409         Cash Consideration to Existing Owners                 $60
                                   (1)                                                                                     Repay Existing Debt and Preferred Units               376
 Enterprise Value                                                                                        $1,561
                                                                                                                           Transaction Fees                                       52

                          NTM PF Adj. EBITDA Multiple (4)                                                                  Total Uses                                           $488
  Valuation                                                                                                12.1x
  Multiples               CY'21E PF Adj. EBITDA Multiple                                                   11.6x                     Expected Pro Forma Ownership(5)

                                                                                                                            Collier Creek
                                                                                                                         Public Shareholders                            Rice/Lissette Family
1). Enterprise value calculated based upon $1,151 million equity value and $409 million of Net Debt based on                                   41.3%                     (Existing Owners)
12/31/19 balance. Equity value includes 115.1 shares outstanding. Excludes shares underlying warrants ($11.50
strike price) and seller and sponsor performance shares (which vest at $12.50 and $15.00 per share). Ascribes no                                                50.2%
value to net present value of net operating losses or other potential tax attributes.
2). See page 40 for reconciliation to Pro Forma Adj. EBITDA.
3). Utz owners will retain limited liability company interests in a subsidiary limited liability company to the public
company (see proxy for further details on transaction structure). Rollover shares represent public share equivalent                                      8.6%
upon conversion of limited liability company interests and exclude 3.5 million seller performance shares.
4). NTM EBITDA multiple based on Q2 2020 NTM Pro Forma Adjusted EBITDA.
5). Assumes no redemptions from CCH trust account.                                                                             Collier Creek Founders
6). Investment pursuant to forward purchase agreement with Sponsor and independent directors.

           ℠                                                                                                                                                                               34
Operating Benchmarking to Peers

                                               12.0%        11.3%
                                                                                                                                                                                                          Peer Median: 1.3%
           CY
      2019 – 2021E                                                           3.5%
                                                                                           2.5%       2.3%            2.1%
        Net Sales                                                                                                                 1.4%          1.3%           0.7%
         CAGR                                                                                                                                                                (0.0%)         (0.1%)   (1.0%)
                                               BRBR          SMPL     (1)
                                                                              Utz    (2)
                                                                                           PEP         FLO            TWNK
                                                                                                                         (3)      MDLZ    (4)   HSY             K     (5)     GIS            CPB       HAIN (6)    (7.0%)
                                                                                                                                                                                                                    JJSF

                                              16.3%
                                                            14.9%
                                                                             11.5%
                                                                                                                                                                                                          Peer Median: 2.5%
           CY
                                                                                           4.9%
      2019 – 2021E                                                                                    4.4%            4.4%
                                                                                                                                 2.8%           2.3%           1.7%          1.6%           1.5%      1.3%
      Adj. EBITDA
         CAGR
                                                HAIN (6)     SMPL             Utz          FLO        TWNK(3)         PEP        MDLZ           HSY             K            BRBR           CPB        GIS        (15.1%)
                                                                                                                                                                                                                    JJSF
                                                                       (1)           (2)                                                                              (5)
                                                                                                                                          (4)

                                               24.8%                                                                                                                                                    Peer Median: 19.5%
                                                             21.9%           21.3%         20.7%      20.3%           19.6%      19.4%          18.1%          16.6%
                                                                                                                                                                             13.6%
      CY 2020E                                                                                                                                                                              10.7%     10.2%         9.0%
    EBITDA Margin

                                                 HSY         TWNK(3)          GIS          CPB         MDLZ     (4)   BRBR         PEP          SMPL     (1)     K     (5)     Utz    (2)    FLO       HAIN (6)      JJSF

Source: Company filings, FactSet. Market data as of June 1, 2020.
1). Pro Forma for acquisition of Quest. 2). Pro Forma for FY impact of Conagra Snacks and Kitchen Cook acquisitions. 3). Pro Forma for acquisition of Voortman’s. 4). Pro Forma for acquisition of Perfect Snacks. 5). Pro
Forma for divestiture of Keebler. 6). Pro Forma for divestiture of Tilda.

           ℠                                                                                                                                                                                                                  35
Valuation Benchmarking to Peers (1-Year Average Multiples)
                                             17.9x       17.7x                                                                                                                     Peer Median: 14.8x
                                                                     16.8x        16.3x       15.8x        14.9x         14.6x
                                                                                                                                     13.5x    13.4x          13.3x     12.8x    12.1x          11.2x

      NTM EBITDA
        Multiple
                                            SMPL       JJSF-US        HSY         MDLZ         PEP         HAIN          BRBR (1)     K       FLO             GIS      CPB       Utz    (2) TWNK-US

                                             16.8x       16.3x                                                                                                                     Peer Median: 13.3x
                                                                     15.6x        14.7x
                                                                                              13.7x        13.4x         13.1x       13.1x    13.1x          12.8x     12.7x
                                                                                                                                                                                11.6x          10.7x

           NTM + 1
           EBITDA
           Multiple
                                           JJSF-US        HSY        MDLZ         PEP         HAIN        BRBR (1)         K         GIS      FLO             CPB      SMPL     UTZ     (2)   TWNK-US

                                             31.5x                                                                                                                                 Peer Median: 20.5x
                                                         25.9x
                                                                      23.8x        22.7x       21.2x        20.8x         20.3x       18.9x    17.8x          17.2x     17.0x    15.4x          15.3x
         NTM + 1
      P / E Multiple

                                           JJSF-US       SMPL         HAIN         HSY          PEP         FLO           BRBR (1)   MDLZ      UTZ     (2)   TWNK-US    CPB       GIS             K

Source: Company filings, FactSet. Market data as of June 1, 2020.
1). Data as of IPO date, October 16, 2019.
2). Utz NTM EBITDA multiple based on Q2’20 NTM Pro Forma Adjusted EBITDA and NTM+1 multiples based on FY 2021 figures.

          ℠                                                                                                                                                                                             36
Margin Enhancements Further Reduce Implied Entry Valuation

        ($ in millions)

                                                                                                                             Pro Forma Normalized Financial Profile
                                                                   ℠                                                 Adj. EBITDA              Incremental              % of Identified                Implied
                                                                                                                      Margin(1)                 EBITDA                 Opportunities(2)               Multiple
               Current Financial Profile (2020E)
                                                                                                                           15%                      $12                        25%                     11.4x
         Net Sales                                                          $910

                                (4)                                                                                        16%                      $22                        43%                     10.7x
         Adj. EBITDA                                                        $124

         Adj. EBITDA Margin                                                  13.6%                                         17%                      $31                        61%                     10.1x

                                                                   (1)       Mid-
         Normalized Adj. EBITDA Margin                                                                                         Median Peer NTM EBITDA Multiple(3) – 14.8x
                                                                            Teens

1). Represents potential future margin level based on management and CCH estimates reflecting identified potential margin enhancements and inclusive of expected incremental marketing investments.
2). Incremental EBITDA as a percentage of identified supply chain cost savings initiatives that have the potential to cumulatively deliver approximately $50 million of annual gross cost savings.
3). Represents 1-year average. Peers include BellRing, Campbell’s, Flowers Foods, General Mills, Hain Celestial, Hershey’s, Hostess, JJ Snack Foods, Kellogg’s, Mondelez, PepsiCo, and Simply Good. See page 36 for additional detail.
4). See page 40 for reconciliation.

          ℠                                                                                                                                                                                                                     37
Expected Board of Directors
                    Collier Creek Director Nominees                                                       Family Director Nominees

                         Name                        Title                            Bio               Name            Title                    Bio

                                                                          •    Former Chairman,
                       Roger                                                   Pinnacle Foods,          Dylan      Chief Executive     •   CEO, Utz
                                                 Chairman
                      Deromedi                                            •    Former CEO, Kraft       Lissette        Officer         •   24 years at Utz
                                                                               Foods

                                                                          •    Former EVP & Chief
                                                Director;                      Financial Officer,
                                                                                                                       Director;       •   Former Chairman &
                         Craig                Chair, Audit                     Pinnacle Foods            Mike
                                                                                                                  Chairman Emeritus;       CEO, Utz
                       Steeneck               Committee;                  •    Former CFO,               Rice
                                                                                                                   Special Advisor     •   40+ years at Utz
                                             Special Advisor                   International Home
                                                                               Foods
                                                                          •    Former EVP & Chief
                                                                               Supply Chain Officer,                                   •   President & CEO,
                        Tony                                                   Pinnacle Foods            Tim                               Sageworth
                                                   Director                                                            Director
                      Fernandez                                           •    Former Chief Supply      Brown                          •   25-year Director at
                                                                               Chain Officer,                                              Utz
                                                                               Cadbury

                                                                          •    Sr. Vice President,
                                                                               Diageo                                                  •   CFO, Hydrofarm
                       Christina                                                                         John
                                                   Director               •    Former Global Brand                     Director        •   Former CFO,
                         Choi                                                                          Lindeman
                                                                               Vice President, AB                                          Calavo Growers
                                                                               InBev

                                                Director                  •    Sr. Managing                            Director
                        Jason                    Chair,                        Director, CC Capital      John     Chair, Nominating    •   Former CEO,
                       Giordano               Compensation                •    Former Managing         Altmeyer    & Governance            Carlisle Syntec
                                               Committee                       Director, Blackstone                  Committee

Note: Represents expected director nominees, subject to requisite approvals.

          ℠                                                                                                                                                      38
Non-GAAP Reconciliation

                                                                                                                                            Non-GAAP Reconciliation
                                                                                                                       Fiscal Year Ended,                                               Fiscal Quarter Ended,
                                                                                                       December December December                                                       March 31, March 29,
                                                                                                          31, 2017                 30, 2018                  29, 2019                         2019                      2020
                        Net Sales (Per GAAP)                                                                       $707                     $772                      $768                         $178                      $228
     Net
                        Independent DSD Operator Discounts                                                           40                       58                        77                           17                        21
    Sales
                          Adjusted Net Sales                                                                       $747                     $830                      $845                         $196                      $249

                        Net Income (Per GAAP)                                                                        $17                     ($28)                     ($13)                          ($3)                       $2
                        Depreciation and Amortization                                                                 29                       30                        29                             7                         9
                        Interest Expense, net (1)                                                                      9                       43                        45                            12                         9
                        Tax Expense / (Benefit)                                                                      (16)                       2                         3                             0                         2
                          EBITDA                                                                                     $39                      $48                       $64                           $16                       $21
  EBITDA
                        Certain Non-Cash Adjustments (2)                                                              12                       17                        16                             1                         1
                        Acquisition and Integration (3)                                                                6                       11                         3                             1                         5
                                                                                                (4)
                        Business Transformation Initiatives                                                           13                        3                         5                             0                         2
                        Financing-Related Costs (5)                                                                    4                        1                         5                           -                           0
                          Adjusted EBITDA                                                                            $73                      $80                       $93                           $18                       $29

Note: Dollars in Millions.
1). Includes net interest expense related to third-party obligations and interest income on loans made to independent DSD operators to facilitate their purchase of delivery routes.
2). Accounting policy change, fair value adjustment to long-term incentive program, mark-to-market commodity adjustments, and asset impairment/write-offs.
3). Non-recurring professional fees and expenses, travel, and integration costs related to historical acquisitions.
4). Non-recurring and one-time costs (including consulting and professional fees) of business transformation initiatives related primarily to the RSP-IO conversion, Rice/Lissette family-related items, onboarding/severance for
certain administrative employees, and change in vacation policy.
5). Non-recurring financing costs and loss on extinguishment of debt.

           ℠                                                                                                                                                                                                                          39
Pro Forma Financials Reconciliation

                                                                                                                  Pro Forma Adjusted EBITDA Reconciliation
                                                                                                                Historicals              Projections        Historicals
                                                                                                    2017A         2018A       2019A     2020E     2021E   Q1'19A Q1'20A
                     Net Sales (GAAP)                                                                   $707        $772       $768      $927   $928       $178     $228
                     Pre-Acquisition Net Sales (1)                                                       -           -           97       -      -           26      -
   Net               Impact of 53rd Week                                                                 -           -          -         (17)   -          -        -
  Sales                Pro Forma Net Sales                                                              $707        $772       $866      $910   $928       $204     $228
                     Independent DSD Operator Discounts                                                   40          58         77        82     93         17        21
                       Pro Forma Adj. Net Sales                                                         $747        $830       $943      $992 $1,021       $222     $249

                     Adjusted EBITDA                                                                      $73        $80        $93      $124      $133     $18      $29
                     Pre-Acquisition EBITDA (1)                                                           -          -           10       -         -          3     -
                     Acquisition Synergies (2)                                                            -          -             7         5        1        2        2
EBITDA
                     Public Company Costs (3)                                                             -          -            (3)       (2)     -         (1)      (1)
                     Impact of Utz 53rd Week                                                              -          -          -           (3)     -       -        -
                       Pro Forma Adjusted EBITDA                                                          $73        $80       $108      $124      $134     $22      $30

Note: Dollars in Millions.
1). Includes Conagra Snacks and Kitchen Cooked pre-acquisition contribution.
2). Includes Conagra Snacks synergies in addition to synergies related to the acquisition of Kitchen Cooked.
3). Full year impact of anticipated incremental public company costs.

           ℠                                                                                                                                                              40
You can also read