Tanzania: 2020 Supply Chain Modeling - Forecasting Demand from 2020-2024 - Yale SOM Case ...
←
→
Page content transcription
If your browser does not render page correctly, please read the page content below

Tanzania: 2020 Supply Chain Modeling
Forecasting Demand from 2020–2024

  SEPTEMBER 2011
  This publication was produced for review by the U.S. Agency for International Development. It was prepared by the
  USAID | DELIVER PROJECT, Task Order 1.
Tanzania: 2020 Supply Chain
Modeling
Forecasting Demand from 2020–2024

The authors' views expressed in this publication do not necessarily reflect the views of the U.S. Agency for
International Development or the United States Government.

USAID | DELIVER PROJECT, Task Order 1
The USAID | DELIVER PROJECT, Task Order 1, is funded by the U.S. Agency for International
Development under contract no. GPO-I-01-06-00007-00,beginning September 29, 2006. Task Order 1 is
implemented by John Snow, Inc., in collaboration with PATH; Crown Agents Consultancy, Inc.; Abt
Associates; Fuel Logistics Group (Pty) Ltd.; UPS Supply Chain Solutions; The Manoff Group, Inc.; and 3i
Infotech. The project improves essential health commodity supply chains by strengthening logistics
management information systems, streamlining distribution systems, identifying financial resources for
procurement and supply chain operations, and enhancing forecasting and procurement planning. The project
also encourages policymakers and donors to support logistics as a critical factor in the overall success of their
health care mandates.

Recommended Citation
USAID | DELIVER PROJECT, Task Order 1. 2011. Tanzania: 2020 Supply Chain Modeling—Forecasting
Demand from 2020–2024. Arlington, Va.: USAID | DELIVER PROJECT, Task Order 1.

Abstract
In 2010, LLamasoft, Inc., with technical assistance from the USAID | DELIVER PROJECT, Task Order 1,
developed a modeling framework that could be used to forecast public health supply chain needs and to
enable policymakers to strengthen the logistics infrastructure when they are planning future needs.
To understand and analyze the current and future state (2020–2024) of supply chain requirements for
procuring and distributing essential medical commodities in Tanzania, after the pilot was applied in Kenya,
the model was applied for the second time in Tanzania. Any country, at any future time, can use the
developed methodology in this report.

Cover photo: Clients wait outside a health dispensary in Tanzania. 2009. USAID | DELIVER PROJECT.

USAID | DELIVER PROJECT
John Snow, Inc.
1616 Fort Myer Drive, 11th Floor
Arlington, VA 22209 USA
Phone: 703-528-7474
Fax: 703-528-7480
Email: askdeliver@jsi.com
Internet: deliver.jsi.com
Contents
Acronyms............................................................................................................................................................................. v
Acknowledgments ........................................................................................................................................................... vii
Executive Summary .......................................................................................................................................................... ix
Background.......................................................................................................................................................................... 1
  Project Objectives ........................................................................................................................................................ 1
  Modeling Framework................................................................................................................................................... 1
  Future State Scenario .................................................................................................................................................. 3
Methodology ....................................................................................................................................................................... 5
  Data Collection ............................................................................................................................................................. 5
  Tanzania Supply Chain Structure Background ....................................................................................................... 6
  Baseline and Future Projection Assumptions......................................................................................................... 8
  Quantification Analysis ................................................................................................................................................ 8
Key Findings ...................................................................................................................................................................... 11
  Current State Analysis...............................................................................................................................................11
  Future State Analysis..................................................................................................................................................14
  Health Model Scenarios ............................................................................................................................................19
Conclusion......................................................................................................................................................................... 23
Appendices
A. Resources Used for Material Requirements Model........................................................................................... 25
B. Prevalence and Treatment Rates ............................................................................................................................ 29
C. Composition of Medical Zones .............................................................................................................................. 49
D. Sources of Health Model Changes ......................................................................................................................... 53
Figures
   1. Visual Overview of the Interdependent Model Framework.......................................................................... 3
   2. Map of Tanzanian Medical Zones ......................................................................................................................... 7
   3. Current Network Structure in Tanzania .........................................................................................................11
   4. 2011 Optimized Direct Delivery .......................................................................................................................13
   5. 2011 Transportation Cost Comparison...........................................................................................................14
   6. Breakdown of Costs .............................................................................................................................................15
   7. Comparison of Transportation Costs ..............................................................................................................16
   8. 2020 Optimized Costs with Direct Delivery ..................................................................................................17
   9. Locations of Additional Hubs......................................................................................................................... …28

                                                                                                                                                                                    iii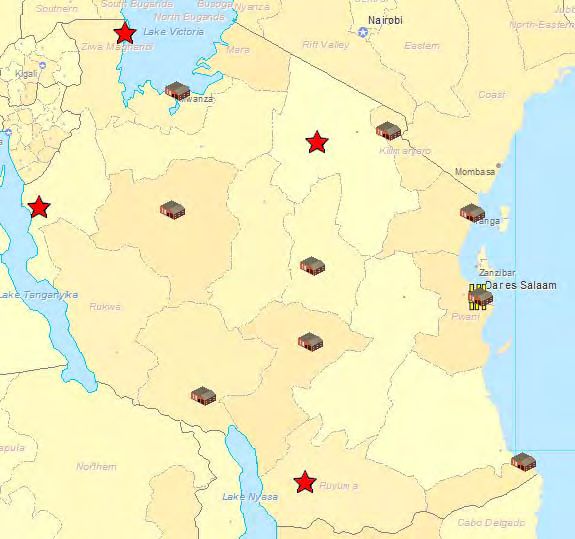
Tables
  1. Change in Cost Elements per Baseline .............................................................................................................15
  2. 2005-2050 Assumed Tanzania CPR Rates .......................................................................................................20
  3. Number of HIV+ Cases Averted .......................................................................................................................21

iv
Acronyms
3PL      third party logistics provider
CWH      Central Warehouse
DC       Distribution Center
GPS      global positioning system
QALY     quality-adjusted life year
RWH      Regional Warehouse
SSA      Sub-Saharan Africa
TSH      Tanzanian shilling
USD      United States dollar
AIDS     acquired immunodeficiency syndrome
ARV      antiretroviral (drug)
CPR      contraceptive prevalence rate
DALY     disability-adjusted life year
DMO      District Medical Officer
HIV      human immunodeficiency virus
IT       information technology
JSI      John Snow, Inc.
MDG      Millennium Development Goals
MOH      Ministry of Health
MSD      Medical Stores Department (of Tanzania)
MSH      Management Sciences for Health
ORS      oral rehydration solution
PEPFAR   U.S. President’s Emergency Plan for AIDS Relief
SDP      service delivery point
STI      sexually transmitted infection
TB       tuberculosis
UN       United Nations
USAID    U.S. Agency for International Development
WHO      World Health Organization

                                                           v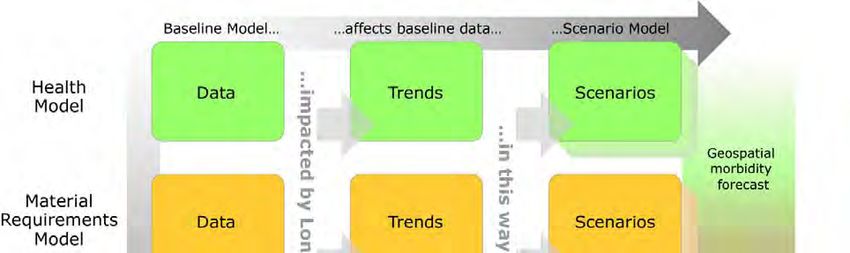
vi
Acknowledgments
The project team would like to thank the staff at John Snow, Inc. (JSI), for their guidance and
support, including the staff in the U.S. offices, as well as the JSI staff members working in the
country office in Tanzania. Without their help, this study would not have been possible. The team
would also like to thank the staff of the Medical Stores Department (MSD) of Tanzania for
providing us with most of the data used in this project. The U.S. Agency for International
Development (USAID) contracts funded the technical assistance, in-country projects, and research
that enabled the authors to produce this report.

                                                                                                    vii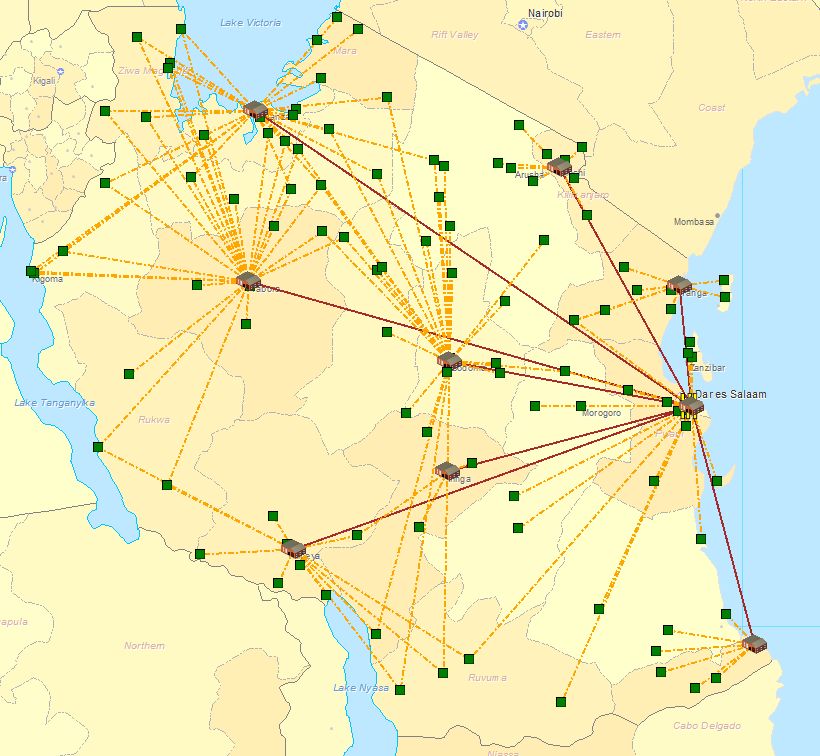
viii
Executive Summary
In the developing world, logistical shortcomings can seriously impact the quality of human
healthcare. Because of this, the USAID | DELIVER PROJECT partnered with LLamasoft, Inc., to
develop a reusable modeling framework that could be used to forecast developing countries’ future
public health supply chain needs. The model was designed to be robust and general; this ensured
that it could be applied to any country, for any future timeframe, and could give policymakers key
data to guide the effective design of their supply chain networks. In 2010, the framework was piloted
in Kenya for 2020–2024; the goal was to show how the modeling approach could help policymakers
accurately visualize and understand the most likely and possible situations they might face in 10
years. This report covers a similar application of the framework in Tanzania.
To accomplish the project objectives, the relationships between key public health variables were
modeled; including population, disease prevalence, and economic conditions; and the resulting
requirements for health supply material. The modeling framework included three separate, but
interlinked, models: (1) a Health Model for predicting the future location and quantity of treatable
health conditions of interest, (2) a Material Requirements Model for translating the project health
conditions into delivery needs for the supply system, and (3) a Supply Chain Model to generate
metrics of interest by modeling the pull and flow of generated material requirements through a
defined supply chain network.
During the time of the study, the medical delivery system in Tanzania was going through several
structural changes. Therefore, the timing of the analysis was crucial for Tanzania’s Medical Stores
Department (MSD)—they had to assess the supply chain network changes that needed to be made if
the changes were to be successfully implemented. At the request of the executive management team
at the MSD, several near-term (six months to one year) changes to the system were also analyzed.
This study focuses on the transportation challenges that the MSD will face, both in the near term
and long term, as a result of the implementation of the new system, Direct Delivery. The new
delivery system changes added the responsibility for last mile distribution to the MSDs list of
activities; previously, the health facilities completed this task.

From the study, the authors determined that the current delivery structure, based on administrative
boundaries, provided an ineffective customer-to-warehouse assignment. Health facilities were being
served by their assigned warehouses, or the warehouse that had the necessary capacity, instead of the
warehouse that was closer. When Direct Delivery was implemented, it was expected that a
significant portion of the costs would shift from the health facilities to the MSD; the results show
that by optimizing the customer-to-warehouse assignments, the MSD could reduce the
transportation costs 14–17 percent. The study also shows that even if supplies for various vertical
programs are still donated, they cannot be effectively delivered without significant investments in
warehousing and transportation assets. If the delivery of these products is mandated, other essential
health supplies will be rationed and this will negatively impact the general health of the population.
The main conclusion is that if the increased demand is not addressed, most of the public sector will
not be serviced, resulting in a loss of life. It is essential that stakeholders understand the importance
of investing in the supply chain network.

                                                                                                       ix
x
Background
Public health supply chains deliver essential medical commodities to underserved communities in
the developing world. Therefore, logistical weaknesses can seriously impact the quality of human
healthcare. In some cases, it can mean the difference between life and death. By strengthening the
existing supply chain systems, essential commodities are more availability to health care providers
and consumers, which results in improved health for communities in underserved areas. Today,
health needs have increased because of the world’s growing population and the changing disease
burden; it is imperative that public health systems ensure cost effective and reliable supply chains to
meet those demands.
The USAID | DELIVER PROJECT, in collaboration with LLamasoft, Inc., has undertaken the
2020 Supply Chain Modeling project as a way to develop a reusable framework to forecast
developing countries’ public health supply chain needs for the future. The 2020 model can be
applied quickly to any country, for any future timeframe. This will help policymakers accurately
visualize and understand the most likely and possible situations that they may face, and how to make
informed decisions about designing effective supply chains to meet those demands. In 2010, the
framework was piloted in Kenya for 2020–2024, with the goal of showing how the modeling
approach can be used to help policymakers accurately visualize and understand the most likely and
possible situations that may face them in 10 years. In 2011, the framework was applied for the
second time in Tanzania. This report explains the findings and results.

Project Objectives
The goal of this project was to predict future supply chain needs and performance metrics over five
years (2020–2024) in order to inform Tanzanian policymakers and to improve their long-term
strategic planning processes.
The three main objectives were—
1. To develop the three interlinked models by applying the previously created framework: a health
   model, a material requirements model, and a supply chain model.
2. To understand and analyze the current and future (2020–2024) supply chain requirements for
   procuring and distributing essential medical commodities in Tanzania by applying the health,
   material requirements, and supply chain models.
3. To determine the most pressing needs for revamping the supply chain network in Tanzania by
   applying multiple future state scenarios to the modeling framework.

Modeling Framework
The approach for this study used a modeling framework that comprised three separate, but
interlinked, models: (1) a Health Model for predicting the location and quantity of treatable health
conditions of interest in the future, (2) a Material Requirements Model for translating the health
conditions into delivery needs for the supply system, and (3) a Supply Chain Model that generates

                                                                                                          1
metrics of interest by modeling the pull and flow of generated material requirements through a defined supply chain network. To forecast the essential health commodities, we analyzed the relationships between the three interdependent models. Health Model In response to the United Nation’s Millennium Development Goals (MDGs) 4, 5, and 6 (child health, maternal health, and combat HIV and AIDS, respectively), the conditions emphasized the health model that included reducing child mortality; improving maternal health; and combating HIV and AIDS, malaria, and other serious diseases, with the longest-term detrimental effects on human lifetime potential. Conditions modeled for reducing child mortality included measles, vitamin A deficiency, diarrhea, worms, and respiratory infections. Sexually transmitted infection (STI) prevalence, maternal mortality, pregnancy, and birth rates were modeled for the MDG 5: to improve maternal health. HIV and AIDS, malaria, tuberculosis, and leprosy were included for MDG 6 because these very serious diseases can result in severe illness or death. In addition to conditions within the MDGs, selected lifestyle diseases—cardiovascular diseases, hypertension, diabetes, and asthma—were included in the health model. Health professionals anticipate higher prevalence rates of these lifestyle diseases in developing countries during the coming years. The World Health Organization (WHO) Global Burden of Disease work was also reviewed; the Pareto principle, or 80- 20 rule, was applied to this data. Most of the emphasis was placed on keeping diseases that represent the 20 percent of diseases in the model because they cause 80 percent of disability-adjusted life years (DALY) and mortalities for the MDG region of sub-Saharan Africa. Prevalence rates were obtained for each of the conditions described above and, when possible, were grouped by age and administrative region. Additionally, geocoded population data for Tanzania was collected at the district level. As the main components of the health model, the prevalence rates and population data were used to determine the number of people who need treatment for these conditions and diseases and how to distribute the treatment across Tanzania. Material Requirements Model The materials for the material requirements model focus on key pharmaceuticals needed to treat a person with one of the in-scope conditions. In addition to medicines required to treat conditions— diagnostic and preventive commodities like HIV and malaria test kits, bed nets, vaccine packages, family planning commodities, and mother-child health related items—were also included. Another component of the material requirements model is treatment rates for each disease; not everyone who suffers from a disease receives treatment; this must be considered when determining the overall material needs for a country. An additional bundle of essential medicines would be required to cover other disease and conditions not specifically identified. For each of the health commodities included, the price, quantity, weight, and volume were used as characteristic definitions. Supply Chain Model The Supply Chain Model was defined by the following parameters: supply chain financials (warehouse operating, administrative, labor, and transportation); and supply chain configuration (warehouse location, available warehouse space, and capacity). The network was modeled at an aggregated district level based on demand-driven flows of the material needs; they used the material requirements model explained above. 2
Using this approach, the observed trends for any of the three models of the framework can easily be
incorporated to create different scenarios and to compare the overall effects on the supply chain
model outputs. The framework, illustrated in figure 1, shows that considering observed or expected
trends of a country’s health state. can be used to determine supply chain recommendations.

Figure 1. Visual Overview of the Interdependent Model Framework

Future State Scenario
In this study, two main questions were considered for future state analyses. First, the added strain on
the supply chain network from increased volume is considered. The increased volume is determined
using population growth, and disease prevalence and treatment rate trends. Another major
component is the effect that the newly mandated system of direct delivery will have on the system’s
access and financials. Finally, several health model scenarios that aim to observe the effect of
changing health interventions on the supply chain were also analyzed.

                                                                                                      3
4
Methodology
The project team first collected the required data during a two-week in-country trip; including as
inputs the Health, Material Requirements, and Supply Chain Models that, together, make up the
modeling framework. The team then determined the necessary assumptions for both the baseline
and future state scenarios. Next, Supply Chain Guru, LLamasoft’s flagship network optimization
and analysis tool, was used to determine the key supply chain, service, and financial metrics for the
baseline and for future state supply chain scenarios. Finally, the results were analyzed and
summarized.
Data Collection
The following data was collected on-site in Tanzania; it was used for the Health Model, Material
Requirements Model, and Supply Chain Model.
Health Model
Census data for 2002 and projections for 2010–2030, available from the Tanzania National Bureau
of Statistics, were used to predict the expected Tanzanian population for 2020–2024. The census
data is available down to the district level (for 126 districts); it is divided by gender and age.
The prevalence rates for the in-scope conditions came from the Tanzania Ministry of Health, WHO,
and the President’s Emergency Plan for AIDS Relief (PEPFAR) reports; peer-reviewed publications;
and conference abstracts. See appendix B for the prevalence and treatment rates, by disease.
Material Requirements Model
To determine a country’s health supply needs, the Material Requirements Model compiles all the
information needed from its health model. This entails gathering data on what treatment a person
with an in-scope condition should receive, as required by age and gender. See appendix A for some
of the main resources used in this model.
The total material needs of a country were then calculated based on the Health Model and the
treatments from the material requirements model. The treatment rates were applied to predict the
total forecasted demand.
Supply Chain Model
The Medical Stores Department (MSD) operates the Tanzanian public health supply chain, an
autonomous department of the Ministry of Health (MOH), which was formed by an act of
Parliament in 1993. The MSD is headquartered in Dar es Salaam with the central warehouse, which
is as the main storage and primary entry point for public health commodities. The country is further
divided into nine medical zones, each with its own warehouse, and referred to as the zonal
warehouse. The following section, Tanzania Supply Chain Background explains the structure of the
network and distribution system.
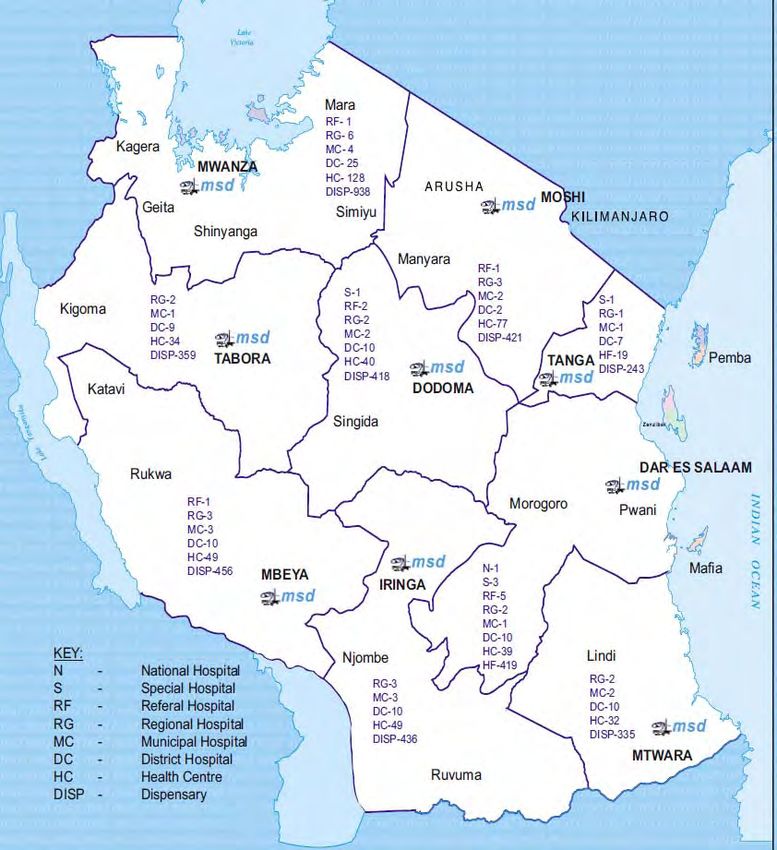
5To build the Tanzania supply chain model, the team gathered the following data elements. First, the team obtained latitude and longitude values for the district capitals and used this information to calculate distance for the distribution of medical supplies, based on population (using the population data gathered in the health model). Next, we determined the volume and weight for one package of each commodity in the material requirements model, and the commodity cost. This information came mainly from the International Drug Price Indicator Guide (Management Sciences for Health [MSH] 2008), the Logistics Fact Sheet: Antiretrovirals [ARVs] (from John Snow, Inc. [JSI]), or the Logistics Fact Sheet: HIV Test Kits (from JSI). The MSD provided the historical shipment data for 2010–2011, which detailed the amount and value of commodities shipped out of the central warehouse, by date. This data was used to (1) create an additional commodity in the supply chain model, which represents the other essential medicines that are not yet specifically modeled as part of the disease and program specific commodities identified in the material requirements model; and (2) validate the requirements model against the anecdotal 2011 average fill-rate of orders (approximately 60). Additionally, the MSD provided an itemized budget for the overall operations in 2010–2011, including administrative, transportation, and operational costs. The MSD annualized budget was used to (1) determine transportation costs from the central warehouse to the zonal warehouses, per cubic meter, per kilometer; (2) calculate the cost to operate a square foot of warehouse space; and (3) determine the average handling cost for each unit of product flowing through a warehouse. In addition to the overall budget, MSD provided an estimated budget for the anticipated transportation costs under the new delivery plan. This was used to estimate the last mile delivery costs, per unit, per kilometer, within each of the nine medical zones. The historical shipment and itemized budget were used to calibrate and validate the model that was built for 2011; it is the baseline used to compare the results for the 2020–2024 future state models. Tanzania Supply Chain Structure Background Before we can discuss the results from the supply chain models, it is important to understand the current structure of the supply chain network, as well as the proposed changes. Tanzania has 26 regions and 126 districts. As mentioned earlier, the country is divided into nine medical zones, with each zone having one to five regions. See appendix C for a list of the medical zones and the corresponding regions and districts in those zones. Figure 2 displays the breakdown of the nine medical zones and also shows the locations of the zonal warehouses (marked as msd). 6
Figure 2. Tanzanian Medical Zones

Historically, the MSD has been responsible for delivering products from the central warehouse in
Dar es Salaam to the nine zones; and, subsequently, from the zones to all the districts. Each district
has a District Medical Officer (DMO) who is responsible for storing the goods. Larger hospitals and
smaller health facilities then arrange to pick up the commodities from the DMO. Over the years, it
was noted that many of the lower-level health facilities, including the health centers and dispensaries,
did not have adequate supply of the needed products. Without the funding to transport the goods
from the DMO to their facilities, these health facilities faced a significant shortage of goods, and
many patients were denied crucial treatments.
Because of these issues of access to care, the government mandated a new delivery system—Direct
Delivery. Under this system, the MSD would be responsible for the final delivery of goods to the
health centers and dispensaries. Hospitals would continue to transport their goods from the zonal
warehouse, but lower-level health facilities would no longer pay the transportation costs. Although it
is expensive to implement, the primary goal of this program is to ensure patient care through the
public health system—that patients receive the health commodities they need, in a reasonable
amount of time.
At the time this analysis was done, the MSD was implementing the direct delivery system. Because
the MSD was drastically changing the way it normally operates, this became the focal point of the
analysis.

                                                                                                       7
Baseline and Future Projection Assumptions
General Assumptions
The following assumptions were made across the modeling framework:
The exchange rate for the Tanzanian shilling to the U.S. dollar was 1,500: 1; which was an
approximated average exchange rate during FY2010–2011.
There is no inflation, so the monetary values reported in the model reflect constant prices.
Health Model Assumptions
The following assumptions were made across the Health Model framework:
Population growth rate is equal for all districts.
The breakdown of population by gender and age group is constant across districts.
Material Requirements Model Assumptions
The following assumptions were made across the Requirements Model framework:
The treatments by condition are summarized in appendix B.
The treatments (number of tablets/vials of medicine per person, per year) are the same between
the baseline and 2020–2024, except that a new vaccine package, which is bulkier and more
expensive, will be used for 2020–2024.
Without a quantitative analysis, the current fill rate is set at 60 percent, based on interviews with
MSD personnel.
Based on interviews with members of the MOH, approximately 60 percent of the health
facilities (including lower level and hospitals) are public.
Supply Chain Model Assumptions
The following assumptions were made across the Supply Chain Model framework:
The operating costs for the warehouses relate directly to the volume of the warehouse, which
was calculated on area and number of pallet positions.
The operating cost per square foot, determined using the calculation above, is applied to the
warehouses in the future, from 2020–2024.
The derived transportation cost from the central warehouse to the zonal warehouse is the same
per unit, per distance, cost for all zones.
The currently estimated last mile costs are also used in the future state scenarios; economies of
scale were not considered.
Quantification Analysis
First, with LLamasoft’s Supply Chain Guru, the modeling framework was used to generate a baseline
set of metrics, given current conditions and the most likely expected trends based on current
8trajectories. The baseline was used to analyze how the system is currently operating. As a first step, it
is important to confirm that the model can reproduce current conditions; the future state scenarios
can then be run with confidence.
Next, a range of possible future state supply chain metrics were forecasted using a variety of possible
conditions, with key variables adjusted and relationships tested. In Tanzania, because the main
question was the move from the current state to the direct delivery system, total transportation costs
are the highlighted metric in all the scenarios. The transportation cost included items such as fuel,
repair and maintenance of vehicles, per diem payments to the drivers, boat rentals, and
administrative costs associated with transportation. Another cost element in the analysis of the
various scenarios was the total fixed operating costs for the warehouses. The costs input come from
the utilities, personnel, training, and general office costs listed in the annual budget.
As mentioned previously, the current fill rate at the MSD is approximately 60 percent. All scenarios
display results for this 60 percent fill rate, including a situation when the fill rate is almost 100
percent. Therefore, the change in cost is analyzed, comparing costs between the current system to a
system where the MSD satisfies all the needs of the public sector in Tanzania.
910
Key Findings
Current State Analysis
Baseline Analysis
The first step in any modeling exercise is to set a benchmark for the software and verify that the tool
can reproduce the known data. This model is the comparison point for all other scenarios. In the
baseline for Tanzania, the products flow from the central warehouse to the zonal warehouses. From
there, the DMOs are the final destination (one for each of the 126 districts). Districts receive
product only from their assigned zonal warehouse. This model, and all that follow are modeled to
represent the MSD’s activities, not necessarily the actual flow of the product down to consumption.
Thus, in the baseline, the products are only delivered to the districts.
Figure 3 depicts the current network structure in Tanzania. The central warehouse is located in Dar
es Salaam; it is shown as a yellow structure. The solid maroon lines represent the product flow from
the central warehouse to the zones, and the dashed yellow lines represent the flow out of the zonal
warehouses to the districts. All the following scenarios will be represented in the same way, except
the yellow dashed line represents the delivery from zonal to the service delivery point (SDP), in a
given district. As seen by the greater number of districts, most of the Tanzanian population focuses
around Lake Victoria in the north, and the northern and northeastern parts of the country.

Figure 3. Current Network Structure in Tanzania

                                                                                                    11
The transportation cost under the baseline, with no direct delivery, was just under $3 million. The baseline shows that, although it appears to be a sufficient amount of warehousing space, the space is not in the areas where it is needed. Therefore, several facilities were under-used, while the zonal warehouses in Mwanza, Mbeya, and Moshi were over-used. This result is consistent from interviews with the MSD personnel that several warehouses were full and that goods were often stored in alternate warehouses (farther from the SDP). Often, these alternate sources were leased warehouse spaces that were very costly to operate. Because the MSD knew about the issue, plans are in place to expand several warehouses, which were considered for all the scenarios run for 2020–2024. Six-Month Plan: Phase I of Direct Delivery Implementation The first phase in the implementation of direct delivery is to roll out the program to nine regions: one region in each zone. In this scenario, for all the districts that are part of the selected nine regions, the product flow is modeled down to the SDP. This considers the additional cost of transportation to move the products from the DMO to the SDPs. Because this model does not physically show the SDP, the resulting map is identical to figure 3. In addition, the capacity issues observed in the baseline were the same because neither the volume of the product flow, nor the warehouse capacities, changed. However, the baseline costs are not identical. Under this scenario, the transportation costs are just under $8 million. Based on the cost estimates that we received from the MSD, this number is almost twice the amount that the MSD expected. It should be noted that this is not a strict cost increase, because the additional $5 million is the cost for a task that the MSD previously conducted. Thus, the cost increase represents the cost transferred from the thousands of small health centers and dispensaries to the MSD. One-Year+ Plan: Full Roll-Out of Direct Delivery In this scenario, the full roll-out of the direct delivery plan is modeled. Therefore, the MSD is responsible for transporting all the products from the central warehouse to the more than 6,000 SDPs. Similar to the six-month plan, the map depiction and capacity constraints are the same. The transportation costs under this scenario increases to nearly $11 million. In particular, several regions and customers are very expensive to serve because they are located far from their assigned zonal warehouse. Optimized Direct Delivery As mentioned earlier, each of the nine medical zones include several regions; they were created based on administrative boundaries. The zones were not created based on a quantitative analysis of the population’s medical needs. Thus, several customers are forced to receive supplies (source) from a zonal warehouse that is either too far away or is struggling with capacity issues. In this scenario, the customers are not required to source from their assigned zones, but they will be served at the lowest cost. This means that if the nearest facility is at capacity, they will be served by the next closest warehouse with product in stock. However, the decision is not based solely on product availability, but also on the cost of transportation from that warehouse. As mentioned earlier, for each of the nine zones, the MSD estimated the transportation costs for the last mile delivery under the direct delivery plan. Depending on the terrain (flat land versus mountainous region), the costs vary widely across zones. 12
Figure 4 shows the optimized network with updated assignments. Under this scenario, there was a
17 percent reduction in the transportation cost, compared to the previous scenario, which had the
complete roll-out of direct delivery under the current zonal system. Due to the removal of the zone-
customer constraint, the capacity constraints are not an issue and no warehouse is over capacity. The
figure shows that the number of districts served by several of the warehouses is reduced, because (1)
several of the warehouses were much smaller and were at capacity, and (2) some regions were much
more expensive to serve than others. For instance, the Moshi zonal warehouse (top right, serving
significantly fewer customers than before) is an example of both conditions. Under all scenarios with
the current zonal assignments, this warehouse was always over-capacity. Also, it is located in a very
mountainous region and the last mile transportation in this area is usually very expensive.

Figure 4. Optimized Direct Delivery, 2011

Note that the drastic increases in transportation costs are not true increases, but are an additional
cost. Figure 5 illustrates the transportation costs of the baseline and the three scenarios discussed
thus far. The current MSD budget estimated for direct delivery is almost half the amount that the
model predicts it will cost. However, the budget estimates for each region are best guesses of the
actual costs; because, previously, the MSD has not been in charge of last mile delivery. It is possible
that several of the cost figures are inflated; significant cost savings may be seen in last mile delivery if
optimal transportation routes are used and third party logistics providers (3PLs) are hired.

                                                                                                         13
Figure 5. Transportation Cost Comparison, 2011 To decrease costs while improving the supply of much needed medical products, several changes could be made to the supply chain network. The analysis clearly shows attention should be paid to the location of the demand, particularly the health needs of the population. Some analysis and attention is already being placed on increasing warehouse capacities in certain zones. The models for the future state (2020 on) consider this planned increase in capacity. When adding capacity in new locations, careful thought should be given to the optimal location for those new facilities. And last, it is clear (both visually and quantitatively) that several districts could benefit from being served by zonal warehouses where they are not currently assigned. Future State Analysis The following scenarios analyze the future state, 2020–2024, and the effects that the changes in health and requirements models will have on the supply chain. With the MSD’s current challenge of implementing direct delivery, the analysis of the supply chain model focuses largely on this aspect. Network Structure Remains the Same In this scenario, we analyzed the situation when the MSD does not implement direct delivery and keeps the same network structure. Thus, the central warehouse and nine zonal warehouses would still be in place and the MSD would not incur the cost of distributing the goods to the last mile. The expansion plans for the warehouses are considered. Therefore, this scenario compares the true increase in costs to the supply chain network from the increasing medical needs of the growing population. Within this scenario, we analyzed the current fill rate of 60 percent and a fill rate of nearly 100 percent. Table 1 shows the percentage increase in the various cost elements, while figure 6 shows the breakdown of costs and the increase in costs from the 60 percent fill rate to 100 percent. 14
Table 1. Change in Cost Elements per Baseline

                 2011 Baseline       2020 at 60%         % Change     2020 at ~             % Change
                                     Fill Rate                        100% Fill
                                                                      Rate
Warehousing      $14,348,000         $ 16,130,042        12%          $ 23,658,098          65%
Cost

Transportation   $ 2,954,087         $ 7,536,118         155%         $ 12,509,956          323%
Cost

Figure 6. Breakdown of Costs

  $40,000,000

  $35,000,000

  $30,000,000

  $25,000,000

  $20,000,000                                                         Transportation Cost
  $15,000,000                                                         Fixed Warehousing Cost

  $10,000,000

    $5,000,000

           $‐
                      2011        2020 (60% Fill    2020 (100% Fill
                                     Rate)              Rate)

To continue to serve the people of Tanzania, significant investments will be needed during the next
decade, even without the additional burden of last mile delivery. It should also be noted that for the
scenario with an almost 100 percent fill rate, the planned expansions for warehouse capacities would
not be sufficient. An additional 35,000 square feet of efficient warehousing space will be needed if
the MSD’s goal is to serve all the public sector and to ensure that the needs of not only the health
facilities (health centers and dispensaries), but also public hospitals, are met in full.

Continued Plan for Direct Delivery
The next set of scenarios analyze the effect on the supply chain, and the resulting changes needed if,
in a decade, the direct delivery plan is still in place. As we’ve seen from the previous future state
scenarios, the population growth, increased treatment rates, and improved service goals would result
in significant upgrades and investments to the supply chain network even if the MSD was not
responsible for the additional costs of last mile delivery. Because the direct delivery plan is already
underway, the following future state scenarios (2020–2024) examined the effect of restructuring the
current network structure to account for the additional demand flowing through the system and the
added last mile delivery. In the scenarios, we analyzed fulfilling 60 percent or 100 percent of the
public sector needs.

                                                                                                       15
Optimized Direct Delivery Using the 60 percent fill rate, we did an analysis similar to the one with the 2011 data to see the benefits if the customer-zone assignments were changed. The transportation costs for direct delivery with the current zonal structure is slightly more than $26 million. However, after the network was optimized to allow customers to be served by the most economical zonal assignment, the transportation costs dropped to under $23 million. Thus, changes to capacities and zonal assignments could result in a 14 percent reduction in transportation costs alone. Figure 7 shows the jump in costs from moving to direct delivery and the increasing costs of direct delivery in the future state, plus the benefits of an optimized network. Figure 7. Comparison of Transportation Costs As shown in figure 8, the costs incurred under the direct delivery system in 2020 are drastically higher if the MSD had a near-perfect fill rate. The total cost shown in the figure includes the transportation cost, fixed warehousing costs, and some of the handling costs. It should be noted, that the scenario with the near-perfect fill rate analyzed the fixed operating costs of the warehouses and the transportation costs from the additional product flow. However, the task of reaching a near- perfect fill rate is difficult, and it will require other investments in the information technology (IT) systems and administrative processes. 16
Figure 8. Optimized Costs with Direct Delivery, 2020
$70,000,000.00
$60,000,000.00
$50,000,000.00
$40,000,000.00
60% Fill Rate
$30,000,000.00 Nearly 100% Fill Rate
$20,000,000.00
$10,000,000.00
$0.00
Total Cost Transportation Cost
As noted in a previous future state scenario, with an improved fill rate, the increased cost in
transportation (not including direct delivery costs) was $12.5 million. At the same fill rate, under the
direct delivery plan, the transportation cost increases to $38.5 million. Thus, the difference of $26
million would be required for the last mile distribution. This cost would have been distributed
among the health facilities, but now the MSD would need to budget the additional amount.
Prioritization of Third Party Logistics Provider Use in Zones and
Regions
As mentioned earlier, the costs used in this model for the last mile delivery as part of the direct
delivery plan are preliminary estimates from the MSD. At this time, the MSD does not use the
services of a 3PL, but when they move to direct delivery, they may need the local 3PLs services; they
may find that using a 3PL will add cost savings.
Several different ways can be used to prioritize the order when looking for 3PL assistance in direct
delivery. First, the zones and regions with the highest volume could benefit from the efficiencies in
transportation that a 3PL can provide. Mwanza is the medical zone with the most volume—it is the
most populous zone and the MSD serves nearly 25 percent of this zones population. Mwanza is
followed by the medical zones of Dar es Salaam and Dodoma, also very populous regions. Large
urban areas and cities in these areas increase the likelihood of a local established 3PL industry. The
regions with the highest volume were Tanga (which belongs to a one-region zone), followed by
Mwanza and Shinyanga, both belonging to Mwanza.
The second way to prioritize the roll-out of 3PL partners is to look at the areas that cost the most to
serve. They may be in regions that are difficult to get to, or are farther away from the MSD zonal
stores. In these cases, although the larger-scale 3PL providers may not be present, different modes
of outsourced transportation could be of value. Mbeya is the most expensive medical zone to serve,
followed by Mtwara and Mwanza. The most expensive regions to serve include Ruvuma (which does
not have a zonal warehouse nearby), followed by Kigoma and Rukwa.
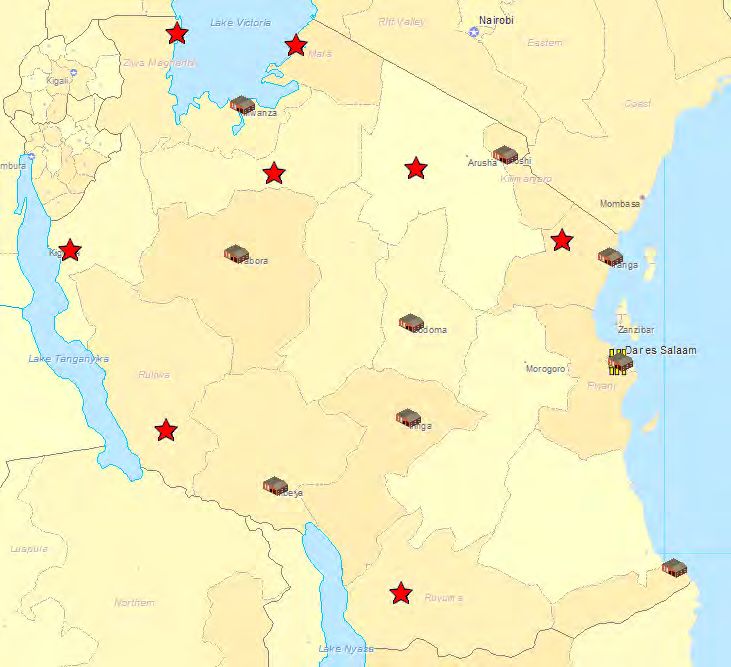
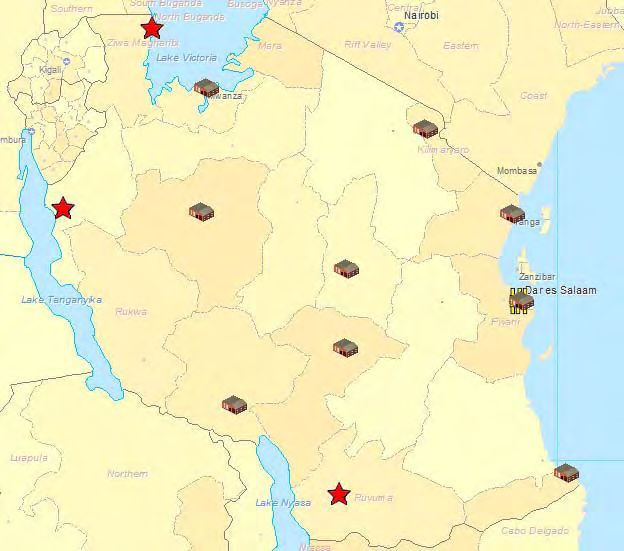
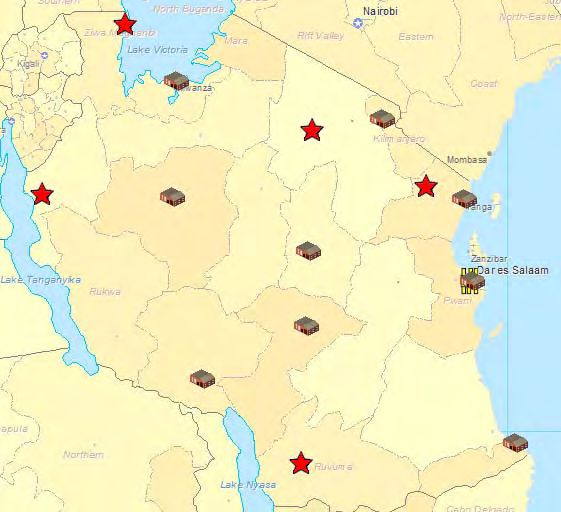
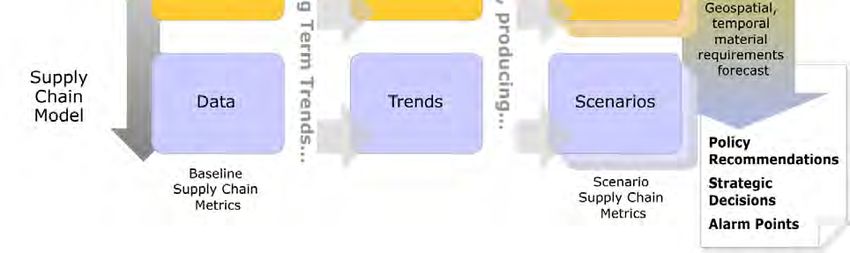
17A combined analysis of the two results will aid in arriving at a better solution. For instance, although the Dar es Salaam medical zone has a high volume, it is the cheapest to serve because the central warehouse is co-located with the Dar es Salaam zonal warehouse. Optimal Locations for Additional Hubs To assist with the task of direct delivery, the MSD is analyzing the need for additional hubs across the country. These hubs would be smaller warehouses that would function similar to a cross-dock. Based on the demand distribution (which is a function of population) and the current location of the zonal warehouses, an analysis was done to identify the best locations to add hubs. The following figures (figure 9 A–F) show the optimal location of the hubs (marked by red stars) in places where the MSD wants to add three to eight additional hubs. Figure 9. Proposed Locations for Additional Hubs A B C D 18
E                                                       F

The next step in this analysis, which was not a part of the current analysis, is to assess the costs of
adding and maintaining the hubs, with the resulting benefit of lowered transportation costs and
increased access to products. This would help identify the optimal number of hubs to add, after
which the benefits seen as part of lowered transportation costs and service levels would be
outweighed by the costs of operating these facilities.

Health Model Scenarios
All the scenarios discussed to this point have focused on the structural changes that the MSD must
face in the near- and long-term. Significant changes to various disease characteristics over the next
decade are likely, as well. While the changing prevalence rates and improved treatment rates were
already considered in the future state analysis, several other possible changes can be anticipated. A
select few changes are addressed in the following scenarios. It should also be noted that some of the
anticipated changes—a reduction in malaria prevalence by 50 percent by 2020 due to the increased
use of bed nets; and the increase in lifestyle diseases, such as diabetes and hypertension—have
already been included in the future state models. See appendix D for more information on the
sources for the following scenarios.

Introduction of a Rotavirus Vaccine
The rotavirus is known to cause about 40 percent of all hospitalizations for diarrhea in children
under the age of five. The Rotarix vaccine was found to be 78 percent efficacious against the
rotavirus. Introducing the Rotarix vaccine would result in a 78 percent decrease in 40 percent of the
childhood diarrhea cases. This scenario analyzes the change in costs as a result of this link between
the vaccine and the prevalence rate. For the scenario, we assumed that the Rotarix vaccine is already
considered under the vaccine bundle that has been modeled. Additional costs for procuring this
vaccine, or the cold chain storage, were not considered.
The decrease in the prevalence of childhood diarrhea after the vaccine was introduced resulted in 3
percent lower overall costs. The transportation costs were reduced by 4 percent, accounting for the
fewer products needed to treat diarrhea. Since the procurement and potential cold chain costs are
not explicitly taken into account in this scenario, the introduction in the Rotarix vaccine may prove

                                                                                                          19
to be more expensive from a supply chain perspective but, of equal importance, it could be a life-
saving intervention.
Effects of Increasing the Contraceptive Prevalence Rate
Family planning is a significant unmet demand in Africa. The Futures Group studied the impact of
population growth if all unmet needs for family planning were satisfied. Results from the study
showed that if contraceptive prevalence rates (CPR) increased at an reasonably optimistic rate from
2005 to 2050, the United Nation’s (UN) medium population estimates would not be impacted
during the modeling period, “because of the dynamics of population momentum, the unmet need
scenario’s population projection approximates the UN medium projection." Therefore, for this
scenario, we did not model an increase in population; however, the increase in CPR requirements
showed an impact on the supply chain.
We used the CPR projections from the report to model this scenario. We assumed that the
proportion of contraceptives projected would remain the same. See table 2 for the CPR.
Table 2. Assumed Tanzania Contraceptive Procurement Rates, 2005–2050
2005 2010 2015 2020 2025 2030 2035 2040 2045 2050
Tanzania CPR 22.5 26.86 31.22 35.58 39.94 44.3 48.66 53.02 57.38 61.74
If the system has a limited capacity, the model is set up to prioritize products related to certain
disease conditions. Each treatment category is assigned three values: critical fraction, standard
fraction, and non-critical fraction. The critical fraction is the fraction of the total demand for the
category that is of the highest importance to satisfy; while the standard and non-critical fractions
refer to the portion of the demand that are of average and low importance, respectively. For
instance, 70 percent of all malaria, tuberculosis (TB), and HIV drugs were assigned the highest
priority, compared to 50 percent of all family planning and maternal health products, which had the
highest priority. For several other treatment categories (such as hypertension, diabetes, and others),
only 30 percent of the total demand is considered to be of the highest importance.
For this scenario, remembering the goals to improve the CPR, the critical ratio for family planning
increased to 70 percent, placing it in the highest priority group with malaria, TB, and HIV. Without
the additional throughput at the system, the prioritization of the family planning products comes at
the expense of other commodities. Although, in reality, eliminating a commodity should be a
carefully deliberated decision—the model based the selection on the given parameters. To
accommodate the additional units of demand, the product titled, Other Essential Medicines and oral
rehydration solution (ORS) was negatively affected. This bundle of medicines was required to cover
disease conditions that were not specifically modeled. However, this bundle contains several
important antibiotics, as well as male and female sterilization products that would affect the family
planning initiative.
Several customers did not receive their share of the other essential medicines product or ORS. With
an increase in volume, the capacity constraints of the system forced the rationing of products and
allowed products that were considered more important. In other instances, this shortage of the lower
priority products was more drastic. The situation would probably be the same in this case. One
explanation might be that the volume of the other essential medicines bundle was underestimated
because the MSD carries a wide range of products. Therefore, if the priority of a particular vertical
20program is increased, without considering the strain it would place on the logistics system, there
would be adverse effects on primary care.
Effects of Changes in Male Circumcision Rates on HIV Prevalence
Some evidence relates increased male circumcision rates to a reduction in the prevalence of HIV in
both males and females. A USAID Health Policy Initiative stated that increasing the male
circumcision rate to 80 percent would decrease in HIV+ cases in the long term. While the significant
effects of the circumcision would be observed until about 2030 on, table 3 shows the number of
HIV-positive cases averted during specific years.
Table 3. Number of HIV+ Cases Averted
Year 2020 2021 2022 2023 2024
Cases 18,700 20,000 21,200 22,400 23,600
For this scenario, we analyzed two sub-scenarios: (1) a disposable male circumcision kit, and (2) a
reusable kit. For each of the sub-scenarios, the additional product (the circumcision kit) was
modeled. The number of HIV cases averted was low compared to the total number of cases
expected during those years, slightly decreasing the volume of products in the supply chain. The
decrease in volume was found for 20 percent of products in the supply chain, all of which were HIV
related products.
Because fewer of the reusable kits are needed, the increase in the volume of products from the kits
was less than the decrease in the volume of HIV products no longer needed. Thus, the overall costs
were reduced by 2 percent and the transportation costs by 1 percent. However, note that the
reusable kits require stringent sterilization, which could add to the cost. The addition of the
disposable kits increased the overall costs and transportation costs by less than 1 percent.
Even with the relatively small effects on new HIV positive cases during 2020–2025, the added male
circumcision campaign will not significantly increase long-term costs. When the large number of
cases averted in later years is considered, this would be a beneficial campaign with measurable
benefits for the population and the health system.
2122
Conclusion
The goal of this project was to show how the repeatable modeling approach can be used a second
time to help policymakers accurately visualize and understand the most likely and possible situations
facing them in a 10-year period. Multiple future state scenarios were conducted to demonstrate the
various ways a supply chain network could be restructured to accommodate additional demand and
increase service levels. However, this is only one list that shows the different variables that can be
assessed.
The results from the current state and the future state analysis for the supply chain structure show
that, while the MSD is expected to be responsible for the costs of direct delivery, substantial
improvements can be made using quantitative analysis—for example, increased service levels and
decreased costs. Thus, the inefficiencies in the current structure of the supply chain network should
be closely analyzed.
All the scenarios show that, to make any improvements, significant investments must be made to the
supply chain network. To improve the access to care in rural areas, the transportation must be
improved. To prioritize and focus on a particular vertical program, additional resources are needed.
If not, other essential medical supplies will be rationed, and health outcomes will not improve. Most
important, the MSD needs to meet its expectations (go from a 60 percent fill rate to a 100 percent
fill rate), and the budget allocated for operations, especially transportation, must significantly
increase.
With the information already collected for Tanzania, several opportunities are still available.
Additional scenarios can be analyzed to determine relevant and timely results—for example, the
optimal number and composition of medical zones. Also, as the direct delivery program continues
to be implemented, a more detailed transportation analysis can be conducted, which could include a
more extensive analysis for selecting regions for 3PL partners and for analyzing the optimal
assignments and routes for delivery. However, one key lesson learned from this activity and others is
that the support and commitment from all the key stakeholders is crucial to the success of the
project. With that in place, to provide relevant and timely recommendations, these activities should
be done before a significant decision is made for investments and changes to the medical supply
chain.

                                                                                                    23
You can also read