2020 Community Health Needs Assessment - (CHNA) Mon Health Medical Center Morgantown, WV
←
→
Page content transcription
If your browser does not render page correctly, please read the page content below
Mon Health Medical Center

2020 Community
Health Needs Assessment
(CHNA)
Morgantown, WV
Prepared by Thomas Bias, Christiaan Abildso, and Emily Sarkees
West Virginia University Health Research Center
May 8, 2020
Contents
Background and Introduction                               2
About Mon Health Medical Center                           3
Previous CHNA Findings                                    3
Definition of the Community Served & Secondary Data       3
Methodology and Community Input Process                   6
Primary Methods of Collecting and Analyzing Information   7
Community Health Needs Prioritization                     9
Conclusion                                                12
Appendices                                                13

List of Tables
Table 1 Select Demographic Data                           6
Table 2 Community Health Concerns Survey Results          9
Table 3 Access to Health Care and Medical Needs           10

                                                           2
Background and Introduction
Provisions in the Affordable Care Act (ACA) of 2010 require tax-exempt (non-profit) hospitals to
conduct a Community Health Needs Assessment (CHNA) and develop an Implementation Plan
at least every three years. The regulations for the CHNA include defining the hospital’s service
area and compiling demographics and analysis of health indicators; taking into account input
from the community, including public health professionals; identifying resources; and
prioritizing community health needs.
The 2020 Mon Health Medical Center CHNA incorporates the requirements described above
and identifies the following prioritized needs:
1. Cancer
2. Substance Use & Abuse
3. Mental Health
4. Obesity
In addition to the requirement to conduct a CHNA, hospital leadership expressed the desire to
go beyond regulatory requirements in serving patients and the community as a whole, as well
as to build upon work done in previous cycles and by other local partners wherever applicable.
To facilitate this goal, Mon Health Medical Center (MHMC) has partnered with West Virginia
University’s School of Public Health (WVU SPH) to complete this Needs Assessment. This
process was led by Dr. Tom Bias in the Health Research Center within the school. A CHNA
leadership team including hospital and community leadership was convened to inform and
guide the process.
This document serves as a roadmap for the Implementation Plan, which will be developed
during the months following the completion of the 2020 CHNA. The Implementation Plan will
specify activities developed by the hospital and collaborators, available resources, and
strategies for evaluation.
Since adoption of the previous CHNA in 2017, MHMC has entered into an agreement with the
Monongalia County Health Department and Ruby Memorial Hospital to complete a
collaborative, county-wide CHNA with the WVU SPH team. The three-fold collaboration involves
entities operating within varying tax years and CHNA cycles, requiring all three to work toward
a common timeline for joint data collection and reporting moving forward from this year. This
document is the final “individual” needs assessment conducted by MHMC, timed to serve as a
building block for the first collaborative Monongalia County CHNA in future.
3About the Hospital
Mon Health Medical Center opened in the early 1920s as Monongalia County Hospital. Creation
of this hospital was led by the volunteer Women’s Hospital Association and officially sanctioned
by the county government in 1923. At the time, it was located in a portion of the County Poor
House on what would later become Elmer Prince Drive, and moved locations once before being
dedicated in its current location in 1977.
MHMC has functioned as a non-profit hospital since 1943, and the current facility was one of
the first hospitals in the nation to be designed with a two-corridor system to facilitate greater
privacy and comfort for patients. Today, the 164-bed hospital offers a full range of clinical
services, owns and operates a number of physician practices, and is associated with Mon Health
Sleep Center, Mon Health Wound & Vein Center, The Village at Heritage Point, Mon Health
Equipment and Supplies, a Foundation and an Auxiliary. MHMC has a strong commitment to
providing personalized care and service to residents of North Central West Virginia,
Southwestern Pennsylvania, and the surrounding region.
Previous CHNA Findings
The most recent CHNA was adopted in 2017. Key stakeholder interviews were conducted in the
community - both internal and external to MHMC - and data collected by the WVU SPH was
reviewed by the 2017 CHNA team. This information was considered along with relevant federal,
state, and local data to determine the following priority health areas:
● Cardiopulmonary Disease and Smoking
● Obesity, Diabetes, and Inactivity
● Cancer
● Mental Health, Substance Abuse, and Addiction
Definition of the Community Served
To begin this cycle, as in previous cycles, MHMC defined their service area as the entire
geographic region of Monongalia County. This area is home to both Morgantown - a college
town with a population of about 31,000 residents - and much more rural communities with
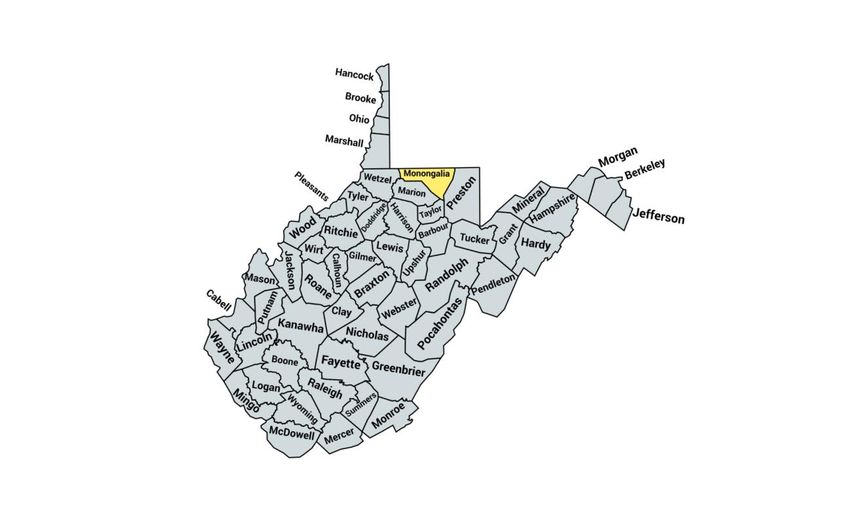
more aged populations. See Figure 1 below for a snapshot of the hospital’s main service area.
4Figure 1. Mon Health Medical Center Service Area
The table below contains information from the US Census Bureau and shows the most current
Quickfacts1 for Monongalia County. It outlines some basic demographics about the population,
as well as information about health insurance coverage, education, and poverty levels as
context for interpreting the survey data. Appendix A includes the full list of Quickfacts.
1
http://www.census.gov/quickfacts, 2019 estimates
5Table 1. Select Demographic Data
Monongalia County
Population 105,612
Residents under the age of 18 16.3%
Non-white or more than one race 10.2%
Hispanic or Latino 2.1%
High School education or higher (ages 25+) 92.3%
Bachelor’s degree or higher (ages 25+) 41.3%
Under 65 years old and uninsured 7.4%
Persons living in poverty 18.3%
Methodology and Community Input Process
The CHNA process began with a thorough review of the previous cycle’s needs assessment. It
also included a review of publicly available secondary data related to Monongalia County,
including census data and County Health Rankings Data (Appendix B). As in the prior CHNA
cycle, the WVU School of Public Health had recently surveyed the county as part of Ruby
Memorial Hospital’s CHNA process. This primary data collection consisted of a survey of
community members’ perceptions of health issues, administered both online and via hard
copies to target a wide representation of community members.
To add to this dataset and ensure accurate representation of the experiences of anyone under-
represented in survey data, collection and analysis was followed by a community event
attended by stakeholders representing an assortment of populations and areas of expertise.
This event focused on reviewing survey data, discussing experiences of those under-
represented, and brainstorming community resources and assets that impact population health
in the area.
This comprehensive primary data collection was thorough and timely, and was later presented
to the MHMC leadership team for review. Those in the room found this data to be consistent
with known public health issues and their experiences providing services in Monongalia County.
However, they also wished to capture the perspectives of a more broad assortment of
stakeholders and of their own clinicians, who they knew could accurately convey the health
concerns and experiences of the MHMC patient population. To achieve this, leadership worked
6with WVU SPH to develop and administer a supplemental survey tool throughout their own
Monongalia County network. At the conclusion of this supplemental data collection, with a
more robust snapshot of community health perceptions, the team was able to prioritize health
topics to address through provision of community benefit.
Primary Methods of Collecting and Analyzing Information
Two primary sources of data informed the CHNA: (1) the recent public survey and (2) a second
survey tool created specifically to supplement the original dataset and gather additional
perspective from MHMC stakeholders. The public survey included questions about perceptions
of general health of community members, quality of life, access to healthcare and medical
needs, personal habits, and demographic information including age, education, and income.
The community survey (Appendix C) was collected both online and as paper copies from
residents who were 18 or older. As the survey link was distributed through email lists and other
digital avenues, recipients were encouraged to share it with their own personal and
professional contacts. Some of the collection points and contact lists included:
● Healthcare providers, staff and their contacts
● Social media outlets, including community and neighborhood pages
● Hospital official website and newsletter
● City officials and their contacts
● The Shack Neighborhood House
● Milan Puskar Health Right
● Friendship House
● Morgantown Health & Wellness Commission
● Early Head Start staff and contacts
This survey was not intended to be a representative, scientific sample of residents of the
county’s population, but rather a mechanism to solicit the community’s perception of their
health needs, concerns, and “things that are working well” in Monongalia County. Just under
700 surveys were completed by community members from the area. Noteworthy limitations
included low response representation from males, from the lower-income population making
less than $30k/year, from those residing in the western end of the county, and from seniors
ages 65 or older. Despite these limitations, when analyzed closely, there was not noteworthy
variation in health concerns reported by these demographics (Appendix D).
In addition to the Monongalia County resident survey, the supplemental survey (Appendix E)
referenced above was created to give MHMC stakeholders an opportunity to provide input as
well. Knowing that the health concerns expressed in the original county survey remain accurate
7for the MHMC patient population, this second tool was crafted to solicit stakeholder input and
allow for any additional commentary.
A summary (Appendix F) of this supplemental survey data was presented back to hospital
leadership. Respondents outlined their own concerns, which largely fell in line with existing
survey data. Respondents were also given the opportunity to rank “top concerns” from 1-10
based on their expertise and knowledge of where MHMC could impact health outcomes.
The single exception to the resulting data was the inclusion of COVID-19 as a topic. The
supplemental survey tool was being administered as the pandemic was arriving in the United
States, and it appeared in the data and quickly rose to the “top 3” during the duration of data
collection. MHMC is currently doing much in real time to address this ongoing public health
crisis and to monitor its effects on the community. Although they have chosen not to prioritize
it for the purposes of this process, provision of services and benefits surrounding this health
topic will be ongoing indefinitely and remains a central focus of MHMC’s efforts and resources
at the time of this report.
Leadership Team and Community Organizations Involved
The following roles were represented on the MHMC CHNA leadership team and provided input
throughout the process of developing the CHNA. These individuals were charged as a group
with discussing use of the original Monongalia County dataset from the WVU SPH, methodology
for collecting additional data, and they identified members of the community for inclusion in
the supplemental data collection. They were responsible for collaborative discussion of primary
and secondary data to determine health priorities.
Leadership Team
● Kristina Adrian - MHS Executive Director of Growth and Marketing
● Kim Colebank - MHS Communications Officer
● Mary Edwards, DO - Vice President of Clinical Affairs, MHMC
● Karen Friggens - Vice President of Physician Services, MHMC
● Mark Gilliam - MHS Chief Information Officer, MHMC Chief Administrative Officer
● David Goldberg - President and CEO, MHS
● Luella Gunter - Executive Director of Philanthropy, MHS
● Cindy Johnson - MHS Interim Chief Human Resources Officer
● Gregory Nelcamp, MD - MHS Senior Vice President of Clinical Affairs
● Edward Phillips - MHS Chief Legal Officer
● Candi Powers - MHS Chief Revenue Cycle Officer
● Jack Schwartz - MHS Chief Information Officer
● Joy Solomita - MHS Interim Chief Nursing Officer
● Lisa Simon - MHS Chief Financial Officer
8● Breana Smith - Strategic Implementation Manager
● Romeo Tan - HR consultant
● Bradford Warden, MD - Executive Director of Heart and Vascular Services
Community Health Needs Prioritization
Following the collection of supplemental data, leadership discussed the totality of information
available, working to identify priority areas for developing implementation strategies.
With leadership, WVU SPH reviewed the summarized survey data, including overall responses
to the three most important health problems or issues. The original data was analyzed in
various ways, including a look at responses broken down by proximity to area high schools
(Table 2). This provided a snapshot of perspectives across population densities, from the
downtown area to more rural parts of Monongalia County.
Table 2. Community Health Concerns Survey Results
Morgantown High School University High School Clay-Battelle High School
Obesity - 56.2% Obesity - 71.8% Drug Abuse - 55.2%
Drug Abuse - 48.2% Drug Abuse - 43.0% Obesity - 51.7%
Mental Health Problems - 19.5% Alcohol Abuse - 19.0% Cancer - 20.7%
Health issues were largely consistent when looking at things like area of residence, age, gender,
income level, and other demographic variables. For example, drug abuse and obesity
consistently appeared at the top of data breakdowns by race and ethnicity, gender, income
levels, and in homes both with and without children. Health concerns varied slightly in priority
when analyzed in these ways, but not significantly enough to affect prioritization decisions.
Those working with populations of residents in Monongalia County agreed that the outcomes
of this survey accurately represent the concerns and challenges of those they serve.
Respondents from all areas of the county expressed overall agreement with statements about
topics such as general safety of the area and Morgantown being a safe place to raise children.
Respondents also indicated that they largely believe Morgantown to be home to quality child
care options, sufficient social supports for families and individuals in times of stress and need,
and good quality health and physical education in the public school system. Residents reported
being slightly less satisfied with availability of public transportation, jobs, access to affordable
fresh foods, and the availability of accessible, healthy recreational activities for all ages. The
lowest overall reported levels of satisfaction pertained to the condition/availability of sidewalks
9and general safety when walking and biking, and to the availability of safe, affordable, sufficient
housing options.
More generally, Monongalia county residents were mostly in agreement about perceptions of
health - about three quarters of residents perceive the overall population to be “unhealthy” or
“somewhat unhealthy”. About a third reported the perspective that their fellow residents
believe that they can make Monongalia county a better place to live, either individually or
collectively. Slightly more than this reported satisfaction with overall quality of life in the area,
and about half believe that neighbors know and trust one another.
In terms of access to healthcare and other medical needs (see Table 3 below), the majority of
respondents report having access to adequate medical care when needed, easy access to
specialists, overall satisfaction with the quality of care received, and the ability to typically be
able to afford their portion of medical care and medications. (Note that many respondents
reported that these questions were not applicable to them.)
Table 3. Access to Healthcare and Medical Needs
Agree Disagree
I have access to the specialists I need 40.5% 16.4%
I am very satisfied with my medical care 38.8% 20.9%
I have access to adequate healthcare 42.5% 12.5%
At times I can’t pay for my portion of my medical care 23.2% 58.6%
At times I can’t pay for my portion of my medication 16.9% 71.3%
I am able to get medical care when I need it 38.2% 20.2%
During the prioritization process, leadership revisited common priority areas within the context
of discussions and data. When considering where and how the hospital can realistically have an
impact, what they could accomplish with collaboration with partners, and what topics to
monitor and revisit at a later time, the list of top health concerns was pared down and
reconfigured to the three that will be the focus moving forward with implementation planning.
1.) Cancer – This topic is of very high importance according to the survey data from
the community, the relevant secondary data, and discussions with community
stakeholders. Programs and partnerships addressing this significant concern are already
in place at MHMC. Hospital leadership sees ways to build upon these partnerships, as
10well as explore new strategy ideas. In light of all of the above, this topic was identified
as a high priority for strategy development.
2.) Substance Use & Abuse – Among the top health concerns revealed in all of the
data were substance use & abuse. This ongoing community and state issue is also being
addressed via existing programs and partnerships with stakeholders, with further room
for expansion and new strategies as this problem persists in the County. Perhaps due to
Morgantown’s designation as a “college town”, alcohol appears a bit more in this
County’s survey data when compared to other areas of the state - for this reason, it will
be included and considered along with other substances here.
3.) Mental Health Problems - Community concern about mental health was very
evident in the survey data and discussion - this includes resident struggles with mental
health, access to treatment options, and stigma surrounding these issues. In light of this
and the ongoing need to find placement for patients needing a treatment bed or crisis
stabilization, the hospital is making this topic a high priority.
4.) Obesity - Hospital leadership feels that obesity, which is also addressed via
existing and ongoing programming, is a topic whose health outcomes can be affected by
continued work and exploration of new strategies and partnerships.
Hospital leadership did take the time to discuss some of the other issues raised in the county
and supplemental surveys, including the new inclusion of COVID-19, as noted earlier in this
report. Food insecurity and low income, as further examples, are topics that the hospital
recognizes as significant concerns. To provide support in this area, MHMC’s overarching Mon
Health System sponsors a local food program, Pantry Plus More. Pantry Plus More is a school-
based program that provides food, hygiene, and other necessities to Monongalia County
students and their families. These issues will remain in consideration as new programs and
partnerships may arise, and as the ongoing pandemic sees more pressing need in these areas. If
it is found that there is an opportunity that will change the scope of the hospital’s ability to
impact these or other topics, the team may choose to bring them back to the table for further
discussion.
11Conclusion
The 2020 CHNA identified four health priorities to guide Mon Health Medical Center’s efforts to
improve the health of community members. These topics are largely consistent with health
concerns raised in the previous cycle, and are:
1. Cancer
2. Substance Use & Abuse
3. Mental Health Problems
4. Obesity
This succinct list of priorities will guide the implementation planning process. Implementation
strategies will aim to address these issues using existing resources and partnerships with other
community organizations where possible, build upon past success, and include past efforts to
address health needs identified in the previous CHNA. In the coming months, this process will
lead to the completion of an implementation plan for activities centered on these health needs.
Looking forward, MHMC will be poised to conduct their next CHNA as part of the three-fold,
county-wide collaborative with the Monongalia County Health Department and Ruby Memorial
Hospital.
12Appendices
A. Secondary Data - Full Quickfacts for each county
B. Secondary Data - Health Rankings & Roadmaps for each county
C. Community Health Perceptions Survey
D. Community Health Perceptions Survey Summary
E. MHMC Supplemental Stakeholder Survey
F. Supplemental Stakeholder Data summary
13The 2020 Census is Happening Now. Respond Today.
QuickFacts
Monongalia County, West Virginia
QuickFacts provides statistics for all states and counties, and for cities and towns with a population of 5,000 or more.
Table
Monongalia
All Topics County, West
Virginia
Population estimates, July 1, 2019, (V2019) 105,612
PEOPLE
Population
Population estimates, July 1, 2019, (V2019) 105,612
Population estimates, July 1, 2018, (V2018) 106,420
Population estimates base, April 1, 2010, (V2019) 96,184
Population estimates base, April 1, 2010, (V2018) 96,190
Population, percent change - April 1, 2010 (estimates base) to July 1, 2019, (V2019) 9.8%
Population, percent change - April 1, 2010 (estimates base) to July 1, 2018, (V2018) 10.6%
Population, Census, April 1, 2010 96,189
Age and Sex
Persons under 5 years, percent 5.0%
Persons under 18 years, percent 16.3%
Persons 65 years and over, percent 12.6%
Female persons, percent 48.4%
Race and Hispanic Origin
White alone, percent 89.8%
Black or African American alone, percent (a) 4.0%
American Indian and Alaska Native alone, percent (a) 0.2%
Asian alone, percent (a) 3.6%
Native Hawaiian and Other Pacific Islander alone, percent (a) 0.1%
Two or More Races, percent 2.3%
Hispanic or Latino, percent (b) 2.1%
White alone, not Hispanic or Latino, percent 88.1%
Population Characteristics
Veterans, 2014-2018 5,127
Foreign born persons, percent, 2014-2018 5.7%
Housing
Housing units, July 1, 2018, (V2018) 45,074
Owner-occupied housing unit rate, 2014-2018 56.2%
Median value of owner-occupied housing units, 2014-2018 $188,700
Median selected monthly owner costs -with a mortgage, 2014-2018 $1,268
Median selected monthly owner costs -without a mortgage, 2014-2018 $351
Median gross rent, 2014-2018 $820
Building permits, 2019 26
Families & Living Arrangements
Households, 2014-2018 38,856
Persons per household, 2014-2018 2.56
Living in same house 1 year ago, percent of persons age 1 year+, 2014-2018 78.8%
Language other than English spoken at home, percent of persons age 5 years+, 2014-2018 7.6%
Computer and Internet Use
Households with a computer, percent, 2014-2018 90.4%
Households with a broadband Internet subscription, percent, 2014-2018 83.4%
Education
High school graduate or higher, percent of persons age 25 years+, 2014-2018 92.3%
Bachelor's degree or higher, percent of persons age 25 years+, 2014-2018 41.3%
Health
With a disability, under age 65 years, percent, 2014-2018 9.0%
/Persons without health insurance, under age 65 years, percent 7.4%
Economy
In civilian labor force, total, percent of population age 16 years+, 2014-2018 59.6%
In civilian labor force, female, percent of population age 16 years+, 2014-2018 55.9%
Total accommodation and food services sales, 2012 ($1,000) (c) 253,516
Total health care and social assistance receipts/revenue, 2012 ($1,000) (c) 1,513,845
Total manufacturers shipments, 2012 ($1,000) (c) 2,034,340
Total merchant wholesaler sales, 2012 ($1,000) (c) 340,944
Total retail sales, 2012 ($1,000) (c) 1,608,609
Total retail sales per capita, 2012 (c) $16,033
Transportation
Mean travel time to work (minutes), workers age 16 years+, 2014-2018 20.7
Income & Poverty
Median household income (in 2018 dollars), 2014-2018 $49,926
Per capita income in past 12 months (in 2018 dollars), 2014-2018 $30,641
Persons in poverty, percent 18.3%
BUSINESSES
Businesses
Total employer establishments, 2017 2,409
Total employment, 2017 47,846
Total annual payroll, 2017 ($1,000) 2,213,718
Total employment, percent change, 2016-2017 1.8%
Total nonemployer establishments, 2017 5,796
All firms, 2012 7,117
Men-owned firms, 2012 3,897
Women-owned firms, 2012 2,390
Minority-owned firms, 2012 438
Nonminority-owned firms, 2012 6,325
Veteran-owned firms, 2012 759
Nonveteran-owned firms, 2012 5,838
GEOGRAPHY
Geography
Population per square mile, 2010 267.1
Land area in square miles, 2010 360.06
FIPS Code 54061
/About datasets used in this table
Value Notes
Estimates are not comparable to other geographic levels due to methodology differences that may exist between different data sources.
Some estimates presented here come from sample data, and thus have sampling errors that may render some apparent differences between geographies statistically indistinguishable. Click the Quick Info icon to
row in TABLE view to learn about sampling error.
The vintage year (e.g., V2019) refers to the final year of the series (2010 thru 2019). Different vintage years of estimates are not comparable.
Fact Notes
(a) Includes persons reporting only one race
(b) Hispanics may be of any race, so also are included in applicable race categories
(c) Economic Census - Puerto Rico data are not comparable to U.S. Economic Census data
Value Flags
- Either no or too few sample observations were available to compute an estimate, or a ratio of medians cannot be calculated because one or both of the median estimates falls in the lowest or upper
open ended distribution.
D Suppressed to avoid disclosure of confidential information
F Fewer than 25 firms
FN Footnote on this item in place of data
N Data for this geographic area cannot be displayed because the number of sample cases is too small.
NA Not available
S Suppressed; does not meet publication standards
X Not applicable
Z Value greater than zero but less than half unit of measure shown
QuickFacts data are derived from: Population Estimates, American Community Survey, Census of Population and Housing, Current Population Survey, Small Area Health Insurance Estimates, Small Area Income an
Estimates, State and County Housing Unit Estimates, County Business Patterns, Nonemployer Statistics, Economic Census, Survey of Business Owners, Building Permits.
ABOUT US FIND DATA BUSINESS & ECONOMY PEOPLE & HOUSEHOLDS SPECIAL TOPICS NEWSROOM
Help for Survey Participants QuickFacts Help With Your Forms 2020 Census Advisors, Centers and News Releases
FAQs Explore Census Data Economic Indicators 2010 Census Research Programs Release Schedule
Statistics in Schools
Director's Corner 2020 Census Economic Census American Community Survey Facts for Features
Regional Offices 2010 Census E-Stats Income Tribal Resources (AIAN) Stats for Stories
History Economic Census International Trade Poverty Emergency Preparedness Blogs
Research Interactive Maps Export Codes Population Estimates Special Census Program
Scientific Integrity Training & Workshops NAICS Population Projections Data Linkage Infrastructure
Fraudulent Activity & Scams
Census Careers Data Tools Governments Health Insurance
Business Opportunities Developers Longitudinal Employer- Housing USA.gov
Household Dynamics (LEHD)
Congressional and Publications International
Intergovernmental Survey of Business Owners Genealogy
Contact Us
CONNECT WITH US
Accessibility | Information Quality | FOIA | Data Protection and Privacy Policy | U.S. Department of Commerce
/5/14/2020 Monongalia County, West Virginia | County Health Rankings & Roadmaps
Monongalia (ML)
2020 Rankings
County Demographics
County State
Population 106,420 1,805,832
% below 18 years of age 16.3% 20.2%
% 65 and older 12.6% 19.9%
% Non-Hispanic Black 3.9% 3.5%
% American Indian & Alaska Native 0.2% 0.3%
% Asian 3.6% 0.8%
% Native Hawaiian/Other Paci c Islander 0.1% 0.0%
% Hispanic 2.1% 1.7%
% Non-Hispanic White 88.1% 92.1%
% not pro cient in English 0% 0%
% Females 48.4% 50.5%
% Rural 26.9% 51.3%
Monongalia Error Top U.S.
West Virginia Rank (of 55)
County Margin Performers ^
Health Outcomes 1
Length of Life 1
Premature death 6,500 5,900-7,100 5,500 10,800
Quality of Life 3
Poor or fair health ** 19% 19-20% 12% 24%
Poor physical health days ** 4.7 4.5-4.9 3.1 5.3
Poor mental health days ** 4.7 4.5-4.9 3.4 5.5
Low birthweight 8% 7-9% 6% 9%
Additional Health Outcomes (not included in overall ranking)
Life expectancy 79.0 78.4-79.6 81.1 74.8
Premature age-adjusted mortality 320 300-340 270 500
Child mortality 70 50-90 40 60
Infant mortality 8 6-11 4 7
Frequent physical distress 14% 14-15% 9% 17%
Frequent mental distress 15% 15-15% 11% 18%
Diabetes prevalence 9% 8-11% 7% 15%
HIV prevalence 103 41 114
Health Factors 2
Health Behaviors 4
Adult smoking ** 20% 19-21% 14% 26%
Adult obesity 30% 27-33% 26% 37%
Food environment index 7.3 8.6 6.7
Physical inactivity 21% 19-24% 20% 29%
Access to exercise opportunities 82% 91% 59%
Excessive drinking ** 18% 17-18% 13% 12%
Alcohol-impaired driving deaths 28% 21-35% 11% 27%
Sexually transmitted infections 376.1 161.4 228.0
Teen births 11 10-12 13 34
Additional Health Behaviors (not included in overall ranking)
Food insecurity 15% 9% 15%
Limited access to healthy foods 7% 2% 7%
Drug overdose deaths 27 21-33 10 50
Motor vehicle crash deaths 8 6-10 9 16
Insuf cient sleep 37% 36-38% 27% 40%
Clinical Care 2
Uninsured 7% 6-8% 6% 8%
Primary care physicians 760:1 1,030:1 1,290:1
Dentists 780:1 1,240:1 1,810:1
Mental health providers 400:1 290:1 770:1
Preventable hospital stays 5,760 2,761 6,149
Mammography screening 47% 50% 39%
https://www.countyhealthrankings.org/app/west-virginia/2020/county/snapshots/061/print 1/25/14/2020 Monongalia County, West Virginia | County Health Rankings & Roadmaps Flu vaccinations 47% 53% 41% Additional Clinical Care (not included in overall ranking) Uninsured adults 8% 7-10% 7% 9% Uninsured children 2% 2-3% 3% 3% Other primary care providers 280:1 665:1 660:1 Social & Economic Factors 3 High school graduation 90% 96% 89% Some college 72% 68-76% 73% 55% Unemployment 4.1% 2.6% 5.3% Children in poverty 14% 9-18% 11% 23% Income inequality 6.0 5.4-6.6 3.7 4.9 Children in single-parent households 27% 23-31% 20% 34% Social associations 10.1 18.4 13.1 Violent crime 250 63 330 Injury deaths 64 57-71 58 119 Additional Social & Economic Factors (not included in overall ranking) Disconnected youth 2% 1-3% 4% 9% Reading scores 3.4 3.4 3.0 Math scores 3.4 2.9 Median household income $51,100 $47,600-54,500 $69,000 $44,000 Children eligible for free or reduced price lunch 41% 32% 55% Residential segregation - Black/White 39 23 61 Residential segregation - non-white/white 32 14 49 Homicides 2 1-4 2 5 Suicides 14 10-17 11 19 Firearm fatalities 12 9-15 8 17 Juvenile arrests 20 Physical Environment 26 Air pollution - particulate matter ** 9.7 6.1 9.6 Drinking water violations No Severe housing problems 18% 17-20% 9% 11% Driving alone to work 77% 75-78% 72% 83% Long commute - driving alone 21% 19-23% 16% 33% Additional Physical Environment (not included in overall ranking) Traf c volume 79 58 Homeownership 56% 55-58% 81% 73% Severe housing cost burden 17% 15-18% 7% 10% ^ 10th/90th percentile, i.e., only 10% are better. ** Data should not be compared with prior years Note: Blank values re ect unreliable or missing data https://www.countyhealthrankings.org/app/west-virginia/2020/county/snapshots/061/print 2/2
Ruby Memorial Hospital Community Health Perceptions Survey
Q1 Please take a moment to complete the following survey - it should take less than 10 minutes
to complete. The purpose of this survey is to get your input about community health concerns in
your county. This survey will be used to help guide the Community Health Needs Assessment
taking place in your county. The community partners will use the results of this survey, along
with other information, to identify the most pressing health issues which can be addressed
through community action. Your responses will not be associated with you in any way. If
you have previously completed this survey, please disregard. Remember, your opinion is
important to us!
Thank you for your time and please contact us if you have any questions concerning this
survey or need help completing it. Emily Sarkees, WVU School of Public Health -
edillama@hsc.wvu.edu
Are you a resident of Monongalia County?
o Yes
o No
Q2 Below is a list of public high schools in Monongalia County. Please choose the one that is
closest to where you reside.
o Morgantown High School (located in residential South Park - adjacent to downtown
Morgantown)
o University High School (located on Baker's Ridge Road - northeast of city limits)
o Clay-Battelle High School (located in Blacksville - western end of the county)
Q3 In your opinion, what is the most important health problem or health issue for residents of
your County?
________________________________________________________________Q4 Thinking about your county overall, what helps keep residents healthy?
________________________________________________________________
Q5 Thinking specifically about your own experience, what local places, programs, or
organizations have helped you or someone close to you focused on personal wellbeing?
________________________________________________________________
Q6 How would you rate your County as a "Healthy Community"?
o Very Unhealthy
o Unhealthy
o Somewhat Unhealthy
o Healthy
o Very Healthy
Q7 In the following list, what do you think are the 3 most important "health problems" or "health
issues" in your County? Please choose ONLY 3.
Air quality Food insecurity/hunger Obesity
Aging problems (e.g. arthritis, Gun-related injuries Physical/cognitive ability
hearing/vision loss)
Alcohol abuse Heart disease/stroke Respiratory/lung
disease/asthma
ATV (4-wheeler) crashes High blood pressure Sexually transmitted diseases
and infections
Bicycle & pedestrian safety HIV/AIDS Teenage pregnancy
Cancers Homelessness Tobacco use –
smoking/vaping
Child abuse/neglect Inadequate housing Tobacco use – chewing
tobaccoDental problems Income (low income) Transportation
Diabetes (“sugar”) Infant death Violence (e.g. crime, sexual
assault, domestic violence,
rape, homicide, suicide)
Drug abuse Infectious disease Water quality
Elderly support (in-home Mental health problems Other:
care, nursing facilities, etc.)
Employment access Motor vehicle crash injuries
8 Please indicate your level of agreement with each of the following statements about your
County:
Quality of life in your County
Strongly Disagree Agree Strongly I don’t
Disagree Agree know/Not
applicable
I am satisfied o o o o o
with the quality
of life in my
County.
All residents o o o o o
believe that
they,
individually or
collectively,
can make your
County a
better place to
live.
There is o o o o o
sufficient, safe,
and affordable
housing in my
County.
There are jobs o o o o o
available in my
County.
There is o o o o o
quality
childcare
available in my
county.
My County is a o o o o o
safe place to
live.
Neighbors o o o o o
know and trustone another and look out for one another. There are o o o o o support networks for individuals and families (neighbors, support groups, faith community, outreach, agencies, and organizations) during times of stress and need. My County is a o o o o o good place to raise children. The public o o o o o education system in my County adequately meets the physical health needs of our children. (e.g. school food, physical education/PE, etc.) The public o o o o o education system in my County adequately meets the health education needs of our children. (e.g. hygiene and personal care, pregnancy and STI prevention, etc.) There are an o o o o o adequate
number of safe
places for
children to play
and exercise in
my County.
My County has o o o o o
adequate and
safe access to
recreation and
exercise
opportunities
for adults.
My County has o o o o o
adequate
access to
affordable
healthy foods.
My County has o o o o o
adequate
health and
wellness
activities.
My County is a o o o o o
safe place to
walk and bike.
My County has o o o o o
sufficient
public
transportation.
There are o o o o o
adequate
sidewalks in
my County.
Q9 Please indicate your level of agreement with each of the following statements about your
County:
Access to healthcare and medical needs in your County
Strongly Disagree Agree Strongly I don’t
Disagree Agree know/Not
applicable
I have easy o o o o o
access to the
medical
specialists I
need.
I am very o o o o o
satisfied with
the medical
care I receive.I have access o o o o o to adequate healthcare. Sometimes it o o o o o is a problem for me to cover my share of the cost for a medical care visit. Sometimes it o o o o o is a problem for me to cover my share of the cost of medication. I am able to o o o o o get medical care whenever I need it.
Q10 In your opinion, from the following list, what do you think are the most important "risky behaviors" in your County? Risky behaviors have the greatest impact on the overall health of the community. ▢ Bad eating choices ▢ Alcohol abuse ▢ Dropping out of school ▢ Drug abuse ▢ Exclusion or discrimination based on race, religion, gender, sexual orientation, etc. ▢ Hand hygiene (washing) ▢ Impaired driving (drugs/alcohol) ▢ Lack of exercise ▢ Not getting "shots" to prevent disease ▢ Not using seat belts and/or child safety seats ▢ Overeating ▢ Texting/cell phone while driving ▢ Tobacco use/electronic cigarette use ▢ Unsafe sex ▢ Other (please specify) ________________________________________________
Q11 What is your gender? o Female o Male Q12 What is your age range? o 18 to 25 years o 26 to 39 years o 40 to 54 years o 55 to 64 years o 65 to 80 years o Over 80 years
Q13 What is your marital status? o Married/cohabitating o Divorced o Never married o Separated o Widowed o Other (please specify) ________________________________________________ Q14 How many children under the age of 18 live in your household? o0 o1 o2 o3 o4 o5 o Greater than 5
Q15 Do you care for a live-in elderly adult in your household? o Yes o No Q16 Are you of Hispanic or Latino origin or descent? o Yes, Hispanic or Latino o No, not Hispanic or Latino Q17 Which of these groups would you say best describes your race? o White/Caucasian o Asian o Black or African American o American Indian or Alaskan Native o Native Hawaiian or Other Pacific Islander o Other (please specify) ________________________________________________
Q18 What is your approximate average household income? o Less than $20,000 o $20,000 to $29,999 o $30,000 to $49,999 o $50,000 to $74,999 o $75,000 to $99,999 o Over $100,000 o Prefer not to answer Q19 What is the highest level of education you have completed? o Less than high school graduate o High school diploma or equivalent o College degree or higher o Other (please specify) ________________________________________________ Q20 Do you see a healthcare provider on a regular basis for physicals, screenings, or other preventative medicine? o Yes o No (if no, why not?) ________________________________________________
Q21 How do you pay for healthcare? Please select all that apply. o I pay cash o I have health insurance (e.g. private insurance, Blue Cross Blue Shield, HMO, through my employer) o Medicaid o Medicare o Veterans Administration o Indian Health Services o Other (please specify) ________________________________________________ Q22 Have you ever been told by a doctor, nurse or other health professional that you have high blood pressure? o Yes o No Q23 Have you ever been told by a doctor, nurse, or other health professional that your blood cholesterol is high? o Yes o No
Q24 Have you ever been told by a doctor that you have diabetes ("sugar")?
o Yes
o No
Q25 How many days a week do you eat vegetables?
(Enter 0 – 7) _____________________________
Q26 Not counting juice, how many days a week do you eat fruit?
(Enter 0 – 7) _____________________________
Q27 How many days a week do you consume soda or other processed, sugary foods?
(Enter 0 – 7) _____________________________
Q28 How many days a week do you get at least 30 minutes of moderate physical activity such
as brisk walking, bicycling, gardening or anything else that causes some increase in breathing
and heart rate?
(Enter 0 – 7) _____________________________
Q29 Do you smoke cigarettes every day, some days, or not at all?
o Every day
o Some days
o Not at allQ30 Have you smoked at least 100 cigarettes in your entire life?
o Yes
o No
Q31 About how tall are you (in feet and inches)?
________________________________________________________________
Q32 About how much do you weigh (in pounds)?
________________________________________________________________Ruby Memorial Hospital - Community Health Perceptions Survey Summary
Top 3 Health Problems by Geographic Location
Overall (688) MHS (319) UHS (152) CBHS (30)
Obesity 60.8% Obesity 56.2% Obesity 71.8% Drug Abuse 55.2%
Drug Abuse 46.8% Drug Abuse 48.2% Drug Abuse 43.0% Obesity 51.7%
Mental 18.4% Mental 19.5% Alcohol 19.0% Cancer 20.7%
Health Health Abuse
Problems Problems
(688 Total Survey Responses)
Top 3 Health Problems by Gender / Age
Men Women Young AdultsWe analyzed other data breakdowns to look for differences in top concerns, including:
- Those who have been told by a medical provider that they have an elevated BP, high
cholesterol, or diabetes
- Those who report eating vegetables daily, or getting at least 30 minutes of physical
exercise 5+ times per week, or being nonsmokers
- Those who state they do not have adequate access to healthcare, report dissatisfaction
with quality of care, or an inability to afford care or medications
- Those who think that Mon County is not a good place to raise children or is generally an
unsafe place to live
Differences between these respondents were found to be minimal, if there were any at all. Among these,
every “group” reported obesity and drug abuse as their top two concerns. The third concern remained
reflective of the breakdowns above, with only two exceptions: “homelessness” was #3 for those who think
that Mon County is an unsafe place to live, and “low income” was #3 for those who think that this is not a
good place to raise children.Mon Health Medical Center Community Health Needs Assessment
Stakeholder Survey
Mon Health Medical Center is conducting a Community Health Needs Assessment, an
IRS-mandated process required of all non-profit hospitals. Please take a few minutes to
complete this brief survey, which will provide valuable insight to MHMC leadership as they work
to determine which areas of community concern will be addressed through community benefit
efforts. Thank you!
1.) As a stakeholder in the MHMC community, which of the following describes you or your
work? Please check all that apply.
▢ MHMC Administration or Board of Directors
▢ Health care provider
▢ Member of state, local, or regional governmental public health department, or other public
health entity (e.g. State Office of Rural Health)
▢ Work with medically under-served, low-income, and/or minority populations
▢ Local government official
▢ Local school district representative
▢ None of the above
Page 1 of 32.) In your opinion, what is the single most pressing health problem or related issue for
members of your community?
________________________________________________________________
3.) Available community survey data indicate that the topics below are the overall "top ten" most
pressing health - or health-related - concerns in the area. Please rank each topic from 1
(highest) to 10 (lowest) by dragging and dropping them according to your own experience and
knowledge. Note: numbers will update automatically as they are moved.
______ Obesity
______ Substance use/abuse
______ Mental health problems
______ Alcohol abuse
______ Low income
______ Food insecurity/hunger
______ Tobacco use (smoking/vaping)
______ Cancer
______ Bicycle & pedestrian safety
______ Homelessness
4.) Using the same list, please rank each topic from 1 (highest) to 10 (lowest) by dragging and
dropping them based on the hospital's capacity to impact these priority health needs from your
knowledge of the hospital's mission, community partners/projects, resources, or other insight
you may have.
______ Obesity
______ Substance use/abuse
______ Mental health problems
______ Alcohol abuse
______ Low income
______ Food insecurity/hunger
______ Tobacco use (smoking/vaping)
______ Cancer
______ Bicycle & pedestrian safety
______ Homelessness
Page 2 of 35.) If you feel comfortable doing so, please indicate the name of your organization. This
information will not be used for the purpose of identifying respondents, but will be incorporated
into the final CHNA report when summarizing the nature and extent of community input into this
process. This final report will be posted publicly on the hospital website following formal
adoption by the Board of Directors in May 2020.
________________________________________________________________
Page 3 of 3MHMC Community Health Needs Assessment
Supplemental Survey Data Summary
Respondents: 24
“In your opinion, what is the single most pressing health problem?”
(number of times each topic was entered in this open-ended question is shown)
● Obesity - 6
● COVID-19 - 5
● Access to care - 3
● Substance use/abuse - 3
● Cardiovascular health - 2
● Mental health - 2
● (followed by several one-off topics)
Available survey data was shown to respondents in the form of a “top ten” list, and respondents
were asked to rank them in two ways:
1.) Rank their own “top ten” according to experience and knowledge
2.) Rank topics MHMC is most able to impact, according to their own knowledge of the
hospital’s mission, resources, or other insight.
Most Pressing Topics MHMC Ability to Impact
Existing Community Data (as ranked by respondents) (as ranked by respondents)
Obesity Obesity Cancer
Substance use/abuse Substance use/abuse Substance use/abuse
Mental health problems *Alcohol abuse Mental health problems
*Alcohol abuse Mental Health Problems Obesity
Low income Food insecurity/hunger *Alcohol abuse
● Does MHMC leadership wish to prioritize topics based solely on existing data (column
one)?
● Does MHMC leadership wish to prioritize topics based also on additional feedback
shown in columns two and three?
● Does MHMC wish to include viral disease in the discussion - the only new highly-ranked
concern that came from the supplemental survey? (MHMC is the first hospital to have
the issue show up in survey data.)
*We don’t often see alcohol abuse in the top concerns as its own stand-alone topic; we do see it
combined with other forms of substance abuse, or indicated as one of the top “risky behaviors”.You can also read