VITALSIGNS - REPORT 2017/18 - Toronto Foundation
←
→
Page content transcription
If your browser does not render page correctly, please read the page content below
REPORT 2017/18

   TORONTO’S

VITALSIGNS

TABLE OF
CONTENTS

 4
     ABOUT TORONTO FOUNDATION
     ABOUT THE REPORT

 5
     ACKNOWLEDGEMENTS

 6
      NOTE FROM
     A
     SHARON AVERY,
     PRESIDENT & CEO

 7
     INTRODUCTION

10
     TORONTO'S
     CHANGING
     DEMOGRAPHICS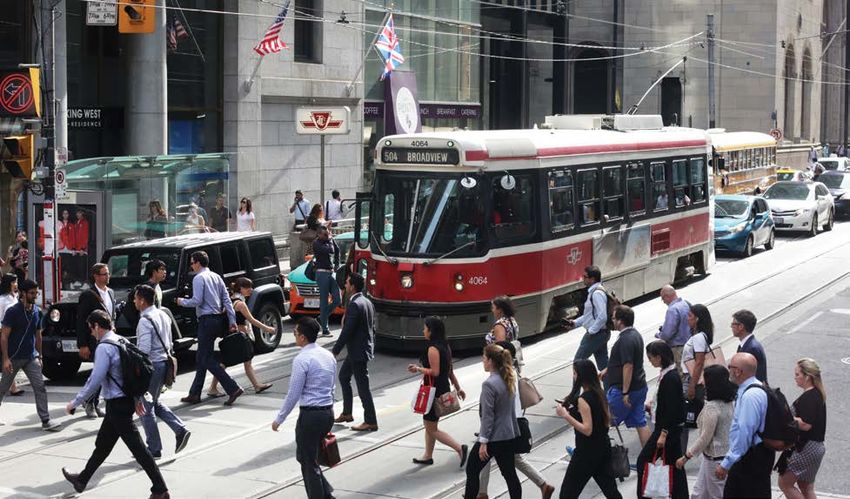
14                 44
     ARTS &             INCOME &
     CULTURE            WEALTH

20                 50
     ENVIRONMENT        LEADERSHIP,
                        CIVIC ENGAGEMENT
                        & BELONGING

26                 56
     GETTING            LEARNING
     AROUND

32                 62
     HEALTH &           SAFETY
     WELLNESS

38                 68
     HOUSING            WORK

                   74
                        CONCLUSION

                   77
                        ENDNOTES
ABOUT TORONTO
                               FOUNDATION
                               Established in 1981, Toronto Foundation is a community
                               foundation and registered charity. We pool philanthropic
                               dollars and facilitate charitable donations for maximum
                               community impact. Our individual, family and organizational
                               funds number more than 500, and we administer close to
                               $500 million in assets. Through strategic granting, thought
                               leadership and convening, we engage in city-building to
                               strengthen the quality of life in Toronto.

                               Philanthropists come to us to help simplify and enhance their
                               charitable giving in Toronto and across Canada. We also offer
                               a community of like-minded people for those who want
                               to make connections, learn and amplify their impact by
                               collaborating with others.

                               ABOUT
                               THE REPORT
                               Toronto’s Vital Signs Report is compiled from current statistics
                               and studies, serving as an annual consolidated snapshot of the
                               trends and issues affecting the quality of life in our city. For the
                               first time this year, Toronto Foundation has used an equity lens
                               to identify data for inclusion and analysis. This new framing aims
                               to surface the gaps and opportunities for improvement and
                               make the report a more actionable tool for policy-makers,
                               practitioners and philanthropists.

4 | About Toronto Foundation                                                VITAL SIGNS REPORT 2017/ 18
ACKNOWLEDGEMENTS
Toronto Foundation would             Finally, a sincere thank you is    Roger Keil
like to thank Public Interest        also extended to the Advisory      Chair in Global Sub/Urban
Strategy and Communications,         Group of Toronto’s Vital Signs     Studies, Faculty of
Social Planning Toronto’s social     Report 2017-18:                    Environmental Studies,
enterprise, who served as the                                           York University
report’s principal writer, and          Paul Bedford
George Brown College, our lead          Chair, Waterfront Toronto       Robert Luke
research partner.                       Design Review Panel;            Vice-President, Research and
                                        Principal, Paul Bedford &       Innovation, OCAD University
We are also grateful to the             Associates; former City of
founders of Toronto’s Vital Signs       Toronto Chief Planner           Patricia McCarney
Report, Maytree and Laidlaw                                             President and CEO, World
Foundation, and in particular           Shauna Brail                    Council on City Data; Professor
Alan Broadbent and Nathan               Presidential Advisor on Urban   and Director, Global Cities
Gilbert, who created the model          Engagement and Associate        Institute, University of Toronto
in 2001 to monitor quality of life      Professor, Teaching Stream,
in Toronto. The report found its        Urban Studies Program, Innis    Sean Meagher
home at Toronto Foundation in           College, University             Executive Director, Social
2003, to allow for the report’s         of Toronto                      Planning Toronto
long-term stewardship and to
catalyze the findings. Since            Elliott Cappell                 Ceta Ramkhalawansingh
2006, Community Foundations             Chief Resilience Officer,       Director, Toronto Foundation;
of Canada has co-ordinated              City of Toronto                 City of Toronto Corporate
the national and international                                          Equity and Diversity Manager
replication of Vital Signs, which       Dawn Davidson                   (Retired)
is now used by 32 Canadian              Associate Vice-President,
communities and 80 globally.            Research and Innovation,        Ted Wong
                                        George Brown College            Management Consultant,
Toronto Foundation is also                                              City Manager’s Office,
indebted to the many                    Suzanne Dwyer                   City of Toronto
individuals, institutions and           Director, Institutional
organizations who contributed           Research and Planning,
information, statistics and             George Brown College
advice for the report. This
includes the people who shared          Joe Greenwood
with us their expertise on the          Lead Executive, Data —
issues and whose perspectives,          MaRS Discovery District
stories and photos are directly         and Program Director —
featured throughout this report.        MaRS Data Catalyst

VITAL SIGNS REPORT 2017/ 18                                                 Acknowledgements | 5
A NOTE FROM
SHARON AVERY
PRESIDENT & CEO

What is a “just” city?
It’s a place where everyone has the opportunity      And when you’re finished, ask yourself:
to thrive. And where everyone has the ability to     Have I done enough? What more can I do?
contribute too, with time, talent and treasure.
                                                     Consider using this report as your giving guide.
Since you’re reading this, you likely call Toronto   Decide what issues matter most to you. Set a
home. I’ll bet you also care deeply about its        personal target for your charitable giving and
future – for your own self-interest but mostly       focus your contributions on bringing about change.
for the benefit of all – your neighbours and
those you may never meet. It’s people like you       Give what you can but if you’re looking for a reason
who make this city not just a pulsing metropolis     to give more, here are some things to consider:
but a community with heart.
                                                      T
                                                        he top 1 per cent bring home about
I’m not going to tell you what to think.               $250,000 or more in income (are you in the
The data in this report and the voices of              one per cent?);
those we’ve engaged in writing it speak for
themselves. I do have an agenda, however.
                                                       People with incomes of less than $50,000 per
                                                       year are giving 2.3 per cent of their gross
I want you to care that the infant mortality           income to charity each year; those with incomes
rate for low income Torontonians is 50 per cent        of $100,000 are giving 1.6 per cent and those
higher than it is for the most affluent. Or that       earning $800,000 give at a rate of two per cent.
91 per cent of Indigenous people in Toronto
are living below the low-income cut-off.             I believe that philanthropy has an essential role
                                                     to play in making Toronto a kinder and more
Even more, I want you to do something                equitable city.
about it.
                                                     We have a lot to be proud of. And a lot to give.
Read this report from cover to cover. Talk
about it. Share it with your family, friends,        Thanks for reading.
colleagues and neighbours, maybe by hosting
a “Vital Conversation” over dinner (see the
conclusion section for more information). Ask
your elected officials and candidates what they
think about the growing inequities in our city.

6 | A Note from President & CEO                                               VITAL SIGNS REPORT 2017/ 18
INTRODUCTION
In many ways, Toronto is one                     — few global cities* have the                    we are a wealthy city, we are
of the best places to live in                    combination of a burgeoning                      also a city where too many
the world. Our population is                     skyline nestled within an expanse                are being left behind. And
growing, our skyline is rising,                  of ravines, rivers and a vast tree               we have a long road ahead
our economy is booming                           canopy, situated next to one of                  to meaningfully address the
and the vibrancy, diversity                      the Great Lakes and with a long                  systemic biases in our society
and richness of our cultural                     and lively waterfront its residents              rooted in racism, colonization
communities continue to                          can benefit from and enjoy.                      and oppression. As we move
expand. The population of                                                                         forward in a world of change
the City of Toronto has                          As one of the 100 Resilient Cities               and uncertainty, we need to
increased to 2,731,571 people,                   identified by the Rockefeller                    work together to build a city
according to the 2016 census,                    Foundation, Toronto has                          that not only celebrates, but
which is up 4.5 per cent over                    carved a path toward building                    also lives up to its commitment
2011.1 The economy of the                        physical, social and economic                    to fairness.
Toronto Census Metropolitan                      well-being for all of its residents.
Area (CMA), or the Toronto                       Resiliency is the ability to                     Building fairness and greater
Region, is now roughly the size                  adapt to and manage change                       equity means ensuring all
of Quebec’s. 2 Our technology                    successfully in rapidly evolving                 Torontonians have access to
startups are gaining recognition                 circumstances. From the                          and can capitalize on the
around the world, the city’s                     strength of our economy, to                      positive opportunities on offer
“Discovery District” at University               our strong neighbourhoods                        in our city. To do so, we need
Avenue and College Street is a                   and community connections,                       to be thoughtful stewards
national leader in biotechnology                 we have a lot to be proud of.                    of what makes our city an
and we remain an international                   But to achieve our potential,                    excellent place to live.
banking leader and a global                      it is vital that we build on the
figure in film and television.                   assets we have worked so                         EQUITY
                                                 hard to achieve.
                                                                                                  This year, Toronto Foundation
The richness and diversity of
                                                 However, divisiveness is still                   chose to look specifically
our economy is matched by
                                                 a threat in a city that celebrates               at equity: we wanted to
the diversity of our communities.
                                                 diversity. While Toronto has a                   explore the ways in which our
As Canada’s top immigration
                                                 wealth of opportunity, we are                    culture, systems, institutions,
destination, Toronto and the
                                                 seeing a growing divide in                       behaviours, mindsets and
Greater Toronto Area (GTA)
                                                 terms of who has access to                       frames of reference may
are a magnet for people from
                                                 those opportunities. Enclaves                    be putting up barriers that
around the world who seek a
                                                 are deepening, as is income                      block some populations from
place to apply their skills, raise
                                                 inequality. Increasingly,                        accessing Toronto’s immense
their families or find a safe home
                                                 neighbourhoods are divided                       opportunities and where
in a caring nation. Not only is
                                                 into rich and poor, with fewer                   government, the corporate
Toronto rich with opportunity,
                                                 mixed communities. Though                        sector, philanthropy and
but it is also a beautiful city

* The term “global cities” refers to the most economically influential cities across the globe.

VITAL SIGNS REPORT 2017/ 18                                                                                      Introduction | 7
everyday citizens can direct                    differences among us and seeing                  These three dimensions of
their attention and resources                   the gaps in equity are the best                  equity are used to explore
to help level the playing field.                ways to determine where to                       the issues that Toronto’s Vital
The data on equity points to                    focus the attention and resources                Signs Report has always
many areas of concern — not as                  of policy-makers, everyday                       tracked, to see if, in each
an indictment of our city, but                  residents and philanthropists.                   of those areas, we see the
to help us build a road map for                                                                  same starting points, access
what needs to be addressed.                     FOR THIS PUBLICATION, WE                         and outcomes for Toronto’s
                                                HAVE FOUND IT HELPFUL TO                         residents. What we found tells
Toronto has seen enormous                       LOOK AT EQUITY IN THREE                          us a lot about what work we
growth and progress over the                    DISTINCT WAYS:                                   still have to do as a city.
years. We often take pride
                                                     hat are we starting with?
                                                    W
in its economic, social and                                                                      METHODOLOGY
cultural successes, but many                        Are we starting out with the
continue to be left behind.                         same tools and opportunities?                AND LIMITATIONS
The opportunities and assets                        Do we get enough to eat?                     To understand how inequity
our city offers do not reach                        Do we speak the predominant                  is playing out in Toronto, we
everyone, and the gap between                       language? Do we have access                  analyzed how subgroups of
the haves and have-nots has                         to clean air and water?                      people were doing, compared
been growing.                                                                                    to city averages, and we also
                                                 W
                                                   hat do we experience?                        looked at trends among specific
Our continued well-being                          What access do we have to                      populations. These differences
depends on building a Toronto                     the tools and opportunities                    are easiest to identify by using
where all communities can                         that support success, and                      disaggregated data to examine
share in emerging opportunities                   what exposure do we have to                    different subgroups separately.
and improved quality of life.                     harmful environments? Can                      When we disaggregate data by
To do this, we need to look at                    we get health care? Do we                      gender, race, income, geography
our differences. We need to                       have adequate opportunities                    and immigration status, we can
intently study the disparities                    to learn? Are we protected                     see if women earn the same
in opportunity and access,                        from violence or disruption?                   as men, or if racialized* people
and reflect on where we are                                                                      get the same employment
succeeding and where we are                          hat are our outcomes?
                                                    W                                            opportunities as non-racialized
failing to bridge those gaps.                       Do we achieve the same                       people, or if refugees have the
We can achieve that by applying                     results, regardless of                       same educational outcomes
an equity lens — reflecting on                      background or geography?                     as others. In some cases, the
the variations and disparities                      Do we have the same life                     results were predictable, but
among our circumstances,                            expectancies, graduation                     at other times, they revealed
rather than erasing them with                       rates or wealth?                             unanticipated outcomes that
averages. Understanding the                                                                      haven’t previously been captured
                                                                                                 or recognized in any analyses.

*T
  he term “racialized” refers to the process of ascribing racial identities to a relationship, social practice or group by another. It’s a
 sociological term that has gained popularity in everyday discourse to better understand identity. Racialization is the complex process
 through which people and groups come to be designated as being of a particular “race” based on social, economic and political forces
 and on that basis subjected to differential and/or unequal treatment. It emphasizes how racial categories are constructed, but are also
 socially and culturally very real.

8 | Introduction                                                                                         VITAL SIGNS REPORT 2017/ 18
Unfortunately, there is limited       under-represents Indigenous             Torontonians experience a good
access to disaggregated data.         communities, we decided                 quality of life.
One of the major challenges           not to include it in this report.
that we face as researchers is        Well Living House, located              As a result, disaggregated
the inability to link different       at the Centre for Research              data is used from years previous
data sets, or to break down data      on Inner City Health at St.             to 2017 and 2016, where no
according to different groups         Michael’s Hospital, is currently        more recent data was available
of people or characteristics, to      in the process of undertaking           at time of writing. Where
paint a more detailed picture         statistically inclusive community       disaggregated data is not
of the lived realities of different   action research on health               available for the City of Toronto
populations. For example,             and well-being outcomes for             specifically, data is used from
there are extensive statistics        Indigenous infants, children and        larger geographies such as the
on health that often show data        their families in our city, and it is   Greater Toronto Area or the
by age and gender, but they           expected to be publicly released        Toronto CMA, Statistics Canada
rarely include related variables      in 2018. We recommend readers           boundaries that describe the
according to income group,            keep an eye out for this crucial        Toronto Region.
immigration status, sexual            data once it becomes available.
orientation or race. While some
educational institutions and          Intersectionality, or the impact
government bodies gather              of intersecting interwoven
data showing variations by race       factors such as gender, race
or immigration status, many           and sexual orientation, is
do not. The data presented in         also critically important to
this year’s Vital Signs Report        understanding the complex
reflects those constraints. We        realities of equity, but is also
have decided to only publish          particularly hard to track.
data that provides credible,          Thanks to the sharing of and
disaggregated information,            directing toward hard-to-find
but we acknowledge that our           data by multiple research
findings have been limited based      partners and colleagues, we
on what we could obtain, rather       have been able to source and
than all we would like to know.       cite intersectional data in some
                                      cases. However, availability
One major gap pertains                and access are limited. And
to the lack of reliable data          far more work needs to be done
on Toronto’s Indigenous               to gather, monitor and share
communities. Because the              disaggregated and intersectional
sampling methodology utilized         data, so that we can use that
through Statistics Canada’s           information and continue to
Census Program often seriously        work together to help all

VITAL SIGNS REPORT 2017/ 18                                                                  Introduction | 9
TORONTO’S
CHANGING DEMOGRAPHICS

Toronto, like many parts               and that diversity continues       Punjabi, once less spoken,
of Canada, is experiencing             to grow and change. In 2016,       are now prominent through
significant demographic                47 per cent of the population      much of the northeast
change. Family structures              was immigrants, much higher        and northwest of our city,
in particular are changing             than the national rate of 21.9     respectively. Dozens of other
dramatically in Toronto. 3             per cent.9 And as Toronto’s        spoken languages, from
According to Statistics Canada,        immigration patterns shift, so     Persian to Serbian to Gujarati,
couples with children have             does its population base. Over     are predominant and ever-
historically been the most             the last 20 years, South Asian     growing in smaller local
common family constellation,           populations have grown rapidly,    enclaves.13
but they have slipped from             while East Asian communities
almost one-third of households         have grown steadily and            While linguistic diversity is
to just above one-quarter.4            European backgrounds have          considerable in Toronto, its
People living alone now make           remained far more fixed,           intensity varies. Older enclaves,
up the most common household           keeping less pace with our         such as the Chinatowns
type by far. 5 Almost 70,000           growing city.10 In 2016, over      in north Scarborough and
homes in Toronto are made              half of Torontonians (51.5 per     downtown and the Portuguese
up of unrelated people,                cent) identified as belonging      and Italian neighbourhoods
and almost one-third of all            to a visible minority group,       on the west side of the city,
families with children are             the first time this figure has     show some of the densest
lone-parent families. 6                ever surpassed 50 per cent.11      populations who speak neither
                                                                          of Canada’s official languages.14
The aging population has               Appreciating the full diversity    For example, in some parts
also created a stark shift in          of Toronto can be difficult, but   of north Scarborough, over
the social makeup of the city.         mapping the kaleidoscope of        25 per cent of residents do
For the first time in history,         languages that make up our         not speak English or French.15
there are more seniors in              city is one way to do it. More
Toronto than children.7 The            than 20 languages comprise         Toronto’s population also
youth population continues to          the top languages spoken in        continues to shift geographically,
grow for now, but the steady           each Toronto neighbourhood,        with rapid growth in the urban
decline in the number of               thanks to ongoing shifting         centre and gradual declines
young children will soon be            immigration patterns.12            in north Scarborough, North
even more noticeable. 8                Mandarin, Spanish, Italian and     York and north Etobicoke.
                                       Portuguese are widespread,         Condominium development is
Toronto’s diverse population           well-established languages         a key driver in this process, as
has always been a strength,            across Toronto. Tamil and          much of the growth matches

10 | Toronto's Changing Demographics                                            VITAL SIGNS REPORT 2017/ 18
larger-scale condominium barely one person in 30 lives one in two for newcomers
developments on the central below Statistics Canada’s and for some ethno-cultural
waterfront, in south Etobicoke poverty line (the Low Income groups.17 The patterns of
and along the Yonge Street, Measure), while in others, two poverty continue to reflect the
Bay Street and Sheppard out of every three residents worrying divide that faces our
Avenue corridors. live in poverty.16 The situation city, with far more people living
is even starker for children: with low incomes in the inner
While Toronto is a wealthy city, more than one in four children suburbs than in the city’s core.18
the level of wealth inequality live in poverty in Toronto, and
can be striking. In some areas, that number rises to almost
Census Metropolitan Area (Toronto Region)
and the Greater Toronto Area Lake Simcoe
Georgina Brock
West
Tecumseth
Gwillimbury
Mono Beeton
Bradford
Tottenham East Gwillimbury
Orangeville
York
Uxbridge
Newmarket
Scugog
King Aurora
Caledon Whitchurch
Stouffville Durham
Peel Richmond
Hill
Vaughan Markham Pickering Whitby
Oshawa Clarington
Brampton Ajax
Halton Hills
Toronto
Halton Mississauga Lake Ontario
Milton
Oakville
Census Metropolitan Area Boundary Greater Toronto Area Boundary
Burlington
VITAL SIGNS REPORT 2017/ 18 Toronto's Changing Demographics | 11TORONTO'S 140 NEIGHBOURHOODS
(as recognized by the City of Toronto)
STEELES AVE.
Westminster-
Mount Branson
Olive- Newtonbrook Newtonbrook
Silverstone- Humber Summit Black Creek West East
Jamestown York University
Heights
Humbermede Willowdale
Thistletown-
Bathurst West
Beaumond Willowdale
Heights Glenfield-Jane Manor East
Heights
Rexdale- Lansing-
West Humber-Clairville
Kipling Westgate
Elms-Old
Rexdale Clanton St. Andrew
Downsview-Roding-CFB Park
Bedford
Pelmo Park-Nortown
Park-Humberlea
Maple Englemount-
Kingsview Rustic Lawrence Lawrence Park
Leaf
Village-The North
Westway Weston Yorkdale- Bridle Pat
Glen Park Sunnybroo
Humber Brookhaven- Lawrence Park York Mill
Heights- Amesbury South
Willowridge-Martingrove
West-
HWY 401
-Richview Mount Briar
mount Beechborough- Forest Hill
Mount
Dennis Greenbrook Hill-Belgravia North
Pleasant
Princess- Edenbridge- Yonge- West
Rosethorn Humber Valley Keelesdale- Caledonia- Oakwood Eglinton
Eglinton Fairbank Village Forest Mount
Eringate-Centennial- West Hill South Pleasant
Rockcliffe-
West Deane Smythe Humewood- East Leaside
Weston- Cedarvale Benningto
Pelham Corso Italia- Yonge-
Etobicoke Casa St.Clair
West Junction Park Davenport Wychwood Loma
Mall Area Rosedale- Broad
Kingsway Lambton Moore Park Nor
South
HWY 427
Baby High Park Dovercourt-Wallace
Markland Point Emerson-Junction Annex
North
Wood
Dufferin Palmerston- University
North
BLOOR AVE. Islington-City
Stonegate-
High
Park-Swansea
Grove Little Italy
Riverda
Queensway Little
Centre West Trinity- Kensington-
Portugal Bellwoods Chinatown
Moss S
South Park Riv
Parkdale Waterfront
Mimico (includes Humber Niagara Communities
Bay Shores) –The Island
Alderwood
New Toronto Runnymede-
Bloor West Roncesvalles
Long Branch Village
North
St. James Town
Church-Yonge
Corridor
Bay Street
Corridor
12 | Toronto's Changing DemographicsSteeles Milliken
k Bayview Hillcrest
Woods-Steeles Village
L'Amoreaux Agincourt Rouge
Bayview Don Valley North
Village Village
Pleasant
Malvern
View
Henry Farm Tam O'Shanter- Agincourt
HWY
Sullivan South-Malvern
West 401
w-Windfields
Morningside
Highland Creek
Parkwoods
Donalda
Dorset Bendale Woburn Centennial
Banbury- Park Scarborough
th- Don Mills Wexford-
ok- Maryvale
ls Victoria West Hill
Village
Lonview
Eglinton East
Guildwood
Thorncliffe
Flemingdon
Park Scarborough
EGLINTON AVE.
Park Clairlea- Kennedy
e Village
Birchmount Park
on O'Connor-
Parkview
Cliffcrest
Old East York
dview
rth Danforth– Woodbine-
East York Lumsden Taylor-
Danforth Massey Oakridge
Blake- Woodbine East
h
Corridor End-Danforth
ale Jones Birchcliffe-
Cliffside
Greenwood-
Coxwell
The Beaches
South
verdale
VICTORIA PARK AVE.
NN
Census
CensusMetropolitan
MetropolitanArea
Area(Toronto
(TorontoRegion)
Region)
and
andthe
theGreater
GreaterToronto
TorontoArea
Area
Playter Estates-
Danforth Lake
LakeSimcoe
Simcoe
Cabbagetown-
South St.
James Town
Regent Park
York
York
Durham
Durham
Peel
Peel
Toronto
Toronto
Halton
Halton Lake
LakeOntario
Ontario
Toronto's Changing Demographics | 131
ARTS &
CULTURE
Too often people think of art narrowly — as a personal activity, as
experiences for individual artists or as audience members. But arts
and culture industries are important driving forces behind Toronto’s
economy. The economic benefits generated through theatre, film,
music, visual arts and community arts industries are a significant
contributor to Ontario’s gross domestic product (GDP).19,20,21
Additionally, the arts enhance our sense of well-being, connectedness
and civic pride. 22 Engaging people actively in art and creation is a
key part of sharing and fostering culturally vibrant communities. The
arts have a positive impact on social integration, as well as personal
and community development. And in a multicultural city, those
benefits should be a part of everyone’s lives.
Toronto is the powerhouse to artists per capita. Toronto
of Ontario’s arts and culture ranks third, compared to other
industries, contributing $11.3 major Canadian cities in terms
billion to Ontario’s GDP in 2011. 23 of concentration of artists, with
Based on the 2011 National 1.76 per cent of the population
Household Survey, Toronto is deriving their income from the
home to 23,700 professional arts, compared to Victoria at
artists — more than any other 2.36 per cent and Vancouver
city in Canada. 24 at 2.32 per cent. 25
However, Toronto trails behind Recent analysis on arts and
other major cities when it comes culture spending reveals that
14 | Arts & Culture VITAL SIGNS REPORT 2017/ 18“Investment in the arts is good for
investments in Toronto’s arts
sector show positive returns quality of life in Toronto, and it is a
for the city’s economy overall.
For every dollar Toronto invests
source of significant economic growth.”
in its arts, the city brings back
$8.26 in earned revenue. 26
Investment in the arts is good
for quality of life in Toronto,
and it is a source of significant
economic growth. Participating in arts and cultural Participation in the arts varies
events provides many benefits widely by geography. According
Despite this, Toronto has one of to Torontonians: it brings family to a survey commissioned by
the lowest rates of municipal arts and friends together, it is the Toronto Arts Foundation in
funding per capita, compared to entertaining and intellectually 2015, almost 60 per cent of
other cities. While per capita stimulating and it can be downtown residents reported
funding reached $22.38 in 2014, 27 inspiring and motivational. attending arts performances,
city council must increase the Attending or participating in and 50.5 per cent reported
2018 budget by $2 million in order cultural activities is associated visiting cultural locations such as
to reach the long-standing goal of with many major indicators of museums, galleries and concert
$25 per capita. 28 Even so, Toronto health and well-being, including halls. 31 Residents in Scarborough
will continue to lag behind the better overall heath, mental (36.8 per cent) and Etobicoke
2009 per-capita arts funding health and life satisfaction. 30 (36.4 per cent) were far less
levels of other major cities such as However, not all Torontonians likely to attend cultural events,
Montreal ($55), Vancouver ($47), have equitable access to the compared to other regions
Calgary ($42) and Ottawa ($28). 29 arts and their benefits. within the City of Toronto. 32
VITAL SIGNS REPORT 2017/ 18 Arts & Culture | 15Arts Events Attendance by Demographic Group, 2015 Other socio-demographic
characteristics are also shown
100 to have a significant impact
on participation in the arts.
90
Over 85 per cent of households
80 with incomes above $100,000
attend arts events, compared
70
to 70 per cent of households
60 with incomes below $100,000.
50
Women (73.9 per cent) are
significantly more likely than
40 men (68.2 per cent) to attend.
30
Immigrants (72.3 per cent)
are slightly more likely than
20 Canadian-born Torontonians
10
(70.8 per cent) to visit arts
events. 33
0
Household Household Immigrant Canadian Male Female
Income Income Born Unfortunately, there are several
under $100K over $100K issues that affect who can
UNITY Charity uses hip hop to improve young people’s lives.
16 | Arts & Culture VITAL SIGNS REPORT 2017/ 18participate in the arts in Toronto.
Nearly nine in 10 Torontonians
experience barriers to attending
arts events (88 per cent). Most
cite cost (55 per cent), lack of
information (37 per cent) and
lack of time to participate (34
per cent) as the major barriers. 34
CITY VOICES
Proximity also plays a major
role in whether people attend Faduma Mohamed
arts and cultural events. In 2016, at Jane and Falstaff
31 per cent of Torontonians While there is a noticeable
indicated that they do not amount of funding that goes
attend cultural events because to promoting and supporting
they are too far from where they the arts in Toronto, artists
live, and 26 per cent said it was themselves face many
because they lacked quality challenges when compared
events in their neighbourhood. 35 to other professions. Growing
up at Jane Street and Falstaff Avenue without a TV or computer,
While there are consistent Faduma had no choice but to get creative. “I began writing out
inequities in terms of who of sheer boredom. There was really nothing else to do.” Faduma
credits her brother, who lives with autism, with deepening her
can afford the time and
empathy and teaching her how to put emotions into her writing.
money to participate in the
“He’s non-verbal,” she explains. “You have to learn new methods
arts, Toronto is home to many
of communicating, but more importantly, you have to learn new
strong community-based arts methods of understanding.” By her late teens, Faduma was
organizations that are working regularly sharing her writing at school, and in her first year of
hard to reduce these barriers. university, she began performing spoken word poetry with RISE
Toronto Arts Foundation’s Arts Edutainment, a Scarborough-based performing arts collective.
in the Parks is a good example
of how location and cost Since then, Faduma has worked with Unity Charity and performs
can help overcome barriers throughout the city. At age 24, Faduma feels fortunate to make
to participation in the arts. a living through spoken word poetry, but still faces challenges.
Like many artists, she is sometimes asked to perform for less
Arts in the Parks is a partnership than the fee she charges, or for free in exchange for exposure.
“Exposure won’t help me put food on the table,” she says. She
initiative with the Toronto Arts
also feels that increasing awareness of existing resources would
Council, City of Toronto and
help up-and-coming Toronto artists thrive. “I know that there
the non-profit group Park
are supports available for artists, but my questions are: ‘Where
People, which helps volunteers are the opportunities, and how do people get access?’” Adds
animate and improve parks. Faduma: “Just not knowing is a barrier in and of itself.”
The program encourages
community-building, enjoyment
of local parks and offers arts
events throughout the city.
VITAL SIGNS REPORT 2017/ 18 Arts & Culture | 17“Our biggest challenge is lack of access to
the arts, including available and affordable
spaces and the need for more arts and culture
opportunities outside the downtown core.”
In 2016, 34,000 Torontonians of the city where the arts event and collectives, and 25 per cent
enjoyed free arts events in was being held. 38 of applications from individuals.41
their local parks. 36 With the TAC investments in community-
support of approximately 250 The City of Toronto flows 60 based arts grew by $1.4 million
volunteers, more than 55 parks per cent of its cultural funding in the last four years, topping
hosted dance, music, film and through the Toronto Arts $2.2 million in 2016.42
theatre performances, as well Council (TAC), which then
as temporary installations. 37 administers it to artists and The City of Toronto’s Arts and
Offering arts events in parks arts organizations. 39 In 2016, Cultural Services also delivers
brings people together and TAC awarded approximately some grant programs directly.
fosters a stronger sense of $12.5 million to organizations In 2017, 10 organizations
community. It also brings the and collectives, and another received a total of $7.9 million
arts closer to communities $2 million to individual in funding through the Major
with less access, increasing artists.40 While TAC is able Cultural Organizations program.
attendance in those areas. to prioritize and fund the Grants were awarded to many
vast majority of operational major institutions such as the
There are higher participation funding requests across Art Gallery of Ontario, Canada’s
rates in inner-suburban Toronto, smaller organizations National Ballet School and
communities such as Rexdale and individual artists face the Toronto International Film
and Fairview when local arts a much more competitive Festival and also to community
events are held nearby. A funding environment. In 2016, arts programs such as Pride
survey of 725 attendees at TAC supported 97 per cent Toronto, Luminato and the
30 events in 23 different parks of applications for operating Toronto Caribbean Carnival.43
found that the majority (79 funds, but only 47 per cent Another $1.7 million was
per cent) of attendees live in of applications for projects allocated through the Local
the neighbourhood or region supported by organizations Arts Service Organizations
program.44
18 | Arts & Culture VITAL SIGNS REPORT 2017/ 18CITY
VOICES
Claire Hopkinson
Director and CEO,
Toronto Arts Council
Our biggest challenge is lack of access to
the arts, including available and affordable
spaces and the need for more arts and culture
In addition to providing grants opportunities outside the downtown core.
More resources are needed to support arts
for arts and culture, the city
initiatives at a local level, as well as more
spends $47.8 million producing
incentives to create arts hubs, including
festivals and events, delivering
supportive changes to municipal tax policy.
and supporting community
activities, classes, events and We need to recognize the contribution arts
exhibits, and managing art venues make to city-building and better understand
and public art.45 how investment in the arts creates a more
connected and dynamic city.
While there is a noticeable
amount of funding that goes Arts organizations and artists living and
to promoting and supporting the working throughout Toronto contribute to an
arts in Toronto, artists themselves important diversity of arts practices in our city.
face many challenges when Many areas outside the downtown core are
arrival communities and home to newcomers
compared to other professions.
and refugees, many of whom bring their arts
On average, Canadian artists
practices with them, further enriching our city.
made 32 per cent less than the
The Toronto Arts Council, Toronto Arts
average income of all working Foundation and the City of Toronto value the
people in Canada in 2011. They power of the arts and develop policies in
are also more than twice as likely response to the sector’s needs and to support
to work two jobs and more than arts in every neighbourhood.
three times as likely to be
self-employed.46 Overall, I would give us high marks for support
for arts access and programming throughout the
city, but a mediocre grade for lack of affordable
arts and culture spaces.
VITAL SIGNS REPORT 2017/ 18 Arts & Culture | 192
ENVIRONMENT
Residents and visitors alike celebrate Toronto’s green spaces. Our
abundant parks, rivers, ravines, and our glorious Great Lake and
tree canopy all contribute to a green and natural setting that makes
Toronto a uniquely welcoming city. However, with worrisome levels
of air pollution and rapidly accelerating climate change, the physical
environment is increasingly under stress, and we risk reducing its
capacity to serve as a positive and important determinant of health.
Climate change in particular is a major challenging reality we face
in Toronto. In addition to the devastating storms we see on the news,
changing weather patterns also causes more frequent extreme
temperatures, ice storms, heavy rains and flooding, all of which
pose risks for the immediate and long-term health and well-being
of Torontonians.
Toronto has seen some while Toronto has seen progress
significant progress in air quality over the past decade with
over the past few years. In 2014, smog, air quality is still a
Toronto experienced the first concern in Toronto, compared
year without any smog advisory to other parts of Canada. Fine
days in over a decade. This is a particulate matter is a core
stark comparison to just nine component of smog and is
years earlier, where 14 smog associated with higher rates of
advisories were issued over cardiovascular and respiratory
48 days in 2005.47 However, disease. Based on 2014 data,
20 | Environment VITAL SIGNS REPORT 2017/ 18TORONTO'S FUTURE WEATHER
and those without cooling
systems to prevent health-
threatening temperatures.
Intense rainfall can cause
DAILY DAILY
TEMPERATURE EXTENDED RAINFALL pollution levels to rise, as it
HOT DAYS
MAXIMUM HEAT WAVES MAXIMUM overwhelms the sewer system
44o 66 2.5 166 and pushes contaminants into
our lakes and rivers.
celsius above 30o per year millimetres
2040-50 2040-50 2040-50 2040-50 Toronto is seeing some
improvements in the amount
37o 20 0.6 66 of household waste being
2000-09 2000-09 2000-09 2000-09 produced and sent to landfill.
Toronto’s overall residential
*Source: Toronto's Future Weather and Climate Driver Study, 2011
diversion increased to 52
per cent from 44 per cent
between 2008 and 2016, and
it was projected to remain at
annual averages for Toronto Toronto’s analysis of the impact 52 per cent in 2017. 51 The City
areas ranged from 8.7 to 9.8 of climate change predicts of Toronto passed the Long-
micrograms of fine particulate significant risks to health, with Term Waste Management
matter per cubic metre.48 This a four-fold spike in heatwaves, strategy in July 2016, which
is considerably higher than the a tripling of high temperature sets long-term targets for
Canadian national average of days and more than a doubling waste diversion, prevention
7.7 micrograms per cubic metre. of rainfall volumes over the next and recycling. The plan expects
These figures also come close to 20–30 years. 50 Extreme heat that by 2026, 70 per cent of
Environment Canada’s national can be dangerous for seniors, the waste generated by
standard limit of 10 micrograms young children, people households will be diverted
per cubic metre.49 experiencing homelessness from landfills. 52
VITAL SIGNS REPORT 2017/ 18 Environment | 21“Green space is One of the many assets that energy use and make urban
makes Toronto a liveable city environments esthetically
an important is the amount of green space pleasing. Tree canopies have
and natural environments been associated with reducing
component for residents to enjoy. blood pressure and stress
of building a Several studies show that levels56,57 and promoting active
exposure to green spaces living. 58 One Toronto-based
healthy natural can be psychologically and study found that the benefits
environment in physiologically restorative,
promoting mental health53,54
of planting 10 more trees per
city block are comparable to
Toronto.” and reducing illness and the positive health effects of
mortality rates. 55 increasing the income of every
household in that city block
Green space is also an by $10,000. 59
important component of
building a healthy natural In 2013, Toronto had about
environment in Toronto. one-quarter of forest cover60,
City trees improve air quality, but the distribution is not
reduce cooling and heating equal. There is wide variation
Distribution of Forest Cover, City of Toronto, 2009
7% – 18%
19% – 29%
30% – 40%
41% – 51%
52% – 62%
22 | Environment VITAL SIGNS REPORT 2017/ 18in the amount of tree cover
in Toronto neighbourhoods.
Based on data from 2009,
the Rosedale-Moore Park
neighbourhood had the highest
percentage of forest cover at
61.8 per cent, while the Bay
CITY VOICES
Street Corridor and Junction
Area neighbourhoods had the
Since Bob moved from
lowest, both at 6.7 per cent.61
Uganda to Jane Street
On average, the neighbourhoods and Wilson Avenue,
that had the highest percent known as “Chalkfarm,”
of tree coverage also have as a refugee in 2016, he
higher average real estate has witnessed economic
value and incomes.62 despair and violent
crime first-hand. Yet,
he has empathy for
Bob Muwanguzi those who turn to crime
in Chalkfarm due to lack of economic
opportunities. “These
are youth. These are people who’ve been working for
themselves, aiming for a good future to see their lives
Estimated Forest and Land Cover better,” says Bob. Like many people in the area, Bob
in the City of Toronto, 2009 knows the frustration of unemployment, as he struggles
to find work despite a wealth of experience. “I feel like
my hands are cut off. I want to do something,” he says.
For Bob, Toronto’s trees are a missed economic and
environmental opportunity. In Uganda, mango trees
and other fruit-bearing plants grow everywhere, and
their fruit is available to everyone. Bob envisions a
Toronto where public land is used to grow fresh fruits
and vegetables, economically marginalized people are
hired to harvest the food, and all Torontonians have
access to fresh, healthy foods. Despite not yet being
able to work, it is Bob’s love for Canada that drives his
vision. “I can still be someone who will make an impact
on my community.”
Forest cover 26.6% Road 9.3%
Grass 21.3% Water 1.6%
Building 20.1% Soil 1.4%
Impervious other 18.5% Agriculture 1.3%
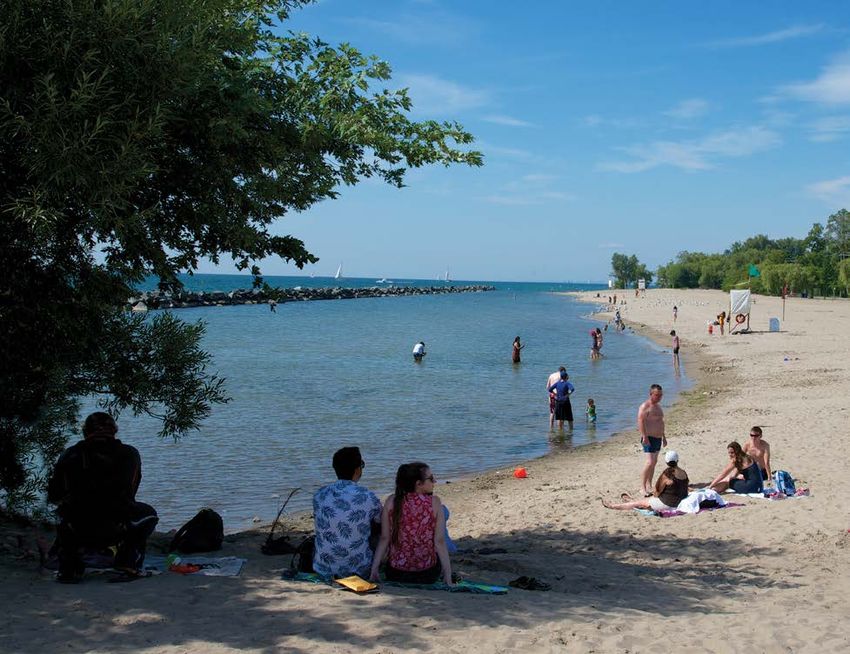
VITAL SIGNS REPORT 2017/ 18 Environment | 23Toronto’s beaches are a widely A 2015 study found that living One way people are adapting
appreciated feature of our city,63 near multiple roads can expose to the effects of climate change
especially for those who don’t a person to up to 10 times in Toronto is through consistent
have the means to leave the more pollutants than not living and effective home cooling
city in the summer, as they are near major roads.66 Traffic- systems. Yet, those most
a vital public asset for recreation related air pollution has many vulnerable to experiencing
and keeping cool. Yet, in 2017, negative health effects. It can health issues from extreme
there were a total of 91 warnings worsen asthma symptoms and heat — isolated seniors, people
issued on 52 different days result in the onset of asthma in with chronic and pre-existing
because of high levels of E. coli children, in addition to negatively illnesses, children and the
at all 11 of our beaches.64 This is affecting the heart and lungs.67 marginally housed or homeless69
compared to 57 warnings on According to a 2014–15 analysis, — are the groups who are less
36 different days across 10 of residents with asthma were more likely to have access to adequate
our 11 beaches in 2016.65 concentrated in the eastern and housing (let alone housing with
western parts of the city.68 reliable cooling systems),
24 | Environment VITAL SIGNS REPORT 2017/ 18CITY
VOICES
Dr. Faisal Moola
Associate Professor,
Conservation Leadership &
Policy, University of Guelph
Despite a marked decrease in the number of
smog days (due to the closure of the coal-fired
“Toronto residents electricity plants and investment in transit
continue to be exposed and active transportation), Toronto residents
continue to be exposed to unacceptable levels
to unacceptable levels of air pollution, including fine particulates.
We need to: 1. get people out of cars, by
of air pollution, including providing safe, reliable and accessible transit
and infrastructure to promote active forms of
fine particulates.” transportation; and 2. move quickly to fulfill
earlier policy commitments to increase the
forest canopy cover in Toronto to 40 per cent
(it’s currently 26 per cent). Trees help to
mitigate air pollution, thereby reducing the
exposure of local residents to a major driver
of poor health.
either because of family income The distribution of nature in the city is
or due to a lack of affordable not equitable. While Toronto overall is the
housing. Torontonians who live most-forested city in the country, many
in older apartment buildings are neighbourhoods, especially racialized and
lower-income areas, lack a well-developed
also at greater risk due to the
urban tree canopy.
lack of air conditioning. These
buildings are often home to low-
Residents across the city can replace
income residents and those who
impermeable surfaces around their homes
are new to Canada.70 In 2016, with gardens, rain gardens, trees and other
Toronto Public Health issued greening interventions at the local scale.
14 heat alerts and eight extreme Philanthropists can fund community-led
heat alerts, making it one of the urban-greening programs, particularly in
worst years on record.71 those neighbourhoods that lack a well-
developed forest canopy.
VITAL SIGNS REPORT 2017/ 18 Environment | 253
GETTING
AROUND
Effective, efficient and accessible transportation is essential
for any major city’s economic productivity and liveability. From
an economic perspective, having a fast, reliable and efficient
transportation system means that goods, services and resources
reach their destinations and their markets more quickly, which
has a positive impact on productivity and growth.
Access to good transit can also have positive upstream effects
on a city’s health and well-being. When people spend less time
travelling to and from their daily commitments, they can invest
more time in their families, their friends, their neighbourhoods
and themselves.72 This can mean having more time to eat well,
exercise and use healthier modes of transportation such as
biking or walking.
In 2017, the Toronto Transit as compared to other transit
Commission (TTC) won systems in North America.”73
the American Public Despite our award-winning
Transportation Association public transit system, Toronto
Award for Outstanding Public still struggles with traffic
Transportation System, due congestion, equitable transit
to “demonstrated efficiency, access and long commuting
effectiveness, and system times, especially for inner-
improvements and investments, suburban residents.
26 | Getting Around VITAL SIGNS REPORT 2017/ 18
Most Common Means of Daily Transportation
“On average, for Torontonians, 2016
Torontonians
spend 34 minutes
commuting to Private motor vehicle 50.6%
Public transit 37%
work, longer than Walking or cycling 11.35%
residents in any Other 4%
other major city
in Canada.”
Toronto is certainly to some On average, Torontonians spend 17.4 per cent who rely on
extent a transit-riding city, 34 minutes commuting to work, public transit. 80 Yet, 30.2 per
with only one-in-five residents longer than residents in any cent of public transit commuters
reporting that they never other major city in Canada and in Toronto spend an hour or
use public transit, and 52 per well above the national average more getting to work every day,
cent reporting using it at least of 26.2 minutes.77 Toronto also compared to only 7.2 per cent
once a month.74 In 2016, the has the highest proportion (16.2 of drivers. Individuals who
TTC provided 538,079,000 per cent) of people who spend rely on active transportation
passenger trips on 161 passenger more than 60 minutes travelling (walking, cycling, etc.) enjoy
lines, including bus, streetcar to work,78 the majority (75.9 the lowest commuting times
and subway lines and the per cent) of whom are public by far, with 80.95 per cent
Scarborough RT.75 transit users.79 spending 29 minutes or fewer
on their daily commute. 81
However, car culture dominates. Those who travel by car enjoy
Use of a private motor vehicle much shorter commute times, Despite a heavy reliance
(50.6 per cent), is the most compared to those who rely on personal vehicles overall,
commonly reported means of on public transit. For those Toronto is also a very accessible
daily transportation in Toronto, travelling by car, truck or van, city for those who can rely on
followed by public transit (37 51.5 per cent spend 29 minutes active transportation. Walk
per cent) and walking or cycling or fewer getting to work on a Score — which measures
(11.35 per cent).76 daily basis, compared to only walkability on a scale from
VITAL SIGNS REPORT 2017/ 18 Getting Around | 27zero to 100 based on walking widely by income. Of those
routes to destinations such as with an annual income of less
schools, parks, restaurants and than $50,000, 24 per cent
retail businesses — rates Traffic congestion also has a big reported taking public transit
Toronto as “very walkable” impact on overall productivity. every day. 87 This compares to
overall, with a score of 71. Toronto’s congestion level only 12 per cent of people with
Toronto is also “the 2nd most results in 30 per cent extra incomes between $50,000
walkable large city in Canada,” travel time, when compared and $99,000 and 11 per cent
after Vancouver. 82 with an uncongested situation. of those who earn more than
On average, this results in 34 $100,000 annually. 88 Moreover,
According to the TomTom extra minutes of travel time per the majority (53 per cent) in
Traffic index, which uses real- day or 130 hours per year. 86 the highest income bracket
time GPS data to measure reported using public transit
congestion, Toronto ranked Affordable and efficient less than once a month or never.
73rd out of 390 cities worldwide transportation is a key factor The same poll found similar
in 2016 for the most congestion in the liveability of a city or patterns among age groups:
amongst cities with populations neighbourhood. Accessing 26 per cent of those 18–34 rely
greater than 800,000. 83 When reliable and cost-effective on public transit, compared to
compared to other global transportation is necessary 12 per cent of those between
cities, 84 Toronto ranked 17th out for all residents of Toronto, 35–54 and 9 per cent of people
of 23. Toronto ranked eighth in regardless of income or over the age of 55. 89 Given that
North America and second in geography, but a 2015 public commute times are longer on
Canada, behind Vancouver. 85 survey of GTA adults suggested average for public transit than
Montreal ranked third in Canada, that transportation options vary travel by car, this data suggests
while Calgary came in fifth.
Reported Transit Use by Income Group, 2015
Incomethat those with lower incomes
are the ones spending more of
their time commuting.
While more people with lower
CITY VOICES
incomes are opting for public
transit, affordability of public
transit in Toronto is a concern.
Fares have risen every year
between 2015 and 2017.
According to a City of Toronto
staff report, a monthly adult
transit pass for a low-income
family of four may cost them
between 19 per cent and 35
per cent of their after-tax/
after-rent income.90
Edith Usiobaifo
While the TTC does currently in Kingston-Galloway-Orton Park
issue discounts for seniors and
students, and children aged 12 In order to get to work every day, Edith must stick
and younger now travel for free, to a razor-sharp schedule. She wakes up at 4:30
many adults on low incomes a.m. and is out the door by 6:00 a.m., first dropping
struggle to afford paying for off her son, 8, at daycare. She then walks 20
minutes to the GO station and takes the train to
public transit. Because there
Ajax. Finally, the bus takes to her workplace. On the
is no discounted rate for low-
best days, she travels for a total of six hours —
income working age adults
three hours in the morning, and three to get back
(between the ages of 20 and
home in the evening. But when the weather is bad,
64), those individuals end up or when the trains are delayed, Edith’s commutes
paying a higher proportion of take nightmarishly long and cuts drastically into
her workday. Since she is paid hourly, she earns less
income on these days. Even worse is when Edith’s
son is sick. No matter how quickly she leaves work,
Edith is never able to rush to her son’s side, as she
must commute for hours to get to him. Edith’s long
journey stresses her out, and that daily grind has an
“Toronto’s congestion effect on her health. “Sometimes I feel tired and I
just want to go to bed early,” she says. “Why?
level results in 30 per Because I need to wake up at 4:30 again.”
cent extra travel time,
when compared with an
uncongested situation.”
VITAL SIGNS REPORT 2017/ 18 Getting Around | 29their overall income on transit, individuals who need to travel public transit trips at 40 per cent,
compared to middle- and high- from Toronto to York Region followed by Parkdale-High Park
income earners. Toronto city would have to pay additional (Ward 14) at 37 per cent.93 These
council adopted a low-income fares in order to reach their findings are unsurprising, as
transit pass policy in principle destination.91 However, beginning public transit is highly accessible
in 2017, but we await the results January 2018, commuters who in terms of both proximity and
of the 2018 budget to see if transfer between GO Transit frequency of service in these
funding will be available to and the TTC receive $1.50 break communities.
make it a reality. on their fares, thanks to a
provincially subsidized co-fare A true understanding of
High fares are especially agreement that will allow riders transportation patterns requires
problematic, considering that who use both agencies on a not only a breakdown of how
those who are living on low single trip to avoid paying two people are travelling, but also
incomes are the ones who rely full-price fares, if using their where they are travelling to
on affordable, accessible and Presto fare card.92 and from. Overall, the greatest
reliable public transit the most, single destination is downtown
especially the working poor. Public transit (either TTC or GO) Toronto, but in the regions
Affordable public transit is an use is more heavily concentrated of North York, Etobicoke and
even bigger issue for individuals in the downtown wards. Based Scarborough, most trips are
who rely on multiple regional on the 2011 Transportation taken locally.94 Toronto’s existing
transit systems in the GTA, Tomorrow Survey, Toronto transportation infrastructure is
where fares are not widely Centre-Rosedale (Ward 28) often seen as a subway system
integrated. For example, had the highest proportion of that funnels travellers
30 | Getting Around VITAL SIGNS REPORT 2017/ 18CITY
VOICES
into the core, but the
majority of riders are Leslie Woo
travelling locally on buses Chief Planning Officer,
that connect them to Metrolinx
destinations within their
own inner suburb. Toronto does not sit as an island in terms of where
Improvements to surface people need to get to and from. Interconnectivity to
routes and designated lanes employment inside and outside of Toronto needs to
would improve travel for be better physically connected, and the fare system
more riders. needs to be more consistent across transit operators.
Our biggest opportunities include regional fare
Active transportation is
integration and a community benefits program linked
a key way that people can
to all transit construction projects, facilitating more
incorporate regular physical
apprenticeships and training in the rapid transit
activity into their daily routines expansion build underway by Metrolinx.
and enjoy the resulting health
benefits. 95 Opting to use Overall, there are four key things residents, policy-
active transportation also has makers and philanthropists can do to improve how
environmental benefits by we get around: 1. Recognize that fare integration is
reducing road congestion and one of the best ways to leverage the multibillion-dollar
vehicle- related greenhouse rapid transit infrastructure build currently underway;
gas emissions. 96 Active 2. Work better at collaboration so that integration of
transportation is far more all modes — walking, cycling, transit car-sharing and
auto use — are treated as a hierarchy of uses, and that
prevalent in the downtown
investments should support that; 3. Recognize that
wards. 97 The vast majority of
evidence-based decision-making that takes the long
Toronto’s most walkable
view allows us to think about future generations and
neighbourhoods are in the the transportation legacy we need to invest in; and 4.
downtown core and along Realize Vision-Zero, a plan to eradicate road fatalities
major east-end roadways. with concrete measures to ensure safer streets.
The neighbourhoods with
the lowest walkability scores
tend to be in inner-suburban
neighbourhoods in Etobicoke
and Scarborough. 98
VITAL SIGNS REPORT 2017/ 18 Getting Around | 31You can also read