FLEGT VPA Partners in EU Timber Trade 2017 - flegt imm

Page created by Jerome Davis
 
CONTINUE READING
FLEGT VPA Partners in EU Timber Trade 2017 - flegt imm
INTERNATIONAL TROPICAL TIMBER ORGANISATION / FLEGT INDEPENDENT MARKET MONITOR (IMM)

 FLEGT VPA Partners
 in EU Timber Trade 2017
 Main RepoRt – November 2018

 Report authors:
 Sarah Storck
 (IMM Lead Consultant)
 Rupert Oliver
 (IMM Trade Analyst)

This report has been produced with the
financial assistance of the European Union

The views expressed herein are those of the consultant and the IMM and
do not necessarily reflect the official opinion of the European Commission
FLEGT VPA Partners in EU Timber Trade 2017 - flegt imm
List of Acronyms
    $           United States Dollar

    €           Euro

    ATIBT       Association Technique Internationale des Bois Tropicaux

    CA          Competent Authority

    CIF         Cost, Insurance and Freight (relates to shipping)

    CIS         Commonwealth of Independent States

    CN          Combined Nomenclature of the EU (relates to trade product codes)

    COMEXT      Eurostat External Trade database

    CPD         Construction Products Directive

    CPI         Construction Production Index

    CPR         Construction Products Regulation

    DRC         Democratic Republic of Congo

    EDB         Ease of Doing Business Index of the World Bank

    ENGO        Environmental non-governmental organisation

    EU          European Union

    EUTR        European Union Timber Regulation

    FAO         UN Food and Agriculture Organisation

    FC          Forestry Commission of Ghana

    FEP         European Parquet Flooring Federation

    FII         Forest Industries Intelligence Ltd

    FLEGT       Forest Law Enforcement, Governance and Trade

    FOB         Free On Board (relates to shipping)

    FRA         Forest Resource Assessment of the UN FAO

    FSC         Forest Stewardship Council

    FTA         Free Trade Agreement

    GATS        USDA Global Agricultural Trade System database

    GCI         Global Competitiveness Index of the World Economic Forum

    GFC         Global Financial Crises

    GFW         Global Forest Watch

    GhLAS       Ghana Timber Legality Assurance System

    GTA         Global Trade Atlas

    has.        Hectares

    HDF         High Density Fibreboard

    HS          Harmonised System (relates to trade product codes)

    IMM         FLEGT Independent Market Monitoring project of the ITTO

2                                                                                  Main RepoRt – November 2018
FLEGT VPA Partners in EU Timber Trade 2017 - flegt imm
List of Acronyms
 ITTO            International Tropical Timber Organisation

 JFSQ            Joint Forest Sector Questionnaire (regularly issued by UN)

 LAS             Legality Assurance System

 LEI             Lembaga Ekolabel Indonesia – sustainable forest management standard

 LIU             Licensing Information Unit

 LVL             Laminated Veneer Lumber
     2
 m               Square meters
     3
 m               Cubic metres

 MDF             Medium Density Fibreboard

 MLH             Mixed Light Hardwood (applied to plywood)

 MO              Monitoring Organisation

 MoEF            Indonesian Ministry of Environment and Forestry

 MS              (EU) Member State

 MT              Metric tonnes (1000 kilograms)

 NTFP            Non-Timber Forest Product

 OSB             Oriented Strand Board

 PEFC            Programme for Endorsement of Forest Certification

 PFE             Permanent Forest Estate (defined by ITTO)

 PHPL            Indonesian Sustainable Forest Management Standard

 PVC             Polyvinyl chloride

 RoC             Republic of Congo

 RWE             Roundwood Equivalent (relates to wood product volumes)

 SFM             Sustainable Forest Management

 spp.            Several species within a genus

 STTC            Sustainable Tropical Timber Coalition

 SVLK            Sistem Verificasi Legalitas Kayu

 TRAFFIC         Trade Records Analysis of Flora and Fauna in Commerce

 UK              United Kingdom

 UN              United Nations

 UNCTAD          United Nations Conference on Trade and Development

 UNEP/WCMC       United Nations Environment World Conservation Monitoring Centre

 USA             United States of America

 USDA            US Department for Agriculture

 VPA             Voluntary Partnership Agreement

 WEF             World Economic Forum

Main RepoRt – November 2018                                                                               3
FLEGT VPA Partners in EU Timber Trade 2017 - flegt imm
Contents

    1.      Introduction                                                                                          6
    1.1     Background                                                                                             6
    1.2     Overview                                                                                               6
    1.3     Scope and definitions                                                                                  7

    2.      VPA implementation and negotiation – state of play                                                     7
    2.1     Overview                                                                                               7
    2.2     Indonesia                                                                                              8
    2.3     Cameroon                                                                                               8
    2.4     Central African Republic                                                                               8
    2.5     Ghana                                                                                                  8
    2.6     Liberia                                                                                                8
    2.7     Republic of Congo                                                                                      8
    2.8     Côte d’Ivoire                                                                                          9
    2.9     Democratic Republic of Congo (DRC)                                                                     9
    2.10    Gabon                                                                                                  9
    2.11    Guyana                                                                                                 9
    2.12    Honduras                                                                                               9
    2.13    Lao PDR                                                                                                9
    2.14    Malaysia                                                                                               9
    2.15    Thailand                                                                                               9
    2.16    Viet Nam                                                                                               9

    3.      VPA country export trade – 2017 update                                                               10
    3.1     Scope                                                                                                 10
    3.2     VPA partner share of global tropical wood-product trade in 2017                                       10
    3.3     Product mix of tropical wood trade                                                                    10
    3.4     Regional supply of tropical wood products                                                             11
    3.5     Changes in regional demand for tropical wood products                                                 12
    3.6     VPA partner countries in global pulp trade                                                            14
    3.7     VPA partner countries in global paper trade                                                           14

    4.      VPA partner competitiveness                                                                          16
    4.1     Relative international competitiveness of VPA countries                                               16
    4.2     EU trade perceptions of VPA implementing partners’ competitiveness                                    18
    4.2.1        Overall competitiveness                                                                          18
    4.2.2        Indonesia’s competitiveness against separate indicators                                          18
    4.2.3        Cameroon’s competitiveness against separate indicators                                           20
    4.2.4        Ghana’s competitiveness against separate indicators                                              20
    4.2.5        Republic of Congo’s competitiveness against separate indicators                                  21
    4.2.6        Central African Republic’s competitiveness against separate indicators                           21
    4.2.7        Liberia’s competitiveness against separate indicators                                            21
    4.3     Trends in substitute products from non-VPA countries                                                  22
    4.4     Willingness to pay price premiums for FLEGT-licensed timber                                           24

    5.      Indonesia: Market position and prospects                                                             25
    5.1     Indonesia market scoping study                                                                        25
    5.1.1        Background to scoping study                                                                      25
    5.1.2        Indonesia trade survey results                                                                   25
    5.1.3        Progress in sustainable forest management                                                        27
    5.2     Direct impact of fees and administration of FLEGT-licensed timber                                     28
    5.2.1        Fees for processing FLEGT-licensed timber                                                        28
    5.2.2        Procedures for importing FLEGT-licensed timber                                                   28
    5.2.3        Average time for EU Member State CAs to verify FLEGT licences                                    29
    5.3     Indonesia market position in the EU in 2017                                                           31
    5.3.1        Data sources and analysis of data discrepancies                                                  31
    5.3.2        Indonesia EU trade flow trends in 2017                                                           31

    6.      VPA partners in EU timber trade                                                                      32
    6.1     EU market conditions in 2017                                                                          32
    6.1.1        Overview                                                                                         32
    6.1.2        GDP growth                                                                                       32

4                                                                                         Main RepoRt – November 2018
FLEGT VPA Partners in EU Timber Trade 2017 - flegt imm
Contents

  6.1.3          Construction sector                                                               32
  6.1.4          Wood joinery sector                                                               33
  6.1.5          Furniture manufacturing                                                           34
  6.1.6          Exchange rates                                                                    34
  6.2       VPA partner share of total EU wood product import value                            36
  6.3       VPA partners in EU log supply                                                          37
  6.4       VPA partners in EU sawn wood supply                                                38
  6.5       VPA partners in EU mouldings and decking supply                                        41
  6.6       VPA partners in EU veneer supply                                                   42
  6.7       VPA partners in EU plywood supply                                                      43
  6.8       VPA partners in EU composite-panel supply                                          46
  6.9       VPA partners in EU wooden window supply                                            46
  6.10      VPA partners in EU wooden door supply                                              48
  6.11      VPA partners in EU supply of modern Engineered Wood Products (EWPs)                49
  6.11.1         EWP scope                                                                         49
  6.11.2         Emerging opportunities for EWPs                                                   49
  6.11.3         Challenges of accessing EWP markets                                               50
  6.11.4         Limited EWP market data                                                           51
  6.11.5         VPA Partners in EU glulam supply                                                  51
  6.11.6         VPA Partners in EU LVL supply                                                     52
  6.11.7         VPA Partners in EU CLT supply                                                     53
  6.12      VPA partners in EU real-wood flooring supply                                           53
  6.13      VPA partners in EU wood-furniture supply                                               55
  6.14      VPA partners in EU pulp supply                                                         57
  6.15      VPA partners in EU paper supply                                                    58

  7.        Implementation of the EU Timber Regulation                                         60
  7.1       Overview                                                                           60
  7.2       Application of EUTR compliant due diligence systems by operators in MS             60
  7.3       Sanctions imposed on/prosecution of non-compliant operators                            63
  7.4       Recognition that FLEGT-licensed timber requires no further due diligence           64
  7.5       Perceptions of EUTR impact                                                         64

 8.         Perception of FLEGT VPAs in the EU                                                 65
  8.1       Awareness of FLEGT VPAs within the EU timber trading chain                         65
  8.2       Number of positive, negative and neutral media references to FLEGT VPAs            65

 9.         FLEGT-licensed timber in EU wood promotion                                         68
10.         FLEGT and voluntary private sector timber procurement policies                     69
 10.1       Overview                                                                           69
 10.2       Role of FLEGT-licensed timber in private sector procurement                        69

 11.        EU Member States public procurement policies                                       70
 11.1       State of play in key EU countries monitored by IMM                                 70
 11.1.1          European Commission guidance relevant to FLEGT in public procurement              71

12.         Recommendations                                                                    72
 12.1       Recommendations for future IMM monitoring                                              72
 12.2       Recommendations for FLEGT licence market development                                   72

Annex 1: Summary of Ghana 2017 Report                                                          74
Annex 2: European scoping studies                                                              75
A2.1        Methodology and sample                                                                 75
A2.2        Summary of results in all key countries                                            76
A2.3        EU scoping studies – 2017 market trends in key EU countries                        78
 A2.3.1          Belgium                                                                           78
 A2.3.2          France                                                                            79
 A2.3.3          Germany                                                                           80
 A2.3.4          Italy                                                                             80
 A2.3.5          Netherlands                                                                       81
 A2.3.6          Spain                                                                             81
 A2.3.7          United Kingdom                                                                    82

Main RepoRt – November 2018                                                                         5
FLEGT VPA Partners in EU Timber Trade 2017 - flegt imm
1   Introduction
    1.1 Background                                                                  estimates, respondents to the IMM 2017 trade survey of EU
                                                                                    companies accounted for about 75-80 % of annual tropical
    The Independent Market Monitoring (IMM) mechanism                               wood product imports (HS 44) into Belgium, France and the
    was established under a project of the International                            UK and around 50-60% in Germany. In the Netherlands,
    Tropical Timber Organization (ITTO) funded by the                               the correspondent estimated that around 40% of plywood
    European Union (EU) to support the implementation                               imports and 65% of sawn timber products and roundwood
    of bilateral voluntary partnership agreements (VPAs)                            were covered through the interviews. Coverage in Spain
    between the EU and timber-supplying countries.                                  (30%) and Italy (20%) was lower, primarily because the
                                                                                    markets are more fragmented.
    VPAs are a key element of the EU’s Forest Law
    Enforcement, Governance and Trade (FLEGT) Action Plan,                          Sections 2 of the Report focuses on the state of VPA
    which defines the EU’s policy for promoting legal logging                       implementation and negotiation in all VPA partner countries
    and the trade of legally harvested timber. A VPA specifies                      and section 3 provides an update on the share of VPA partner
    commitments and actions by both signatory parties with                          countries in global tropical timber trade in 2017.
    the aim of developing a timber legality assurance system
    and the issuance of FLEGT licences that certify the legality                    VPA partner competitiveness (Section 4) is analysed in
    of timber and timber products for export to the EU.                             more detail than in previous reports, taking into account
                                                                                    not only international indices of competitiveness but also
    IMM monitors the flow of FLEGT-licensed timber to the                           IMM EU 2017 trade survey results and an EU Furniture
    EU and its use and acceptance in the EU market. For more                        Sector Scoping Study 1 commissioned by IMM in early 2018.
    details on IMM, visit www.flegtimm.eu.
                                                                                    FLEGT-licensed timber is still a relatively new market
    1.2 Overview                                                                    reality and licensed timber is currently available from
                                                                                    only one country. As a result, assessing market impacts
    This IMM report is the first to cover a period during                           and acceptance remains difficult. An attempt to shed
    which FLEGT-licensed timber was available on the                                some light on initial developments is made in Section 5
    EU market, after Indonesia started issuing licences in                          of this report, which updates last year’s EU-Indonesia
    November 2016. It is also the first when IMM had access to                      trade analysis and summarises findings of a scoping study
    a full network of country correspondents in the seven EU                        conducted by the Indonesian IMM correspondent.
    countries accounting for the bulk (i.e. consistently around
    90%) of EU tropical timber and timber product imports                           Sections 6-11 of the IMM Annual Report focus on the
    from VPA partner countries. The seven “key” EU markets                          European markets. In section 6, the report updates key
    are Belgium, France, Germany, Italy, Netherlands, Spain                         trade data contained in the previous IMM report “FLEGT
    and the UK. IMM also had a correspondent in Indonesia,                          VPA Partners in EU Timber Trade 2014-2016”, which
    the only FLEGT-licensing country, and Ghana, the                                considered EU-VPA Partner trade flow trends during that
                                                                                           2
    country most likely to start FLEGT-licensing in the                             period . As far as possible, this report does not duplicate
    foreseeable future.                                                             analysis in the previous report, but rather updates trade
                                                                                    data and includes a commentary on market trends in the
    Expansion of the IMM network and the actual availability                        2017 reporting period.
    of FLEGT-licensed timber on the EU market means that
    this report not only updates pilot research on perception                       The analysis of trade flows between VPA Partner
    of FLEGT VPAs and FLEGT-licensing that was conducted in                         countries and the EU contained in this report may be read
    Germany, Spain and the UK in 2015, but expands coverage                         in conjunction with the IMM Data Dashboard (http://
    to the four additional EU markets.                                              www.stats.flegtimm.eu/). The Dashboard provides data
                                                                                    visualisations and full access to statistics on EU imports of
    The surveys conducted in 2017 also had a much broader                           timber, paper and pulp from the 15 VPA partner countries.
    scope, in terms both of content and target audience.                            To facilitate broader market analysis, the IMM Data
    European IMM correspondents interviewed 126 companies,                          Dashboard also provides statistics on other countries
    the FLEGT/EUTR Competent Authorities in all seven                               which are leading suppliers of tropical timber into the EU
    countries as well as 15 EUTR Monitoring Organisations and                       and detailed technical explanation of data sources and
    timber trade federations. According to correspondents’                          validation procedures used by IMM.

    1
      European Union Furniture Sector Scoping Study. Author: George White. ITTO/IMM 2018
    2
      FLEGT VPA Partners in EU Timber Trade 2014-2016. (ITTO/IMM 2017) http://www.flegtimm.eu/images/2015_report/VPA_Partners_In_EU_Timber_
      Trade_2014_to_2016_IMM_Main_Report_Final.pdf
    3
      The ‘level of exposure’ is a rough measure to identify gaps in forest coverage of independent certification and legality verification systems. It is based
      on the percentage area of certified or legally verified commercial forest area in each individual supplier country. For example, if 40% of its forest area
      is known to be independently certified or legally verified, the level of exposure of a country’s wood production and exports is also assumed to be
      40%. The certified/verified forest areas are calculated by comparing data from the various certification and verification systems with UN FAO figures
      for areas of productive forest land.
    4
      The 28 EU member countries in July 2018 are Austria, Belgium, Bulgaria, Croatia, Cyprus, the Czech Republic, Denmark, Estonia, Finland, France,
      Germany, Greece, Hungary, Ireland, Italy, Latvia, Lithuania, Luxembourg, Malta, the Netherlands, Poland, Portugal, Romania, Slovakia, Slovenia,
      Spain, Sweden and the United Kingdom.

    6                                                                                                                      Main RepoRt – November 2018
FLEGT VPA Partners in EU Timber Trade 2017 - flegt imm
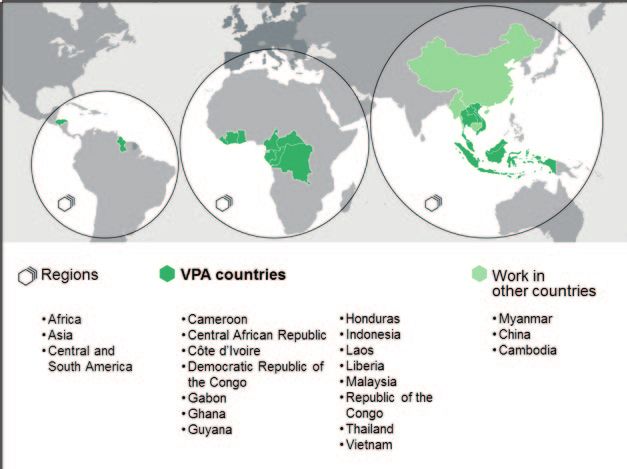
Section 7 looks into EUTR implementation and                    The same is true for an estimate of the volume and value
enforcement in the EU Member States, while sections 8           of timber imports from non-VPA countries considered
and Annex 2 consider market perceptions of FLEGT-VPAs           potentially high risk from a perspective of illegal logging.
and initial market reception in the EU, based on results of     Here, IMM is still fine-tuning the methodology and
the IMM 2017 European trade survey.                             resolving data access issues.

In section 9-11, the report provides preliminary comments       1.3 Scope and definitions
on the market position of FLEGT licensing in relation
to private sector legality verification and certification       The report covers all products within the scope of
initiatives and takes an initial look at FLEGT-licensed         existing or potential future VPAs and includes the
timber in EU wood promotion activities. Those issues will       following chapters (and parts thereof) of the international
be analysed in more detail with dedicated special studies       Harmonized Commodity Description and Coding System:
in 2018 or early 2019.                                          all products in Chapter 44 (Wood); products identified as
                                                                containing wood in Chapter 94 (Furniture); virgin wood-
Drawing on research carried out by the Ghana                    based pulp products in Chapter 47 (Pulp); and all products
correspondent and updating a pilot study conducted in           in Chapter 48 (Paper). Collectively, wood and wood
2015, Annex 1 of the report provides insights in the state of   furniture are referred to here as wood products and dealt
play of VPA implementation in Ghana.                            with separately from pulp and paper.

The report concludes with recommendations for future            The report focuses on the trade between the 28 EU member
monitoring by IMM and for FLEGT-related activities.             countries4 and the following 15 tropical timber-supplying
                                                                countries at various stages of the VPA process in December
Unlike the previous report (ITTO/IMM 2017), this report         2017 which are collectively referred to as VPA partner
does not cover forest sector trends in VPA partner countries.   countries:
The analysis of forest area data will be updated by IMM at a
five-year interval. FLEGT impact on forest sector investment    ̋ FLEGT licensing: Indonesia.
will be looked at in detail by a separate scoping study to be
commissioned during the second half of 2018 or in early 2019.   ̋ VPA-implementing: Cameroon, Central African
                                                                  Republic, Congo, Ghana, and Liberia.
The report also does not feature an update on the level of
“exposure”3 of EU timber and timber product imports to          ̋ VPA-negotiating countries: Côte d’Ivoire, the
certification or legality verification. The exposure measure      Democratic Republic of the Congo (DRC), Gabon,
will be updated later in 2018 or early 2019 when IMM has          Guyana, Honduras, the Lao People’s Democratic
obtained better-quality data from certification schemes.          Republic (Lao PDR), Malaysia, Thailand and Viet Nam.

VPA implementation and                                                                                                             2

negotiation – state of play
                                                                                            2.1 Overview

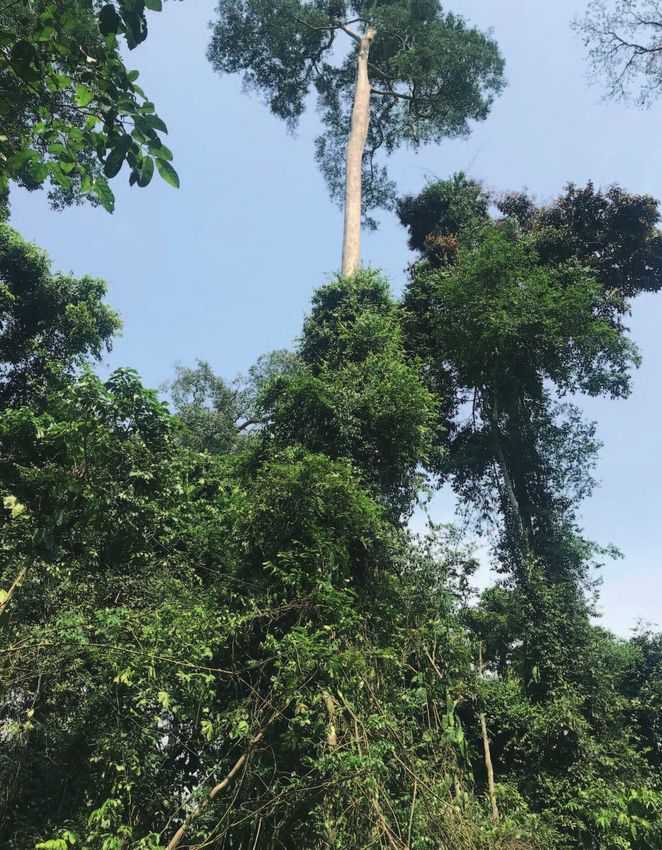
                                                                                            In 2017, the FLEGT VPA
                                                                                            initiative involved programmes
                                                                                            in 15 tropical countries, which
                                                                                            together supplied over 80%
                                                                                            of the international tropical
                                                                                            timber trade, by value. While
                                                                                            the time taken by countries to
                                                                                            reach the licensing stage has
                                                                                            been a focus for criticism, a long
                                                                                            lead time is inevitable for an
                                                                                            initiative which aims to create
                                                                                            robust and reliable systems,
                                                                                            to engage with and secure
                                                                                            the support of a wide range of
                                                                                            stakeholders and to deal with
                                                                                            complex political and technical
                                                                                            issues. Progress varies between
                                                                                            countries but there are many
                                                                 Figure 2.1: VPA            encouraging developments.
                                                                 partner countries          A successfully implemented
                                                                 Source: EFI FLEGT
                                                                                            VPA authorises a country to
                                                                 Facility.
                                                                                            start FLEGT-licensing and a

Main RepoRt – November 2018                                                                                                    7
FLEGT VPA Partners in EU Timber Trade 2017 - flegt imm
licence is an assurance that the timber it exports to the EU   of forest governance. The pace of VPA implementation in
is legally sourced. VPAs also support the partner country in   Cameroon has slowed in recent years despite sustained
combatting illegal logging by improving forest regulation      support from civil society and private sector stakeholders.
and governance. VPA negotiations and implementation            A key challenge in implementing the TLAS is setting up
require multi-stakeholder engagement, bringing                 the web-based information system (SIGIF2), a second
government, civil society organisations, ENGOs, the trade      generation of the national timber legality verification tool.
and others to the negotiating table.                           Once established, the SIGIF 2 still needs to be completed
                                                               and rolled out nationally.
In November 2016, Indonesia became the first country to
complete implementation and to start FLEGT licensing of        2.4 Central African Republic
timber product exports to the EU. In 2017, there were five
countries at the VPA implementing stage, all in Africa,        The Central African Republic is at initial stages of VPA
which was an initial focus for the VPA process: Ghana,         implementation; the process is gradually restarting after
Cameroon, Liberia, Congo and Central African Republic.         the 2013 crisis. Key actors still support the VPA but their
The VPA in Viet Nam was “initialled” in 2017, which means      knowledge has decreased. However, there are positive
negotiations between EU and Vietnamese authorities were        developments: an assessment of the forestry sector and
complete and the country was progressing to ratifying          stakeholders has provided a basis for developing a road
and preparing implementation of the VPA. Another eight         map for implementation and EC aid projects. The FAO
countries were negotiating a VPA with the EU in 2017:          FLEGT programme has resumed technical support that
DRC, Côte d’Ivoire, Gabon, Guyana, Honduras, Lao PDR,          has improved transparency through a central database
Malaysia and Thailand. The Honduras VPA has since been         on forest and the website www.apvrca.org in accordance
initialled (in June 2018) and the Guyana VPA is likely to      with the requirement of the Agreement. However, conflict
be initialled as well before the end of 2018. In addition,     persisting outside Bangui, weak capacities and a lack of
the EU was engaged in dialogue to inform and prepare for       domestic resources make VPA implementation a challenge.
possible VPA negotiations with Myanmar, Cambodia and
the Philippines.                                               2.5 Ghana

Below follows a summary of details of where VPA                Ghana is closest to finalising VPA implementation among
negotiations or implementation stood in each of the            all current implementing countries. A shipment test of
partner countries in 2017. The status of each country will     FLEGT-licensed timber was initiated in September 2017
be updated during 2018.                                        and the readiness assessment for licensing is planned to
                                                               take place in 2018. New legislation to regulate conversion
FLEGT-licensing countries                                      of timber harvesting permits to Timber Utilisation
                                                               Contracts is being implemented.
2.2 Indonesia
                                                               2.6 Liberia
Indonesia has been fully implementing the VPA and the
underlying legality assurance system SVLK since 2016;          VPA implementation in Liberia is progressing. The Timber
the first FLEGT licences were issued on 15 November 2016.      Legality Assurance System (TLAS) is under development
Full VPA implementation means that besides the national        and verification is being implemented in a more systematic
rollout of SVLK certification, Indonesia has structures in     way. The EC and other stakeholders are also noting
place to issue FLEGT licences as well as manage, monitor       improvements in transparency, with relevant documents
and evaluate the system. Monitoring and evaluation means       being made available at www.fda.gov.lr. Institutional and
that, although the VPA is fully implemented as negotiated      technical capacities remain the main challenge for Liberia
with the EU, continuing multi-stakeholder processes ensure     to tackle before the VPA TLAS is fully operational.
the system is working as envisaged and that an annual
independent audit of the system is carried out to ensure       2.7 Republic of Congo
its correct implementation. Moreover, monitoring and
evaluation programmes propose improvements regarding           Major steps towards VPA implementation have been
the implementation and future development of the VPA.          completed in the Republic of Congo. The Timber Legality
                                                               Assurance Software is about be rolled out nationally and
VPA-implementing countries                                     mechanisms are being developed to recognise private
                                                               forest management certification schemes in the context
2.3 Cameroon                                                   of their Timber Legality Assurance System. Civil society
                                                               organisations are actively involved in VPA implementation
The focus of VPA implementation has been on enabling           through Independent Forest Monitoring and participation to
legislation relating to the timber legality assurance          legal reform. The Independent audit helps to make clear the
system (TLAS) and on setting up the TLAS system itself.        situation of the implementation of the TLAS in the field and
Moreover, government and civil society were working            to identify the gaps to be addressed. It is a good opportunity
on implementing the transparency annex and on                  for the Republic of Congo’s government to make progresses
strengthening capacity to do independent observation           in the FLEGT process visible and measurable.

5
    Including countries that initialled their VPA in 2017.

8                                                                                             Main RepoRt – November 2018
FLEGT VPA Partners in EU Timber Trade 2017 - flegt imm
VPA-negotiating5                                                     2.12 Honduras

2.8 Côte d’Ivoire                                                    On June 14, 2018, the Parties initialled the VPA. Stakeholder
                                                                     engagement in Honduras is high, with a remarkably wide
VPA negotiations in Côte d’Ivoire are progressing slowly,            participation. Hopes are that this high level of momentum
due in part to a lack of national vision for the forest sector       can be maintained and VPA implementation can begin as
and conflicting sectoral policies. The last round of VPA             soon as the Agreement is initialled. Main challenges facing
negotiations was held in June 2014. In March 2017, Côte              VPA implementation in Honduras include regularisation
d’Ivoire updated its VPA Roadmap and has been making                 of land tenure, informality of the SME sector and
steady progress in implementing it. In addition, government          institutional capacities.
has taken steps to harmonize agricultural and forest
policy for a coherent forest policy. Spurred by a letter from        2.13 Lao PDR
the primary donors (GIZ, AFD, FAO, UE) to support the
development of a national vision for forests and a recent NGO        The first VPA negotiation session in Lao PDR was held
exposé on the illegal origins of cocoa grown in forests, in          in April 2017. There is a strong political commitment
September the Prime Minister proposed a pragmatic forest             to the VPA process in the country and synergies exist
policy. The policy has the potential to more coherently govern       between the FLEGT process and an order to improve
the sectoral activities that take place in the forests. The forest   forest governance and fight deforestation issued by the
code and regulations will be revised in light of the new policy.     Prime Minister (PM order No. 15). Initial discussions
Meanwhile the EC is developing an approach for a stock take          on the timber legality definition and product scope are
exercise to identify the most appropriate course of action for       ongoing. Major challenges facing the VPA process in Lao
forest-related activity in Côte d’Ivoire.                            PDR include forest conversion, capacity limitations, and
                                                                     limited direct trade with the EU.
2.9 Democratic Republic of Congo (DRC)
                                                                     2.14 Malaysia
VPA negotiations with DRC have stalled since November
2013, although some progress at national stakeholders’               Malaysia has been negotiating a VPA with the EU since
level – including work on updating legality grids – has              2007. The timber legality assurance system has mostly
been noted in 2016 and 2017. In general, stakeholders in             been developed for Peninsular Malaysia and Sabah.
DRC are more focused on REDD (Central African Forest                 However, negotiations have been on hold since 2015
Initiative), legal reforms and economic issues than on               as further movement is not possible without a firm
the VPA process. Moving forward, the EC is encouraging               commitment and a defined timeline from Sarawak to be
stakeholders in DRC to expand their considerations                   party to the VPA. Nonetheless, technical developments
beyond the VPA to look at the broader FLEGT Action Plan              take place in all three regions.
and its links with REDD+ initiatives, including through
work on developing a national forest policy.                         2.15 Thailand

2.10 Gabon                                                           The VPA process in Thailand was launched in September
                                                                     2013. However, first negotiations were only held in June
The last session of VPA negotiations between the EU and              2017; the process had previously been heavily affected by
Gabon was held in October 2011; the process has since been           political turmoil in the country. A national consultation
stalled. However, technical sessions involving Gabonese              process and work at technical level has been ongoing since
stakeholders were relaunched in 2015 and 2016 and the VPA            2013 coordinated by a multi-stakeholder ad-hoc working
process has enabled stakeholders to come together and                group. An advanced draft Legality Definition has already
work on the forest law reform process. A new forest code is          been developed. There is also progress in addressing
expected to be approved soon. This might help build a new            challenges facing the VPA process in Thailand such as
dynamic for forest governance in the country and possibly            regulating timber imports as well as smallholders and
lead to renewed dialogue with the EU, including around               community forests.
VPA negotiations.
                                                                     2.16 Viet Nam
2.11 Guyana
                                                                     The EU and Viet Nam signed the VPA in October 2018, after it
The country’s timber legality assurance system was                   had been initialled in May 2017. The process of ratification,
field-tested in 2017, meaning that stakeholders were                 in parallel to which VPA implementation is already being
given the opportunity to assess the practicality and                 prepared, is ongoing. The Vietnamese Timber Legality
credibility of the VPA’s legality definition and legality            Assurance System (TLAS) will cover exports to all markets
verification procedures, as well as the readiness of                 as well as the domestic market. The system will also require
government agencies to implement the Guyana timber                   Vietnamese timber importers to conduct due diligence
legality assurance system. Technical work on the VPA                 for their imports. Due to the diversity and size of the
in Guyana is being finalised. The Parties have reached               Vietnamese wood industry, VPA implementation is expected
political agreement on the content of the VPA, which                 to take several years. In November 2017, the EU and Viet
should be initialled by the end of November 2018 and                 Nam held the first Joint Preparatory Committee, which
which would mark the official end of the negotiations.               agreed the Joint Implementation Framework to guide and
The VPA process in Guyana also faces several challenges              monitor the implementation of the agreement.
including maintaining momentum and commitment and
ensuring continued stakeholder participation as well as
support to related issues.

Main RepoRt – November 2018                                                                                                     9
3   VPA country export trade – 2017 update
    3.1 Scope                                                                     The export value of wood products from tropical countries not
                                                                                  involved in the VPA process increased 4% from US$6.87 billion
    This section reports on the share of VPA partner countries                    in 2016 to US$7.18 billion in 2017. The share of these countries
    in global tropical timber trade in 2017. This is to ensure                    in global tropical wood product supply increased from 20.6%
    that trade flows between VPA Partner countries and the EU                     to 20.9% in the same period. The gains in export value and
    are considered in their appropriate global context.                           share by non-VPA countries were largely due to India (mainly
                                                                                  furniture to USA, China and the EU), the Solomon Islands
    The section considers the relative contribution of VPA                        (logs to China), and Nigeria (rosewood to China).
    Partners in total global trade in tropical timber in 2017.
    It considers the changing composition of products in the                      3.3 Product mix of tropical wood trade
    tropical timber trade and changing regional supply and
    demand during the year. It also considers the role of VPA                     The global trade in tropical furniture and joinery products,
    Partner countries in the global pulp and paper sector.                        which has been rising slowly and consistently in the last
    The section builds on and does not repeat the more                            15 years, contrasts with the trade in processed products
    detailed analysis of long-term trends already covered in                      which has been more volatile (Figure 3.3).
    previous IMM reports.6
                                                                                  After declining sharply in the previous two years with the
    3.2 VPA partner share of global tropical wood-                                end of the speculative boom in rosewood and slowing of
        product trade in 2017                                                     the Chinese market, in 2017 the value of global trade in
                                                                                  tropical logs stabilised at US$4.26 billion. The share of logs
    The value of global trade in tropical wood products                           in the global tropical wood trade decreased from 12.8% in
    increased 5% to US$34.4 billion in 2017, reversing the                        2016 to 12.4% in 2017.
    declining trend between 2014 and 2016 (Figure 3.2).
                                                                                  Global trade in tropical sawn wood (including decking and
    The rise in trade in 2017 was largely driven by China and                     mouldings) increased 3% from US$5.60 billion in 2016 to
    the United States. The Chinese economy recovered ground                       US$5.78 billion in 2017. This was the first rise in the value
    after the slowdown in 2016 and the waning effects of the                      of the global tropical sawn wood trade since 2014 at the
    bursting of the speculative bubble in rosewood in 2015.                       height of the rosewood boom. The rise was driven primarily
                                                                                  by Chinese imports from Thailand (mainly rubberwood),
    In the United States, the economy continued to grow                           Indonesia (most likely plantation species such as acacia)
    strongly in 2017 and there was a further rise in imports of                   and Gabon (a range of natural forest species).
                                            7
    wood furniture products from Viet Nam and, to a lesser
    extent, Malaysia.                                                             After a downturn in the previous two years due to slowing
                                                                                  imports of tropical plywood into Japan from the dominant
    The combined share of the 15 VPA partner countries in                         suppliers, Malaysia and Indonesia, the global value of
    global tropical wood products trade was 79.1% in 2017,                        tropical plywood and veneer trade increased 2.2% to
    slightly down from 79.4% the previous year.                                   US$4.82 billion in 2017. Much of the increase was destined
                                                                                  for the United States where there was a partial recovery in
    The export value of Indonesian wood products was US$5.71                      imports from long-term suppliers Indonesia and Malaysia,
    billion in 2017, marginally less than $5.72 billion exported                  and a big a rise in new supply from Viet Nam and Cambodia.
    the previous year. Indonesia accounted for 16.6% of                           To some extent these increases were at the expense of
    global trade in tropical wood in 2017, down from 17.1% the                    imports of Chinese plywood that declined during the year.
    previous year and a return to the low level of 2014.
                                                                                  In 2017, the value of wood furniture exports by tropical
    Total export value by the five African VPA-implementing                       countries increased 5.5% to US$10.93 billion. The share
    countries was US$1.24 billion in 2017, down 4% from                           of wood furniture in total tropical wood trade increased
    US$1.29 billion in 2016. The five VPA-implementing                            from 30.9% in 2016 to 31.8% in 2017. This was driven
    countries accounted for 3.6% of global trade in tropical                      almost entirely by rising US imports from South East
    wood in 2016 in 2017, down from 3.9% in 2016 and                              Asia, particularly Viet Nam and, to a lesser extent,
    continuing a long-term slide from over 5% a decade before.                    Malaysia and Indonesia. Much of the furniture exported
    Total export value of tropical wood products by the nine                      by Viet Nam is likely manufactured using imported non-
    VPA-negotiating countries increased 4% from US$19.5                           tropical hardwoods, such as oak and tulipwood, rather
    billion in 2016 to US$20.2 billion in 2017. The share of                      than tropical timber, but the exact proportion cannot be
    VPA-negotiating countries in global tropical wood trade                       discerned from trade statistics.
    was 58.9% in 2017, up from 58.4% the previous year. This
    also continued a long-term trend, largely driven by the                       The value of joinery and other value-added products
    increasing share of Viet Nam in global furniture supply.                      exported by tropical countries declined 3% to US$3.40

    6
      Longer-term trade trends are analysed in more depth in the ITTO-IMM reports ‘Europe’s changing tropical timber trade 2004 to 2014’ published in 2015
      and ‘FLEGT VPA Partners in EU Timber Trade 2014 to 2016’ published in 2017. All IMM reports are available at: http://www.flegtimm.eu/index.php/reports
    7
      In 2017, 97% of wood product export value from Viet Nam to the USA comprised wood furniture for which it is not possible in trade statistics
      to differentiate tropical timber from temperate timber. A significant, but unknown proportion, of wood furniture exported from Viet Nam is
      manufactured from non-tropical timber much of which is imported from the USA and Europe.

    10                                                                                                                  Main RepoRt – November 2018
billion in 2017, a reversal of the trend
                                                                                                                                                                                                                     in 2016 when trade increased 4%.
                                                                         35                                                                                                                                          This decline hides wide variation in
                     Value (US$ billion, constant 2017 prices)                                                                                                                                                       the performance of a large range of
                                                                         30                                                                                                                                          products and markets. US imports
                                                                                                                                                                                                                     of joinery products like doors and
                                                                         25                                                                                                                                          flooring from tropical countries, led by
                                                                                                                                                                                                  No VPA
                                                                                                                                                                                                                     Indonesia and, to a lesser extent, Viet
                                                                         20
                                                                                                                                                                                                  VPA negotiating    Nam, were rising in 2017. In contrast,
                                                                         15                                                                                                                       VPA implementing   there was a significant decline in
                                                                                                                                                                                                                     Japan’s imports of joinery products
                                                                                                                                                                                                  FLEGT licensing
                                                                         10                                                                                                                                          from the Philippines during the year.

                                                                          5                                                                                                                                          3.4 Regional supply of tropical
                                                                                                                                                                                                                         wood products
                                                                          0
                                                                              2004
                                                                                      2005
                                                                                              2006
                                                                                                      2007
                                                                                                              2008
                                                                                                                     2009
                                                                                                                             2010
                                                                                                                                    2011
                                                                                                                                               2012
                                                                                                                                                        2013
                                                                                                                                                                2014
                                                                                                                                                                        2015
                                                                                                                                                                                2016
                                                                                                                                                                                        2017
                                                                                                                                                                                                                     During 2017, the long-term rising trend
                                                                                                                                                                                                                     continued in wood product exports
                                                                                                                                                                                                                     from countries in the Mekong region,
  Figure 3.2: Global tropical wood-product trade, by VPA status of suppliers,
                                                                                                                                                                                                                     mainly at the expense of countries in
  2004 to 2017 Source: ITTO IMM analysis of data from Eurostat COMEXT, UN COMTRADE
                                                                                                                                                                                                                     South East Asia. (Figure 3.4.1).
  and Global Trade Atlas

                                                                                                                                                                                                                     In 2017, the total value of exports from
                                                                                                                                                                                                                     the Mekong region – which includes
                                                                                                                                                                                                                     Cambodia, Lao PDR, Myanmar,
                                                                         35
                                                                                                                                                                                                                     Thailand and Viet Nam – increased 6%
                                                                                                                                                                                                                     to US$14.33 billion. A major contributing
                                                                         30
                           Value in US$ billion (constant 2017 prices)

                                                                                                                                                                                                                     factor prior to 2015 was the surge in
                                                                                                                                                                                         Fuel/other primary wood
                                                                                                                                                                                                                     China’s imports of rosewood logs from
                                                                         25                                                                                                              Logs                        the Mekong region, a trend which
                                                                                                                                                                                         Composite panels            eased in 2015 and 2016. However, the
                                                                         20
                                                                                                                                                                                                                     long-term rise in furniture exports by
                                                                                                                                                                                         Plywood and veneer
                                                                                                                                                                                                                     Viet Nam and rubberwood exports by
                                                                         15                                                                                                              Sawnwood and mouldings      Thailand continued throughout the
                                                                                                                                                                                         Joinery/other added value   period to 2017.
                                                                         10
                                                                                                                                                                                         Wood furniture
                                                                                                                                                                                                                     The value of exports from South East
                                                                          5
                                                                                                                                                                                                                     Asia, mainly from Indonesia, Malaysia
                                                                                                                                                                                                                     and the Philippines, declined 2% to
                                                                          0
                                                                                                                                                                                                                     $12.7 billion in 2017. This follows a
                                                                              2004
                                                                                     2005
                                                                                             2006
                                                                                                     2007
                                                                                                            2008
                                                                                                                   2009
                                                                                                                          2010
                                                                                                                                 2011
                                                                                                                                        2012
                                                                                                                                                 2013
                                                                                                                                                         2014
                                                                                                                                                                 2015
                                                                                                                                                                         2016
                                                                                                                                                                                 2017

                                                                                                                                                                                                                     larger decline in the previous two
                                                                                                                                                                                                                     years, mainly driven by a big decline
  Figure 3.3: Global tropical wood-product trade, by product group, 2004 to 2017                                                                                                                                     in exports of joinery products from
  Source: ITTO IMM analysis of data from Eurostat COMEXT, UN COMTRADE and Global Trade Atlas                                                                                                                         the Philippines to Japan and falling
                                                                                                                                                                                                                     Indonesian exports of plywood to
                                                                                                                                                                                                                     China. The share of South East Asia in
                                                                                                                                                                                                                     global tropical wood-product trade fell
                                                  100%                                                                                                                                                               from 38.1% in 2016 to 36.3% in 2017.
                                                                   90%                                                                                                                                               The value of tropical wood product
                                                                                                                                                                                                                     exports from West and Central Africa
                                                                   80%
   Proportion of total value in US$

                                                                                                                                                                                                                     increased 5% from US$3.23 billion in
                                                                   70%                                                                                                                                               2016 to US$3.40 billion in 2017. The
                                                                   60%
                                                                                                                                                                                          Other                      share of West and Central Africa in
                                                                                                                                                                                          S. America                 global tropical wood products exports
                                                                   50%
                                                                                                                                                                                          W/C Africa                 was 9.8% in 2017, up from 9.5% in 2016
                                                                   40%                                                                                                                    Mekong                     but down from 10.3% in 2014 at the
                                                                   30%                                                                                                                    SE Asia (excl Mekong)      height of the rosewood boom.

                                                                   20%
                                                                                                                                                                                                                     There were significant shifts in wood
                                                                   10%                                                                                                                                               products exports by African countries
                                                                         0%
                                                                                                                                                                                                                     in 2017 (Figure 3.4.2). The value of
                                                                                                                                                                                                                     exports by Cameroon, the largest
                                                                              2004
                                                                                     2005
                                                                                             2006
                                                                                                     2007
                                                                                                            2008
                                                                                                                   2009
                                                                                                                          2010
                                                                                                                                 2011
                                                                                                                                        2012
                                                                                                                                                2013
                                                                                                                                                         2014
                                                                                                                                                                2015
                                                                                                                                                                        2016
                                                                                                                                                                                2017

                                                                                                                                                                                                                     exporter, declined 10% to US$750
                                                                                                                                                                                                                     million. Exports also fell from Ghana
  Figure 3.4.1: Share of global tropical wood-product trade, by export region,                                                                                                                                       and Côte d’Ivoire during the year.
  2004 to 2017 Source: ITTO IMM analysis of data from Eurostat COMEXT, UN COMTRADE and                                                                                                                               However, these declines were offset
  Global Trade Atlas                                                                                                                                                                                                 by a 44% rise in exports by Nigeria,

Main RepoRt – November 2018                                                                                                                                                                                                                                11
to US$470 million which meant the
country overtook Gabon to become                                                                                                                       2012            2013                 2014                 2015                2016        2017
tropical Africa’s second largest                                                                      0.9

                                                       Value in billion US$ (constant 2017 prices)
wood product exporter. Nearly all                                                                     0.8
exports from Nigeria comprise logs of
                                                                                                      0.7
rosewood destined for China. Zambia’s
                                                                                                      0.6
exports of rosewood logs to China also
increased rapidly in 2017.                                                                            0.5
                                                                                                      0.4
The value of tropical wood product                                                                    0.3
exports from Latin America increased
                                                                                                      0.2
1% to US$1.70 billion in 2017. This
was mainly due to a rise in Brazilian                                                                 0.1

exports of tropical sawn hardwood                                                                     0.0

                                                                                                                   Cameroon

                                                                                                                                      Nigeria

                                                                                                                                                         Gabon

                                                                                                                                                                            Congo

                                                                                                                                                                                            Mozambique

                                                                                                                                                                                                                Eq. Guinea

                                                                                                                                                                                                                                              Zambia

                                                                                                                                                                                                                                                          Cote d'Ivoire
                                                                                                                                                                                                                                    Ghana
during the year, particularly to the
USA, China and India.

Several countries outside these
production regions increased share in
global tropical wood products trade in            Figure 3.4.2: Tropical wood-product exports, by African countries, 2012 to 2017
2017, notably India (mainly in supply             Source: ITTO IMM analysis of data from Eurostat COMEXT, UN COMTRADE and Global Trade Atlas
of wood furniture, particularly to the
USA), and the Solomon Islands (logs
destined mainly for China).

3.5 Changes in regional demand                                                                       12
    for tropical wood products                                                                                                                                                                                                              China/Hong Kong/
                                                   Value in billion US$ (constant 2017 prices)

                                                                                                                                                                                                                                            Taiwan POC
                                                                                                     10
                                                                                                                                                                                                                                            North America
In 2017, the tropical wood-products
trade was considerably less volatile                                                                  8                                                                                                                                     Northeast Asia
than in previous years. Tropical wood                                                                                                                                                                                                       EU
products imports recovered ground                                                                     6
                                                                                                                                                                                                                                            India/South Asia
in China, continued to rise into North
America, were stable Northeast Asia, and                                                              4                                                                                                                                     Southeast Asia
slowed into the EU and India (Figure 3.5).                                                                                                                                                                                                  Middle East
                                                                                                      2
In 2017, the value of imports of wood                                                                                                                                                                                                       Pacific

products from tropical countries into the                                                             0
EU fell 3% to US$4.06 billion. The EU’s
                                                                                                            2004
                                                                                                                   2005
                                                                                                                              2006
                                                                                                                                     2007
                                                                                                                                                2008
                                                                                                                                                       2009
                                                                                                                                                              2010
                                                                                                                                                                     2011
                                                                                                                                                                              2012
                                                                                                                                                                                     2013
                                                                                                                                                                                            2014
                                                                                                                                                                                                         2015
                                                                                                                                                                                                                2016
                                                                                                                                                                                                                             2017

share of global wood products imports
from tropical countries declined from
12.4% in 2016 to 11.8% in 2017.
                                                  Figure 3.5: Global tropical wood-product trade, by import region, 2004 to 2017
Meanwhile, imports of wood products           Source: ITTO IMM analysis of data from Eurostat COMEXT, UN COMTRADE and Global Trade Atlas
from tropical countries into China
increased 4% to US$8.71 billion in
2017 following a sharp decline in the                              At the same time rising costs of production in China,
previous two years. The share of China in global tropical          linked to both rising costs of labour and other inputs and
wood product imports increased from 24.9% in 2016 to               changes in government policy designed to reduce pollution
25.3% in 2017.                                                     and financial risk, and the gradual appreciation of the
                                                                   Chinese currency, are making Chinese manufactured
The Chinese wood-products market is undergoing a                   products less competitive in international markets.
major structural change. It has shifted decisively from an         Policy measures in other countries such as anti-dumping
export-oriented market to being driven almost entirely by          measures targeting Chinese products and restrictions on
domestic consumption. Data from the American Hardwood              log exports are also having an effect.
Export Council indicates that whereas in 2000, 85% of US
hardwood imported into China was used to manufacture               Overall, this is leading to a slowdown in China’s log
goods for export to global markets, this proportion had            imports and a partial switch to sawn timber. Rising wealth
fallen to only 20% by 2016 with 80% used to manufacture            in China is also opening the door to an increase in China’s
goods consumed in China.                                           imports of more value-added wood products, such as
                                                                   higher end furniture and flooring from Europe.
Although no equivalent data is available for tropical
wood, the proportion consumed domestically in China                Although the Chinese economy rebounded in 2017, with
is likely to be even higher than 80% given that, unlike            GDP growth of nearly 7% in response to heavy lending
American hardwood, tropical wood is unfashionable in               by state-owned banks, brisk government spending and
western consumer markets but still strongly favoured for           strong exports, some analysts are now predicting that
traditional Chinese furniture.                                     broader economic and policy trends will lead to a decline

12                                                                                                                                                                                                               Main RepoRt – November 2018
in China’s imports of logs and slowing imports of sawn                      increased 1% to US$6.50 billion following zero percent
timber, a process that could start in 20188.                                growth in 2016 and a 7% decline in 2015.

An immediate issue for tropical timber in the Chinese                       Japan’s imports of wood products (mainly plywood)
market is the future of the rosewood market following the                   from Malaysia and Indonesia were flat in 2016 and 2017
crash in 2014. In the years just before the crash, prices for               following a significant decline in preceding years in
rosewood were doubling every twelve months – partly                         response to supply constraints and a shift away from
because unscrupulous traders were highlighting the scarcity                 tropical plywood in favour of alternative panel products.
of the timber as a means of increasing demand. Furniture                    However, the decline in Japan’s tropical plywood imports
sets manufactured in rosewood were selling for as much                      was partly offset by a rise in imports from Viet Nam,
as 500,000 yuan (US$75,757). Prices trended upwards as                      particularly of hardwood chips. Japan imports nearly 3
wealthy individuals followed the hype and hoarded rosewood                  million metric tons of wood chips with a total value of
furniture as a form of long-term investment                                 US$450 million from Viet Nam every year. This is driven
                                                                            partly by demand from the pulp sector and partly by
The rosewood bubble finally burst in 2014 as unsustainable                  energy policy initiatives introduced by Japan’s Ministry
sky-high prices ran up against the reality of an economic                   of Economy, Trade and Industry aimed at reducing the
downturn. Buyers were also actively discouraged by                          nation’s dependence on fossil fuels.
President Xi Jinping’s anti-corruption campaign which
kicked-off in 2012 and specifically targeted outward                        A similar situation exists in South Korea, although in this
displays of extravagance, including expensive household                     case a rise in hardwood chip imports from Viet Nam has
goods. Furthermore, as more people came into possession of                  been accompanied by rising plywood imports from Viet
rosewood products, its value as a status symbol diminished.                 Nam and a recovery in plywood imports from Indonesia in
                                                                            the last two years.
In 2014, manufacturing output and the number of rosewood
businesses in China fell by more than 30%. The industry                     In South East Asia, Viet Nam’s role as a wood processing
continued to shrink in 2015 and 2016, albeit at a slower pace.              hub continued to rise during 2017. Viet Nam is increasingly
                                                                            recognised as the primary location in South East Asia for
In 2017, although faced with a slump, Chinese                               supply of mid-range interior furniture and has become
entrepreneurs were yet again expanding their search for                     a major competitor to China in this sector. Viet Nam’s
rosewood, and rosewood substitutes. As global awareness                     imports of wood products are rising to supply the export-
and CITES and national controls on rosewood exploitation                    oriented furniture manufacturing sector as well as rising
and trade have been increased, the focus of trade has                       domestic demand.
switched to countries where implementation is more
lax, particularly in Africa. However, some regional trade                   According to Viet Nam government statistics,10 in 2017,
analysts suggest it’s unlikely that the earlier mania in the                the value of Viet Nam’s wood product imports increased
trade will return, observing that the hype surrounding                      17% to US$214 million from Cambodia, 13% to US$103
rosewood in China has diminished and most Chinese                           million from Thailand, and 0.4% to US$94 million from
consumers have become aware of the risks of speculation                     Malaysia. These gains offset a 47% decline in imports from
in rosewood furniture.9                                                     Lao PDR, to US$42 million and a 16% decline in imports
                                                                            from Indonesia, to US$18 million. UN COMTRADE data
In 2017, imports of wood products from tropical countries into              indicates that the value of imports of timber products from
North America increased 8% to US$8.37 billion, a significant                Cameroon increased 24% from US$143 million in 2015
increase in pace compared to 1% growth the previous year.                   to US$177 million in 2016, making Viet Nam Cameroon’s
The share of North America in global tropical wood product                  second largest export market after China.11
imports increased from 23.1% in 2016 to 24.3% in 2017.
                                                                            A significant, but unknown, proportion of wood products
Much of the increase in North American imports from                         exported from Viet Nam is manufactured using imported
tropical countries comprised wood furniture from Viet                       temperate wood. In fact, US exports of sawn timber to Viet
Nam destined for the United States, which alone increased                   Nam increased from US$163 million in 2016 to US$199 million
13% from US$3.95 billion in 2016 to US$4.48 billion in                      in 2017, while US exports of logs to Viet Nam increased from
2017. US imports also increased from Indonesia, by 6% to                    US$44 million to US$58 million in the same period.
US$986 million (furniture, plywood and joinery products),
from Malaysia, by 7% to US$988 million (furniture and                       In 2017, the value of wood products imported from
plywood), and from India, by 16% to US$424 million                          tropical countries into the “South Asia” region, which
(furniture, marquetry and tableware).                                       is dominated by India, declined 4% to US$1.60 billion.
                                                                            This follows a cumulative 30% decline in the previous
In 2017, imports of wood products from tropical countries                   three years owing to the rapid decline in availability of
into Northeast Asia, which includes Japan and South Korea,                  teak logs from Myanmar and meranti logs from Sarawak.

8
  See ‘China’s 2017 Log and Lumber Imports Set Records, But Period of Rapid Growth is Over’ on the latest edition of RISI’s China Timber Supply
  Outlook – https://www.risiinfo.com/press-release/2017-china-timber-supply-outlook-press-release/
9
  For example, see http://www.atimes.com/article/chinese-attempts-reignite-rosewood-market-will-fail/
10
   From GOVIET, the journal of the Viet Nam Timber and Forest Product Association. http://goviet.org.vn/upload/aceweb/content/Go%20Viet%20
   No.97_Jan_Feb.2018.pdf
11
   UN COMTRADE data for Viet Nam imports in 2017 is not available at time of compiling this report and 2017 Viet Nam government statistics reported
   in GOVIET do not list Cameroon separately.

Main RepoRt – November 2018                                                                                                                       13
India has only partially compensated
for this supply shortfall by importing
more logs from Papua New Guinea,                                      60
Suriname and the Solomon Islands,
sawn timber from Malaysia, veneer                                     50
from Myanmar, and plywood, veneer
and mouldings from Indonesia.
                                                                      40                                                                                                                          Tropical

                                                  Million tonnes
3.6 VPA partner countries in
                                                                      30                                                                                                                          Southern Hemisphere
    global pulp trade                                                                                                                                                                             temperate/sub-tropical

Global trade of wood pulp was 62.0                                    20                                                                                                                          Northern Hemisphere
                                                                                                                                                                                                  temperate/sub-tropical
million MT in 2017, a 3% increase from
60.2 million MT the previous year.                                    10
This continues the long-term trend
resulting primarily from increasing                                         0

                                                                                2004
                                                                                           2005
                                                                                                   2006
                                                                                                           2007
                                                                                                                   2008
                                                                                                                           2009
                                                                                                                                   2010
                                                                                                                                           2011
                                                                                                                                                   2012
                                                                                                                                                           2013
                                                                                                                                                                   2014
                                                                                                                                                                           2015
                                                                                                                                                                                   2016
                                                                                                                                                                                           2017
dependence of the large paper
manufacturing sectors in Europe,
North America and China on hardwood
chemical pulp produced from                          Figure 3.6.1: Global wood pulp trade, by export region, 2004 to 2017
expanding eucalyptus plantations in                  Source: ITTO IMM analysis of data from Eurostat COMEXT, UN COMTRADE and Global Trade Atlas
the southern hemisphere (Figure 3.6.1).

Tropical countries play only a small
role in total global pulp trade but
exports from the tropical zone are                                              5
rising overall. Pulp exports from
tropical countries increased 16% from
                                                                                4
4.47 million MT in 2016 to 5.21 million
MT in 2017 (Figure 3.6.2).                                                                                                                                                                          No VPA
                                                               Million tonnes

                                                                                3
Almost all tropical pulp exports derive                                                                                                                                                             VPA negotiating
from Indonesia. Indonesia’s exports                                                                                                                                                                 VPA implementing
increased 30% from 3.53 million MT in                                           2
                                                                                                                                                                                                    FLEGT licensing
2016 to 4.59 million MT in 2017. This rise
was driven almost exclusively by China,                                         1
for which Indonesia’s exports increased
from 2.17 million MT in 2016 to 3.27
million MT in 2017. Most of the rest of                                         0
                                                                                    2004
                                                                                            2005
                                                                                                    2006
                                                                                                            2007
                                                                                                                    2008
                                                                                                                            2009
                                                                                                                                    2010
                                                                                                                                            2011
                                                                                                                                                    2012
                                                                                                                                                            2013
                                                                                                                                                                    2014
                                                                                                                                                                            2015
                                                                                                                                                                                    2016
                                                                                                                                                                                           2017

Indonesia’s pulp is destined for South
Korea, India, Bangladesh and Japan.

Thailand and Singapore were the only           Figure 3.6.2: Tropical wood pulp trade, by VPA status of suppliers, 2004 to 2017
other tropical countries exporting             Source: ITTO IMM analysis of data from Eurostat COMEXT, UN COMTRADE and Global Trade Atlas
anything other than negligible
quantities of pulp in 2017. Exports
from Thailand were 138,000 MT                                       chemical pulp with most destined for China, and smaller
during the year, 14% less than in 2016, mostly destined             volumes for South Korea and the EU.
for China, although 28,000 MT went to France. Exports
from Singapore are volatile from year to year and in                3.7 VPA partner countries in global paper trade
2017 were 469,000 MT, down from 767,000 MT in 2016.
It’s likely that most of this volume is in transit from             The paper sector is highly capital intensive. It is less
Indonesia. Singapore imported 347,000 MT of pulp for                attracted to locations with low labour costs and more to
Indonesia in 2017, and the export destinations from                 countries where there is low commercial risk and ready
Singapore are the same as for Indonesia – mainly China,             access to a large and relatively stable electricity supply and
Bangladesh and India.                                               other essential infra-structure. It also benefits from the
                                                                    presence of relatively undifferentiated forest resources,
In practice, Indonesia’s main competition in export                 best supplied by fast-growing plantations or northern
markets for pulp comes not from other tropical countries            boreal forests. In many parts of the world, it is becoming
but from suppliers in the sub-tropical region, notably              increasingly dependent on recycled fibre and an efficient
Brazil and Chile. Brazil’s exports of pulp were 13.84               supply chain for this material. Finished products are bulky
million MT in 2017, 2% more than in 2016 and continuing             and prone to damage during transport, while customers
a long term rising trend. Brazil’s exports consist almost           are unwilling to carry stock and require quick turnaround
exclusively of hardwood chemical pulp mostly destined               times, generally favouring location close to consumers.
for the EU, China and the U.S.A. Chile’s exports of pulp
were 4.49 million MT in 2017, 3% less than the previous             Total value of global trade in paper products (excluding
year. Chile’s exports are mix of hardwood and softwood              internal EU trade) increased 3% from to US$92.78 billion

14                                                                                                                                                                                 Main RepoRt – November 2018
began in 2011 (Figure 3.7.2). Exports
                                                                                                                                                                                      from Indonesia, the world’s largest
                                                 120                                                                                                                                  tropical exporter of paper products,
                                                                                                                                                         Australasia
                                                                                                                                                                                      increased 9% to US$3.80 billion in 2017.
                                                 100                                                                                                     Japan/Korea                  In tonnage terms, Indonesia paper
 US$ billion constant 2017 prices

                                                                                                                                                         China/HK/Taiwan              exports increased from 4.1 million MT
                                                  80                                                                                                                                  in 2016 to 4.7 million MT in 2017. This
                                                                                                                                                         SE Asia                      was mainly driven by a near three-fold
                                                  60                                                                                                     Africa, Middle East, India   increase in Indonesia’s paper exports
                                                                                                                                                                                      to China from 240,000 MT in 2016 to
                                                                                                                                                         South America
                                                  40                                                                                                                                  640,000 MT in 2017. This meant China
                                                                                                                                                         North America                overtook Japan to become Indonesia’s
                                                                                                                                                                                      largest paper export market.
                                                  20                                                                                                     Other Europe/CIS

                                                                                                                                                         EU (excl internal trade)     While China and Japan are the leading
                                                   0
                                                                                                                                                                                      export markets, Indonesia sold paper
                                                       2004
                                                              2005
                                                                     2006
                                                                            2007
                                                                                   2008
                                                                                          2009
                                                                                                 2010
                                                                                                        2011
                                                                                                               2012
                                                                                                                      2013
                                                                                                                             2014
                                                                                                                                    2015
                                                                                                                                           2016
                                                                                                                                                  2017
                                                                                                                                                                                      products into nearly 170 countries in
                                                                                                                                                                                      2017. Indonesian national statistics
                                                                                                                                                                                      indicate that exports to EU countries
        Figure 3.7.1: Global paper product trade, by export region, 2004 to 2017                                                                                                      were 308,000 MT in 2017, a 21% rise
        Source: ITTO IMM analysis of data from Eurostat COMEXT, UN COMTRADE and Global Trade Atlas                                                                                    compared to the previous year, with
                                                                                                                                                                                      most gains in the U.K., Belgium and Italy.

                                                                                                                                                                                      Paper product exports from countries
                                                                                                                                                                                      implementing VPAs – all in Africa
                                                 16
                                                                                                                                                                                      – are negligible, totalling no more
                                                 14                                                                                                                                   than US$10.6 million in 2017, mostly
   Value in billion US$ (constant 2017 prices)

                                                                                                                                                                                      from Ghana, although this was a 27%
                                                 12                                                                                                                                   increase compared to the previous year.

                                                 10
                                                                                                                                                         No VPA                       Countries negotiating VPAs exported
                                                  8                                                                                                      VPA negotiating              paper products with total value of
                                                                                                                                                                                      US$2.74 billion in 2017, 6% more than
                                                                                                                                                         VPA implementing
                                                  6                                                                                                                                   the previous year. These exports derive
                                                                                                                                                         FLEGT licensing
                                                                                                                                                                                      mainly from countries in South East
                                                  4
                                                                                                                                                                                      Asia including, in 2017, US$1.5 billion
                                                  2                                                                                                                                   from Thailand, US$0.9 billion from
                                                                                                                                                                                      Malaysia and US$0.5 billion from
                                                  0                                                                                                                                   Viet Nam. The only VPA-negotiating
                                                       2004
                                                              2005
                                                                     2006
                                                                            2007
                                                                                   2008
                                                                                          2009
                                                                                                 2010
                                                                                                        2011
                                                                                                               2012
                                                                                                                      2013
                                                                                                                             2014
                                                                                                                                    2015
                                                                                                                                           2016
                                                                                                                                                  2017

                                                                                                                                                                                      country outside South Asia exporting
                                                                                                                                                                                      a significant amount of paper is
                                                                                                                                                                                      Honduras with exports of US$230
        Figure 3.7.2: Tropical paper product trade, by VPA status of suppliers, 2004 to 2017                                                                                          million in 2017.
        Source: ITTO IMM analysis of data from Eurostat COMEXT, UN COMTRADE and Global Trade Atlas
                                                                                                                                                                                    Paper product exports from tropical
                                                                                                                                                                                    countries not engaged in the VPA
in 2016 to US$95.86 billion in 2017 (Figure 3.7.1). The gain in                                                                                                                     process increased 6%, from US$6.81
trade in 2017 reversed the decline of the previous 3 years                                                                                                     billion in 2016 to US$7.19 billion in 2017. The largest
and was apparent in nearly all global regions. The value of                                                                                                    tropical exporters of paper with no VPA process, which
paper exports increased 6% in the EU, 6% in the CIS, 2% in                                                                                                     together accounted for around US$4.47 billion of exports
North America, 2% in South America, 7% in Africa and the                                                                                                       in 2017, are Singapore, Mexico, and India. A large
Middle East, 8% in South East Asia and 3% in Northeast                                                                                                         proportion of exports from Singapore are re-exports
Asia. Only China recorded a slight (1%) fall in exports as                                                                                                     (it has very limited paper manufacturing capacity and
the country is diverting less product to export markets and                                                                                                    imports a large quantity of paper from Indonesia).
consuming more internally.
                                                                                                                                                               Brazil is not classified in this analysis as an exporter
The data for total paper trade hides significant shifts in                                                                                                     of tropical paper products because most paper
the composition of products. Increased digitization is                                                                                                         manufacturing in Brazil is outside the tropical region.
leading to a decline in global demand for printing and                                                                                                         Brazil is a moderately large trader in paper products but,
writing papers and newsprint. However, demand for                                                                                                              unlike for wood pulp, exports have declined in recent
tissue and wrapping papers, both of which are dependent                                                                                                        years. The value of Brazil’s exports was US$1.9 billion in
on household consumption, has been more resilient.                                                                                                             2017, the same as in 2016, of which US$150 million were
Packaging is also benefitting from the rise in e-commerce.                                                                                                     destined for the EU, down from US$179 million in 2016.

Paper product exports from tropical countries increased
7% to US$13.74 billion in 2017, reversing the decline which

Main RepoRt – November 2018                                                                                                                                                                                                  15
You can also read