EUROPEAN FINANCIAL STABILITY AND INTEGRATION REVIEW 2021
←
→
Page content transcription
If your browser does not render page correctly, please read the page content below
EUROPEAN FINANCIAL
STABILITY AND
INTEGRATION
REVIEW 2021

        Banking and
        Finance
An interactive version of this publication, containing links to online content, is available in

PDF format at:

https://europa.eu/!xh69Pp

European Financial Stability and Integration Review 2021                                    scan QR code to download

European Commission

Directorate-General for Financial Stability, Financial Services and Capital Markets Union

European Commission

1049 Bruxelles/Brussel

Belgium

© European Union, 2021

Reuse is authorised provided the source is acknowledged. Distorting the original meaning or message of this

document is not allowed. The European Commission is not liable for any consequence stemming from the reuse

of this publication. The reuse policy of European Commission documents is implemented by the Commission

Decision 2011/833/EU of 12 December 2011 on the reuse of Commission documents (OJ L 330, 14.12.2011, p.

39).

For any use or reproduction of photos or other material that is not under the copyright of the European Union,

permission must be sought directly from the copyright holders.

All images © European Union, 2021, except:

cover photo: © THANIT - stock.adobe.com

EUROPEAN
                 COMMISSION

                                       Brussels, 25.5.2021
                                       SWD(2021) 113 final

          COMMISSION STAFF WORKING DOCUMENT

     European Financial Stability and Integration Review (EFSIR)

EN                                                                 EN
This document has been prepared by the European Commission’s Directorate-General for
Financial Stability, Financial Services and Capital Markets Union (DG FISMA).

This document is a European Commission staff working document for information purposes. It
does not represent an official position of the Commission on this issue, nor does it anticipate
such a position. It is informed by the international discussion on financial integration and
stability, both among relevant bodies and in the academic literature. It presents these topics in
a non-technical format that remains accessible to a non-specialist audience.

                                               1
CONTENTS

 1.1   Macroeconomic developments .................................................................................... 7
 1.2   Financial-market developments ................................................................................. 11

 2.1   Financial stability ...................................................................................................... 14
 2.2   Financial integration .................................................................................................. 20

 3.1   Market outlook .......................................................................................................... 26
 3.2   Drivers and challenges of sustainable investing........................................................ 30
 3.3   The role of sustainable bonds and funds in financing the post-COVID-19 recovery 37
 3.4   Conclusion ................................................................................................................. 41

 4.1   Brief overview of typologies of climate-related risks for financial stability ............. 43
 4.2   Impact on the economy and on the financial system ................................................. 44
 4.3   Climate-related policy action..................................................................................... 55
 4.4   Conclusion ................................................................................................................. 60

                                                               2
ACKNOWLEDGEMENTS
This document was prepared by the European Commission’s Directorate-General for Financial
Stability, Financial Services and Capital Markets Union (DG FISMA) under the direction of
John Berrigan (Director-General), and Klaus Wiedner (Director, Financial system surveillance
and crisis management).

The production of the document was coordinated by the editor Geert Van Campenhout.
Principal contributors were (in alphabetical order) Chris Bosma, Anna Grochowska, Geert Van
Campenhout, Mariana Tomova and Tomas Vaclavicek.

Several colleagues from DG FISMA and other parts of the Commission provided comments,
suggestions or assistance that helped to improve the text. We are particularly grateful to (in
alphabetical order) Leonie Bell, Peter Grasmann, Max Langeheine, Michela Nardo, Nathalie
Ndacyayisenga, Nicola Negrelli, Andreas Rajchl and Vasielois Stavropoulos.

Comments are welcome and can be sent to:

Directorate-General for Financial Stability, Financial Services and Capital Markets Union
(DG FISMA)
Unit E1: EU/euro-area financial system
Unit E4: Economic analysis and evaluation

European Commission
1049 Brussels
Belgium

Or by email to leonie.bell@ec.europa.eu or peter.grasmann@ec.europa.eu.

                                              3
LIST OF ABBREVIATIONS
Countries (in alphabetical order)

 AT                Austria                                        IT         Italy
 BE                Belgium                                        JP         Japan
 BG                Bulgaria                                       LT         Lithuania
 CN                China                                          LU         Luxembourg
 CY                Cyprus                                         LV         Latvia
 CZ                Czechia                                        MT         Malta
 DE                Germany                                        NL         Netherlands
 DK                Denmark                                        PL         Poland
 EE                Estonia                                        PT         Portugal
 EL                Greece                                         RO         Romania
 ES                Spain                                          SE         Sweden
 FI                Finland                                        SG         Singapore
 FR                France                                         SI         Slovenia
 HR                Croatia                                        SK         Slovakia
 HU                Hungary                                        UK         United Kingdom
 IE                Ireland                                        US         United States

Others

 AML               Anti-money laundering                          GDP        Gross domestic product
 BIS               Bank for International Settlements             HICP       Harmonised index of consumer prices
 bps               Basis points                                   ICT        Information and communication
                                                                             technology
 CBCC              Central-bank cryptocurrency                    IT         Information technology
 CEE               Central and Eastern Europe                     KYC        Know-your-customer
 CFT               Counter-terrorism financing                    MFIs       Monetary financial institutions
 CLOs              Collateralised loan obligations                MiFID II   Markets in Financial Instruments
                                                                             Directive
 CMU               Capital markets union                          MREL       Minimum requirement for own funds and
                                                                             eligible liabilities
 DLT               Distributed ledger technology                  NBER       The National Bureau of Economic
                                                                             Research
 EBA               European Banking Authority                     NFC        Non-financial corporation
 ECB               European Central Bank                          NPLs       Non-performing loans
 EIOPA             European Insurance and Occupational Pensions   PSD        Payment Service Directive
                   Authority
 EMIs              Electronic money institutions                  TLTROs     Targeted longer-term refinancing
                                                                             operations
 ESMA              European Securities and Markets Authority

                                                           4
EXECUTIVE SUMMARY
The annual European Financial Stability and Integration Review reports on recent economic
and financial developments, and their impact on financial stability and integration in the EU.
This report covers in particular the developments in 2020.
2020 was very strongly marked by the COVID-19 pandemic. The pandemic is an
unprecedented health challenge that caused severe economic disruptions. Lockdowns and other
measures to contain the outbreak have sent an unparalleled shock through EU economies that
also tested financial stability and integration. The effects of the crisis are still unfolding. The
unique character of the recession triggered an exceptional policy response. Authorities
introduced a mix of fiscal, monetary regulatory and other measures to cushion economic
disruptions, stimulate recovery and manage social impacts. Chapter 1 and Chapter 2 describe
how the pandemic affected the macroeconomic environment and financial markets, and reviews
the implications for financial stability and integration.
While it is necessary to put a particular focus on dealing with the pandemic, other, and often
more long-term challenges remain, particularly those related to sustainability such as climate
change and biodiversity loss. At EU level, the European Commission adopted the European
Green Deal that aims to build a climate-neutral EU by 2050 with a modern, resource-efficient
and competitive economy. The transition towards a more sustainable society requires
significant investment by the public and private sector. Financial markets can help by attracting
sustainable investors, foster risk-sharing and properly price climate and other sustainability
risks. At the same time, climate change and other forms of environmental degradation also pose
significant economic and financial risks that should be monitored actively during the transition
towards a more sustainable society. The last two chapters of the report look at these issues.
Chapter 3 analyses recent developments in the sustainable fund and green bond market.
Chapter 4 reviews the financial stability risks, focusing on climate change.
Chapter 1 reviews the devastating economic effects of the COVID-19 pandemic. Most
Member States introduced lockdowns to contain the spread of the virus. These lockdowns
compounded the effects of the virus and largely paralysed EU economies for some time. This
sudden shock immediately eroded macroeconomic fundamentals and triggered severe
uncertainty and liquidity shortages that disrupted financial markets. The timely and
comprehensive mix of fiscal, monetary and regulatory measures was vital to cushion the impact
of the pandemic. It was essential to support the stability and functioning of financial markets
and it helped banks to continue to provide loans to the real economy.
Chapter 2 reviews the impact of the pandemic on financial stability and integration. Decisive
policy action has so far been effective in avoiding the risks of harmful financial disruption and
fragmentation, but significant risks remain and require careful monitoring to avoid that the crisis
leaves deep permanent scars. The orderly and gradual unwinding of support measures, and
structural and financial imbalances will be important to limit financial stability risks over time.
The pandemic has put significant stress on all sectors, with some more affected than others.
The financial sector is now more exposed to economic shocks, although the roots of certain
vulnerabilities were already present before the crisis.
Three financial stability concerns deserve particular attention. Firstly, the risk of disruptive
repricing increased because financial market valuations became very stretched and credit risk
5could be underpriced. Consequently, sudden changes in investor sentiment or rising inflation
expectations could trigger a market correction. Secondly, debt levels reached new highs,
putting corporate and sovereign debt sustainability under further pressure. Finally, EU banking
sector stress threatens to pick up amid concerns about low profitability and deteriorating asset
quality caused by the economic fallout of the pandemic. The COVID-19 outbreak also tested
financial integration in the EU, but disruptive financial fragmentation remained manageable
thanks to policy measures.
Chapter 3 reviews developments in the market for sustainable investments. The growing
popularity of sustainable funds and green bonds shows that sustainable investments have
become more mainstream, although their share in total fund and bond markets remains limited.
Regulatory changes, including establishing a framework under the EU Taxonomy Regulation to
facilitate sustainable investment and other measures to increase transparency, supported further
market growth. Investors appear more open to investing sustainably. This, together with other
factors, has contributed to the growth in the market. Products branded as sustainable are also
key as they catch investors’ attention. There is therefore an incentive to offer these types of
products so as to attract new investment.
Despite the strong growth in the market, significant challenges remain. More readily available,
consistent, accurate and clear sustainability-related information (at economic activity level,
firm level and portfolio level) would increase the transparency and integrity of the market. It
would also limit search costs for investors and ensure that sustainable investment products have
a clear impact on the real economy. Building on its 2018 action plan for financing sustainable
growth, the European Commission has already taken several initiatives to increase market
transparency. Further work in this area is needed to support market developments and continue
improving market integrity and transparency in the post-COVID-19 period.
Chapter 4 discusses the implications of climate change on financial stability. It points out that
there are significant economic and financial risks related to climate change and the transition to
a more sustainable economy. Methodological challenges, data limitations and uncertainty about
future climate change developments hinder accurate risk estimates, which points to possible
under-pricing. The timing and magnitude of these impacts differ according to the scenario
being considered. The lack of adequate policy and pricing frameworks prevents financial
markets from fully reflecting external climate-related factors in prices.
Climate-related financial exposures and potential changes in asset prices do not pose direct
substantial risks to financial stability according to available data, but the high concentration of
risks makes some countries, sectors and individual financial institutions highly vulnerable. Risk
related to climate change and other sustainability challenges such as environmental degradation
may have a destabilising effect on the financial system if they come on top of other risks.
Continued collective effort is needed to enhance the measurement of these risks via risk
monitoring frameworks, stress tests and scenario analysis. The Commission’s proposal for a
Corporate Sustainability Reporting Directive will be instrumental in this respect. It will further
harmonise firm-level reporting by developing new EU sustainability reporting standards taking
into account parallel initiatives such as the EU Taxonomy. It is also important to explore means
under the prudential framework to better integrate environmental risks and to support more
sustainable and resilient banking and insurance sectors.
6Chapter 1 MACROECONOMIC AND MARKET DEVELOPMENTS
The ongoing COVID-19 pandemic is first and foremost an unprecedented health challenge.
However, it has also had severe economic consequences deepened by lockdowns that largely
paralysed EU economies and increased uncertainty. Other economic effects are still unfolding.
In the EU, the pandemic has caused the biggest economic contraction since World War II 1.
Chart 1.1: Real GDP growth worldwide Chart 1.2: Real GDP growth in the EU
15% Forecasts 24% Forecasts
10% 16%
5% 8%
0% 0%
-5% -8%
-10% -16%
-15% -24%
2018 2019 2020 2021 2022 2018 2019 2020 2021 2022
Germany Spain France
EU-27 EA-19 China United States Italy Netherlands Poland
Source: OECD. European Commission (2021), European Source: European Commission (2021), European economic
economic forecast. Winter 2021 (Interim), Institutional forecast. Winter 2021 (Interim), Institutional Paper 144,
Paper 144, February 2021. February 2021.
Note: Quarterly, year-on-year data. Note: Quarterly, year-on-year data.
The COVID-19 crisis first hit EU economies in March 2020 2. It had a dramatic and immediate
macroeconomic effect and also completely modified the macroeconomic outlook, requiring
public intervention measures of an unprecedented scale (see Box 1). Lockdowns, which were
introduced in most Member States, reduced supply by disrupting supply chains and suspended
non-essential activities. Demand also decreased, as the lockdowns led to an increase in
precautionary saving due to income uncertainty. Firms postponed or cut investment because of
uncertain future sales and profitability. In March, economic activity dropped by around one
third in several Member States, practically overnight. Heightened overall economic uncertainty
also resulted in a liquidity shock due to interrupted cash flows, and increased stress in the
financial sector (see Section 1.2 and Section 2.1).
In the EU, GDP in 2020 dropped by 6.1% 3. More specifically, Q1-2020 GDP (seasonally
adjusted) dropped by 3.3% on a quarter-on-quarter (q-o-q) basis (see Chart 1.2). The strongest
hit to economic output occurred in the second quarter with real GDP contracting 11.2% in the
EU. Following the trough in April, the economy rebounded strongly in the third quarter
1 Macro-economic conditions and growth already weakened in the second half of 2019. For further details, See European
Commission, European Financial Stability and Integration Report (EFSIR), SWD(2020) 40 final of 3 May 2020.
2 See also Jollès, M. and Meyermans, E. (2021), The structural economic impact of the COVID-19 pandemic on the euro
area: a literature review, Quarterly Report on the Euro Area 20(1).
3 Based on estimations by Eurostat published on 19 April 2021.
7(+11.7%) amid the gradual easing of containment measures, and made up about two thirds of
the contraction in the first half of the year. GDP contracted 0.5% (q-o-q) in Q4 2020, just as the
second wave of the pandemic hit the continent 4. GDP is expected to rebound by 3.7% in 2021
and by 3.9% in 2022, with a return to pre-pandemic levels around mid-2022 5. Economic
sentiment and consumer confidence plummeted in the first half of the year and recovered
partially since (see Chart 1.3).
Chart 1.3: EU economic sentiment and consumer Chart 1.4: Euro-area activity of manufacturing and
confidence indicator services purchasing managers
0 120 70
-10 100 50
-20 80 30
-30 60 10
2018 2019 2020 2021 2018 2019 2020 2021
Economic sentiment indicator (rhs) Manufacturing PMI Services PMI
Consumer confidence indicator
Source: European Commission (2021), Business and consumer Source: Markit.
survey results, DG ECFIN, 25 February 2021 6. Note: Activity level is measured by the euro-area purchasing
Note: The economic sentiment indicator is a composite indicator managers’ (PMI) manufacturing and services indexes.
combining judgements and attitudes of businesses and
consumers. The consumer confidence indicator reflects
overall perceptions and expectations by households.
Inflation was significantly affected by the pandemic due to a sharp fall in energy prices and
reduced aggregate demand, particularly for services 7. Inflation in the EU was 0.7% (on
average) over the summer but dropped to 0.3% at the end of 2020, before picking up to 1.7% in
March 2021.
The pandemic affected unemployment, but increases in average unemployment rates remained
contained, thanks to the widespread use of job retention schemes, supported by the EU SURE
instrument (instrument for temporary Support to mitigate Unemployment Risks in an
Emergency) and other measures. Following an increase of about 1.4 percentage points over the
first half of the year, the EU unemployment rate stabilised in the second half to 7.5% in
December 2020, 1 percentage point above the unemployment rate in February 2020 8 (see
4 For the euro area, GDP growth in 2020 dropped by 6.6%. GDP in Q1 2020 dropped by 3.8% (on a q-o-q basis) and by
11.6% in Q2 2020. In Q3 2020, GDP recovered by 12.5%. In Q4 2020 GDP contracted slightly by 0.7%. In comparison,
global GDP (excluding the EU) is projected to have contracted by 3.4% in 2020, which is a sharper downturn than during
the 2008 financial crisis. Global GDP is expected to rebound by 5.2% in 2021 and by 3.8% in 2022, implying that global
output should recover above its 2019 level at the end of 2021.
5 In the euro area, GDP is expected to rebound by 3.8% in 2021 and by 3.8% in 2022.
6 https://ec.europa.eu/info/business-economy-euro/indicators-statistics/economic-databases/business-and-consumer-
surveys/download-business-and-consumer-survey-data/time-series_en.
7 Temporary VAT reduction in Germany also weighed on inflation.
8 The value in February 2020 was the lowest since May 2008.
8Chart 1.5). The Commission’s 2020 autumn economic forecast projects a rise in the
unemployment rate to 8.6% or 18.5 million unemployed people in 2021.
The depth of the recession varied widely between Member States (see Chart 1.2). Over the full
year 2020, it is expected that Spain (-11%) and Greece (-10%) will have had the strongest GDP
decline, while other larger Member States like Italy (-8.8%), France (-8.3%), Germany (-5.0%)
also are expected to have experienced significant declines. Several Member States with already
heightened macroeconomic and financial vulnerabilities have been hit strongly. Differences
between Member States reflect differences in the severity of the pandemic, economic structure
and containment measures. Such differences heighten concerns about economic divergence,
especially as they will also carry over to the recovery. Unemployment and inflation rates also
developed asymmetrically between Member States (see Chart 1.5 and Chart 1.6).
Unemployment rates in Member States with already elevated rates before the pandemic
increased more than in Member States with low initial unemployment rates. At the end of 2020,
Spain and Greece had unemployment rates around 16%, while the Netherlands, Poland and
Czechia had rates between 3 and 4%.
Economic developments were also very uneven across industry sectors (see Chart 1.4). For
instance, restrictions on social activities and mobility affected the leisure and travel sector
profoundly. As a result, activity in the services sector was more affected compared to the
manufacturing sector.
Chart 1.5: Unemployment rate Chart 1.6: HICP inflation
20% 4%
Forecasts Forecasts
3%
15%
2%
10%
1%
5%
0%
0% -1%
2016 2017 2018 2019 2020 2021 2022 2018 2019 2020 2021 2022
Germany Spain France Germany Spain France
Italy Netherlands Poland Italy Netherlands Poland
Source: Eurostat, European Commission (2020), European Source: Eurostat, European Commission (2021), European
economic forecast Autumn 2020, Institutional Paper economic forecast. Winter 2021 (Interim), Institutional
136, November 2020. Paper 144, February 2021. DG FISMA calculations.
Note: HICP refers to harmonised index of consumer prices.
Quarterly, year-on-year data.
9Box 1: Key policy measures taken in response to the pandemic
Comprehensive national and EU measures were taken quickly in response to the outbreak9.
Measures were diverse and included containment, fiscal, monetary and regulatory actions.
EU Member States took drastic measures to contain the virus and put their economies into a state
of hibernation. Lockdowns were implemented in most Member States. Comprehensive
programmes were set up to keep the economic tissue of economies intact during lockdown. This
included liquidity support for firms to avoid bankruptcies, targeted tax relief measures, and
income support for those that became (temporarily) unemployed. In the financial sector, (partial)
government guarantee schemes for bank loans were introduced. These measures were essential for
limiting permanent damage as they cushioned unemployment, halted a reversal in investment, and
prevented widespread bankruptcies. Proactive fiscal policy has been widely used.
Actions at EU level were taken gradually over time and complemented national measures. In
March the EU activated the ‘general escape clause’ 10 in its fiscal rules, which enabled Member
States to provide a strong fiscal response to the crisis. In April 2020, the European Council
Summit set out a Joint European Roadmap towards lifting containment measures. It agreed on
several important EU support instruments, including a European Stability Mechanism (ESM)
pandemic credit line, European Investment Bank (EIB) credit guarantees, a EUR 25 billion
guarantee fund for small and medium-sized enterprises (SMEs), and a temporary labour market
support tool (SURE), worth EUR 100 billion. On 21 July 2020, EU leaders agreed on the adoption
of the NextGenerationEU recovery fund (EUR 750 billion) 11 to help repair the immediate
economic and social damage of the pandemic, and safeguard the cohesion within the EU. This
includes the Recovery and Resilience Facility that will release up to EUR 672.5 billion in loans
and grants to support reforms and investments of Member States, and to facilitate a sustainable
and equitable economic recovery. On 17 December, the next long-term EU budget was agreed.
Finally, decisive action by the ECB has strongly reduced tail risks 12 in the EU economy. In mid-
March, the ECB took a broad range of monetary and credit policy measures to ensure the flow of
liquidity and credit to the private and public sectors. The new temporary pandemic emergency
purchasing programme (PEPP) was set up, enabling the ECB to purchase private and public sector
securities. The total PEPP envelope was initially set at EUR 750 billion (ending end-2020), but
was later extended to EUR 1.85 trillion (running until at least March 2022) 13.
The ECB’s measures were complemented by measures from the Single Supervisory Mechanism
(SSM). The SSM measures relaxed regulatory bank requirements and provided temporary capital
and operational relief to euro-area banks that could be used to absorb losses or to provide loans to
the real economy.
9 Also at global level governments initiated massive support programmes that surpass those made in response to 2008
financial crisis. Across the G20 economies, in total USD 7.6 trillion in fiscal commitments have been made (11% of GDP).
10 EU Member States are constrained by fiscal rules in place at EU level, in particular by the Stability and Growth Pact (SGP).
The SGP, however, contains a clause, the 'general escape clause', allowing Member States to undertake appropriate
budgetary measures, and so deviate from parts of the Pact in the face of exceptional circumstances. The magnitude of the
fiscal effort necessary to protect people and businesses in the EU from the effects of the pandemic, and to support the
economy in the aftermath, justified the activation of the general escape clause.
11 EUR 390 billion in the form of grants and the remainder in loans to Member States.
12 The risks associated with severe events that have a small probability of happening.
13 In addition, the ECB expanded and eased the conditions for its targeted refinancing operations (among others targeted
longer-term refinancing operations (TLTRO III)), and launched a new series of non-targeted pandemic emergency longer-
term refinancing operations (PELTROs) to support liquidity in the euro-area financial system and to help preserve the
smooth functioning of money markets by providing an effective liquidity backstop.
10At the beginning of 2020, before the pandemic hit, investors had already shown a willingness
to take on risk, despite some unfavourable conditions (including softening macroeconomic
conditions, uncertainty over ongoing trade tensions, Brexit and wider political uncertainty). As
a result, prices in riskier market segments soared to new highs and risk spreads tightened amid
a continued search for yield. At the same time, volatility in EU financial markets remained
subdued (see Chart 1.7).
In the second half of February 2020 investor Chart 1.7: Volatility in EA and US bond and stock
markets
sentiment changed profoundly (see Chart
90 12
1.3) as it became clear that COVID-19 could
not be contained to China and was spreading
across all continents. Uncertainty about the
magnitude of the pandemic and its economic 60 8
impact triggered a sharp market reaction and
led to a short-term liquidity shock in key
market segments that tested the resilience of
30 4
markets and financial institutions.
Developments in sovereign bond markets in
2020 were strongly driven by ECB monetary
0 0
support actions 14 (see Chart 1.9). In late 2018 2019 2020 2021
February and early March, the downward EA equity US equity
EA Bonds (rhs) US Bonds (rhs)
trend in the German benchmark bund yield
Source: Bloomberg. DG FISMA calculations.
strengthened as investors sought refuge in Note: Equity volatility is measured by the EA and US volatility
the safest assets. The 10-year German Bund indices (VIX). Bond volatility is measured by the 3-month
implied volatility computed at 100% moneyness by
yield reached a historic low of -0.85% on Bloomberg. EA bonds are represented by German bonds.
9 March amid extreme risk aversion. Yields
of some other sovereigns, however, started to climb as investors incorporated the effect on
public finance due to fiscal policy responses to the pandemic. Later in March, investors started
to sell off even the safest sovereign bonds to turn to cash and money market assets as they were
disappointed that the ECB decided not to step up its interventions in government bond markets.
For instance, over 8 trading days, the 10-year German Bund yield shot 66 basis points (bps)
higher to -0.19%, while by 17 March the yield on the 10-year Italian sovereigns had risen to
2.80% 15.
It was only after the PEPP support was announced on 18 March that benchmark bond yields
softened. Since then, German bond yields have oscillated between -0.6% and -0.3% in a tight
slightly downward moving channel. Peripheral sovereign bond yields experienced another but
generally less pronounced surge in April, before easing in view of the prospects offered by a
European recovery fund. Thereafter, sovereign bond yields declined over the remainder of the
year back to 2019 levels, also largely driven by the ECB’s asset purchase programmes and the
strong coordinated policy response at EU level. The latter includes the agreement for common
14 Also the instalment of the ESM pandemic credit line, and the announcement of the NextGenerationEU fund have positively
impacted sovereign bond prices. For details, see Communication from the Commission, Europe's moment: Repair and
Prepare for the Next Generation, SWD/2020/98 final of 27 May 2020.
15 A spread of 300 bps to the Bund compared with 160 bps at the start of 2020.
11EU debt issuance to assist in particular those countries most heavily affected by the virus,
which reduces the pressure on national debt issuance programmes. Most non-euro area (EA)
sovereign bond yields have followed a similar path as their EA equivalents. While the
sovereign bonds of these Member States cannot directly benefit from ECB monetary support
measures, such as the PEPP, they have benefited indirectly. Lower yields were further
supported by the general search for yield by investors.
Chart 1.8: Sovereign-bonds yields and expected Chart 1.9: Sovereign-bond spreads
inflation.
4% basis points
-0.1% 300
3%
-0.4% 200
2%
1%
-0.7% 100
0%
-1% -1.0% 0
2018 2019 2020 2021 Jan 20 Apr 20 Jul 20 Oct 20 Jan 21
DE Yield US Yield DE Inflation US Inflation
DE (lhs) ES FR IT
Source: Bloomberg. Source: Bloomberg. DG FISMA calculations.
Note: 10-year maturity bond data. 10-year inflation expectations Note: Spreads are calculated against the 10-year German Bund.
based on the break-even inflation rate on inflation-linked
bonds.
In riskier market segments, such as equities and high-yield corporate bonds, investors cut their
exposures sharply at the start of the COVID-19 outbreak, when unfolding lockdown measures
raised concerns about liquidity, profitability and solvency. This led to the fastest market sell-off
since the 2008 financial crisis. Equity markets collapsed, with major market indices tumbling
by 35-45% in the 20 trading days between mid-February and 19 March 2020 (see Chart 1.10).
Volatility spiked, with the European volatility index (VSTOXX) reaching an intraday high of
90% on 18 March (compared with levels of around 15-20% until mid-February). Around mid-
March, financial market authorities in several Member States adopted temporary emergency
short-selling prohibitions, and the European Securities and Markets Authority (ESMA) decided
that net shorters that established a position in excess of 0.1% 16 in shares traded on an EU
regulated market had to notify the relevant national competent authority.
From March to April, financial markets reversed course and equity markets witnessed a
remarkable rebound as investor optimism increased following the monetary and economic
support measures described above. Overall, EU equity markets increased by 20% in Q2 2020,
the best quarterly performance since 2015. Yet, sectoral performance has varied quite
significantly. While at the end of June the EU aggregate equity index (Eurostoxx 600) was still
11% lower than at the beginning of January, the drop was much sharper for EU airlines (36%)
and banking (30%). In Q3 2020, EU equity markets remained broadly stable, although some
16 Following the entry into force of the decision.
12national stock exchanges of Member States whose economies had been relatively less affected
by the pandemic (e.g. Germany and Ireland) showed record gains, while those of the hardest hit
economies underperformed. Markets increased further in late autumn, driven by encouraging
vaccine news and largely unaffected by the second wave of COVID-19 infections and the
partial lockdowns across Europe.
Chart 1.10: Stock market performance Chart 1.11: Euro-area corporate bond spreads
Jan 2020=100 basis points
130 250 1200
200 1000
110
150 800
90
100 600
70
50 400
50 0 200
Jan 20 Apr 20 Jul 20 Oct 20 Jan 21 Jan 20 Apr 20 Jul 20 Oct 20 Jan 21
Eurostoxx 600 EU Banks index
US S&P 500 Hang Seng Composite AA A BBB HY (rhs)
Stoxx Asia Pacific 600
Source: Bloomberg. Source: Bloomberg. DG FISMA calculations.
Note: 5-year maturity bond data. Spreads are calculated against
the 5-year German sovereign bond yield.
European corporate bond markets mirrored equity market developments (see Chart 1.11). At
the beginning of 2020, spreads were at historically low levels and volatility was low. Primary
market activity was very strong, with high levels of issuance. At the end of February, however,
corporate bond spreads widened significantly. Corporates turned to banks to tap credit
facilities, as primary markets shut down. In the secondary markets, corporate bond yields
spiked amid low market liquidity. Some leveraged investors were forced to sell their assets in
order to meet margin calls on their repo and derivatives positions, exerting downward pressure
on bond and other prices. Both investment-grade and high-yield bonds experienced the steepest
all-time decline in market value. Spreads on AA investment grade bonds increased from 50 bps
to over 150 bps, while high-yield bond spreads widened from 350 bps to more than 1 050 bps
in a span of 4 weeks (from mid-February until 19 March).
The ECB responded by easing its policy so that bonds that had recently been downgraded from
investment grade to high-yield status (‘fallen angels’) remained eligible as collateral for
liquidity providing operations, as long as their rating remained equal to or above ‘BB’. This
supported the corporate bond market, which started to recover in April. Bond spreads narrowed
in the secondary market and issuances in the primary market increased. Over the remainder of
2020, spreads steadily declined, but differences between sectors remained. Healthcare and
technology recovered easily, which was not the case for instance for the automotive or energy
sectors. At the end of 2020, corporate bonds spreads in all segments were around pre-COVID-
19 levels.
All in all, the V-shaped recovery in financial markets over 2020 was remarkable, but, towards
the end of the year it raised concerns about a growing misalignment with macroeconomic
fundamentals (see Section 2.1.1).
13Chapter 2 FINANCIAL STABILITY AND INTEGRATION
The COVID-19 crisis has put significant stress on the balance sheet of households, firms, banks
and governments, and exacerbated certain vulnerabilities that were already elevated pre-
crisis 17. As summarised in Chapter 1, policymakers took unprecedented policy measures to
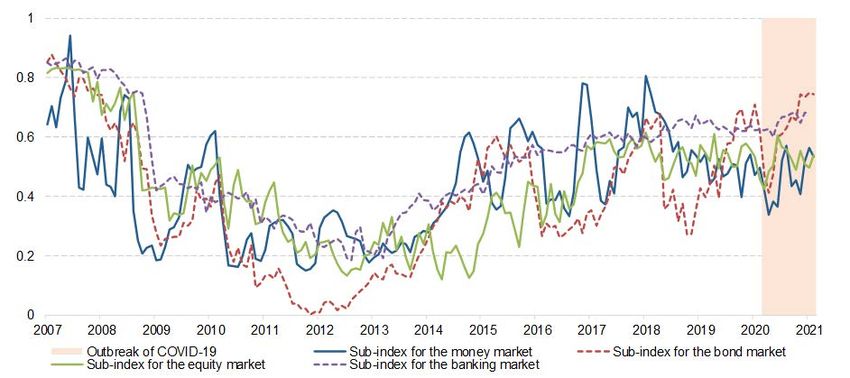
smooth out the impact of the crisis and stimulate the recovery. The decline of the ECB systemic
stress indicator is a good illustration of how successful policy makers were in containing
financial risk in 2020 (see Chart 2.1).
Chart 2.1: Composite indicator of systemic stress
Source: European Central Bank (ECB) Statistical Data Warehouse 18.
Note: Euro area, CISS - Composite Indicator of Systemic Stress. Figures measured in pure numbers. Figures can take values between 0
and 1.
However, three main risks to financial stability prevail. The first risk is that certain asset classes
in major financial markets may be repriced disruptively, thereby affecting the broader financial
system. Second, concerns about debt sustainability in the sovereign and the non-financial
corporate sector have increased. Finally, stress in parts of the EU banking sector may resurge.
2.1.1 Disruptive repricing in major financial market asset classes
Financial markets performed strongly in the second half of 2020 (see Section 1.2) despite
substantial economic uncertainty and lower growth and corporate earnings. This trend was
largely attributable to the continued coordinated monetary and fiscal support measures. These
measures have been powerful and ensured that market players had more than sufficient access
to low-cost funding. On the other hand, they increase moral hazard risk - with investors
speculating that central banks will continue to intervene in current and future market crises -
and the risk that market valuations become decoupled from fundamentals. This ‘decoupling’,
17 Pre-crisis vulnerabilities include debt sustainability; stretched risk premia in asset markets; underpriced credit and interest
rate risk; low banking sector profitability; stretched monetary policy; and investors’ exposure to less liquid and risky assets
as a result for the search-for-yield in the very low interest rate environment. See European Commission, European
Financial Stability and Integration Report (EFSIR), SWD(2020) 40 final of 3 May 2020.
18 https://sdw.ecb.europa.eu. Series key CISS.D.U2.Z0Z.4F.EC.SS_CI.IDX.
14together with a possible under-pricing of credit and interest rate risks, may increase market
volatility and the risk of sharp price corrections.
Valuations in March 2021 (when this report was drafted) were high, especially in more risky
market segments. Valuations in stock markets are quite elevated and corporate bond spreads,
especially in the high-yield segment, were compressed. In autumn 2020, US market valuations
surpassed the already elevated levels observed in early 2020 and mirrored levels associated
with the market bubbles of 1929 and 2000. While European stock market valuations are more
moderate, they could experience negative spillover effects from sell-offs elsewhere.
Fixed income markets have also become more risky. Bond prices are more sensitive to changes
in yield due to the extreme low interest rates and the longer duration of outstanding bonds 19,
increasing the risk of pronounced and costly decreases in valuation over time.
The risk of disruptive repricing also depends upon investors’ willingness to take risk. If
investors’ willingness fades, high valuations and too-low risk premiums can result in steep
market sell-offs. In addition, the possible economic and broader consequences of COVID-19,
like potential widespread corporate defaults, an unexpected rise in inflation and interest rates,
or increased political and policy uncertainty, could further trigger significant asset price
adjustments.
2.1.2 Sustainability of sovereign, household and non-financial corporate debt
Massive fiscal support led to sizeable budget deficits and all-time-high debt-to-GDP ratios. The
EU’s aggregate government deficit increased from 0.5% of GDP in 2019 to 5.6% in Q3 202020.
In line with this, the aggregate debt-to-GDP ratio increased from 79.2% in 2019 to 89.8% in
Q3 2020.
The swift and strong response by the ECB and the EU to support low-cost financing has
prevented a sovereign debt crisis. Member States have lengthened the average maturity of their
outstanding debt to reduce rollover risk and spread financing costs over time in view of the low
interest rate environment. Low interest rates also reduce interest costs and will help reduce the
debt-to-GDP level over time. However, it will be important for Member States to achieve
sufficient growth. The substantial EU support measures and other structural reforms, together
with the recovery and resilience programmes that Member States will put in place, will be key
to stimulate investment and growth. A balanced fiscal discipline that does not compromise
growth or put the sustainability of debt at risk is also required.
Investors are still confident that sovereign debt in Member States will remain sustainable.
Accordingly, sovereign bond spreads have narrowed, credit default swap (CDS) spreads have
gone back down to pre-COVID-19 levels, and sovereign credit ratings have remained stable.
Debt sustainability risks continue to linger, however, given the unprecedented nature of the
crisis and uncertainty about how it will unfold in the future. Government guarantees put in
place to support firms, the self-employed and households are one source of risk. Government
19 The duration of the global bond market has increased by approximately 5%, to a record high, as both corporates and
governments have taken advantage of low yields to extend maturity (calculations based on data by Bloomberg). The market
value of the global bond market has risen by 27% in the past 2 years.
20 Figures based on Eurostat.
15guarantees are on average above 15% of GDP across the euro area, representing a significant
potential risk to public finances if some of them were to be called.
Government support, such as social transfers and temporary relief from tax burdens, has helped
households to cushion the drop in disposable income. The European Commission launched
several measures, including the COVID-19 Banking Package, targeted ‘quick fix’ amendments
to EU banking rules, and a set of best practices for banks and insurers, to facilitate bank lending
and to alleviate the impact of COVID-19 on consumers 21. Payment moratoria have been
effective to address short-term liquidity needs. Debt repayment concerns nevertheless remain
present due to expected increases in unemployment 22 (see Section 1.1) and the ending of loan
moratoria in the future. Bank loan moratoria in several Member States are limited in time (6 to
12 months), and the European Banking Authority (EBA) recommended that regulators return to
normal 23.
In the non-financial corporate sector, exceptional policy measures 24 helped to maintain
favourable financing conditions and alleviated immediate corporate liquidity constraints that
contained insolvencies. Loans to non-financial corporations (NFCs) expanded strongly despite
the sharp decline in real activity. This reflected firms’ increased demand for working capital
and more relaxed credit standards. Supported by banks loans, the external financing gap 25 of
corporates, including SMEs, remained positive 26.
In this crisis, lower-rated issuers and SMEs have relied more heavily on revolving bank credit
facilities than stronger-rated issuers. Meanwhile, investment-grade issuers have issued
considerably more debt, especially those issuers from relatively resilient sectors. However, on
average, the quality of debt declined. Larger firms with weak corporate fundamentals were still
able to attract funding relatively easily, partially because investors in search for yield were
willing to provide it. This increased concerns about debt sustainability, especially given that
pre-crisis debt levels of non-financial corporations were already high. Credit rating downgrades
of non-financial corporates in the euro area peaked in March and April 2020 (mainly in the
speculative grade segment). The downgrades eased since their peak in the spring but many
firms remain at risk, as evidenced by the historically large number of negative outlooks 27.
Also for the corporate sector, concerns have risen about cliff-edge effects when fiscal and
supervisory measures will expire and may negatively affect credit supply. Overall, it is
expected that as a result of support measures the peak in insolvencies will start later in 2021. In
addition, the rise in non-performing loans will weigh on credit standards. Tighter funding
21 For further details, see https://ec.europa.eu/commission/presscorner/detail/en/ip_20_740.
22 In particular, households’ debt sustainability is likely to be more impacted in those Member States, with a strong rise in
unemployment (ES), very high unemployment rates (EL), a high debt-to-disposable-income ratio (DK, SE, LU, CY and
EL), or a limited capacity of households to resort to existing savings (NL).
23 For further details, see https://www.eba.europa.eu/regulation-and-policy/credit-risk/guidelines-legislative-and-non-
legislative-moratoria-loan-repayments-applied-light-covid-19-crisis.
24 Besides the accommodative monetary policy, guaranteed loans, job-retention programmes, and debt moratoria were most
important to lower the liquidity gap.
25 The external finance gap refers to the difference between the change in demand for and the change in availability of external
financing.
26 For more detailed information on the availability of sources of finance and the demand for funding by NFCs, including
SMEs, see the ECB survey on the access to finance of enterprises in the euro area.
https://www.ecb.europa.eu/stats/ecb_surveys/safe/html/index.en.html.
27 For further details, see Section 2.3 in European Central Bank (ECB) (2020), Financial Stability Review, November 2020.
16conditions and risks of rating downgrades will also limit corporates’ ability to roll over
maturing bonds. Large firms with access to capital markets may avoid solvency problems
because they can tap markets on favourable terms. Nevertheless, half of large publicly listed
firms in the euro area had an interest coverage ratio below one at the end of 2020, indicating
that they need to borrow to pay interest. Smaller firms and those that are more financially
vulnerable are more at risk, especially in certain sectors like accommodation and food,
education, and arts and entertainment.
The economic uncertainty and the uncertainty about the development of the COVID-19 crisis
makes it harder to distinct viable from non-viable firms. For viable firms in temporary distress,
preventive restructuring 28 could help to avoid that these firms are forced into premature
liquidation when crisis support measures (like moratoria on the obligation to file for bankruptcy
proceedings) are lifted. It would help them to survive until earnings pick up. Preventive
restructuring is important because insolvency frameworks tend to become less efficient in times
of crisis. It would thus be relevant to re-assess the viability of firms regularly over time 29 to
avoid that viable firms in temporary distress are forced into bankruptcy or zombie firms are
created over time 30.
2.1.3 EU banking sector stress
Overall, the EU banking sector was resilient, but concerns about deteriorating profitability and
asset quality are present. The banking sector benefited from monetary policy support and
regulatory measures 31 such as ECB liquidity provisioning, government loan guarantees, capital
and operational relief measures, and the Capital Requirements Regulation (CRR) quick fix
provisions 32. There is ample liquidity available in the banking system 33.
Banking sector vulnerability due to low profitability has increased. Bank profitability was
already subdued before the COVID-19 crisis and has been hit in the recent crisis. Bank
profitability dropped sharply in Q2 2020 due to higher loan loss provisions, impairments and
banks’ reduced ability to generate income. At least a quarter of euro-area banks recorded a loss
in Q2 2020 and the gap between good- and bad-performing banks is widening. Bank
profitability is likely to remain under pressure, as lending activity is expected to decrease and
provisioning is expected to be required. Tighter credit standards, lower demand from borrowers
and the ending of public guarantees will weigh on lending volumes, while margins are low.
28 Directive (EU) 2019/1023 of the European Parliament and of the Council of 20 June 2019 on preventive restructuring
frameworks, on discharge of debt and disqualifications, and on measures to increase the efficiency of procedures concerning
restructuring, insolvency and discharge of debt, and amending Directive (EU) 2017/1132, 20 June 2019.
29 OECD (2020), Insolvency and debt overhang following the COVID-19 outbreak: Assessment of risks and policy responses,
Tackling Coronavirus Series, November 2020.
30 In this respect, a viability test that, on top of the traditionally considered factors, would also account for specific factors like
changes resulting from a permanent shift in customer behaviour, regulation or a shift in values could help to better apply
preventive restructuring.
31 Banks also benefited indirectly from fiscal support measures that helped firms.
32 For further details, see Regulation (EU) 2020/873 of the European Parliament and of the Council of 24 June 2020 amending
Regulations (EU) No 575/2013 and (EU) 2019/876 as regards certain adjustments in response to the COVID-19 pandemic.
https://ec.europa.eu/commission/presscorner/detail/en/qanda_20_757; and https://www.eba.europa.eu/coronavirus.
33 With the targeted longer-term refinancing operations (TLRTO) operations, the ECB is assuring banks of funding at an
interest rate as low as -1%, as long as the banks lend the amounts to companies and households. The TLTRO (now EUR 1.7
trillion outstanding) has become one of the ECB’s most important crisis tools because it more than compensates banks for
the official policy rate of -0.5% that the ECB charges on its deposit facility.
17Provisions will be required given that the economic outlook has worsened since September, and
the adverse impact on asset quality is not yet captured by provisions.
The economic fallout from COVID-19 will significantly impact banks’ asset quality.
Government support to borrowers (moratoria 34) and public guarantees 35 may mean that the
effects become apparent more slowly than in past recessions, possibly only in 2021. Signs of
deteriorating asset quality are already noticeable. The capital cost to EU banks could reach half
a trillion in loan loss provisions. According to ECB estimates, non-performing loans in the EU
could reach EUR 1.4 trillion 36 in a severe scenario, exceeding the amount during the 2008
financial crisis. Despite the low profitability, it is important to avoid under-provisioning given
that asset quality is expected to deteriorate further over time. The magnitude of the decline in
asset quality is uncertain, however, as reflected in the different provisioning policies adopted
by banks. It is also a matter of supervisory concern.
Looking at the effect of the crisis on capital, banks have performed reasonably well since the
onset of the pandemic, but the crisis impact deserves further monitoring. The results of the
ECB’s vulnerability analysis in July 2020 37 showed that, overall, the sector could withstand
pandemic-induced stress, but depletion of bank capital would be materially significant if
conditions worsen 38. In contrast to the reduction in Q1 2020, aggregate-common-equity tier-1
(CET1) capital ratios of euro-area banks increased in Q2 2020 to around 14.5%, thanks to
rising capital and contracting risk weighted assets (RWAs).
More generally, the economic support measures strengthened the interplay between the
corporate, sovereign, household and banking sectors. This could increase banking sector
vulnerabilities due to spillover effects and feedback loops. Government transfers, bank loan
moratoria, sovereign corporate loan guarantees and other fiscal support measures were key to
help banks maintain asset quality, but this implies that the ending of such measures could have
an adverse effect. Already weak corporate fundamentals may weaken further and fuel corporate
defaults particularly in case of a premature withdrawal of policy support. In turn, widespread
corporate bankruptcies may contribute to a repricing of credit risk and reduce banks’
34 EU banks reported around EUR 850 billion loans under moratoria on June 2020 (260 billion (FR), 190 billion (ES), 160
billion (IT)), which corresponds to around 7.4% of total loans towards households and non-financial corporations (12% in
IT; 10% in ES; and, 8% in FR). The use of eligible moratoria schemes was widely dispersed, with some banks reporting
close to 50% (CY) of their total loans to households and NFCs being under moratoria. Small and Medium Enterprises
(SMEs) and Commercial Real Estate (CREs) exposures had the highest percentage of loans under moratoria (16% and 13%
resp., measured as share of total SME and CRE loans), while just 6% of housing mortgages were under moratoria. Around
50% of loan moratoria had an initial expiry date in September, and close to 90% expire before year-end 2021.
35 EU banks reported that EUR 180 billion of loans were subject to public guarantee schemes in June 2020, in particular in
Spain and France that both had between EUR 70-80 billion.
36 See Enria, A. (2020), Bank asset quality: this time we need to do better, Opinion Piece, 27 October 2020,
https://www.bankingsupervision.europa.eu/press/interviews/date/2020/html/ssm.in201027~31fda4bb8e.en.html.
37 See European Central Bank (ECB) (2020), Euro area banking sector resilient to stress caused by coronavirus, ECB Press
Release, 28 July 2020.
38 The results should be taken with caution as the ECB points out that the exercise was performed using ECB top-down
models that did not incorporate interactions with banks. Under the baseline scenario (still the most likely, even with the
current second wave), banks’ aggregate capital (CET1) ratio will be depleted by approximately 1.9 percentage points to
12.6%. This implies that the euro-area banking sector will remain, in aggregate, well-capitalised and can continue to fulfil
its core function of lending to the real economy. In the severe scenario, however, banks’ CET1 ratio is depleted by
approximately 5.7 percentage points to 8.8% by end-2022. The development is largely driven by impaired credit exposures,
market risk losses and lower profitability. Such a pronounced reduction in the bank sector’s own funds would prove
challenging. Several banks would need to take action to continue meeting minimum capital requirements. The analysis
shows that capital depletion would be stronger at diversified lenders, G-SIBs and universal banks, and small domestic and
retail lenders.
18willingness to lend. On the other hand, prolonged government support schemes could lead to
zombie firms that rely on policy support while exhibiting anaemic growth. Generous guarantee
programmes that continue over an extended period of time could also jeopardise the
sustainability of public finances if defaults eventually materialise. This could lead to further
bank losses, especially given that many banks have increased their sovereign exposure through
higher domestic sovereign debt holdings. Finally, the gradual phasing out of household income
support and loan moratoria could affect households’ ability to service mortgages and might
affect residential real estate prices 39.
2.1.4 Other EU financial stability risks
The prolonged low-yield environment also affects investors and insurers. Investors are pushed
into riskier and less liquid assets such as real estate funds and high-yield bonds 40. Low-interest-
rate conditions also weigh on insurers’ profitability and solvency and may lead to further shifts
in investment towards riskier and less liquid assets.
Cyber risk is also a source of significant systemic risk with potentially serious adverse
consequences for the real economy. The total cost of cybercrime is growing quickly and
outpacing investment in cyber security. The financial sector is highly exposed to cyber threats.
Attacks on a significant financial institution, financial market infrastructure or public institution
are a threat on their own, but can also have spillover effects to other parties. Corporates can
also be affected by cyber risk and the sharp increase in remote working during the COVID-19
crisis makes firms more exposed to cyber-attacks. With the release of the Digital Operational
Resilience Act (DORA), the EU has been taking measures to better arm the financial sector
against major ICT-related incidents 41.
Furthermore, climate and other environmental risks could turn into systemic financial stability
risks if markets do not price these risks correctly. Estimates of the impact of physical risks on
asset prices appear reasonable, but they vary considerably according to the expected degree of
global warming or environmental degradation. In addition, a disorderly transition to a low-
carbon economy could have a destabilising effect on the financial system (see Chapter 4).
All in all, financial stability risks will have to be monitored closely in view of the prevailing
economic environment and the unfolding consequences of the pandemic. An orderly and
gradual unwinding of structural and financial imbalances in the system over time will be
important. Early withdrawal of support when recovery is still too premature could have
immediate effects on financial stability due to adverse effects on macroeconomic conditions,
banks’ balance sheets and financing conditions 42. A too cautious approach in which support
39 Financial stability risks related to the housing market are high in Member States with particular vulnerabilities in terms of
household indebtedness and/or debt servicing costs, loan-to-value ratios and overvalued housing prices.
40 Some of the investment funds in the EU had to temporarily suspend redemptions at the height of the crisis. Ensuing central
bank interventions could lead to moral hazard issues in the future, to the extent that market participants do not fully
internalise their own liquidity risk. These funds might also be prone to difficulties in valuing their underlying assets, for
instance, due to progressive corporate downgrades or challenges related to the fair value determination of real estate assets
during the COVID-19 crisis.
41 Proposal for a Regulation of the European Parliament and of the Council on digital operational resilience for the financial
sector, COM/2020/595 final of 24 September 2020.
See also, https://ec.europa.eu/commission/presscorner/detail/en/IP_20_1684.
42 Effects include reduced growth, higher unemployment, increased non-performing loans, increased insolvencies, and
increased borrowing costs.
19You can also read