2020 State Water Plan: Water and Climate - ENVIRONMENTAL QUALIT Y BOARD - Environmental Quality Board
←
→
Page content transcription
If your browser does not render page correctly, please read the page content below
2020 State Water Plan Introduction

2020 State Water Plan: Water and Climate

                            E N V I R O N M E N TA L Q UA L I T Y B O A R D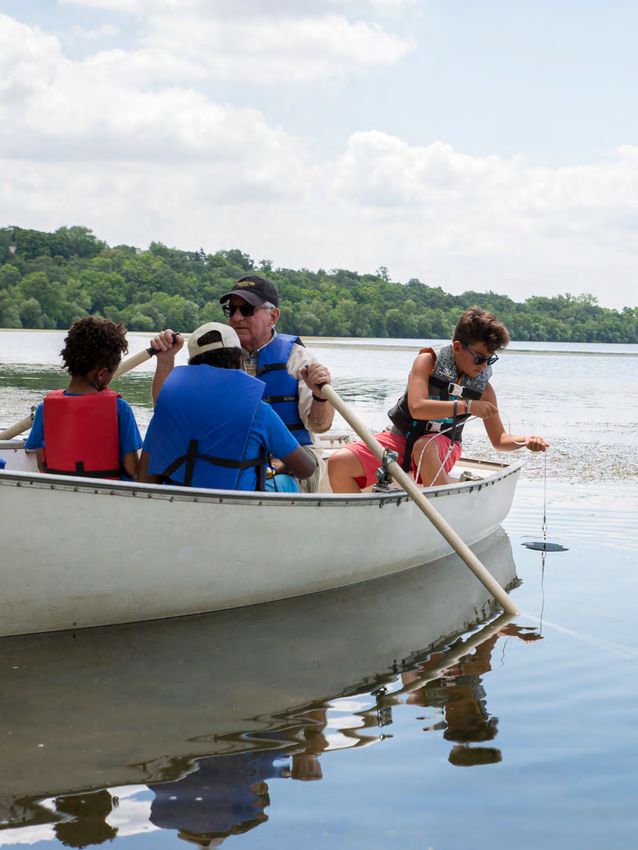
2020 State Water Plan Introduction

Table of Contents

          .                                                                                                                                                                                                                                                                    4

                                                                                                                                                                                                                                                                               19

                                                                                                                                      .  .  .  .  .  .  .  .  .  .  .  .  .  .  .  .  .  .  .  .  .  .  .  .  .  .  .  .  .  .  .  .  .  .  .  .  .  .  .  .  .  .  .  .  .  .  .  . 24

         Goal 2: Manage Landscapes to Protect and Improve Water Quality  .  .  .  .  .  .  .  .  .  .  .  .  .  .  .  .  .  .  .  .  .  .  .  .  .  .  .  .  .  .  .  .  .  .  .  .  .29

         Goal 3: Manage Built Environments and Infrastructure for Greater Resiliency .  .  .  .  .  .  .  .  .  .  .  .  .  .  .  .  .  .  .  .  .  .  .  .  .  .  . 36

         Goal 4: Manage Landscapes to Hold Water and Reduce Runoff .  .  .  .  .  .  .  .  .  .  .  .  .  .  .  .  .  .  .  .  .  .  .  .  .  .  .  .  .  .  .  .  .  .  .  .  .  .  .  . 46

         Goal 5: Promote Resiliency in Quality of Life .  .  .  .  .  .  .  .  .  .  .  .  .  .  .  .  .  .  .  .  .  .  .  .  .  .  .  .  .  .  .  .  .  .  .  .  .  .  .  .  .  .  .  .  .  .  .  .  .  .  .  .  .  .  . 54

         Spotlight on Lake Superior .  .  .  .  .  .  .  .  .  .  .  .  .  .  .  .  .  .  .  .  .  .  .  .  .  .  .  .  .  .  .  .  .  .  .  .  .  .  .  .  .  .  .  .  .  .  .  .  .  .  .  .  .  .  .  .  .  .  .  .  .  .  .  .  .  .  .  .  .  .  . 59

         Strategy Table .  .  .  .  .  .  .  .  .  .  .  .  .  .  .  .  .  .  .  .  .  .  .  .  .  .  .  .  .  .  .  .  .  .  .  .  .  .  .  .  .  .  .  .  .  .  .  .  .  .  .  .  .  .  .  .  .  .  .  .  .  .  .  .  .  .  .  .  .  .  .  .  .  .  .  .  .  .  .  .  .  . 62

         Governance Table .  .  .  .  .  .  .  .  .  .  .  .  .  .  .  .  .  .  .  .  .  .  .  .  .  .  .  .  .  .  .  .  .  .  .  .  .  .  .  .  .  .  .  .  .  .  .  .  .  .  .  .  .  .  .  .  .  .  .  .  .  .  .  .  .  .  .  .  .  .  .  .  .  .  .  .  .  .  . 68

         More Information .  .  .  .  .  .  .  .  .  .  .  .  .  .  .  .  .  .  .  .  .  .  .  .  .  .  .  .  .  .  .  .  .  .  .  .  .  .  .  .  .  .  .  .  .  .  .  .  .  .  .  .  .  .  .  .  .  .  .  .  .  .  .  .  .  .  .  .  .  .  .  .  .  .  .  .  .  .  . 72

         Appendix A: Five-year Assessment of Water Quality Trends and Prevention Efforts

         Appendix B: 2020 Groundwater Monitoring Status Report

         Appendix C: Water Availability Assessment Report

         Appendix D: Water Supply Planning in the Twin Cities Metropolitan Area (2005-2020)

The Environmental Quality Board is mandated to produce a 10-year state water plan pursuant to Minnesota Statutes, 103B.151, 103A.43,
103A.204.

This report was prepared by the Environmental Quality Board with the Board of Water and Soil Resources (BWSR), Department of Agriculture
(MDA), Department of Commerce, Department of Health (MDH), Department of Natural Resources (DNR), Department of Transportation
(MnDOT), Metropolitan Council, Pollution Control Agency (MPCA), University of Minnesota.

Edited by Mary Hoff
Designed by Amanda Scheid

Cover photo: Two generations of MPCA volunteers monitor water clarity in Lake Harriet, Minneapolis. Citizen volunteers
measure the clarity of lakes and streams, collecting valuable data the MPCA uses to make decisions on watershed protection
and restoration.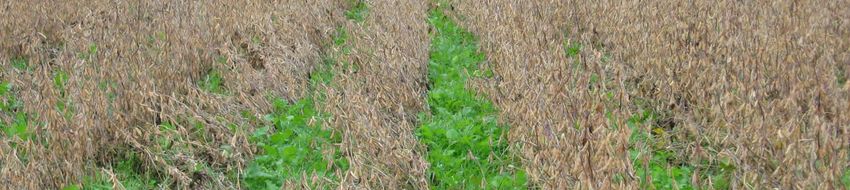
Letter From the Board
Minnesota’s way of life is intertwined with water. We depend on water for drinking, food production, healthy ecosystems
and emotional well-being. We swim, fish, play and celebrate in and around water. Climate change is already impacting our
more than 10,000 lakes, 100,000 miles of rivers and streams, abundant groundwater, and all of us. The effects of climate
change are expected to accelerate in the coming decades.

In 2008, Minnesotans showed that we value water with passage of the Clean Water, Land and Legacy Amendment,
creating a stable funding source for and a watershed-based approach to protection and restoration of our water
resources. Since then, increased investments in monitoring, evaluation, watershed planning and implementation of
projects have enabled us to do much more to protect, enhance, and restore water quality in lakes, rivers and streams and
to protect groundwater from degradation. However, many challenges remain. Climate change is one, and we are only just
beginning to understand how it is impacting Minnesota’s waters and the challenges it will pose for the future.

The goal of this report is to shine a spotlight on actions Minnesota can take to protect our waters from climate change.
In order to protect our waters, we must also take decisive action to reduce greenhouse gas emissions to curb the worst
effects of climate change. We are releasing this report at a time when Minnesota is reckoning with multiple stressors,
including a pandemic and the resulting economic fallout, and a legacy of economic and racial inequities. Black, Indigenous
and people of color are particularly vulnerable to threats at the intersection of water and climate change. This Board, and
the agencies responsible for implementing this plan, must increase our efforts to address these systemic inequities and
engage with these communities openly, respectfully and transparently.

Planning for the future of Minnesota’s water must include an honest appraisal of the effects our changing climate is
having on this vital resource and how these changes will impact Minnesotans, wildlife, habitat and landscapes across the
state. Fortunately, the actions we take to improve water quality and manage water quantity, from soil health to water
storage, can also reduce greenhouse gas emissions and help us adapt to a changing climate.

What we collectively aim for and accomplish over the next 10 years will have ripple effects over the next 100 years. As a
headwaters state, our actions will impact not only our neighboring states and provinces, but also the major water basins
downstream, from the Gulf of Mexico to the Great Lakes to Hudson Bay. Likewise, our partnerships with local, state,
regional and national governments and organizations both outside and inside our boundaries will be critical in realizing the
aspirations and goals of this plan.

Laura Bishop, EQB Chair                                Margaret Anderson Kelliher                     Kristen Eide-Tollefson
Commissioner, Minnesota Pollution Control Agency       Commissioner, Department of Transportatioin    Public Member, Congressional District 2

Alan Forsberg                                          Julie Goehring                                 Steve Grove
Public Member, Congressional District 1                Public Member, Congressional District 7        Commissioner, Department of Employment
                                                                                                      and Economic Development

Steve Kelley                                           Jan Malcolm                                    Bryan Murdock
Commissioner, Department of Commerce                   Commissioner, Department of Health             Public Member, Congressional District 8

Thom Petersen                                          Alice Roberts-Davis                            Sarah Strommen
Commissioner, Department of Agriculture                Commissioner, Department of Administration     Commissioner, Department of Natural Resources

                              Gerald Van Amburg                                    Sue Vento
                              Chair, Board of Water and Soil Resources             Council Member, Metropolitan Council
2020 State Water Plan Introduction                                            4

2020 Water Plan purpose

The Minnesota Legislature has directed the Environmental Quality Board (EQB) to coordinate comprehensive
long-range water resources planning and policy through a State Water Plan every 10 years (Minnesota Statues
103B.151, 103A.43, 103A.204). This plan fulfills the legislative mandate.

The purpose of the 2020 State Water Plan is to establish a framework for aligning state agencies, legislative
priorities, and local government policy, programs and actions for the coming decade. EQB developed this plan
to set an agenda for tackling the stubborn and complex water problems that climate change will intensify for
Minnesotans. In preparation for this report, EQB convened state agencies, met with over 250 people from
44 public and private organizations, and conducted two informal surveys to learn about concerns related to
water and climate and thoughts on what actions local and state government should take. The plan defines goals,
strategies and actions. It highlights key water issues related to climate, but it is not an exhaustive list of the
challenges we face or the solutions to implement. Ideas set forth in this plan can help establish priorities and
inform decision-making, and they underscore the need to take actions with multiple benefits across several goals
to move beyond our current trajectory.

Source: DNR
2020 State Water Plan Introduction                                          5

                            A Look Back: Water Policy and Planning Highlights
   1982:      Metropolitan Surface Water Management Act is enacted, requiring local governments in the 7-County metro
              region to form watershed management organizations to plan for surface water management across municipal
              boundaries.
   1987:      County Comprehensive Water Planning Program is established, funding county development of water
              management plans.
   1989:      The Groundwater Protection Act is enacted, creating new incentives and requirements for state and local
              groundwater management.
   1991:      EQB prepares first decennial Minnesota Water Plan: Directions for protecting and conserving Minnesota’s waters.
   2000: EQB completes Minnesota Watermarks: Gauging the flow of progress, 2000–2010.
   2008: Minnesota voters demonstrate their commitment to working together on water issues by passing the Clean
         Water, Land and Legacy Amendment.
   2010:      EQB completes Minnesota Water Plan: Working together to ensure clean water and healthy ecosystems for
              future generations.
   2011:      The University of Minnesota releases Minnesota Water Sustainability Framework, a comprehensive report
              designed to protect and preserve Minnesota’s lakes, rivers and groundwater for the 21st century and beyond.
   2014:      Minnesota Nutrient Reduction Strategy outlines how Minnesota will reduce nutrient pollution in its lakes
              and streams and reduce the impact downstream. The strategy specifies goals and provides a framework for
              reducing phosphorus and nitrogen by an interim target date of 2025 and final date of 2040.
   2014:      Minnesota’s Clean Water Roadmap sets long-range goals for Minnesota’s water resources over the 25-year life
              of the Clean Water, Land and Legacy Amendment (through 2034).
   2015:      The Minnesota Legislature passes a law to protect water quality by requiring buffers on more than 100,000
              acres of land adjacent to public waters and public drainage systems. EQB prepares Beyond the Status Quo
              Water Policy Report. Legislation directs state and local governments to accomplish a ten-year transition to use
              a Comprehensive Watershed Approach to achieve accelerated and coordinated water management (aka One
              Watershed, One Plan).
   2017:      Governor Mark Dayton asks Minnesotans for their input on how to increase the pace of progress toward clean
              water, setting a goal of 25% improvement by 2025.
   2019:      Governor Walz signs EO 19-37 establishing the Climate Change Subcabinet and the Governor’s Advisory
              Council on Climate Change to promote coordinated climate change mitigation and resilience strategies.

How to use the plan
This plan is organized in three sections. The first two provide background information on water and climate connections,
the importance of engaging Minnesotans to develop equitable solutions to our water challenges, and collaboration between
the state and Tribal Nations in water efforts. The third section contains five goals. These goals represent focus areas for
Minnesotans to become more resilient to climate change and prepare for its impacts on water in the coming decade. Each
goal contains recommended strategies and actions to achieve it. The goals overlap and interrelate, so many of the strategies
apply to multiple goals.
           Goal 1: Ensure drinking water is safe and sufficient
           Goal 2: Manage landscapes to protect and improve water quality
           Goal 3: Manage built environment and infrastructure for greater resiliency
           Goal 4: Manage landscapes to hold water and reduce runoff
           Goal 5: Promote resiliency in quality of life

Additional resources related to the plan are available on the EQB website (eqb.state.mn.us).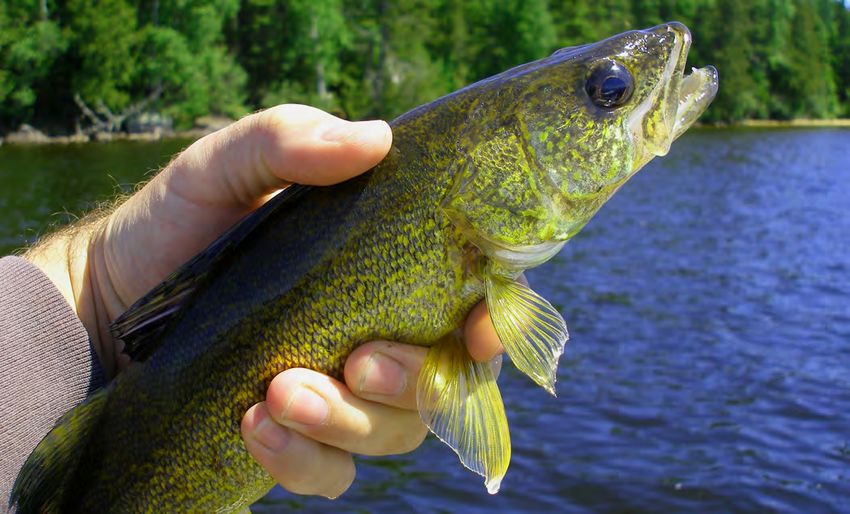
2020 State Water Plan Introduction 6
Principles Underlying This Plan
Several principles and assumptions shape this plan. Some of these have shaped water policy in Minnesota for
decades, while others are new, based on increasing awareness of the threats climate change poses.
• We have a responsibility to consider the needs of all natural systems, including wildlife and plants.
Human impacts to water threaten many species and habitats in Minnesota. Healthy lakes, rivers, streams,
wetlands, springs and aquifers are all essential for thriving ecosystems.
• We recognize the value of nature-based solutions. Promoting biodiversity and investing in the health of
ecosystems is critical for our resilience to climate change. We need to protect water in areas with high
biodiversity and increase biodiversity where it is lacking. As we select and implement solutions to water
issues, we can choose to mimic natural systems wherever possible.
• We recognize the interconnection between land use and water quality and quantity, as well as connections
between air and water. How we use and manage land affects water quality and quantity and can result in
real costs, from increased drinking water treatment to repair or replacement of roads and bridges.
• We recognize that surface water and groundwater, while frequently discussed separately in this report,
are interconnected and interdependent.
• We have a responsibility to consider the needs of downstream users. Minnesota sends water to three of
North America’s major drainage basins: the Mississippi River, the Great Lakes and the Red River of the North.
• We acknowledge that our water resources, while abundant, are not evenly distributed or unlimited and
that demands on those resources are likely to increase.
• We have a responsibility to address water injustices. We recognize that the impacts of climate change
on water resources will be experienced differently in different regions of the state and by different
populations, and we seek equitable solutions. Existing inequities in Minnesota limit the ability of some
populations to confront the impacts described throughout this report on infrastructure, water quality,
recreation and more. These vulnerable populations include but are not limited to:
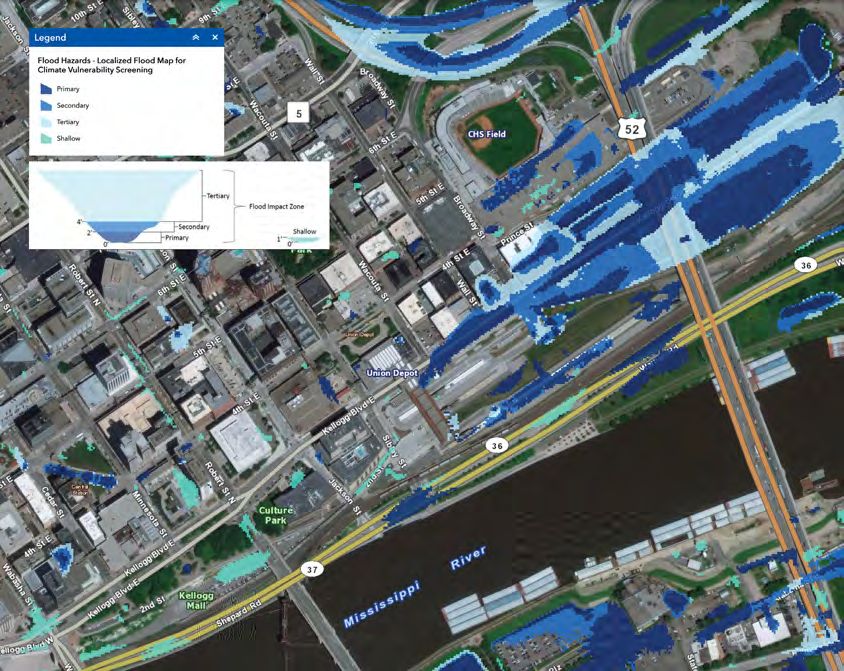
o people in floodplains or at risk from localized
flooding
o residents with private wells vulnerable to
contamination, with infants, children and the
elderly facing the greatest risks
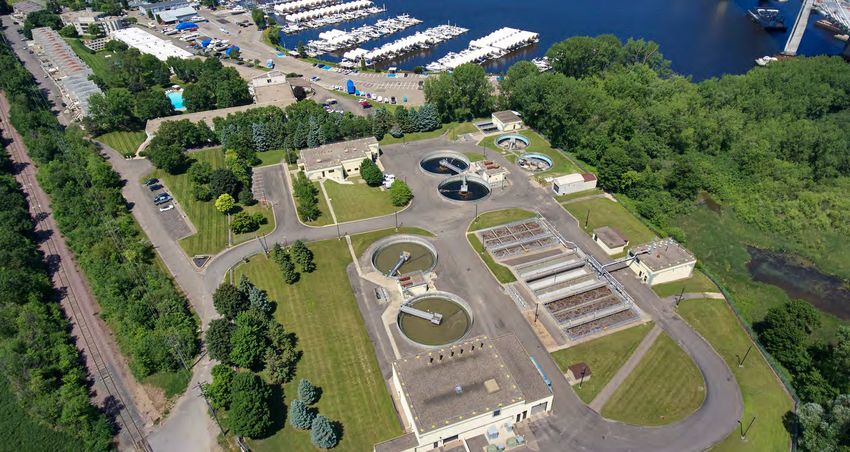
o people in communities facing high water
treatment costs or inadequate drinking or
wastewater treatment infrastructure
o Black, Indigenous and people of color, who
already face multiple stresses that can affect
resilience, from housing costs to educational
inequities
o people in poverty and those facing financial,
language or educational barriers, limiting their
ability to recognize and respond to threats
o people in urban areas who lack adequate or safe
access to water-based recreation.
• We have a responsibility to welcome and support
culturally diverse voices and different ways of
knowing and relating to water in inclusive community
engagement, science, management, planning and policy.
Source: Charles Robinson
2020 State Water Plan Introduction                                              7

Water and climate change
                                                                            What’s the difference between
Climate and water shape our lives
Minnesota is almost as famous for its climate, which swings                    climate and weather?
from hot, humid summers to frigid, snowy winters, as it
is for its abundant waters. Just as we cannot imagine our            Somebody has probably said to you, “If you don’t like
state without lakes and rivers, we also would not recognize          the weather, wait five minutes,” but you cannot say the
a year without cold winter nights, heavy snow, summertime            same for climate. Weather and climate both describe
thunderstorms, or numerous warm and sunny days.                      the condition of the atmosphere in a location, but
Minnesotans depend on both climate and water for our way             weather is short term, whereas climate refers to the
of life, from recreation like hunting, fishing and paddling, to      effect of weather patterns averaged over seasons,
our agricultural, tourism and industrial economies.                  years and decades. Climate shapes our expectation
                                                                     that it will be cold in Minnesota in the winter; weather
Minnesota’s climate and water are closely connected in               determines what we experience on a given day.
many ways:
•    The amount and timing of precipitation influences how
     much water soaks into the ground or runs off into lakes,
     rivers and wetlands.
•    Precipitation patterns also determine the availability and
     demand for water.
•    Temperature patterns control the timing of snowmelt,
     the duration of ice cover on lakes and streams, and the
     beginning and end of Minnesota’s growing season.
•    Climate influences water temperatures, along with many
     of the chemical, physical and biological processes that
     shape aquatic resources.
                                                                  Source: MnDOT

Source: MPCA

                                                                  How our climate is changing
                                                                  We know that some seasons can be far warmer, colder,
                                                                  wetter or drier than normal. The high variability we
                                                                  expect from Minnesota’s climate can make it difficult to
                                                                  notice where, when and how climate has changed in our
                                                                  state. However, rapid, widespread changes are already
                                                                  underway, and more changes are coming. In the past several
                                                                  decades, our state has seen substantial warming that is
                                                                  most pronounced during winter and at night, increased
                                                                  precipitation and heavier downpours.

                                                                  An overwhelming base of scientific evidence projects that
                                                                  Minnesota’s climate will see additional, significant changes
                                                                  through the end of this century, with even warmer winters
                                                                  and nights and even larger rainfalls—along with the likelihood
                                                                  of increased summer heat and the potential for longer dry
                                                                  spells. Although we will experience occasional cool or dry
                                                                  years, climate scientists expect these increases to continue
                                                                  through the 21st century.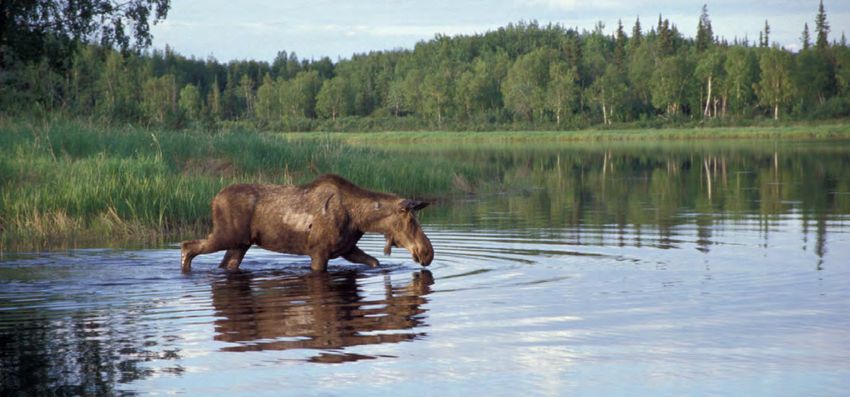
2020 State Water Plan Introduction                                                      8

                                                                                                                                          Source: DNR State Climatology Office & University of Minnesota
    All but two years since 1970 have been wetter and/or warmer than 20th century averages, and the 10 combined wettest and warmest
    years (red dots) on record all occurred from 1998 onward. Each blue and red dot represents a given year’s statewide temperature and
    precipitation departure from 20th century averages, 1895–2019. Yellow dots represent projections for the middle and end of the 21st
    century with moderate and high greenhouse gas emissions, based on 20-year averages; therefore, some individual years are warmer and
    wetter than the values shown.

                                                                        Source: MPCA
Unprecedented wetness
Minnesota’s climate swings naturally from relatively dry to
relatively wet periods, but wet conditions have dominated
recent decades. Years with precipitation above historical
averages have become increasingly frequent, and depar-
tures from those averages have grown as well, leading to
sustained record-breaking precipitation surpluses. June
2014 was Minnesota’s wettest month on record, with severe
flooding in many areas. During 2019, more precipitation fell
across the state than any other year on record back to 1895.
The precipitation increases have been most pronounced in
southern Minnesota. In 2016, Waseca broke Minnesota’s
annual precipitation record, only for Harmony and Caledonia
to surpass it in 2018. Snowfall has been increasing too, with
several stations setting seasonal snowfall records during the
2010s, and dozens of monthly records falling as well.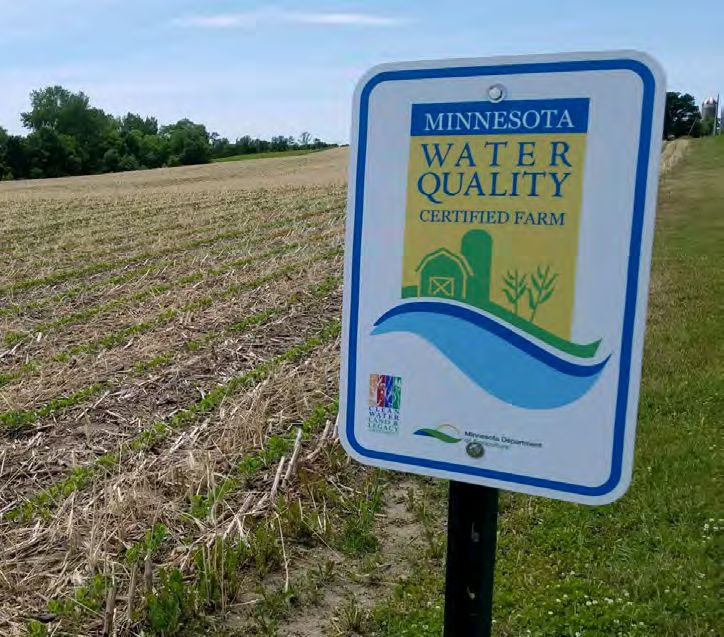
2020 State Water Plan Introduction 9
“Mega-rains”
“Mega-rains” are events in which six inches of rain covers more than 1000 square miles and the core of the event
tops eight inches. Minnesota has experienced 11 mega-rains in the 20 years since 2000 (including one in July
2020), versus six in the 27 years from 1973 through 1999.
Precipitation Change in Minnesota Over Past 100+ Years
Source: DNR State Climatology Office
05
05
15
45
95
85
65
95
35
55
25
75
15
20
20
18
19
19
19
19
19
19
19
19
19
19
Largest Daily Reainfall Amount (inches)
32
3.2
Annual Precipitation (inches)
30
3.0
28 2.8
26 2.6
2.4
24
2.2
22
2.0
20 1.8
18 1.6
s
s
s
s
s
00
s
s
s
s
s
s
s
s
00
40
90
80
60
90
90
30
50
20
70
10
20
18
19
19
19
19
19
19
19
19
19
19
19
Annual Precipitation Largest Daily Rainfall (averaged over all long-term stations)
This chart shows changes in Minnesota’s annual precipitation, averaged by decade, along with the average value
of the largest daily rainfall of the year from Minnesota’s 39 long-term weather stations. The 2010s finished as
Minnesota’s wettest decade on record on.
Source: DNR State Climatology Office
Count of Extreme Precipitation Events by Decade
Minnesota Long-term Stations
32
28
24
Number of Events
20
16 10-yr events
100-yr events
12
8
4
0
1920s 1930s 1940s 1950s 1960s 1970s 1980s 1990s 2000s 2010s
Minnesota’s long-term climate stations recorded more 10-year and 100-year rainfall events during the
2010s than in any other decade.
2020 State Water Plan Introduction                                                            10

More damaging rains and heavy snowfalls
Minnesota now sees more extreme precipitation than at                                          Warmer, but not yet hotter
any other time on record. Minnesota’s long-term climate                                        Minnesota has warmed considerably, but mostly during
stations recorded more “10-year” daily rainfall events—those                                   nights and winter. Annual temperatures have climbed 2.9 °F
exceeding 3.5 inches in the northwest and 4.5 inches in the                                    since 1895, but winter low temperatures have increased by
southeast—during the 2010s than in any other decade. The                                       6.1 °F, with only modest increases or even slight decreases
annual heaviest daily rainfall total anywhere in the state now                                 in summer high temperatures. Winter cold extremes have
averages about 20% higher than it did historically. In August                                  become less frequent and less severe across the state, but
2007, a catastrophic rainfall in southeastern Minnesota                                        we have observed no change in the frequency or severity of
produced a 24-hour total of 15.10 inches in the town of                                        heat extremes. Over 85% of Minnesota’s warming occurred
Hokah, breaking the statewide daily rainfall record by nearly                                  since 1970, indicating that the state is currently facing rapid
40%. Heavy snowfall has increased during this period as well,                                  climatic changes.
with many stations setting all-time 24-hour records during
the 2010s, and the decade setting high marks across the
state for the frequency of 4-inch snowfalls.

           Daily precipitation increases
           At climate stations with over 100 years of observation, daily precipitation totals of 1, 2 and 3 inches have
           increased by an average of 21%, 31% and 62%, respectively.

                                                  Total temperature change, 1895–2019

         +3.4 °F     + 3.4° F
                                                                       +7.1 °F      + 7.1° F
                                                                                                                                   +1.1 °F     + 1.1° F

                                                                                                                                                            Source: DNR State Climatology Office
         +2.9 °F
          + 2.9° F                                                    +5.9 °F
                                                                         + 5.9° F                                                 +0.6 °F
                                                                                                                                    + 0.6° F

         +1.8 °F
               + 1.8° F
                                                                      +4.8 °F + 4.8° F
                                                                                                                                  -0.9 °F- 0.9° F

     Annual Average                                                    Winter Lows                                              Summer Highs
                                Since 1895, winter lows in northern Minnesota have increased 40% faster than in southern Minnesota.

           “[Someone once asked], ‘You’ve lived here your whole life, when is the skiing
           reliable?’ and I said ‘Oh, by Thanksgiving, no question.’ … And now, I mean,
           Thanksgiving we’re still paddling.”
           					–North Shore interviewee
2020 State Water Plan Introduction 11
Minnesota’s future climates
Located in the middle of a continent, halfway between the Climate model projections made specifically for Minnesota
equator and the North Pole, Minnesota is highly sensitive generally suggest we will see more precipitation by the end
to large-scale climatic changes, and since 1970 has warmed of this century, with continued increases in heavy rainfall and
40% faster than the global average. With continued global longer intervening dry spells. The projections favor wetter
temperature increases expected, virtually all climate model spring months, followed by drier late-summer conditions.
scenarios at a wide variety of scales project that Minnesota Under a high greenhouse gas emissions scenario, the wettest
will get much warmer in the decades ahead, including during day in a typical year at the end of this century is projected to
the summer, with increased heat extremes by the middle of be 20% wetter than during the 1990s. Individual years may
this century, if not sooner. have even larger increases in extreme precipitation. Even as
the amount of precipitation increases, we expect the longest
Precipitation is slightly more complicated because the extra time between precipitation events to increase, indicating
moisture resulting from rising temperatures is distributed more precipitation is coming in fewer events.
unevenly by global wind and weather patterns, leading to a
range of slightly dry to very wet projections. With aggressive reductions in greenhouse gas emissions, we
can avoid the more drastic climate changes represented by
the high emissions projections in the following maps.
Modeling Minnesota’s Future Climate:
Annual Precipitation
Mid-century (2040–2059) End century (2080–2099) End century (2080–2099)
Moderate emissions High emissions
% change in annual
average precipitation
compared with 1980–1999
-6% – 5%
5% – 15%
15% – 25%
25% – 35%
35% – 45%
45% – 66%
Source: University of Minnesota2020 State Water Plan Introduction 12
Background on Modeling: Looking at Minnesota in the Future
Climate scientists have produced numerous global and national climate model data sets, but until recently,
none had been specific to Minnesota. University of Minnesota scientists, however, have used supercomputers
and physical equations to “downscale.” The modelers used the average of seven global models to produce
localized climate projections for the state. This report uses the averages of those models to represent future
climate scenarios in Minnesota.
The models cover changes relative to baseline climate data for 1980–1999 for two future periods—“mid-
century” (2040–2059) and “end century” (2080–2099).
The mid-century model shows a single scenario. Two end-of-century projections represent moderate and
high greenhouse gas emission scenarios. It is clear from these two that society can still avoid more drastic
long-term changes in climate by reducing emissions in the near term.
Modeling Minnesota’s Future Climate:
Wettest Day Rainfall
Source: University of Minnesota
Data were produced by the University of Minnesota under the direction of Tracy Twine, Department of Soil, Water,
and Climate, with analysis support from Ryan Noe, Humphrey School of Public Affairs. Funding was provided by the
Environment and Natural Resources Trust Fund and Minnesota Invasive Terrestrial Plants and Pests Center.
“I’ve been living here 25 years, and I do feel like the climate has changed
since I’ve been here. … [T]he moisture patterns, the way we get snow, the
way it comes our way, the temperatures—I feel like that’s a very natural
assumption to make.”
–Duluth area interviewee2020 State Water Plan Introduction 13
Don’t count drought out
Minnesota has not seen increased drought severity, duration or geographic coverage over the past few decades. Although not
equivalent to drought, climate projections suggest that the length of the longest dry spell in the growing season may increase.
Minnesota should expect at least occasional episodes of severe drought, even with a wetter climate.
Modeling Minnesota’s Future Climate:
Growing Season Dry Spell
Source: University of Minnesota
Protecting water together Source: DNR
Protecting and improving water quality in Minnesota in
the face of climate change will yield important rewards:
clean drinking water, resilient landscapes, fishable and
swimmable surface waters, and more. However, it will be a
complex, challenging, and long-term process that requires
“all hands on deck,” with EQB agencies, Tribal Nations, local
governments, businesses, communities, NGOs/nonprofits
and individuals working together.
Fortunately, Minnesotans care deeply about water and
are concerned about the impacts of climate change. To
successfully collaborate and produce equitable results,
decision makers must engage a diversity of voices that
reflect the priorities and values of communities across
Minnesota. Investment in environmental literacy is essential
to develop the understanding, skills and motivation to enact
informed strategies for managing water and climate.2020 State Water Plan Introduction 14
What water values are most important to Minnesotans?
Clean and safe drinking water 94% 6%
Water for future generations 80% 18%
Fish and wildlife habitat 72% 25%
Safe beaches and lakes 67% 29%
Not sending pollution downstream
to other states/nations 67% 25%
Extremely important Moderately important
Source: Davenport et. al. 2019, University of Minnesota
Minnesotans value water More than 75% of Minnesotans surveyed believe water
Understanding shared and diverse values can help decision resources in the state need better protection. Minnesotans
makers align policies, practices and programs with the are worried about impacts of degraded or depleted water
interests and values of area residents. resources on human health, future generations and aquatic life.
A 2018 University of Minnesota statewide survey of more
than 1,400 residents affirmed that Minnesotans value clean
water. Respondents most valued:
Source: DNR
1. clean and safe drinking water
2. water for future generations
3. fish and wildlife habitat
4. safe swimming beaches and lakes
5. not sending pollution downstream to other states or
nations.
More than 90% of Minnesotans surveyed believe drinking
water is extremely important, with women tending to rate
many values more highly than men. A smaller Twin Cities
metro area study found that Black, Indigenous and people
of color value equitable access to water and using water for
gardening and cultural or religious practices in addition to
drinking water.2020 State Water Plan Introduction 15
More than 80% of respondents support multiple actions to Minnesotans believe the climate is changing
protect and restore water, including: Minnesotans are concerned about climate change.
• conserving household water According to a 2019 Yale University nationwide telephone
poll, 66% of Minnesota residents believe the climate is
• monitoring the health of Minnesota waters changing. This is slightly lower than the national average of
• increasing water education and outreach 70%. University of Minnesota survey research documented
higher proportions of Minnesotans who believe climate
• enforcing existing land use laws and regulations.
change is occurring.
• More than 80% of residents on the North Shore of Lake
Superior in Cook and Lake counties believed climate
Source: MPCA change is happening.
• When asked what concerns them most about climate-
related impacts to the North Shore, effects on
fish, wildlife and forest health were among the top
concerns. Only 13% of North Shore residents said their
communities are prepared for climate change.
“I am concerned. For instance, if
we keep having years with these
bad windstorms, or droughts,
or floods, the more damage
that’s happening to our natural
environment here, the more
impact it’s going to have on our
tourism.”
–North Shore interviewee
Source: USFWS2020 State Water Plan Introduction 16
• Of Central Minnesota farmers surveyed in a 2019 Three statewide surveys of local government staff
University of Minnesota study, 73% believe the climate is conducted by the University of Minnesota identified
changing, and 42% believe their farm operations will be capacity-building needs for two climate-related challenges:
harmed by climate-related impacts in the future. These managing stormwater and protecting groundwater. While
farmers’ biggest concerns for the next 10 years are: 93% of survey respondents reported beliefs that climate
o decreased groundwater access change is occurring, only 15% believed their communities
are prepared to address climate change impacts. In
o more frequent dry periods and droughts addition, 78% of staff viewed an increase in the frequency
o increased heat stress on crops. and intensity of storm events as a significant challenge.
This group also identified flooding, aging or insufficient
• A survey of people in the Twin Cities metropolitan area
stormwater infrastructure, and road salting or deicing
found that more than 90% believe that the climate
practices as significant problems. While the staff surveyed
is changing. The vast majority (89%) are at least
felt prepared to develop long-term plans to address water
moderately concerned about climate change impacts,
issues from a technical and educational perspective, they
including:
felt least effective at regulating existing land uses and
o drinking water contamination restoring hydrology for stormwater management. These
o degradation of lake and stream water quality communities need resources and assistance to move forward
with resilience planning, including increased capacity for
o unequal access to public waters. community member engagement.
Building local capacity
Local governments will play a key role in building resilient Engagement, equity and education
communities. In 2020, EQB conducted an informal survey
of local government staff and other water professionals The goals and strategies that appear in this report can all be
to gauge their capacity, concern and readiness. Most strengthened by increasing the level of public engagement
respondents (83%) are moderately or extremely concerned and education and keeping equity top of mind.
about the effects of climate change on water issues in
the communities they serve. However, fewer than half of Source: USFWS
respondents report that their organization has water plans or
planning efforts underway that specifically address climate
change.
Source: MPCA2020 State Water Plan Introduction 17
Minnesota’s existing targets for watershed restoration and
CASE STUDY: We Are Water Minnesota protection require significant resources and strong strategies
to achieve. Investments like the Legacy Amendment and the
Clean Water Fund it established have allowed us to create a
strong base of knowledge about water quality in Minnesota.
We Are Water MN is a traveling exhibit and
Yet progress to restore and protect our water is slow and
community engagement initiative that explores the
difficult because of complex challenges and uncertainties
science, history, story, culture and relationships
due to climate change, development and other factors.
of water in Minnesota. It’s a successful and proven
model for building strong local and statewide
One of the biggest challenges is the social dimension.
networks to promote positive social norms and
Sustainable water management must go beyond a purely
enable the development of a communitywide vision
technical approach and consider human beliefs and
for water stewardship.
behaviors, including social norms, emotional connections to
people and places, and beliefs about one’s ability to make
The 2018–2019 cohort, which included eight host
change. Engagement can help ensure that:
sites, achieved the following:
• a diversity of perspectives informs all policies, programs
• Over 34,000 people attended the exhibit,
and processes
including 1,500 school children. A large
percentage of 457 attendees surveyed spoke • solutions are co-created with the public and aligned to
to the value of the exhibit: local values and needs.
o 51% identified that they learned
Public engagement is key to protecting and improving
something new from the exhibit
Minnesota’s water resources. Currently, local water plans
o 54% expressed they felt a greater tend to focus on conservation rather than outreach and
responsibility to water resources as a engagement, despite significant social barriers to success.
result of visiting the exhibit In addition, staff capacity, funding and lack of expertise limit
o 48% felt motivated to take personal the ability of local government staff to include outreach and
action regarding the personal use of engagement in efforts to protect water.
water.
Water professionals need to build capacity for engagement,
• Communities gathered together. Over 9,000
outreach and education in agencies, local governments,
individuals attended 28 community events.
universities and other organizations. They also need to
These events strengthen informal social bonds,
provide locally relevant and community-driven education
facilitated knowledge exchange and provided a
and outreach to elected officials to build support and buy-in
shared sense of community and responsibility.
for plans.
• There were 240 partnerships across eight sites
to plan and promote the exhibit. We know
these networks are new and different than
before the project—30% were described as new
relationships and nearly 40% were described as
relationships with an organization or community
not normally represented in the host site’s work.
We Are Water MN is supported by a unique
collaboration among the Minnesota Humanities
Center, MPCA, the Minnesota Historical Society,
MDA, MDH and DNR.
Source: MPCA2020 State Water Plan Introduction 18
Minnesota’s water protection planning and programs must Working with people is key to solving water challenges.
include multiple ways of knowing water and represent It includes not only understanding environmental issues
a broad range of experiences. Experiences with water and natural systems, but also developing skills to address
differ across race, gender, ethnicity, place of origin, environmental problems as well as active participation in
socioeconomic status, religion, profession and hobbies. civic life for the benefit of the environment and others.
State agencies and others working on water quality goals
will be most successful when people of many different We develop our relationship with water through home and
backgrounds see themselves in the work and actively family life, school, and a variety of lifelong opportunities.
participate in planning. Minnesotans need regular access to information,
conversations, experiences and skill-building to support this
growth. Expanding opportunities to learn about water is
important in achieving the level of participation needed to
address the challenges we face.
“I think women of color and people
of color in natural environments Education can include:
are a lot less rare than people think. • experiential learning opportunities in nature
Representation is definitely a huge • building relationships that increase resiliency and shared
understanding
part of the problem of whiteness in
• boosting a sense of efficacy and mental health through
the outdoors. And, you know, it’s self- volunteer opportunities
perpetuating; people don’t see folks • encouraging participation in creating goals, policies and
that look like them represented and plans.
they don’t think that the outdoors is
a place for them. So that’s a big part
of the reason that I’ve been motivated
to continue working in the outdoors
and doing this work that I do, because
as a marketer I can help shape that
narrative and that representation—or
lack thereof, rather.”
— Alora Jones
We Are Water MN program, 2018
Source: DNR
Potential Pathways in Education
The Minnesota GreenStep Schools pilot program supports K–12
climate and water education. Free and voluntary, the program
offers a beginner-friendly framework building on the successful
model of Minnesota GreenStep Cities and the nationally recognized
Green Ribbon Schools program. Minnesota GreenStep Schools
connects public and private experts with schools and districts
to share best practices for reducing environmental impacts and
costs, improving health and well-being of students and staff, and
providing effective environmental and sustainability education.
www.mngreenstepschools.orgTribal Nations, Water and Climate Change
Tribal Nations depend on clean water for healthy
communities, economic security and cultural survival. Water
is central to Ojibwe and Dakota cultures and has been since
long before the state was established.
Climate change threatens the waters and ecosystems tribes
depend on. Species with aquatic habitats such as wild rice,
black ash and walleye are important for health, sustainability
and cultural well-being. These species are also highly
sensitive to climate change. Tribes are actively studying the
challenges climate change brings to the lands and waters
of Minnesota. Learning from tribes and collaborating on
solutions is essential for protecting Minnesota’s waters from
climate change. Source: Tina Shaw/USFWS
Tribes in Minnesota
Minnesota Indian Tribal Land Minnesota is home to 12 federally recognized Tribal Nations:
• seven Anishinaabe (Chippewa, Ojibwe) reservations
• four Dakota (Sioux) communities
• the Minnesota Chippewa Tribe, composed of the Bois
Forte, Fond du Lac, Grand Portage, Leech Lake, Mille
Lacs and White Earth reservations.
Each is a separate sovereign nation with its own government
and is distinct from all other federally recognized tribes.
Reservations and communities are segments of land that
were retained or reserved by American Indian tribes after
ceding large portions of their original homelands to the
United States through treaty agreements. Boundaries of
these lands have changed over time and across the United
States, with some still under dispute today.
While treaties with the United States set aside reservations as
tribes’ permanent homes, in Minnesota, the Ojibwe reserved
the right to hunt, fish and harvest natural resources from
ceded lands and waters. The ability to exercise those treaty
rights depends on clean water and healthy ecosystems.
Treaty rights, environmental health and tribal culture are
all interconnected. Tribal members remain connected to
ancestral generations through subsistence living, maintaining
Anishinaabe Reservations cultural practices, and exercising treaty rights to hunt, fish
and harvest natural resources. Tribal Nations manage lands,
Dakota Communities resources and economies; protect people; and build a more
secure future for generations to come.1
Treaty-Ceded Territories
Source: MnDOT 1
Portions of text courtesy of Fond du Lac Resource Management DivisionTribal Nations, Water and Climate Change 20
Water: More than a resource
A 2016 report on climate change developed through a
collaboration among the Bois Forte, Fond du Lac and Grand
Portage Bands and the 1854 Treaty Authority opens:
To the Ojibwe, natural resources are cultural resources.
There is no separation between how the bands manage and
interact with a resource and how their culture endures:
one is dependent on the other. Climate change, however,
is threatening the very viability of many natural resources
important to the Ojibwe.2
The fundamental relationship between ecosystems and
cultural survival is central to how Minnesota tribes approach
science and management of water resources. Why Treaties
Matter3 points out that for Ojibwe and Dakota people,
environmental values center on an ethic of responsibility,
rights and relationships. They view themselves as participants
in the natural world, continually in relationship with
everything that surrounds them. The natural world has
intrinsic rights that humans have responsibility to uphold.
Beings in the natural world are connected to humans
through familial relations. Ojibwe language reflects this:
nibi, the word for water, means life-giving force. This
worldview contrasts with economic and political systems
that value private property and often view land and water as
commodities to buy, sell and use.
Disproportionate impacts
Impacts to water from climate change will disproportionately
affect Minnesota tribes. Increased risk of flooding and
extreme weather could place additional burdens on
reservations already struggling with infrastructure challenges.
For subsistence and cultural survival, tribes also depend on
native species with aquatic habitats that are vulnerable to the Aquatic habitat species that tribes depend on for subsistence
effects of rising temperatures and increased precipitation. and cultural survival are also at risk from climate change,
Loss of these species could harm health and well-being. which disproportionately impacts tribal health and well-
being. As the 1854 Treaty Authority points out in its climate
The Prairie Island Indian Community is an example of a Tribal change vulnerability and adaptation plan,4 the boundaries
Nation that is vulnerable to increased precipitation from of reservations, communities and ceded territories are
climate change. The community is located on the shores of geographically defined. Tribes cannot follow shifts in natural
the Mississippi and Vermillion Rivers between Hastings and resources that may come with climate change, and might lose
Red Wing. The tribe has long dealt with flooding that causes access to culturally, economically and nutritionally important
everything from washed out roads to evacuations, and it has species. Many health issues American Indians face today can
invested in flood mitigation infrastructure. Climate change be traced to historic displacement from traditional foods and
could make flooding more frequent and severe, putting healthy cultural practices. Climate change could cause yet
additional strain on community resources. more displacement from these foods and practices.
2
Stults, M., Petersen, S., Bell, J., Baule, W., Nasser, E., Gibbons, E., & Fougerat., M. (2016). Climate Change Vulnerability Assessment and Adaptation Plan
1854 Ceded Territory Including the Bois Forte, Fond du Lac, and Grand Portage Reservations. 146.
3
Why Treaties Matter. http://treatiesmatter.org/exhibit/ accessed July 15, 2020.
4
Stults, M., Petersen, S., Bell, J., Baule, W., Nasser, E., Gibbons, E., & Fougerat., M. (2016). Climate Change Vulnerability Assessment and Adaptation Plan
1854 Ceded Territory Including the Bois Forte, Fond du Lac, and Grand Portage Reservations.Tribal Nations, Water and Climate Change 21
WILD RICE
Wild rice (manoomin-Ojibwe, psiŋ-Dakota) has been
central to the lives and identity of Dakota and Ojibwe
for centuries. Today, it is used in religious practices
and ceremonies, and hand harvesting is an important
ritual that builds community and helps tribes remain
culturally resilient. Wild rice is also critical for the health
and subsistence of tribes. Harvesting and consuming
wild rice promotes health and enhances tribal food
sovereignty.5
Minnesota has the largest concentration of wild rice
remaining in the United States. Still, wild rice occupies
only a fraction of its historic range. Dakota and Ojibwe
people are actively working to restore and preserve
this resource on tribal waters and in ceded territories.
Meanwhile, wild rice faces multiple threats, including
altered hydrology, water quality issues and invasive
species. Climate change is making these threats worse.
Impacts to wild rice could bring cascading effects
because rice wetlands provide habitat and food for
waterfowl, fish and other wildlife.
Source: MPCA
Food sovereignty
Food sovereignty is the right of peoples to healthy and culturally appropriate food produced through
ecologically sound and sustainable methods, and their right to define their own food and agriculture systems.
– Declaration of Nyéléni, the first global forum on food sovereignty, Mali, 2007
Source: Eli Sagor
BLACK ASH
Black ash (baapaagimaak) is a tree that thrives in
swamps, floodplains, ravines and small, poorly drained
areas with high water tables. For the Ojibwe, black ash is
important for crafting traditional baskets and snowshoes.
Increasing temperatures and disruptions to hydrology
are altering the ecological conditions that black ash
depends on to survive. In addition, emerald ash borer
(EAB), an invasive insect, threatens black ash. Climate
change is impairing efforts to slow EAB’s spread.
Minnesota has 1 million acres of black ash–dominated
forests, and EAB threatens all of them. Black ash trees
act like water pumps—without them, water accumulates
on the land. Losing black ash means overlapping impacts
to tribal culture, wetland ecosystems and water storage
on the land.
5
Minnesota Tribal Wild Rice Task Force. (2018) 2018 Tribal Wild Rice Task Force Report.
Fond du Lac Band of Lake Superior Chippewa. (2018). Expanding the Narrative of Tribal Health: The Effects of Wild Rice Water Quality Rule Changes on
Tribal Health. Health Impact Assessment.Tribal Nations, Water and Climate Change 22
WALLEYE
Walleye (ogaa), native to most of Minnesota, is an temperature increases will likely create competition from
important source of food for American Indians. Fishing warmer water fish species in southern and shallow lakes
for walleye is also an important cultural activity. Climate and reduce populations of prey species such as cisco. Later
change, management practices and invasive species freeze-ups and ice-out dates on lakes could also affect
have contributed to recent population declines in the walleye spawning. The complex interactions among these
Mille Lacs Lake area, part of the 1837 ceded territory. factors make it difficult to assess the vulnerability of walleye
to climate change.
Warming water temperatures have led to an expansion
of walleye habitat in Lake Superior. However,
Source: Joe Ferguson
Mercury and climate change
Mercury can accumulate in fish to levels toxic to the fish snow. Bacteria transform some into methylmercury, a
and to those who eat them. Fish provide an important substance that can accumulate in animals.
food source for Minnesota tribes and other subsistence Despite a decline in mercury emissions over the
anglers, but many fish species have consumption past three decades, average mercury levels in
advisories due to contamination from mercury. Mercury northern pike and walleye have increased. Scientists
is a neurotoxin to humans and can cause a range of believe this is because there are existing stores of
health effects. mercury in water bodies, and increasing temperature
and precipitation is causing more uptake of
Almost all the mercury in Minnesota’s lakes and rivers methylmercury in animals.
comes from outside the state and is delivered by the
atmosphere. Mercury moves from air to land and water
by attaching to vegetation or washing out with rain andTribal Nations, Water and Climate Change 23
Tribes are decision makers The goals and strategies that appear in this report can all be
Under the federal Clean Water Act (CWA), tribes are eligible strengthened with deliberate attention to the knowledge,
to implement programs that protect water quality and priorities and needs of tribes in Minnesota. Specifically,
prevent pollution. The Fond du Lac and Grand Portage Bands advancing goals 1–5 in this plan should involve:
have established an environmental regulatory program
under the CWA. This means they set water quality standards • government-to-government consultation with Tribal
for tribal waters, which the U.S. Environmental Protection Nations:
Agency (EPA) approves. These tribes periodically review o Follow Executive Order 19-24, which directs state
their standards and propose changes based on science and agencies to recognize the unique legal relationship
public input. between the State of Minnesota and Minnesota
Tribal Nations and to “accord Tribal Governments
Tribes also have management authorities on tribal waters the same respect accorded to other governments.”
and in ceded territories, and they view their treaty rights
as a responsibility to manage resources to ensure their o Initiate government-to-government consultation
future use. Tribal environmental departments carry out at the beginning of policy or program development
monitoring, water treatment, infrastructure development, and not in the final stages when decisions have
pollution prevention, habitat restoration, invasive species already been made.
control and other activities. Tribes regularly work together o Work with tribal liaisons to distinguish between
to set priorities, share best practices and influence policy. consultation, collaboration and cooperation and
Tribes also collaborate with other jurisdictions such as cities, engage with Tribal Nations at the appropriate level.
counties and the state to manage water resources.
The United States and the State of Minnesota have a • integration of tribal knowledge and expertise into state
unique legal relationship with federally recognized tribes, strategies and actions:
which is set forth in the Constitution of the United States, o Value Tribal Ecological Knowledge on equal footing
treaties, statutes, Executive Orders, administrative rules and with other forms of scientific knowledge.
regulations, and judicial decisions.
o Integrate tribal knowledge early in planning and
policy development processes.
In Minnesota, Executive Order 19-24 directs state agencies
to conduct government-to-government consultation o Seek to engage tribal knowledge in multiple ways
with tribes and to look for mutually beneficial solutions. and look beyond usual sources of information.
Similar federal executive orders affirming tribal sovereignty Tribal knowledge may be represented in a variety
have been issued under multiple presidents including of formats and venues, including consultation
Clinton, G.W. Bush and Obama. Complex issues like and coordination with Tribal natural resource
protecting waters from climate change will require ongoing departments and technical staff, oral histories,
consultation with Tribal Nations in Minnesota. published papers and reports, white papers, blogs,
works of art, historical documents, undergraduate
Tribal knowledge and experience and graduate research reports, and more.
Tribes hold extensive scientific expertise about managing
waters and ecosystems that is critical for sustainable water • collaboration with tribes to protect culturally important
management in the face of climate change. They also offer water habitats and species that are vulnerable to climate
perspectives from Indigenous knowledge systems, which change:
are perhaps an even more significant asset for addressing
climate change. Indigenous ways of knowing that have o Recognize that species and habitats have multiple
been passed down through generations are sensitive to benefits for Minnesota tribes, including economic,
subtle changes and attuned to unique qualities of a place. cultural, nutritional and ecological benefits.
Moreover, tribes have already survived and adapted to o Consider the presence of culturally important
centuries of environmental, cultural and political change. habitats and species within ceded territories,
They have much to offer as Minnesotans work to protect reservations, allotments and land that is federally
waters from the impacts of climate change. supervised and set aside for the use of tribes,
(usually found on trust land).
o Consider opportunities to restore culturally
important species and habitats in areas where they
have been lost or degraded.GOAL 1:
Source: DNR Ensure drinking water is
Minnesota’s demand for water continues to grow along with our population and safe and sufficient
economy. By 2030, Minnesota’s population of 5.6 million is expected to grow to
more than 6 million. As Minnesota’s population and economy grow, so does the
need to protect drinking water. And as Minnesota’s climate changes, bringing
more intense and frequent precipitation, the challenge of protecting that water
is becoming more complex than ever.
Climate is a primary driver of Minnesota’s drinking water supply, influencing
precipitation, evapotranspiration, runoff and groundwater recharge. Climate
change is bringing more intense and frequent precipitation, which can lead to
fluctuations in drinking water quality and quantity.
Source Water in Minnesota
Public water supplies
from surface water: “Source water” refers to surface waters
Public water supplies
(streams, rivers, lakes) and groundwater
from groundwater: 25% or 1.4 million people that provide drinking water for public
54% or 3 million people water systems and private wells. Some
Private wells from
79% of Minnesotans get their drinking
groundwater: water from a community public water
21% or 1.2 million people supply, while 21% use private wells.
Source: MDH
In many parts of Minnesota, drinking water is vulnerable to contamination from the land surface. Increased precipitation and
runoff due to climate change can increase the amount of nutrients, pesticides and other contaminants in drinking water.
Warmer and wetter conditions can increase growth of toxin-producing algal blooms in source waters. Flooding can wash
pathogens from the land into public and private wells.
Nitrate contamination of drinking water can pose serious health concerns, especially for infants and pregnant women.
Although nitrate occurs naturally, it can also come from human-made sources such as human waste, animal manure and
commercial fertilizer. One of the main sources of nitrate is fertilizer used to grow annual row crops like corn. Nitrate not used
by crops easily moves by water through the soil into groundwater in areas dominated by coarse soils or underlain by eroded
limestone (karst), which forms underground drainage systems.
Increases in precipitation are likely to move more nitrate into drinking water sources. Increasing the acreage of perennial
crops such as alfalfa can reduce nitrate leaching. However, these crops must be economically viable for farmers to grow.You can also read