Organic is a solution that is profoundly simple - 2018 New Zealand Organic Sector Market Report - ANZ
←
→
Page content transcription
If your browser does not render page correctly, please read the page content below

2018 New Zealand
Organic Sector
Market Report
Commissioned by Organics Aotearoa New Zealand

Organic is a solution
that is profoundly simple                       2018 New Zealand Organic Sector Report l 1
Acknowledgements
The 2018 OANZ Market Report is the result of a team effort and team efforts
require acknowledgement.
The project was designed by OANZ and undertaken by The AgriBusiness
Group and Nielsen, supported by contributors who provided sector case
studies; the organic producers, processors, service providers, exporters,
retailers and certifiers who participated in the census as well as the Ministry
for Primary Industries (MPI) whose information collected as part of the
Official Organic Assurance Programme gave us essential data.
The report was co-ordinated and produced by Brendan Hoare, CEO of OANZ,
edited by Susan Robinson-Derus of Robinson-Derus Associates and designed
by Paradigm. Barbara Harford provided expert sub-editing.
Organic Aotearoa New Zealand is a registered Charitable Trust. Without our
members, sponsors and supporters we would not be able to deliver our
public good to New Zealand. We would therefore like to acknowledge the
following contributors in alphabetical order who have ensured the success
of our 2018 Market Report.
OANZ Members:
Agrissentials NZ IncaFe
Agrisea New Zealand Karma Cola
Bio-Dynamic Farming and Gardening Kokako
Association
Landcorp
BioGro New Zealand
Lawson’s Organic Farms
Bostock NZ
Organic Traders Association
Chantal Organics
Organic Winegrowers NZ
Certified Organic Kiwifruit Growers
(COKA) Open Country Dairy Limited
Helix Organics Pure Fresh Organics
Horticulture NZ Soil & Health Association
Huckleberry Farms Zespri International
Photographers
Amy Laing
Organisations who helped with the research:
ANZ
Buy Pure New Zealand
AsureQuality, BioGro, Beef and Lamb New Zealand, Dairy NZ, Federation
Ceres Organics
of Mäori Authorities, Ministry of Primary Industries
Clos Henri Vineyard
Commonsense Organics Ltd
Individuals:
Hans Herzog Estate Amy Liang and the Marketing team at Ceres who provided detail of the
Horticulture New Zealand organic domestic market to clarify the accuracy of the Nielsen scan data.
Linden Leaves Li-chen Hoare – Exporting and Systems Manager at Buy Pure New Zealand
Mark and Catriona White who along with Victor Grbic (OANZ’s Treasurer) ensured we were up-to-date
MyChillyBin and on budget.
Organic Initiative
Organic Winegrowers New Zealand The OANZ Board has provided leadership and guidance:
Peregrine Wines Doug Voss (Chair)
Pete Chapman Donald Nordeng (Vice Chair)
Plantae
Ana Aloma
PureFresh
Nicholas Brown
The AgriBusiness Group
Barbara Harford
Trilogy
Richard Lees
Zespri
Mark Levick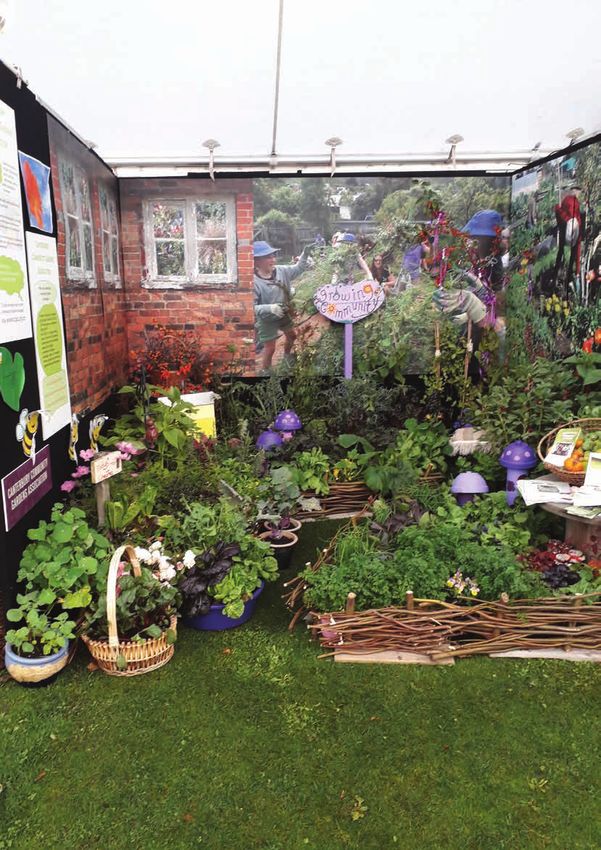
Sponsors

PLATINUM

GOLD

SILVER

           co a
           N E W   Z E A L A N D

BRONZE

                                   2018 New Zealand Organic Sector Report l 1
Contents
From the OANZ chair 3
SNAPSHOT 4
Going Organic is Good for You, NZ and the Planet 6
The Growing Organic Domestic Market: 8
the Consumer Voice
ORGANIC EXPORT MARKET IS BOOMING 16
Growing for Good: 22
Growing the Organic Sector to Meet Demand
Organic wins 30
Good Sense Choice Organic Wine of the Year Winner 30
Organic Kiwifruit Growers take out Supreme Award 31
CASE STUDIES: INNOVATION AT WORK 32
Organic Wine in New Zealand: Great Wine is in Our Nature 33
Organic Kiwifruit: An Important and Valuable Niche 39
Organic Dairy: Poised to Grow 43
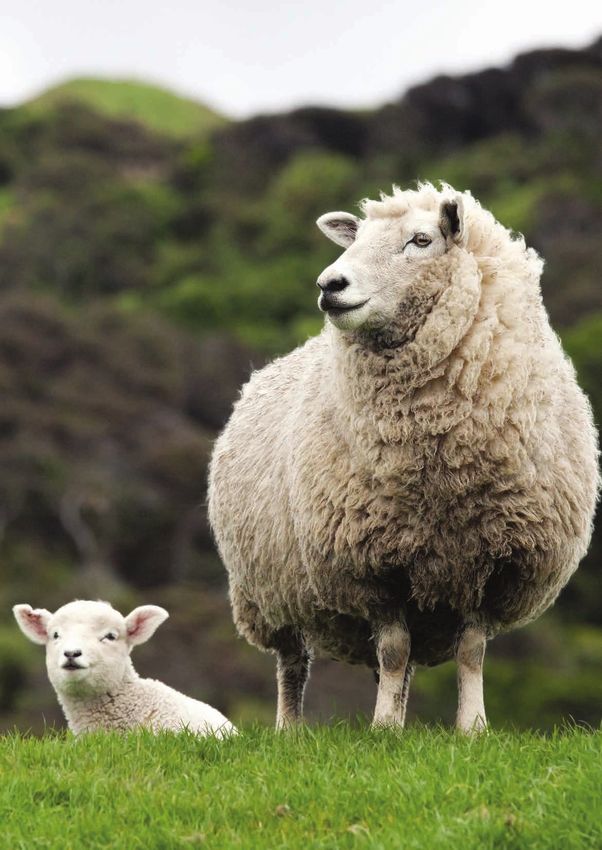
Organic Sheep and Beef Sector: Drive for Real Food 49
Local and Community Gardens 53
Authenticity Key to Natural and Organic Bodycare Sector Growth 59
GOOD ECONOMIC SENSE 71
Accounting for the True Cost of Food and Farming 71
Exploring the Financial Realities of Organic Farming: 77
a Rural Economist’s Perspective
Going for Good 80
Organic Certification in New Zealand is Growing 80
New Zealand Producing for Good 84
Global Market and Production Growth 87
The document is intentionally open source as we want the research to
assist all organisations, not just organic sector participants, in charting new
directions and even reframing existing perceptions. It can be found online at
www.oanz.org
2 l 2018 New Zealand Organic Sector Report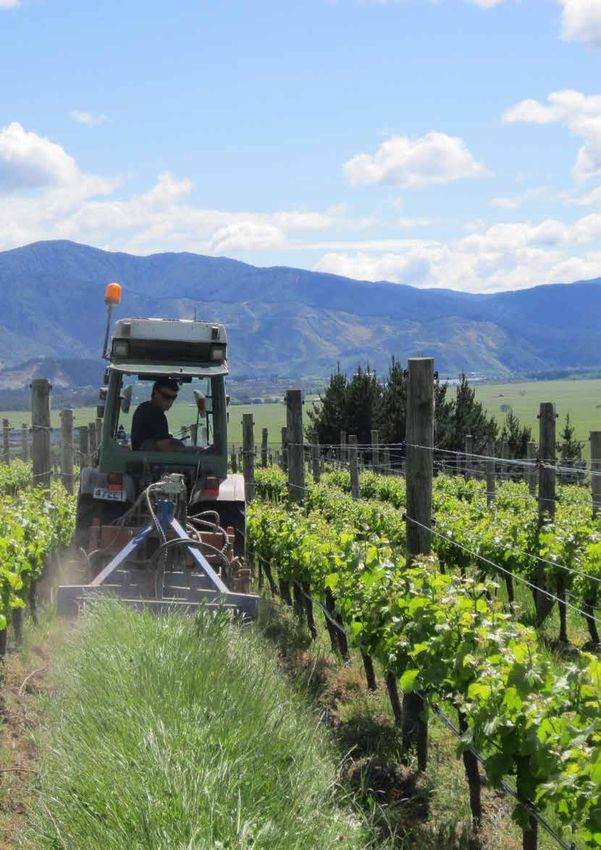
From the OANZ Chair

Kia ora tatou,
I am pleased to be able to share the 2018 Organic Aotearoa New Zealand
(OANZ) Market Report, which will provide information, insights, data and
analysis on the state of the organic sector today, signalling the opportunities
for growth in the age of the conscious consumer.
The report is a major undertaking by OANZ, the authoritative, national voice
of the New Zealand organic sector, bringing together a diverse membership
of leading organic producers, processors, suppliers, wholesalers, retailers,
exporters, certification agencies and consumers. We are grateful for the
support from the broader organic community in providing information,
insights and data for this seminal report.
The organic market is the fastest growing multi-food sector in the world,
driven by consumers who seek sustainable, ethical and authentic natural
products that are good for them and easy on the planet.
New Zealand too is riding this wave and has the reputation, production and
export capabilities to meet demand in markets hungry for organic food and
other products, including emerging powerhouse markets in Asia and China.
In an era where consumers hold the power, and it is up to producers,
marketers and policymakers to listen and act on the market signals, I am
optimistic that we will soon have in place the necessary regulatory regime
that is on par with other countries to provide the standards and confidence
that New Zealand certified organic products are the real deal.
OANZ, as champions leading the lobby for a single, mandatory, national
organic standard has welcomed progress being made by Government in
establishing the legislative framework. It’s needed and is a win-win for
everyone. It will significantly enhance export opportunities, encourage
investment in organic production and give consumers and customers peace
of mind.
We are grateful for the support shown by Minister Damien O’Connor and
MPI officials for OANZ’s strategy and their understanding of the market
drivers that demand that New Zealand provides customers, consumers and
                                                                                  In an era where
the community domestically and internationally with certainty and credence.       consumers hold
We would also like to acknowledge the Minister Damien O’Connor for
hosting our launch in Parliament. We look forward to continuing to work           the power, it is
together with the government, the sector and stakeholder communities
collaboratively and co-operatively for the good of the organic sector and         up to producers,
the good of New Zealand.
                                                                                  marketers and
Yours sincerely,                                                                  policymakers
Doug Voss
Chair
                                                                                  to listen and act
                                                                                  on the market
                                                                                  signals.

                                                                                     2018 New Zealand Organic Sector Report l 3
SNAPSHOT
Key changes 2015-2017
                                                                                 60%                           40%
The total size of the New Zealand
organic sector in 2017 is estimated

                                                          $606m
at $600 million, up 30% or

                                                  $467m
$139 million since 2015.                                                    $355 million                $245 million
                                                                                is export                   is domestic
15% growth p.a.                                   2015 2017

    Consumers know Organic is good
                                  The domestic                        Up 8.1%
                                 organic market                                             Organic supermarket sales
                                   is growing                         per year              were $216m and $30m from
                                                                                                 speciality stores
                               twice as fast              against non-organic products          for the year to May
                                as conventional.          at 4.8% per year.                   (still only 2.2% of total
                                                                                               supermarket sales)
               Close to
                              80%            of New Zealanders purchase
                                             organic products at least fortnightly:
                                                  35% buy                 20% buy organic               15% of baby
                 51% buy organic               packaged/dried/              personal care             products sold in NZ
                  fresh food items
                                                 frozen items                 products                are certified organic

                               67% of respondents                                     More than 67% of Kiwi
                         selected the main reason for                               consumers expect an organic
                          choosing organic products                              product to be ‘natural/chemical free’
                        ‘is to look after my own and                               and ‘pesticide/spray free’, while
                              my family’s health’                                  only 50% expect the product to
                                                                                     be ‘sustainably produced’.

Just under half (48%) say                                             75% of people who don’t
they purchase organic products                                      buy organic products say they
because they are ‘concerned for                                    would rely heavily on an organic
 the environment/sustainability’                                     certification mark to identify
                                                                           organic products.

4 l 2018 New Zealand Organic Sector Report
Organic
exports are
booming                                             Fresh fruit and vegetables        Dairy, meat and wool                   Wine exports
up 42% to $355m                                     up 26% to $136m                 up 45% to $99.5m                up 13% to $46.5m

   Processed foods                    Beverages (fruit juices, organic           Honey exports up
                                                                                              from               Organic cosmetic and beauty
   and ingredients                       soft drinks and vinegar)                $230,000 to $1.4m                products valued at $28m,
up 7% to $25.9m                                up 20% to $12m                                                    8% of total exports

  Organic export markets are stable:
                                                 Europe, North America and Australia
                    ri c a a n
                Ame            d                continue to be the sector’s primary export
             th
                                                    destinations, together comprising
                               Au
   Europe, Nor

                                 stralia C

                                                            69% of all exports.
                                                                                               The global market for organic food
                                                   There has been limited growth in the
                                                 value of exports to Asia, with exports to             worth EUR85b
                                          hi

                             na
                                               China staying at around 10% of total exports.        and growing at 10.5% p.a.

Producers and Manufacturers are Listening for Good
Certified organic operations are up 12% to 1,118 licensees and 1,672 certified enterprises.

                    More than 50% of producers                                                                     Organic land area
                    say they are interested in transitioning                                                      in New Zealand has
                    to, or learning more about organic
                                                                                               up 17%           increased to 88,871 ha

                    Organic livestock area has increased to                                         Horticulture/viticulture has decreased
                   64,278 ha, up 50%, the number of organic                                                to 23,943 ha, down 6%.
                     dairy farms is up by 10% but livestock
                               numbers are static

                                                                                                              2018 New Zealand Organic Sector Report l 5
Going Organic is Good for
                                             You, NZ and the Planet
                                             by Brendan Hoare, CEO of OANZ

                                             At a time when humanity grapples with the complexity of global
                                             environmental, economic, social and health issues, organic continues
                                             to offer a solution that is profoundly simple.
                                             Our approach for over 75 years has been doing what is simply good and
                                             healthy from the ground up: healthy soil > healthy food > healthy people.
                                             We are champions of correct perseverance, and as a sector resilient, thick
                                             skinned and complex, like a delicious, organically grown grape.
                                             The OANZ 2018 Market Report offers an in-depth analysis that incorporates
                                             a whole of market, integrated value chain and systems approach from
                                             consumer to producer.
                                             We look at perceptions, needs and demands from a consumer and a farmer’s
                                             point of view, update the key domestic and export sales and production data
                                             and how New Zealand is tracking against global trends and developments.
                                             We also report developments, issues, challenges and opportunities in our
                                             key productive sectors – dairy, beef and lamb, wine, kiwifruit, community
                                             gardens and the emerging beauty and bodycare segment, and for the first
                                             time investigate the holistic benefits of organic production that go far beyond
                                             dollar returns in an economic study.
                                             OANZ, as the voice of organics across New Zealand, is driven by doing what
                                             is good for the country, not in its individual parts or just for organic, but good
                                             for everyone as a whole. The result is that we have identified key trends
                                             and gathered the evidence from independent research to provide insights
                                             and information that can support a transition along the path to a sustainable,
                                             carbon free future.
                                             It won’t happen overnight. Revolution – let alone evolution – takes time,
                                             commitment and collaboration, but the transformation is happening.
                                             The report findings tell us loud and clear that opportunity lies before us.
                                             The world wants what New Zealand has to offer.
                                             We have momentum across multiple sectors. Organic exports are up 42%
                                             and the domestic market is booming with New Zealand’s total organic market
                                             recording significant growth, up 30% since 2015.
                                             We have the capability to grow and lead a culture change to deliver clean,
                                             green, and third party verified food that people can trust to be authentic,
                                             and is good for them, their families and the environment.
                                             Organic is not a trend or fashion. It is a sophisticated and dedicated market
                                             segment that can sniff out a whim or off brand moment a mile away.

Organic continues                            Organic offers a choice to society to make changes for the long-term good.
                                             The report articulates a national and global mood for change to natural,
to offer a solution                          ethical, sustainable food and other daily used products. Consumers want
                                             change, so they can live their values, producers and farmers are seeking
that is profoundly                           change to do what is good for the land they love, and global markets are
                                             demanding greater and greater choice as organic goes mainstream.
simple.                                      Importantly, there is a new-found sense of assuredness and an appetite
                                             to seek out opportunities across new and emerging market segments.

6 l 2018 New Zealand Organic Sector Report
The report
In a world of conscious, values-driven consumers, who know what they want
and expect to be able to get it, producers and manufacturers are hearing the
call and aligning their values, skills and purpose to deliver authentic products
while demonstrating, for all the world to see, care for the environment.             articulates a
The report also clearly indicates that Kiwis want to be part of the global
movement towards sustainability – economically, socially, culturally and
                                                                                     national and
environmentally.                                                                     global mood
We, like the rest of the planet, are better informed about our impact on the
environment, more conscious and purposeful in our resolve to lightly tread           for change to
on our earth and more open to being involved, in doing our bit, beyond saying
no to a plastic bag at the checkout counter.
                                                                                     natural, ethical,
The market is telling us to grow. OANZ’s job is to anchor the foundations to         sustainable food
support growth. We’re doing that by sharing knowledge, building a network
of organic experts and working with government to ensure we have the                 and other daily
                                                                                     used products.
fundamentals of a regulation and national standard to define organic that
aligns New Zealand with international best practice.
We know that the term ‘organic’ is not clearly understood, that consumers,
customers, retailers and producers need ongoing information to educate
them on what is, and what is not, authentic organic and to help them
navigate the plethora of certifications and other labels.
We believe that New Zealand can lead the world in organic innovation and
quality, with a guarantee that we are who we say we are every time and so
earn the credence of the marketplace at home and offshore.
We must also have courageous conversations and cooperate, collaborate
and communicate with: ourselves, government, policy makers, the organic
community, distributors, exporters, manufacturers, retailers, consumers
and certifiers from across the board. We must work together to shape a
robust and consumer-to-producer, integrated strategy that will support growth
and invite wider participation.
The world of organic offers a simple and compelling solution for the greater good.

                                                                                        2018 New Zealand Organic Sector Report l 7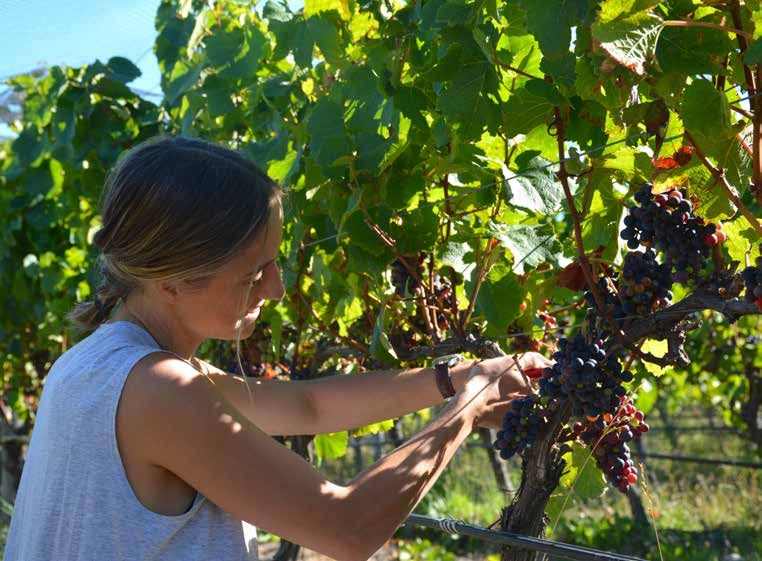
The Growing Organic
                                               Domestic Market:
                                               the Consumer Voice
8 out of 10                                    AC Nielsen undertook comprehensive research and analysis of the
                                               organic domestic market and consumer perceptions and behaviours.

kiwis purchase                                 The New Zealand domestic market is estimated to be worth $246m a
                                               year, up from $192m or 28% over 2015 and contributing 41% to total
organic products                               estimated organic sector sales of $600m annually.
at least fortnightly                           Supermarket sales of $216m dominate with specialist organic shops
                                               attracting $30m in sales from a growing consumer market.
                                               Knowing the consumer, their needs and desires, values and sense of
                                               purpose, is fundamental to delivering the right products at the right price
                                               through the right channel with the right messaging to grow organic sales.

                                               UNDERSTANDING CONSUMERS’ PERCEPTIONS OF ORGANICS
 Nielsen Methodology
                                               Key takeaways from Nielsen’s survey
 A comprehensive analysis of the organic
 domestic market was undertaken by AC
                                               Organic products reach the majority of New Zealanders
 Nielsen. This research sought to provide      The majority of shoppers (79%) purchase organic products with at least
 insight into the following questions:         some frequency.
 • How do consumers distinguish
    between organic/non-organic                Organic fresh food items are purchased most frequently, with 51% of
    products? What do they understand          shoppers saying they purchase these items at least fortnightly.
    organic to mean?
 • What organic markings do they              Organic personal care and packaged/dried/frozen items are purchased less
    recognise? What makes them think           frequently, with packaged/dried/frozen goods being purchased by just over
    that a product is organic?                 one third (35%) of shoppers at least fortnightly
 • Are they aware of any organic brands?
    What are these?                            20% of shoppers purchasing organic personal care products at least fortnightly.
 The survey research was conducted on
 Nielsen’s Omnibus Survey, which is an         A majority of shoppers do not fully understand what ‘organic’ means
 online survey that runs on a fortnightly      More than three quarters of shoppers expect an organic product to be
 basis. The survey was in field between        ‘natural/chemical free’ and ‘pesticide/spray free’, while only half of shoppers
 4-10 May 2018.
                                               expect the product to be ‘sustainably produced’.
 The total sample was n=1000 New
 Zealanders aged 15+. After fieldwork,
 the data was weighted by age, gender
                                               Health is a key motivation for purchasing organic products
 and region to ensure that the sample          The leading reason for choosing to purchase organic products is ‘to protect/
 was representative of the New Zealand         promote my health/the health of my family’, with 67% of respondents
 population.
                                               selecting this option.
 The retail data was extracted from
 Nielsen’s ScanTrack database. The data        Just under half (48%), say they purchase organic products because they are
 is available in this report to 20 May 2018.   ‘concerned for the environment/sustainability’.
 Annual totals are not calendar year, but
 rather a year back from when the data
 was extracted. Categories included in
                                               Certification marks are not relied on by the majority of current
 this analysis are chilled foods, shelf        organic shoppers
 stable bakery biscuit, grocery (excluding     People who don’t buy organic products say they would rely heavily on an
 canned & soup), beverages, snack food/
                                               organic certification mark (75%) to identify organic products, if they were
 confectionery, fresh foods, frozen foods,
 canned food & soup and baby products.         to purchase them in the future.
                                               For those who currently buy organic products, organic certification marks play
                                               less of a role, with only 5% spontaneously indicating that they would explicitly
                                               look for an organic certification mark to identify the product as organic.

                                               Organic sales still account for just a small amount of total grocery
                                               2.2% of all grocery sales are organic products.
                                               The total value of the organic supermarket sales in the past year is $216m.
8 l 2018 New Zealand Organic Sector Report
Frequency of purchasing organic products
Although the majority of shoppers purchase organic products at least once
every few months (79%), only 16% of shoppers purchase organic products
from all of the different organic categories. Organic fresh food is purchased
79%
of shoppers
most frequently, with 75% of shoppers saying they purchase organic fresh
food at least once every few months. purchase an
Organic fresh
35% 16% 11% 13% 25%
organic product
food items
Organic
at least once every
packaged, dried
or frozen goods
17% 18% 15% 16% 34%
few months
Organic personal
care products
8% 12% 19% 24% 37%
21%
At least weekly At least once every few months,
At least fortnightly, but not weekly but not monthly
At least monthly, but not fortnightly I do not purchase this type of product
of shoppers do not
purchase organic
products
7%
of organic
WHAT DOES ORGANIC MEAN TO CONSUMERS
Knowledge of what organic means is low
Natural/chemical free and pesticide/spray free are the top expectations of
an organic product for both organic purchasers and non-organic purchasers.
purchasers were Knowledge was particularly low amongst non-organic purchasers, with 9%
of non-organic purchasers saying none of the attributes were things they
able to identify expected an organic product to be.
all aspects of an
Knowledge of all criteria that distinguish an organic product is low, however,
with only 7% of organic purchasers being able to identify all aspects of any
organic product organic product.
Expected attributes of an organic product
Natural/chemical free 78%
76%
Pesticide/spray free 75%
79%
Free range/cage free 71%
63%
Hormone/antibiotic free 66%
76%
GMO-free (genetically 64%
modified organism-free) 69%
Sustainably produced 51%
43%
Grass fed 42%
46%
Fair trade 35%
30%
Other 1%
2%
3% Organic Purchaser
None of the above
9% Non-organic Purchaser
Don’t know
1%
2018 New Zealand Organic Sector Report l 9HOW SHOPPERS DETERMINE WHETHER
A PRODUCT IS ORGANIC
Shoppers rely on the label/package to determine
5%
of organic
if a product is organic
A quarter of organic purchasers determine whether a product is organic purchasers
would rely on a
by reading the product’s label. If the label contains the word ‘organic’, this
also indicates to organic purchasers that the product is organic, with 19%
of organic purchasers saying they look for the word ‘organic’ in the label to
determine if a product is organic. certification mark
Only 5% of organic purchasers would look for a certification mark to
determine if a product was organic.
to determine if the
How you determine whether a product is organic – organic producer
product was organic
Read the label 24% New Zealanders’ reliance on a
certification mark to determine whether
a product is organic is relatively low
Read the packaging 22% when compared to Australia.
Only 5% of New Zealanders who
The label includes the word ‘organic’ 19% ourchase organics would look for
a certification mark, wheras half of
Labelled free from chemical/ Australians who purchase organic
9%
peticides/preservatives/additives
products say that they would look
Buy from organic shops/organic
9%
for an organic certification mark.
section of shop/supermarket
Labelled free range/cage free 7%
Read the ingredients 6%
Know/recognise the brand/
5%
source as organic
Look for the certification mark/
5%
organic certification mark
Buy from Farmers Markets/farms 4%
Look for natural ingredients/
3%
the word ‘natural’
Other 11%
10 l 2018 New Zealand Organic Sector Report67%
of organic shoppers
HEALTH IS THE LEADING REASON
TO PURCHASE ORGANICS
More than two-thirds of organic shoppers say they choose to purchase
organic products to protect/promote the health of themselves or their
family. Taste is also important, with more than half saying they choose to
purchase organic purchase organic products for the better, real food taste. Altruistic reasons
products for for purchasing organics are less prevalent, with concern for animal welfare,
biodiversity and farm workers falling lower down the list as a reason to
personal or family purchase organic products.
health reasons Reasons for purchasing organic products
To protect/promote my health/
67%
the health of my family
New Zealanders and Australians are
not different in their motivations for
Better natural, real food taste 56%
buying organic products. Two-thirds
of Australians also indicated that they
Concern for the environment/
started to buy organic products for 48%
sustainability
person health reasons.
Concern for animal welfare 40%
Concern for biodiversity 21%
It aligns with my family/
community values 18%
Concern for farm workers 16%
Other 4%
CERTIFICATION MARKS MATTER MORE TO SHOPPERS
WHO ARE UNFAMILIAR WITH ORGANIC PRODUCTS
Three-quarters of non-organic purchasers would look for a certification mark
to determine whether a product is organic. Half would look for a specific call
75%
of non-organic
purchasers
out on the label that indicates that the product is organic. Characteristics that
require the shopper to have more knowledge of organic products are less
relied on, with only a quarter saying that they would look at the brand of the
product and just over a third saying they would look at the ingredient list. would rely on
How you determine whether a product is organic – non-organic purchaser certification marks
to determine if a
I would look for an organic certification mark
I would look for a specific call out on the
75%
product is organic
49%
label that indicates the product is organic
I would look at the ingredient list 35%
I would observe where the product is placed within the overall store
31%
( eg. is it an organic section or next to another organic product)
I would look at the name of the product (eg. does the
30%
name of the product contain the word organic)
I would look at the brand of the product (eg. is the
25%
brand known for making organic products)
I would look at the label appearance or
12%
overall colour scheme of the product
Other 1%
None 2%
Don’t know 2%
2018 New Zealand Organic Sector Report l 1146% AWARENESS OF NZ ORGANIC CERTIFICATION
MARKS IS MODERATE
Awareness of certification marks is particularly low among
of non-organic non-organic purchasers
purchasers were Organic purchasers are significantly more aware of NZ organic certification
marks than non-organic purchasers. Close to half of all non-organic
unable to identify purchasers are not aware of any certification marks.
any of the markings The Fair Trade mark has the highest awareness among both organic and
non-organic purchasers.
New Zealanders awareness of NZ Awareness of organic certification marks
certification marks is on par with
Australian’s awareness of Australian
organic certification marks. Half (49%) 61%
Fair Trade
of Australian shoppers can recognise 40%
the AUstralian Certified Organic mark 22%
ACO Certified Organic
(ACO), whereas 53% of New Zealanders 6%
can recognise at least one of the NZ 19%
Non-GMO
organic certification marks. 6%
Organic Purchaser
USDA Organic 13% Non-organic Purchaser
4%
Soil Association Organic 9%
2%
Biogro 39%
18%
32% New Zealand Organic
Organic Farm NZ
11% Certification Markings
26% Organic Purchaser 59%
AsureQuality 9% Non-organic Purchaser 26%
Demeter 13%
2%
15%
None of these 46%
AWARENESS OF ORGANIC Unprompted awareness of brands offering organic product
BRANDS IS LOW
Ceres 11%
More than half of shoppers are
Macro 6%
unable to spontaneously name
a brand that sells organic Fair Trade 4%
products Ecostore/Eco 3%
Although a quarter of non-organic
Pams 3%
purchasers say they would rely on
brand to determine if a product Huckleberry 2%
2%
was organic, the vast majority of
non-organic purchasers cannot Heinz 2%
spontaneously name a brand that
Healtheries 1%
sells organic products (45% say
‘none’ and 37% say ‘don’t know’). Chantal Organics 1%
Of the organic brands that were
named, Ceres was the brand with Tegel 1%
the most mentions. Just over one in
None 20%
ten (11%) shoppers identified Ceres
as an organic brand. Don’t know 36%
12 l 2018 New Zealand Organic Sector ReportNEW ZEALAND ORGANIC SALES DATA
Organic products are growing steadily and more quickly
than non-organic products
Annual sales of organic products through supermarkets reached $216m
million for the year to May 2018, up 8.1%
The growth was faster than the 7.2% recorded in the prior year and twice as
fast as the 4.1% increase in non-organics sales.
Organic product share of all categories has grown from 0.1% for the past
two years to 2.2% of sales across categories reviewed. This share has been
driven by an increase in share for certified organic products.
Organics share of all categories – value
2.5%
2.2
2.1
2.0
2.0%
1.5%
1.0
1.0
1.0% 1.1
0.5%
0.9 1.1 1.2
0%
20/05/2018 MAT to 21/05/2017 20/05/2018
Certified Non-certified
Total value growth – supermarkets
5.7%
Non Certified -1.8%
10.4%
Certified 17.8%
8.1%
Organics 7.2%
4.8%
All Categories 4.3% MAT to 20/5/2018 MAT to 21/5/2017
0
Growth of 10.4% for certified organic products was ahead of non-certified
organics which recorded growth of 5.7% after slipping by 1.8% in 2017.
The unit volume picture sees similar trends with unit share of 2.0%, the
lower share reflecting a higher value achieved per unit for organic products.
2018 New Zealand Organic Sector Report l 13Category value share of total sales
23.0%
25%
20.6%
19.1%
20%
Total Organic
20%
14.5%
13.6%
12.8%
11.8%
11.6%
15%
10.6%
8.1%
10%
6.7%
3.9%
3.7%
3.3%
3.0%
2.6%
5%
1.1%
0%
Shelf Stable
Bakery Biscuit
Chilled Foods
Grocery (excl.
Canned & Soups)
Beverages
Snackfood
Confectionery
Fresh Foods
Frozen Foods
Canned Foods
& Soups
Baby Products
Three of the four largest categories – Chilled Foods, Shelf Stable Bakery
and Biscuit, and Beverages also have the highest value share for organic
products.
Grocery excluding (Canned & Soups) has a lower share. Baby (221%) and
Beverages (169%) over index the most for organics.
Baby Products have a higher index for Organics versus Total Category for
unit sales (777%), reflecting a relatively low value per unit for Baby Products.
Organic products category value growth
All Categories 8.1%
7.2%
Baby Products 6.6%
14.2%
Canned Food & Soups 23.6%
23.4%
Frozen Foods 10.8%
4.4%
Fresh Foods 6.4%
29.3%
Snackfood Confectionery 30.2%
6.5%
Beverages 23.0%
17.2%
Grocery (excl. Canned & Soups) 14.1%
18.5%
-1.9%
Shelf Stable Bakery Biscuit
0%
-0.8% Chilled Foods
-7.9%
0 MAT to 20/5/2018 MAT to 21/5/2017
14 l 2018 New Zealand Organic Sector ReportAll category growth is at 8.1% for 2018, ahead of 7.2% in 2017.
Growth is slower for Fresh Foods and Baby Products, and higher for
Beverages and Snack foods and Confectionery. Chilled Foods and Shelf
Stable Biscuit Bakery have declined across both years.
Table 1: Trends in supermarket grocery sales of organic products1
Year Value sales
2018 $216,000,000
2015 $167,170,081
2014 $130,106,081
2013 $109,182,882
2012 $67,500,000
2011 $62,800,000
Non-supermarket sales of organic products
In addition to sales of organic products through supermarkets there are other
channels where food is sold including:
• S
pecialist organic shops – these have been a traditional channel for the
sale of organic food. Businesses such as Commonsense Organics, Ceres,
Huckleberry and Chantal Organics have become large operators with
increasing sales. The 2015 census estimated sales of certified organic
products through this channel at $25.7m. This market has continued
to grow, probably at a similar 8% rate to organic supermarket sales,
suggesting sales in 2017 of approximately $30m.
• F
armers markets and box schemes – many suppliers to farmers markets
are organic, with certification from Organic Farm NZ being especially
important. There is no reliable tracking of sales through farmers markets
or via box schemes so no estimate of sales through these pathways is
provided.
Fraudulent Organic Claims
Fraudulent claims for products that do not have the appropriate quality, origin
or production systems certification are an ongoing issue. Organic products
have third-party inspection systems and other systems to address this risk.
However, fraud does occur. The value of non-certified organic product is
estimated by Nielsen to be at least $104m.
New Zealand is only one of two exporting countries in the world that does
not have national standards to define organics, but it is hoped that this will
change with the establishment of a single, mandatory national standard and
regulatory framework, currently under discussion with government.
1 N
ote the figures for 2011-2015 do not include
sales of fresh foods at supermarkets so
comparison between the 2018 results and
previous years can only provide a guide on
trends between surveys
2018 New Zealand Organic Sector Report l 15Organic Export Market
is Booming
The market for New Zealand organic exports has
Research Methodology grown dramatically in value, up 42% to an estimated
$360m since the last survey in 2015 – that’s 1000%
Organic Exporters and Processors
A list of certified organic exporters and growth in 10 years, admittedly from a very low base.
processors was compiled from the
membership of Organic Exporters of New Table 2: Size of the organic export market, 1997-2017
Zealand, the New Zealand Food Safety
Authority register of organic exporters,
the licensee lists of organic certifiers, and Year Export Market Value
internet searches. $million
The list included organic production chains,
input and service providers, packers, 2017* 350-360
processors, and exporters and some retailers
and producers who may have been exporting. 2015* 240-250
Organic producers and exporters were
asked to provide information regarding 2012 215-225
the value and destination markets for
each of their certified organic products 2009 170-180
during the previous financial year, as well
as the percentage of turnover attributable
2007 120-130
to certified organic products. The census
methodology and questionnaire were
designed to reproduce the methodology of 2002 70
the previous organic sector census.
1997 32
Of the 229 processors, input and service
providers, and exporters identified, 132
responded to the survey or follow-up calls. *1997 & 2002 figures from OPENZ Surveys
Of these responses, 12 reported no certified
organic activities for the 2016-17 financial
year, while 20 were removed for other
reasons including not exporting. The 2017 export figure combines $250m based on actual responses from the
Export value estimations for key non- questionnaire and an estimate of $100m based on OANZ sources, industry
respondents were made based on available
data on export volume, price per unit
consultants or sector group leaders. As a result, there is a relatively strong
calculations and known values from previous degree of confidence in the total market estimate and its error range.
years.
16 l 2018 New Zealand Organic Sector ReportExports
Figure 1: Size of the Organic Export Market (NZ$) 1997-2017
400
350
Export Market Value
Export Market Value, 350 up 42%
300
250
to $355m
200
Value ($ NZmillion)
150
100
50
0
1997 2002 2007 2009 2012 2015 2017
Data collected during the 2017 census shows the organic export market is All categories
expanding in the value of exports and the number of active exporters, as well
as seeing the emergence of new entrants like those in the organic cosmetics have grown in
and beauty products.
value since 2015.
Product Categories in the Organic Export Market
All categories have grown in value since 2015. Exports of wine have grown
by 87%, dairy and meat exports by 45%, fresh fruit and vegetables by 26%,
other beverages by 20% and processed food by 11%. Cosmetic and beauty
products are a new category with previous results included in the ‘other’
category and it is apparent there is significant growth in export values.
Table 3: Value of organic exports by product category, 2007-2017
2007 2009 2012 2015 2017
Fresh Fruit and 88,360,000 85,850,000 96,860,000 108,120,000 135,910,000
Vegetables
Dairy 6,990,000 27,850,000 36,950,000 68,290,000 99,470,000
Meat and Wool 8,920,000 9,185,000 10,120,000
Processed Food 6,120,000 20,280,000 29,350,000 25,180,000 27,975,000
and Ingredients
Wine and Beer 3,890,000 16,960,000 10,970,000 24,740,000 46,492,000
Other Beverages 17,840,000 10,050,000 12,079,000
Honey 3,960,000 8,320,000 7,940,000 230,000 1,438,000
Cosmetic/beauty - 28,200,000
Other 2,170,000 2,040,000 4,970,000 3,900,000 4,907,000
Total 120,410,000 170,485,000 215,000,000 240,510,000 356,471.000
Opposite: Zepri Organic kiwifruit is popular
in Asian markets.
2018 New Zealand Organic Sector Report l 17The results from the survey highlight the changing character in the relative
importance of the different categories of organic exports. Fresh fruit and
vegetables have always been the largest export category and while export
values continue to grow, the percentage of total exports has declined from
a peak of 78% of exports in 2002 to 38% currently. Dairy and meat exports
have grown since 2007 from 7% of total exports to 28%. Organic cosmetic
and beauty care products make up an estimated 8% of total exports.
Table 4: Value of organic exports by product category percentage 2002-2017
2002 2007 2009 2012 2015 2017
Fresh Fruit and 78% 73% 50% 45% 45% 38%
Vegetables
Dairy - 6% 16% 17%
28% 28%
Meat and Wool 7% 8% 6% 5%
Processed Food 8% 5% 12% 14% 10% 8%
and Ingredients
Wine and Beer 2% 3% 10% 5% 10% 13%
Other Beverages - - - 8% 4% 3%
Honey - 3% 5% 4% 0.1% 0.1%
Cosmetic/beauty 0% 8%
Other 5% 2% 1% 2% 2% 1%
Growth by Category at a Glance
$136m Fresh fruit and vegetables continue to be the highest value
category with nearly $136m in exports in 2017, up 26% in value
from 2015. Kiwifruit and apples account for a substantial proportion
of these exports, with smaller volumes of other crops including
blueberries and cherries. Kiwifruit exports are principally managed by
Zespri though there are also organic exports to Australia managed by other
exporters. Organic pipfruit production is dominated by Bostok New Zealand
which has over 500ha in organic pipfruit and exports approximately 90%
of all organic pipfruit2 from New Zealand. The value of organic vegetable
exports has continued to decline with only a very small value of exports
reported. This is a significant change from earlier surveys. In 2002-03 organic
vegetables (mainly squash and frozen vegetables) made up 7% of exports,
while fresh fruit made up 93% of exports.
$99.5m Dairy, meat and wool have been combined into one
category and are the second largest export category with
28% of total exports in 2017, values at $99.5m. The value of
pastoral exports has grown 45% since 2015. Further details on this sector
are included in the case studies on dairy, and the sheep and beef sectors,
in section 5 of this report. In relation to organic dairy exports there are more
exporters now active with 13 dairy companies having export capabilities.
Some of these companies are only starting to develop their organic supply
2 www.bostock.nz/organic/ chains so it is anticipated that this category will continue to grow rapidly.
18 l 2018 New Zealand Organic Sector ReportProcessed foods and ingredients have increased slightly from 2015
to $25.9m or 7% of total exports. Looking at the decrease in organic
land area and feedback from processors indicates that imports of organic
inputs for organic processed food production is supporting this growth. There is
$25.9m
also a growing range of organic processed products that are exported including
products such as baby food, barley and wheat grass powders, and soups.
Wine exports increased to $46.5m, 13% of total organic exports. The
survey of organic certifiers identified 1,720 ha of grape vines planted,
which is approximately 4.6% of the total vineyard land in New Zealand3.
If export value is directly correlated to land area in viticulture, organic
$46.5m
wine exports would be approximately $76m, based on total wine exports of
$1.67b. The total from the survey however, is lower. This could be a result
of lower export sales for organic wine in comparison to overall wine exports.
A greater proportion could be marketed domestically – the survey of organic
wineries identified an estimated $28m of organic wine sold in the local market.
In addition, it seems that organic grapes are sometimes used to produce wine
that is then sold as conventional wine with no organic certification or label
claims. This appears to be a unique feature of the organic wine sector where
organic grapes are highly valued to produce the highest quality wine. There were
only very small exports of organic beer recorded in the well-supported survey.
The beverages category is defined as all non-alcoholic, non-
dairy beverages, and is made up primarily of fruit juices, organic
soft drinks and vinegar. This has shown a 20% increase in the
value of exports from the 2015 census with an estimated value of $12.1m.
$12.1m
The low response rates from operators in this section, possibly reflecting the
level of competition present, gives a lower level of confidence in this result.
$1.4m
Organic honey exports have rebounded from the previous 2015
survey when export values declined by 97% between 2012 and
2015. Based on the latest census, the value of exports has increased
from an estimated $230,000 in 2015 to an estimate of $1.4m in 2017.
$28m
The value of certified organic cosmetic and beauty
products is significant, estimated at over $28m. This is the first time
that organic cosmetic and beauty products have been reported as a
separate category, acknowledging the significant growth in this sector. There
are some large companies that have grown rapidly over the last few years
including Trilogy Natural Products and Antipodes. There are also many smaller
companies exporting organic products. The sector appears to be highly
competitive and this is reflected in the low response rates to the survey,
however analysis was assisted with the public reporting that some companies
are required to provide. There is more information on this sector in section 5.
The ‘other’ category includes eggs, aquaculture products, oil and any
other products that are not included in the other categories. Aggregation
of exports into this category was necessary to protect the confidentiality
of market participants for products with a limited number of producers and
$4.9m
exporters. The total value of exports in this category is estimated at $4.9m, 3 B
ased on a total grape area of 37,129 ha sourced
up 25% from 2015. It should be noted that previously this category included from 2017 NZ Winegrowers Annual Report –
www.nzwine.com/media/6600/nzw-annual-
cosmetic and beauty products. This indicates that the production and export report-2017.pdf
of some of the other products in this category are increasing.
2018 New Zealand Organic Sector Report l 19Value of Organic Exports Against Total Exports
Organic export category value rankings differ quite significantly from total
exports. Dairy, and meat and wool are the two largest categories for total
export value and are second for organic. Organic fresh fruit and vegetables
categories have the largest proportion of organic export value to total export
value. Processed foods and ingredients and uncategorised exports cannot
be compared due to potential incompatibility between census categories and
export categories available from Statistics New Zealand.
Table 5: Value of organic exports by product category (percentage) 2017
Export $ Total Export $ Organic % Organic
Fresh Fruit and Vegetables 2,909,000,000 135,910,000 4.67%
Dairy, Meat and Wool 19,633,000,000 99,470,000 0.5%
Wine 1,660,000,000 46,500,000 2.8%
Product Destinations for the Organic
Export Market
We tracked the value of organic exports by destination to reveal the
development and change of organic markets from 2002-2017.
Europe and Japan took two-thirds of the total market value, and as the organic
market evolved North America, Australia and Asian markets took the lead.
This survey does not signal many changes from the 2015 survey in relation to
the destination of organic exports. There has been a slight increase in exports
going to the USA at 26% of the total, while exports to Europe are stable at
around 27%. Exports to Australia are also stable with 16% of organic exports
destined for that market. In relation to Asia, the percentage of exports to
China has remained at a similar level of total exports while the percentage
exported to other Asian markets has decreased from 16% of the total to 8%.
Exports to other markets have increased to 5% of the total.
Table 6: Share of organic exports by destination 2002-2017
2002 2007 2009 2012 2015 2017
North America 15% 27% 22% 28% 24% 26%
Europe 41% 46% 37% 27% 26% 27%
Australia 1% 4% 19% 15% 16% 16%
Japan 26% 12% 9% 10% 6% 7%
China (incl HK) - - 1% 3% 10% 10%
Other Asia 1% 10% 11% 17% 16% 8%
Others 17% 1% 1% 0% 1% 5%
Europe, North America and Australia continue to be the sector’s primary
export destinations, together comprising 69% of all exports.
20 l 2018 New Zealand Organic Sector ReportFigure 3: Value of organic exports by destination 2002-2017
50%
45%
40%
35%
30%
25%
20%
15%
10%
5%
0%
North America Europe Australia Japan China (incl HK) Other Asia Others
2002 2007 2009 2012 2015 2017
Alignment of Results with Other Data Sources
The Ministry for Primary Industries manages the Official Organic Assurance
Programme (OOAP) that provides market access for New Zealand organic
exports to the USA, European Union and some other markets. OOAP tracks
the value of exports using this market access pathway.
For the year ending June 2017, the value of exports4 facilitated through
OOAP was $151.4m, an increase of 19% from the previous year. Exports
to the USA were $86.4m and $60m went to the EU. It should be noted
that while not all products are covered under the OOAP 5, processed and
unprocessed plant and animal products for human consumption are included
but not products like cosmetics.
While the results from the OANZ census and MPI will not totally align they
are relatively close which provides confidence in the information from the
OANZ census results.
4 A
s reported in `MPI Discussion Document Paper
No 2018/09 `Would New Zealand benefit from
new organic regulation? May 2018
5 w
ww.mpi.govt.nz/exporting/food/organics/
steps-to-exporting/
2018 New Zealand Organic Sector Report l 21Growing for Good:
Growing the Organic Sector to Meet Demand
Written by Brendan The growth of organic is being driven by consumers. They are seeking
greater integrity, transparency and authenticity in the products they consume,
Hoare and Jon Manhire. as well as a closer relationship with those growing their food.
Special thanks to the The organic market is the fastest expanding, multi-food category globally,
following people and pushing double digit global growth over the last decade and is now
their organisations: mainstream. The world wants safe, clean, honest food.
Mike Chapman and Bobby Hal, Progressive governments are responding to this surge in citizen demand by
Horticulture New Zealand recognising that certified organic is a proven system of ensuring traceability
from paddock to plate and providing consumer assurance.
Philip Gregan, Jonathan Hamlett
and Rebecca Reider, New Zealand Supporting organic through appropriate policy and regulatory regimes
Winegrowers has environmental, wellbeing and health benefits including reducing or
eliminating pesticides and harmful chemicals in the food chain, improving
Andrew Fraser and Lee Cowan, soil and water health, and increasing biodiversity which all help mitigate the
Dairy NZ effects of climate change.
Mark Aspin, Beef and Lamb This global trend for today’s well informed, values-driven consumer to
New Zealand choose natural, ethical, sustainably produced food is well understood by the
organic sector. We have helped shape it. Marketers know that to bridge the
Anaru Smiler, Federation of Mäori
gap between producers and consumers their brand story must demonstrate
Authorities (FOMA)
provenance, authenticity, transparency and shared values.
Supporting sustainability
A key role for OANZ is working with national decision makers and government
to effectively raise awareness on the multiplier benefits of organics. We
contribute to policy making that supports true sustainability in agriculture right
across value chains and consumption at the global and national level.
This in turn will help us reach sustainable development goals (SDGs), and
encourage decision makers to support solutions that are aligned to organic
system approaches around the world.
In New Zealand, OANZ’s foundation piece of work is the development
of a national regulation and standard to provide credence to customers,
consumers and communities, here and internationally, on the authenticity
of organic products from New Zealand.
OANZ, as the sector’s peak organisation, works collaboratively with other national
representative groups to support the growth and mainstreaming of organics as
well as reaching out to consumers in a bottom up approach. We must effectively
communicate and share information with a wide community of stakeholders.
Our focus for the last four years has been on the following organisations.
• H
orticulture New Zealand – the industry body representing all horticultural
producers.
• N
ew Zealand Winegrowers – the industry organisation representing all
grape growers and wineries.
• D
airy NZ – the industry organisation representing all dairy farmers.
• B
eef and Lamb New Zealand – the industry organisation representing
all sheep and beef farmers.
• F
ederation of Mäori Authorities (FOMA) – the organisation representing
150 major Mäori Authorities with approximately $11b in assets.
• H
orticulture New Zealand and Organic Winegrowers New Zealand
(an incorporated society working in partnership with New Zealand
Winegrowers) are active members of OANZ.
22 l 2018 New Zealand Organic Sector ReportNiki Boon captures the vineyard at work.
Producer Survey
Knowing the consumer demand nationally and globally, OANZ worked with
these sector agencies to undertake a survey to develop a clearer picture of:
• t he level of interest and understanding of organic from farmers and growers
• t heir level of interest in conversion to organic production
• a n analysis of the drivers and constraints supporting these intentions.
These agencies organised a survey of their members and requested
responses to the following common questions:
• W
hat is your current production system – certified organic, organic
without certification, conventional?
• M
ain drivers for going organic?
• W
hat are the constraints to transitioning to organic production?
• W
hat are the main reasons that you are not interested in organic production?
Similar questions were asked in the export survey on the production and
marketing of organic products and by research company, Nielsen on consumer
perceptions.
It is important to note that the survey is high level and is indicative, but not
in-depth. It was agreed by all industry bodies that it was timely for everyone
to learn more and gain sharper insights about the level of interest in organic
2018 New Zealand Organic Sector Report l 23The organic
from producers and farmers – and analyse how their intentions aligned with
consumer demands and desires.
market is the Results
fastest expanding, The industry agencies, in partnership with OANZ, organised the scope of
the survey and were responsible for inviting their members to participate in
multi-food the questionnaire. It was agreed to keep the survey comparatively short to
ensure an adequate level of response.
category globally, The survey response rates were low but on par, or above, normal member
pushing double survey response rates, according to the industry sectors. The results are
indicative only but do provide some insights into intentions and identify
digit global issues in relation to producers in these sectors.
growth over the Table 7: Survey response rates
last decade and is Sector Total number
of producers
Survey
Responses
Response
rate
now mainstream. survey sent
to
The world wants Horticulture Growers 2600 324 12%
safe, clean, Wine (Grape Growers and wineries)
Dairy farmers
1403
11748
100
80
7%
1%
honest food. Sheep and Beef farmers 12500 83 0.67%
Federation of Mäori Authorities 174 14 14.3%
The highest response rate came from FOMA, followed by horticulture
growers and those involved in the wine industry rather than pastoral farmers,
possibly reflecting the greater level of current organic activity in these sectors.
Chris Denniston from Springvale Orchard
in Central Otago with his cherry crop. At
Christmas time you can eat them just about
anywhere in the world, he says.
24 l 2018 New Zealand Organic Sector ReportTable 8: Response by size of operating unit
Industry
Sector Survey Response Analysis
Av size
Horticulture Operation size (Ha) 0-50 Ha 51-100 101-500 501+
% of respondents 86% 6% 6% 2%
Herd size
Dairy 414 cows 0-200 201-350 351-500 501-750 751+
(Cow No)
% of respondents 21% 27% 16% 24% 12%
Sheep & Beef 252 Ha+ Farm Size (ha) 0-50 ha 51-100 ha 10-300 ha 301-1,000 ha 1,001 ha +
14% 14% 18% 36% 19%
Table 9: Survey responses and current production system
Survey Certified Organic Organic but Considering Not considering No interest in
not certified going Organic organic but lessening going organic
non-organic inputs
Horticulture 12.4% 8.1% 8.4% 34.4% 36.8%
Wine (by Ha of
50.0% 10.0% 15.0% NA 25.0%
Respondents)
Dairy 13.2% 6.6% 10.5% 26.3% 43.4%
Beef and Lamb 2.4% 6.0% 73.5% NA 18.1%
FOMA 0.0% 7.14% 71.43% NA 21.43%
Unsurprisingly, certified organic producers or those interested in organic
production responded in greater numbers than the industry average. This,
coupled with the generally low response rates, means that caution should
be applied in extrapolating the results too broadly. More than 50%
Interest high in organic of respondents
The survey does highlight that a lot of producers within the mainstream
farming community have a real interest in organic.
said they were
More than 50% of respondents across each of the four surveys said they either interested
were either interested in gaining full organic certification or transitioning
towards organic. While no FOMA members who responded were certified in gaining
organic, 78% were either self-claimed organic or considering aspects of
organic management or going organic. full organic
Each of the surveys asked participants what their main reasons were for
transitioning or wanting to transition to organic production and to rank them
certification or
from 1 to 5 with 1 being the most frequent response. transitioning
towards organic.
2018 New Zealand Organic Sector Report l 25Table 10: Ranking of main reasons for going organic
Survey It is better It aligns with To obtain It is better for Help meet Reflects Other
for the my/family/ premiums stock/product regulatory an intent
environment business health/quality demands to protect
values human
health
Horticulture 1 2 3 NA 4 5
Wine 1 NA 5 3 4 2
Dairy 2 1 4 3 5
Beef and Lamb 2 1 3 NA 4 5
FOMA 1 2 0 NA 3
“It was better for the environment” was the main motivation from FOMA,
horticulture and wine industry respondents, while alignment with personal/
family/business values was cited as the main motivator for pastoral farmers.
All respondents had the environment and personal values as the primary
driver for change. It was interesting to note that access to price premiums
was of lower importance as was certification to meet regulatory demands for
environmental integrity. Comments in the wine survey detailed a relationship
between organic production methods and wine quality.
Bureaucracy a deterrent
The ranking of constraints to transitioning to organics showed differences
between producers. Bureaucracy, including certification, was ranked as the
most significant constraint by pastoral farmers and was ranked relatively
high by the wine and horticultural producers. Limited market demand for
organic products was ranked by all sectors at a comparatively low level.
Technical constraints were identified as the main deterrent by wine industry
respondents, with weed, pest and disease control commented on as being
especially challenging using organic management. Information and the lack
of access to finance were key issues for FOMA’s members which highlights
the need for culturally appropriate communication and technology transfer
strategies.
Table 11: Ranking of constraints to transitioning to organic
Survey Bureaucracy Finance Returns More work Supply of Not enough Limited Technical
– lack of organic information market constraint,
capital inputs demand eg. pest &
disease
Horticulture 2 1 3 4 5 6
Wine 3 2 6 1
Dairy 1 4 2 3 5 6
Beef and Lamb 1 4 5 2
FOMA 2 3 1 4
Respondents’ reasons for not wanting to move into organic production show
some variation between sectors though a key reason cited is the belief that
organic products are neither superior, nor that organic farming systems, are
more sustainable. Possibly linked with this response, is the belief that their
current farming practices are most suitable for their operation.
26 l 2018 New Zealand Organic Sector ReportA lack of suitable management strategies under organic management was
especially important for organic sheep and beef farmers with risks associated
with animal welfare, weed (gorse, thistles) and internal parasites highlighted
as barriers.
Table 12: Reasons for being not interested in organics
Survey Don’t believe Believe my Think it would be Don’t think there Less management
organic products current farming less profitable will be a lasting options, eg.
are superior or the practices are premium for animal health
system is more the best for my organic products or weed and pest
sustainable operation premiums control
are too low
Horticulture 2 1 3 5 4
Dairy 1 3 4 5 2
Beef and Lamb 2 5 3 4 1
Kelvin and Alex Hicks from Willowmere
Organics in Hororata, Canterbury during
summer shearing of their organic lambs.
2018 New Zealand Organic Sector Report l 27You can also read