ENERGY SECURITY IN IRELAND - 2020 Report - SEAI
←
→
Page content transcription
If your browser does not render page correctly, please read the page content below
ENERGY SECURITY
IN IRELAND
2020 Report
ENERGY SECURITY IN IRELAND                                                                                       2020 Report

ENERGY SECURITY IN IRELAND
2020 Report

September 2020

Report prepared for SEAI by Byrne Ó Cléirigh.

Disclaimer
While every effort has been made to ensure the accuracy of the contents of this report, SEAI accepts no liability whatsoever
to any third party for any loss or damage arising from any interpretation or use of the information contained in this report,
or reliance on any views expressed therein. Public disclosure is authorised. This guide may be reproduced in full or, if
content is extracted, then it should be fully credited to SEAI.

                                                             1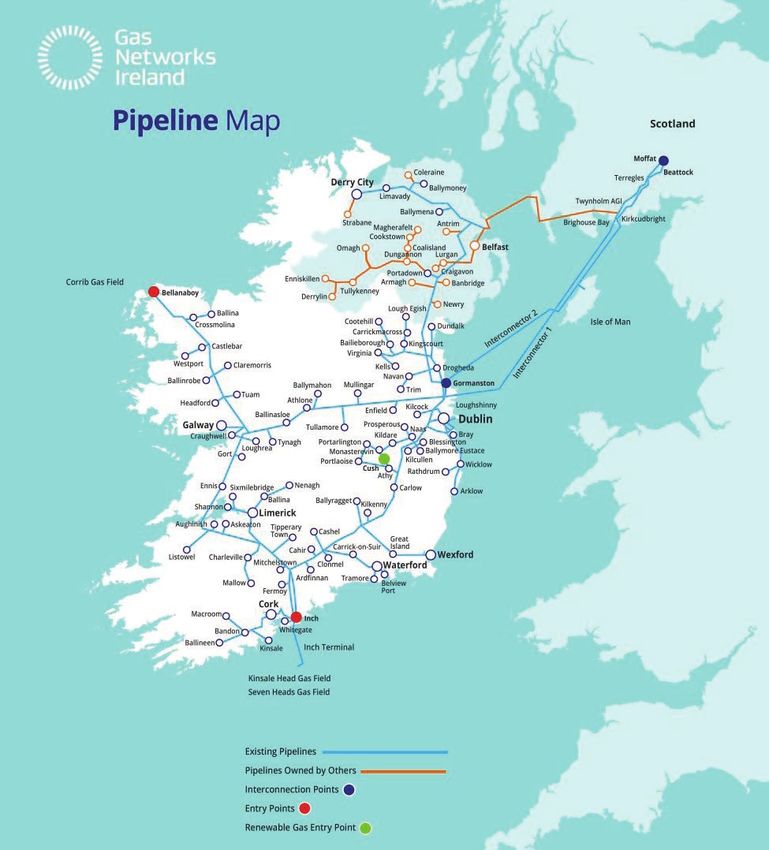
ENERGY SECURITY IN IRELAND                                                                                    2020 Report

The Sustainable Energy Authority of Ireland
The Sustainable Energy Authority of Ireland (SEAI) is Ireland’s national energy authority investing in, and delivering,
appropriate, effective and sustainable solutions to help Ireland’s transition to a clean energy future. We work with
Government, homeowners, businesses and communities to achieve this, through expertise, funding, educational
programmes, policy advice, research and the development of new technologies. SEAI is funded by the Government of
Ireland through the Department of Communications, Climate Action and Environment.

SEAI is the official source of energy data for Ireland. We develop and maintain comprehensive national and sectoral
statistics for energy production, transformation and end-use. These data are a vital input in meeting international
reporting obligations, for advising policymakers and informing investment decisions. SEAI’s core statistics functions are
to:
•   Collect, process and publish energy statistics to support policy analysis and development in line with national needs
    and international obligations;
•   Conduct statistical and economic analyses of energy services sectors and sustainable energy options;
•   Contribute to the development and promulgation of appropriate sustainability indicators.

Acknowledgements
SEAI gratefully acknowledges the cooperation of all the organisations, agencies, energy suppliers and distributors that
provide data and respond to questionnaires throughout the year.
We also gratefully acknowledge those with whom we consulted for this report, including:
•   The Commission for Regulation of Utilities
•   The Department of Communications, Climate Action and Environment
•   Eirgrid
•   Gas Networks Ireland
•   The National Oil Reserves Agency

© Sustainable Energy Authority of Ireland, 2020

Reproduction of the contents is permissible provided the source is acknowledged.

                                                            2
ENERGY SECURITY IN IRELAND                                                                                        2020 Report

   Executive Summary
   Energy security, in its simplest terms, means having uninterrupted access to reliable, affordable supplies of energy.
   Secure supplies of energy are essential for our economy and for maintaining safe and comfortable living conditions.
   Energy security is complex because it comprises many diverse elements. There are also intricate interactions with
   the other two important pillars of energy policy: sustainability and competitiveness. In particular, energy security
   must be considered in the context of global energy consumption’s significant contribution to climate disruption
   and the need to fully align the energy sector with the Paris Agreement.
   Unfortunately, the world is not on track to meet the Paris Agreement goal of limiting the increase in global average
   temperature this century to well below 2.0°C above pre-industrial levels, whilst pursuing efforts to limit the increase
   further to 1.5°C. To do so will require fundamental changes in the global energy system, which currently remains
   heavily dependent on fossil fuels. Because of the level of change required over the coming decades, future energy
   security cannot be evaluated by focussing solely on traditional supply chains and patterns of usage, or by limiting
   the scope of analysis to existing policy and commitments with respect to emissions.
   While the energy transition poses challenges for energy security, it also presents several notable opportunities –
   illustrating the link to both sustainability and competitiveness. For example, both energy efficiency and indigenous
   renewable energy supply can strengthen energy security, while reducing the energy sector’s contribution to
   climate change and reducing Ireland’s bill for imported fossil fuels.

   Import dependency
   Energy import dependency is one of the simplest and most widely used indicators of a country’s energy security,
   with indigenous energy sources generally considered to be more secure than imported energy.
   Ireland’s import dependency was 67% in 2018, down from an average of 89% between 2001 and 2015. This
   improvement was mostly due to the beginning of production of gas from the Corrib field and increasing use
   of indigenous renewable energy. Despite this improvement, Ireland is still one of the most import dependent
   countries in the EU. Oil makes up by far the largest share of energy imports: in 2018, oil accounted for 73% of total
   energy imports, natural gas 17%, coal 8.2% and renewables 1.4%.
   While the overall import dependency figure provides a useful context, a deeper understanding of energy security
   requires more detailed information on individual energy sources. This includes the countries from where each fuel
   is sourced, global market conditions, transportation and other infrastructure requirements. It also requires analysis
   of the current trends in energy use, and of the significant changes that will occur in energy use both nationally and
   globally over the coming years. This report gathers together and summarises data and analysis from a wide range
   of sources into one focused document to provide a basis for understanding these issues.

   Gas
   Natural (fossil) gas accounted for 31% of Ireland’s primary energy requirement in 2018. 61% of the gas came from
   indigenous production (mostly from the Corrib Field), down from 66% in 2017. The remainder was imported via
   an interconnector system with the UK, which itself imports almost half of its gas, via pipeline from European
   neighbours and as liquefied natural gas (LNG) from further afield. The supply from Corrib has already peaked and
   is projected to decline throughout the 2020s. In the short term at least, the deficit between forecast gas demand
   and declining indigenous production will be filled by imports via the UK.
   Gas markets have become progressively more globalised due to the increase in LNG trade and the completion of
   pipeline projects linking producers with new markets. Natural gas met almost half of the world’s energy demand
   growth in 2018, making it the fastest growing energy source globally.
   In the EU, natural gas accounts for approximately one quarter of energy consumption. 88% of this gas is imported
   and gas security remains an important policy priority for the Union. There has been significant investment in
   gas infrastructure in Europe since the 2009 gas dispute between Russia and Ukraine, which disrupted supplies to
   some member states. There have also been several initiatives introduced over this period to help prevent future
   disruptions and to respond more effectively if they occur. Among these were the establishment two security of
   supply standards for assessing the resilience of gas networks in the event of disruptions to key infrastructure: an
   infrastructure standard, incorporating the so-called N-1 criteria, and a supply standard.
   In 2018, Gas Networks Ireland (GNI) and EirGrid examined Ireland’s resilience to a gas disruption using these
   standards. Their work concluded that, at the time, Ireland could only meet 37% of total demand in the event
   of the loss of the entire interconnector system under peak demand conditions (N-1 criteria). However, because

                                                             3
ENERGY SECURITY IN IRELAND 2020 Report
the EU regulation allows countries to meet the N-1 standard on a regional basis, Ireland continued to meet the
requirements when assessed with the UK. In 2018, a project was completed to twin a 50 km section of onshore
pipeline in Scotland that forms part of Ireland’s interconnector system, and complementary work is ongoing
to upgrade an adjacent compressor station. As well as strengthening gas security, these upgrades facilitate the
splitting of the interconnectors into separate systems for the purposes of the infrastructure standard. GNI and
EirGrid calculated that the N-1 position would improve as a result of these upgrades. They also found that Ireland
met the gas supply standard, which requires countries to meet the needs of protected customers (including
homes) for 30 days, in the case of a similar infrastructure disruption under average winter conditions.
While gas will continue to be required in Ireland’s electricity generation and heat sectors out to 2030, the future
for gas beyond 2030 is less certain. There may be enduring roles for fossil gas with carbon capture and storage,
and for green gases such as biomethane or green hydrogen, but the nature and extent of these roles needs further
consideration in the context of a net-zero 2050 ambition.
In 2019 the Minister for Communications, Climate Action and Environment announced that the Department would
carry out a review of the security and sustainability of Ireland’s electricity and natural gas systems, which will focus
on the period to 2030, in the context of achieving carbon neutrality by 2050. This SEAI report provides up to date
data and information which can be used as an input to this review.
Oil
Oil accounted for 49% of Ireland’s primary energy requirement in 2018, one of the highest rates of oil dependency
in the EU. 71% of oil is used for transport. There is also significant oil use in residential heating and in the industrial
sector, and it plays an important role as a secondary fuel for gas-fired electricity generation.
International crude oil markets are currently well supplied, and many major producers are operating below
maximum capacity. Global oil supply has become more diverse and less dependent on regions of political
instability. Oil price is a key factor for dictating market share for different producers, with Organizsation of the
Petroleum Exporting Countries (OPEC) and Russian producers typically requiring higher prices to break even than
many US producers do. In Europe, production has been declining since the late 1990s in almost all oil-producing
countries, particularly Norway and the UK, which are the region’s biggest producers.
Apart from a small amount of indigenous biofuel production, Ireland imports all of its oil. The likelihood of a new
indigenous supply of crude oil is low given the low levels of recent offshore drilling activity, low oil prices and
Ireland’s policy position that there will be no future licensing for offshore oil exploration.
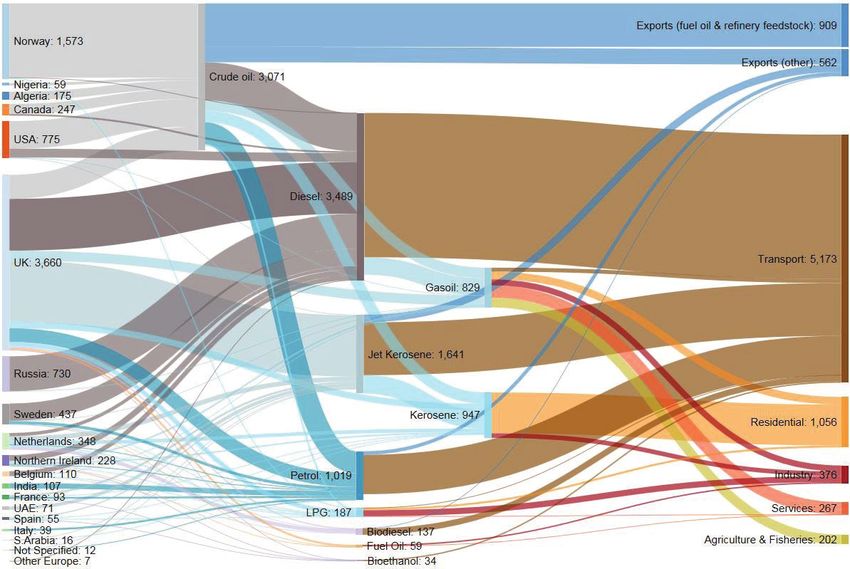
Ireland’s only oil refinery, located at Whitegate, Co. Cork, processes crude oil from diverse sources, which reflects
the global nature of the international crude oil market. The refinery’s output is equivalent to 30-40% of Ireland’s
demand. The remainder of the country’s demand is met from imports of refined products, 64% of which came
from the UK in 2018. The refining sector throughout Europe is experiencing significant competition from operators
in developing regions, which could increase European dependence on refined product from further afield.
Because of the near total dependence of Ireland’s transport sector on oil-based products, oil will likely remain the
dominant fuel in this sector for the next decade, although an increasing proportion of petrol and diesel will be
displaced by biofuels and electrification over this period. Energy efficiency, electrification and biomass have the
potential to reduce Ireland’s dependence on oil for heat.
Electricity
In 2018, 52% of electricity generated was from gas, wind had the second largest contribution at 28%, with other
renewables at 5%. Coal fell to 7% from 16% in 2016, principally because of technical problems at Moneypoint
power station.
While Ireland currently has significant surplus power generation capacity, EirGrid anticipates that there will be a
need for additional generation capacity from 2026. SEAI’s latest national energy projections anticipate electricity
demand to increase over the period to 2030. The most significant technological driver for the anticipated demand
increase is the expected growth of data centres, which can have demand levels comparable to those of large
towns.
The Climate Action Plan 2019 established an ambitious framework for growth in renewable electricity, with a 70%
target for renewables for 2030. Most additional renewable generation capacity over this period is expected to
come from wind (onshore and offshore) and solar. It is likely that all non-renewable electricity generation by 2030
will be from gas. While 2030 will be an important milestone, it will also be a critical step on a pathway to achieving
a fully decarbonised electricity network in the following decades. It is not yet clear how this will be achieved.
4
ENERGY SECURITY IN IRELAND                                                                                    2020 Report

   Supply/demand index
   The supply/demand index is an indicator of the medium-to-long-term energy security of the whole energy system.
   The supply/demand index for Ireland shows an overall increase in energy security over the period 2005-2018.
   Looking to 2030, further significant displacement of imported oil and gas with energy efficiency and indigenous
   renewable supplies would increase Ireland’s future energy security score. Despite this, because oil and gas account
   for 80% of primary energy and because Ireland is likely to become more reliant on non-EU oil and gas as EU supplies
   decline, it is likely that the index score will decrease over the next decade.
   The index, and other indicators of energy security, must be considered in the context of the parallel goals of
   sustainability and competitiveness.

   Impact of Brexit
   There is a risk that Brexit could lead to a divergence in energy policy and regulation between the UK and Ireland
   over time. Brexit has also had some immediate impacts on the energy relationship between the two countries.
   Both will have repercussions for Ireland’s energy security, although the full extent of these may not be fully
   understood for some time.

   Impact of COVID-19 pandemic
   This report was substantially completed in early 2020, before the World Health Organisation’s declaration of a
   pandemic and before COVID-19 had a significant impact beyond China. Almost all the statistical data in the report
   is for the period up to 2018, as this is the most up-to-date data available at the time of writing.
   At the time of publication (September 2020), the global health crisis arising from the pandemic is ongoing. It is
   having a profound impact on economic activity and energy demand throughout the world. The future course of
   the pandemic remains very uncertain and its longer-term implications for energy demand and energy security are
   yet to be determined.

                                                           5
ENERGY SECURITY IN IRELAND 2020 Report
Table of Contents
Highlights 3
1 INTRODUCTION 11
1.1 Objective of this report 11
1.2 Energy security concepts 11
1.3 Energy security and the energy transition 12
1.4 Projections for future supply and demand 13
1.5 Additional information 13
1.6 Impact of the COVID-19 pandemic 14
2 OVERVIEW OF ENERGY DEMAND, SUPPLY, AND IMPORT DEPENDENCY 15
2.1 Ireland’s import dependency 15
2.2 Provenance of Ireland’s energy 16
2.2.1 Indigenous production 16
2.2.2 Energy imports 18
2.2.3 Energy import costs 19
2.3 Meeting Ireland’s energy demand 19
2.3.1 Demand 19
2.3.2 Future demand 21
2.3.3 Supply 22
2.4 Impact of Brexit on energy security 23
3 FOSSIL AND RENEWABLE GAS 24
3.1 Gas demand 24
3.1.1 Historical demand 24
3.1.2 Future demand 25
3.2 Gas supply 27
3.2.1 International developments 27
3.2.1.1 Global demand 27
3.2.1.2 Global supply 27
3.2.2 International gas prices 28
3.2.3 Ireland’s gas supply 28
3.2.4 UK's gas supply 29
3.2.5 Oil and gas exploration 31
3.2.5.1 Offshore exploration 31
3.2.5.2 Onshore exploration 33
3.2.6 Renewable gas 33
3.2.7 Hydrogen 34
3.3 EU gas security 34
3.3.1 Policy and regulation 34
3.3.2 EU gas infrastructure 34
3.4 Gas infrastructure 35
3.4.1 Ireland’s gas network 35
3.4.2 Interconnection with the UK 36
3.4.3 Natural gas storage 37
3.4.4 Liquefied natural gas (LNG) 37
3.4.5 Security of Ireland’s gas network 37
3.5 Outlook for gas security 38
3.5.1 Demand moderation 38
3.5.2 GNI and EirGrid’s Long Term Resilience Study 38
3.5.3 Areas for further analysis 39
3.5.4 DCCAE review of security of energy supply 39
3.6 Emergency planning 39
6ENERGY SECURITY IN IRELAND 2020 Report
3.6.1 Obligations under EU Regulation 2017/1938 39
3.6.2 Solidarity and regional co-operation 39
3.6.3 Gas Electricity Emergency Planning Group 39
3.6.4 Natural Gas Emergency Plan 40
3.6.5 Inter-operator co-operation 40
3.7 Impact of Brexit on gas security 40
4 OIL, OIL PRODUCTS AND BLENDED BIOFUELS 41
4.1 Oil demand 41
4.1.1 Historical demand 41
4.1.2 Future demand 42
4.2 Oil supply 44
4.2.1 International developments 44
4.2.1.1 Global demand 44
4.2.1.2 Global supply 44
4.2.2 International oil prices 47
4.2.3 Ireland’s oil supply 48
4.2.3.1 Crude oil imports and indigenous refining output 48
4.2.3.2 Refined oil product imports 49
4.2.4 Liquid biofuels 50
4.2.4.1 Biofuel Obligation Scheme 50
4.2.4.2 Sources of Ireland’s biofuel supply 51
4.2.4.3 Outlook for biofuels 52
4.2.5 UK oil market 53
4.3 Oil infrastructure 54
4.3.1 Refining 54
4.3.2 Terminals and storage 54
4.4 Emergency response 55
4.4.1 IEA and EU co-operation 55
4.4.2 Oil market disruptions 55
4.4.3 National oil reserves 56
4.4.4 Responding to an oil supply disruption 57
4.5 Impact of Brexit on oil security 57
5 ELECTRICITY 58
5.1 Electricity demand 58
5.1.1 Historical demand 58
5.1.2 Future demand 58
5.2 Electricity supply 60
5.2.1 Electricity generation 60
5.2.2 Electricity from gas 61
5.2.3 Electricity from renewables 61
5.2.4 Electricity from coal, peat and oil 62
5.2.5 Electricity imports and exports 63
5.2.6 Outlook for electricity generation 63
5.3 Electricity prices 64
5.4 Electricity infrastructure 64
5.4.1 Generation adequacy 64
5.4.2 Transmission and distribution 65
5.4.2.1 Existing networks 65
5.4.2.2 Grid development strategy 66
5.4.2.3 Integrating large amounts of renewable electricity 67
5.4.2.4 Connecting to the network 68
5.4.2.5 Smarter networks 68
5.4.2.6 Interconnection 69
5.4.2.7 Electricity storage 70
7ENERGY SECURITY IN IRELAND 2020 Report
5.4.3 Cyber security 70
5.5 Emergency planning 71
5.5.1 EU member state cooperation 71
5.5.2 Role of the CRU 71
5.6 Impact of Brexit on electricity security 71
6 COAL, PEAT AND SOLID FUELS 73
6.1 Coal 73
6.2 Peat 74
6.3 Solid biomass and wastes 75
6.3.1 Solid biomass 75
6.3.2 Non-renewable wastes 75
6.3.3 Outlook for solid biomass and wastes 76
6.3.3.1 Solid biomass 76
6.3.3.2 Waste 77
7 ENERGY SECURITY SCORE 78
7.1 Supply/demand index 78
7.2 Supply/demand index method 78
7.3 Energy security score 2005-2018 80
7.3.1 Overall score 80
7.3.2 Primary energy supply 80
7.3.3 Conversion and transport 81
7.3.4 Demand 83
7.3.5 Overall score 83
ABBREVIATIONS 85
GLOSSARY OF TERMS 86
References 87
APPENDIX 1: EU Gas Security 91
8ENERGY SECURITY IN IRELAND 2020 Report
Table of Figures
Figure 1: Three pillars of energy policy 11
Figure 2: Energy flows in Ireland 2018 15
Figure 3: Import dependency of Ireland and the EU 1990-2019 16
Figure 4: Import dependency of Ireland and EU member states 2018 16
Figure 5: Contribution of indigenous energy sources 1990-2018 17
Figure 6: Indigenous energy sources by fuel 1990-2018 18
Figure 7: Energy imports by fuel 1990-2018 18
Figure 8: Cost of imported energy by fuel 2018 19
Figure 9: Final consumption by fuel 2000-2018 20
Figure 10: Final consumption by sector 2018 20
Figure 11: Index of modified domestic demand and final consumption by sector 2000-2018 21
Figure 12: Historical and projected final energy demand 2000-2030 22
Figure 13: Index of final consumption and primary energy supply 2000-2018 22
Figure 14: Natural gas energy flows in Ireland 2018 24
Figure 15: Gas primary energy demand by end-use 2005-2018 25
Figure 16: Historical and projected primary energy demand for gas 2005-2030 25
Figure 17: Primary energy demand for gas in 2018 and 2030 26
Figure 18: UK national balancing point gas price 2010-2020 28
Figure 19: Historical and projected indigenous natural gas production 2005-2027 29
Figure 20: UK natural gas production and imports 1998-2018 30
Figure 21: UK natural gas exports 2000-2018 30
Figure 22: Breakdown of Ireland’s natural gas supply 2018 (incorporating simple pro rata of UK gas supplies) 31
Figure 23: Number of licences 2007-2019 32
Figure 24: Wells spudded and drilled in Ireland for exploration 2005-2019 32
Figure 25: Ireland’s gas network 36
Figure 26: Oil energy flows in Ireland 2018 41
Figure 27: Final consumption of oil and biofuels 2005-2018 41
Figure 28: Transport final energy demand by fuel type 2005-2018 42
Figure 29: Historical and projected final consumption of oil and blended biofuels 2005-2030 43
Figure 30: Final consumption of oil and blended biofuels in 2018 and 2030 43
Figure 31: European oil production and oil import dependency 45
Figure 32: US oil supply/demand balance and US share of global crude market 2005-2021 45
Figure 33: OPEC and non-OPEC shares of global oil production 46
Figure 34: OPEC and non-OPEC supply disruptions 46
Figure 35: Price of crude oil in Europe (Dated Brent) 2005-2020 47
Figure 36: Oil energy flows in Ireland 2018 (ktoe) 48
Figure 37: Crude oil imports 2005-2018 49
Figure 38: Whitegate refinery production 2017 49
Figure 39: Oil product imports 2005-2019 50
Figure 40: Biofuel placed on the market 2010-2018 50
Figure 41: Biofuel feedstocks 2012-2018 51
Figure 42: Sources of Ireland’s biofuel feedstocks 2018 52
Figure 43: Sources of UK crude oil 2018 53
Figure 44: UK oil product imports 2018 54
Figure 45: Major oil supply disruptions 1950-2019 55
Figure 46: NORA stock holding requirement 2008-2018 56
Figure 47: NORA oil stocks 2006-2019 57
Figure 48: Final consumption of electricity by sector 2005-2018 58
Figure 49: Historical and projected final consumption of electricity 2005-2030 59
Figure 50: Final consumption of electricity in 2018 and 2030 59
Figure 51: Projected electricity consumption by data centres 2018-2029 60
Figure 52: Flow of energy in electricity generation 2018 61
9ENERGY SECURITY IN IRELAND 2020 Report
Figure 53: Renewable energy contribution to gross electricity consumption by source 2005-2018 62
Figure 54: Electricity transmission system 66
Figure 55: CRU’s security of supply monitoring framework 71
Figure 56: Coal use 2005-2018 73
Figure 57: Coal imports by country of origin 2017 74
Figure 58: Peat use 2005-2018 74
Figure 59: Biomass use 2005-2018 75
Figure 60: Non-renewable waste use 2005-2018 76
Figure 61: Supply/demand index weighting and scoring structure 79
Figure 62: Supply/demand index score 2005-2018 80
Figure 63: Supply/demand index primary energy supply score 2005-2018 (max = 49) 81
Figure 64: Supply/demand index conversion and transport score 2005-2018 (max = 21) 82
Figure 65: Supply/demand index demand score 2005-2018 (max score = 30) 83
Figure 66: Supply/demand index score breakdown 2005-2018 84
10ENERGY SECURITY IN IRELAND 2020 Report
1 INTRODUCTION
1.1 Objective of this report
This report is the sixth in a series reviewing energy security in Ireland. It provides a comprehensive overview of the wide
range of issues relevant to energy security in order to inform a better understanding of energy security and the complex
interactions between it and the other pillars of energy policy, that is, sustainability and competitiveness. It is intended to
inform debate and provide context and information to the policy community, energy market participants, investors and
the public.
Figure 1: Three pillars of energy policy
Sustainability
Competitiveness Security
This report considers the issue of energy security holistically. The metrics and indicators presented in this report address
a wide range of issues relevant to the topic of energy security. They span a range of national and international concerns,
including the linkage between energy security and global energy consumption’s significant contribution to climate
disruption. The complexity of this area of energy policy does not allow for simple analysis or solutions.
For the most part, the report provides a review of data and publications relevant to energy security that are already in
the public domain, rather than presenting the results of new analysis1. By aggregating, organising, and summarising what
is sometimes rather eclectic public data into one focused document, the report is designed to provide the reader with
an accessible overview of the topic. The report is heavily referenced to allow the reader to delve deeper into areas of
particular interest.
In 2019, the Minister for Communications, Climate Action and Environment announced that the Department would carry
out a major review of the security and sustainability of Ireland’s energy supply, in the context of the 2030 targets for 70%
renewable electricity and the broader decarbonisation pathway to 2050 [1]. This report has been prepared and published
in advance of the Department review and may be used as an input to it.
1.2 Energy security concepts
At a high level, the importance of energy security is well understood: secure supplies of energy are essential for all
economic activity, for the effective delivery of public services, and for maintaining safe, sustainable, and comfortable
living conditions. However, energy security as a concept is relatively complex because it comprises many diverse elements
relating to import dependency, fuel diversity, the capacity and integrity of the supply and distribution infrastructure,
energy prices, physical risks, physical disruptions, emergencies and the long-term sustainability of the energy system.
Energy security is described by the International Energy Agency (IEA) as ‘the uninterrupted availability of energy sources
at an affordable price’ [2]. As a concept, it incorporates both a short-term focus on the resilience and flexibility of energy
1 An exception is the update of supply/demand analysis contained in section 7, which is original analysis carried out for this report.
11ENERGY SECURITY IN IRELAND 2020 Report
systems and long-term goals relating to the policy, decisions and investments required to balance energy supply with
economic development and environmental drivers.
A broad interpretation of energy security is used in this report.
Different factors related to the availability of energy supply and trends in energy demand present both risks and
opportunities for energy security. On the demand side, the key variables are economic growth, the energy intensity of
economic activity, price and demand moderation driven by sustainability objectives. Both energy efficiency and demand
moderation present significant opportunities to strengthen energy security.
On the supply side, key variables include physical infrastructure (for example, interconnectors, national transmission
and distribution networks, oil terminals, port infrastructure, dispatchable electricity generators, renewable energy
installations), the availability of indigenous resources (including social acceptance of extraction or infrastructure), and the
robustness of global fuel supply chains (for example, to geopolitical or weather events).
Traditionally, much of the analysis of supply-side factors focuses on risks to physical energy availability. Supply-side risks
include:
• Natural disasters and extreme weather events, including those caused by climate disruption, for example, the
Japanese earthquake that led to the nuclear reactor meltdowns at Fukushima Daiichi (2011), Hurricane Katrina (2005),
Storm Emma (2018) and, insufficient cooling capacity from rivers for some nuclear plants in Europe during the summer
of 2018.
• Civil and regional conflicts, for example, recent conflicts in Libya, Syria, Ukraine, Yemen, and Iraq.
• Geopolitical tensions, for example, trade sanctions against Russia and Iran.
• Political change and uncertainty, e.g. Brexit.
• Major accidents, for example, Buncefield fire (2005), Deepwater Horizon oil spill (2010).
• Cyber threats, for example, the 2015 cyber-attack on the Ukrainian electricity network and the 2019 ransom-ware
attack on a South African electricity supplier.
• Infrastructure capacity constraints, for example, the ability to cope with sudden surges in demand.
• Investment uncertainty, for example, regulatory and, or, policy uncertainty.
• Resource variability, for example, variation in average wind speeds.
• Civil and labour disputes.
The development of indigenous, distributed renewable energy sources mitigates many of the risks associated with relying
on global supply chains and large single pieces of infrastructure, and reduces the exposure to fossil fuel price shocks.
Although the risks to physical energy availability are often associated with energy supply, they can also impact on demand
if the access, or perceived access, to energy sources is interrupted. Regulatory and policy frameworks also have impacts.
Ireland’s National Risk Assessment, which is prepared annually by Government to assist departments and agencies in
developing mitigating actions, highlights how ‘in terms of energy-related risks, disruptions to the supply or price of oil, gas, or
electricity could have significant economic, social or competitive impacts, and our geographic position renders us particularly
vulnerable to such disruptions’ [3].
Most identifiable risks can be mitigated to some extent, although the costs of doing so can be prohibitive for some risks,
especially those related to catastrophic events. All risks to the energy supply/demand balance ultimately impact on price.
Price, in turn, affects demand and impacts on the investment climate.
1.3 Energy security and the energy transition
Energy security cannot be considered in isolation from the other two pillars of energy policy, that is, sustainability and
competitiveness. Energy security, in particular, must be viewed in the context of the climate crisis and the need to fully
align the energy sector with the Paris Agreement goals of 1.5°C and 2.0°C limits on global temperature rise.
Unfortunately, the world is not on track to meet these limits. The UN’s Emissions Gap Report 2019 highlighted that if
all countries’ unconditional commitments to greenhouse gas reductions are implemented2, the world would still be on
course for a 3.2°C temperature rise [4]. The report found that countries would need to triple the ambition of their current
pledges to achieve the 2.0°C goal and to increase their ambition fivefold to achieve the 1.5°C goal – identifying a target
reduction of 7.6% per annum for the period 2020 to 2030.
2 These commitments are referred to as nationally determined contributions.
12ENERGY SECURITY IN IRELAND 2020 Report
More ambitious action to achieve these goals will require significant changes throughout the world’s energy systems.
However, the pace of transition is slow. The assessment of the IEA is that ‘the momentum behind clean energy transitions
is not enough to offset the effects of an expanding global economy and growing population’ [5]. The IEA’s stated energy
policy scenario for future energy demand, which is based on policies that are either already in place or have already been
announced does ‘not see a peak in global energy-related CO2 emissions by 2040 – obviously far from the early peak and rapid
subsequent decline in emissions targeted by the Paris Agreement’. The projections for this scenario ‘imply a 50% probability
of a 2.7°C stabilisation (or a 66% chance of limiting warming to 3.2°C) – not nearly enough to avoid severe effects from climate
change’ [5]. The European Green Deal, introduced in late 2019, is a roadmap incorporating proposed EU-wide emissions
reductions that are more ambitious than those currently targeted3 – up to a 50-55% reduction compared to 1990 levels [6].
This requirement for comprehensive and rapid change to the energy system is a crucial consideration when analysing
energy security. Future energy security cannot be evaluated by focussing solely on traditional supply chains and patterns
of usage, or by limiting the scope of analysis to existing policy and commitments with respect to emissions. All aspects of
energy security must be examined in the context of the level of change required to avoid catastrophic climate disruption.
This is especially true for energy security over the longer term. While many of the changes required to Ireland’s energy
system throughout the 2020s have been identified in Climate Action Plan 2019 [7] – albeit with the need to enhance
or accelerate them to rise to the level of ambition proposed for the European Green Deal – the pathway for deeper
decarbonisation beyond 2030 is less defined. For example, the role that gas (fossil or renewable) will play in electricity
generation out to 2050 remains to be determined. This uncertainty has implications for investment decisions, especially
for infrastructure that has a long lead time and, or, payback period.
1.4 Projections for future supply and demand
In seeking to assess future energy security, this report refers to different projections of future energy supply and demand.
The different projections were prepared by different organisations for different purposes. All projections are scenarios
that incorporate many assumptions.
SEAI prepares the annual National Energy Projections for Ireland [8] in collaboration with the Economic and Social Research
Institute (ESRI). These projections for energy supply and demand in Ireland are used to inform the debate on future energy
trends and to assist the Government in measuring progress towards targets and taking corrective measures, where
necessary. They are also used by the Environmental Protection Agency (EPA) to inform Ireland’s greenhouse gas emissions
projections [9]. They are underpinned by an understanding of relationships between energy use, economic growth,
energy prices, and energy policies. These relationships provide the basis for projecting how energy use may develop into
the future. This report presents a higher and lower SEAI projection for future demand. SEAI’s higher projection assumes
lower fossil fuel prices (which lead to higher energy demand) and that the Climate Action Plan will not be implemented in
full. As such, it is a worst-case scenario used for comparison and is not considered likely, or desirable. The lower projection
is based on higher fossil fuel prices (which tend to reduce demand) and on the successful implementation of the ambitious
policies and measures contained in the Climate Action Plan to improve energy efficiency and increase renewable energy
use. From a sustainability perspective, it is essential that future energy demand follows the lower projection. This will also
improve energy security and competitiveness.
This report also references projections from EirGrid and Gas Networks Ireland (GNI), which are prepared in fulfilment of
these organisations’ remits.
In examining the global outlook for oil and gas, this report also refers to different projections by the IEA. Its stated energy
policies scenario reflects current policy positions and is the central scenario discussed in some of its key publications, but it
is not consistent with achieving the Paris goals. On the other hand, its sustainable development scenario ‘charts a pathway
for the global energy sector fully aligned with the Paris Agreement’ [5]. The world is not yet on track to meet this scenario.
1.5 Additional information
The energy data drawn from the national energy balance presented in this report is the most up-to-date data available
at the time of writing. The energy balance is updated whenever more accurate information is known. The most up-to-
date energy balance is available from the ‘Energy Statistics in Ireland’ section of SEAI's website at www.seai.ie/data-and-
insights/seai-statistics/.
It should be noted that while SEAI reports on energy metrics and indicators of energy security, the statutory authority for
ensuring energy security lies elsewhere. The Commission for Regulation of Utilities (CRU) has the statutory obligation to
ensure electricity and gas energy security in Ireland and Department of Communications, Climate Action and Environment
(DCCAE) and the National Oil Reserves Agency (NORA) are responsible for oil security and oil stocks respectively. These
organisations, along with EirGrid and GNI, publish many useful documents that provide a thorough overview of energy
3 The current EU emission reduction target is at least a 40% reduction in EU-wide emissions by 2030, compared to 1990.
13ENERGY SECURITY IN IRELAND 2020 Report
security in Ireland. These are referenced extensively throughout this report and are included in a comprehensive list of
references towards the end of the document.
Feedback and comment on this report are welcome and should be sent to epssu@seai.ie.
1.6 Impact of the COVID-19 pandemic
This report was substantially completed in early 2020, prior to the World Health Organisation’s declaration of a pandemic
and before COVID-19 had a significant impact beyond China. Almost all the statistical data in the report is for the period
up to 2018, as this is the most up-to-date data available at the time of writing.
At the time of publication (August 2020), the global health crisis arising from the pandemic is ongoing.
The pandemic is having a profound impact on economies throughout the world, with repercussions for energy demand.
In the first half of 2020, the confinement measures and restrictions on economic activities introduced in many countries
resulted in sharp decreases in energy demand. For example, global road transport activity had fallen by 50% below
2019 levels by the end of March 2020 and air travel in some European countries had declined by 90% [10]. In Ireland, the
combined demand for petrol and diesel in April 2020 (in litres) was 41% of that in April 2019 [11]. In many countries that
implemented comprehensive lockdown measures electricity demand dropped by 20% or more and weekday electricity
consumption patterns resembled those typically experienced on Sundays [10]. In Ireland, the morning peak in electricity
demand had fallen by 200 MW by the last week in March [12].
The future course of the pandemic remains very uncertain. As a result, although COVID-19 continues to have severe impacts
on economic activity, the longer-term implications for energy demand and energy security are yet to be determined. In
mid-2020, the IEA estimated that annual global energy demand could decrease by 6% in 2020, which would be the largest
percentage reduction in 70 years and more than seven times larger than the impact of the 2008 financial crisis [10].
The durations of these impacts are likely to vary between sectors. Some of the most dramatic impacts on energy markets
appear to have been relatively short-lived. For example, the price of West Texas Intermediate, the benchmark price for US
crude oil, had dropped from over US$60 per barrel at the end of 2019 to trade at below zero in late April 2020, because
of a scarcity of storage capacity and a collapse in demand. However, by June 2020 the price had recovered to trade at
approximately US$40 per barrel. In the case of electricity, demand has been recovering gradually as lockdown restrictions
are being lifted in different countries. It is also noteworthy that the proportion of electricity sourced from renewables in the
EU and elsewhere increased during lockdown periods because of lower operating costs and priority access to electricity
networks. While the dramatic reductions in global demand are expected to reduce energy-related CO2 emissions for 2020,
the IEA has cautioned that ‘as after previous crises…the rebound in emissions may be larger than the decline, unless the
wave of investment to restart the economy is dedicated to cleaner and more resilient energy infrastructure’ [10].
Other aspects of demand will take longer to recover. For example, demand for jet fuel is likely to be constrained for a more
prolonged period given the impacts of the pandemic on activity in the aviation sector.
The economic shock arising from COVID-19 will also affect energy sector investment. The IEA anticipates that global energy
investment could fall by one fifth in 2020 because of disruptions caused by economic restrictions, dramatic reductions
in revenues and overcapacity in some markets. The oil and gas sectors are likely to be the most severely impacted, with
utility-scale renewable electricity being more resilient [13]. However, post-pandemic stimulus packages may provide
opportunities to promote economic recovery while also tackling energy and climate objectives.
The pandemic has emphasised the importance of secure energy supplies to the functioning of essential services, especially
the dependence of health systems on reliable electricity supplies. In developed countries, robust electricity networks
have accommodated increased demand for health services and facilitated the rapid expansion of remote working. In
contrast, many health facilities in Africa have no access to electricity, and electricity reliability problems in Africa and South
Asia limit the extent to which social distancing can be practiced [10].
14ENERGY SECURITY IN IRELAND 2020 Report
2 OVERVIEW OF ENERGY DEMAND, SUPPLY, AND
IMPORT DEPENDENCY
2.1 Ireland’s import dependency
A basic and long-standing rule of thumb in examining energy security is that indigenous energy sources are considered
to be more secure than energy that is imported. In reality, every supply chain needs to be considered on its own merits;
energy imports can be based on stable secure global markets and indigenous sources can be exposed to a variety of
sources of insecurity. Nevertheless, energy import dependency remains one of the simplest and most widely used
indicators of a country’s energy security.
Ireland is not endowed with significant indigenous fossil fuel resources. As a result, the country has maintained a very
high energy import dependency since 1990, even though indigenous renewable resources are playing an increasingly
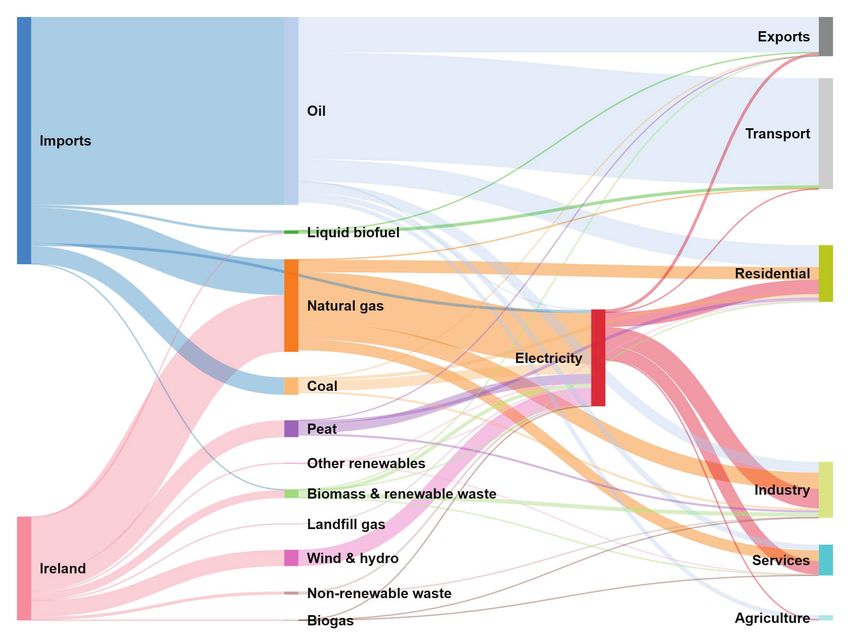
important and growing role in the energy mix. Figure 2 shows the split between Ireland’s indigenous and imported energy
as a flow diagram. This provides a useful overview of the energy security landscape, clearly illustrating the significance of
each fuel type and end-use segment. There are two key points: the high dependency on imports and the dominant role
that oil occupies as a fuel of choice, especially in the transport sector.
Figure 2: Energy flows in Ireland 20184
Source: SEAI
Ireland’s import dependency was 67% in 2018. Figure 3 shows how this dependency has changed over time and how it
compares with that of the EU. Imports grew from 70% of energy requirements in 1990 to between 85-91% throughout
the 1999-2015 period, peaking at 91% in 2006 and then dropping dramatically in 2016. There are two main reasons for
this pattern. The first is the increase in energy use across all sectors (particularly transport) from the 1990s through to the
economic crisis in 2008, followed by a decrease over the period to 2012 and a subsequent resumption of growth since
then. The second reason is the fluctuating contribution from indigenous sources over the period, especially from natural
gas.
4 Energy transformation, transmission and distribution losses are not shown in this diagram. This is why, for example, there is much more energy shown
entering the electricity node than leaving it.
15ENERGY SECURITY IN IRELAND 2020 Report
Figure 3: Import dependency of Ireland and the EU 1990-2019
100%
90%
80%
70%
Import dependency
60%
50%
40%
30%
20%
10%
0%
Ireland EU
Source: SEAI & Eurostat
Although the import dependency shown for the EU in 2018 is 56%, there is significant variation between individual
member states. This is shown in Figure 4.
Among the less import-dependent countries, some have clear comparative advantages arising from abundant indigenous
resources of fossil fuels (for example, UK, Denmark, Romania) or hydro (for example, Sweden, France). Others have a
history of using biomass for heat (for example, Finland) and others still have pursued ambitious policies to exploit other
renewable resources (for example, Denmark) or nuclear energy (for example, France). The two least import-dependent
countries (Estonia and Denmark) both export significant amounts of energy, which reduces their import dependency.
Figure 4: Import dependency of Ireland and EU member states 2018
120%
100%
Import Dependency
80%
60%
40%
20%
0%
Source: Eurostat
2.2 Provenance of Ireland’s energy
2.2.1 Indigenous production
Figure 5 shows the contribution of Ireland’s indigenous energy production to the overall energy requirement over the
period 1990–2018. Figure 6 provides a breakdown of the indigenous production by fuel.
16ENERGY SECURITY IN IRELAND 2020 Report
Figure 5: Contribution of indigenous energy sources 1990-2018
18
16
14
12
10
Mtoe
8
6
4
2
0
1990 1992 1994 1996 1998 2000 2002 2004 2006 2008 2010 2012 2014 2016 2018
Indigenous fossil Indigenous renewables Net imports
Source: SEAI
The most significant changes in indigenous energy production have resulted from changes in natural gas production:
production at Kinsale peaked in 1995 and declined sharply thereafter, while production at Corrib began in 2015 before
ramping up significantly in 2016. By 2018, indigenous natural gas production accounted for 55% of total indigenous
production and 19% of Ireland’s energy requirement.
Peat production has been on a generally declining trend over the same period. However, production is weather
dependent, which leads to spikes in drier years, when excess production is stockpiled, and troughs in wetter years. 2012
had a particularly wet summer and was a record low year for peat production at just 321 thousand tonnes of oil equivalent
(ktoe), with 471 ktoe of peat being used from stockpiles to meet demand. 2013, however, had good conditions for peat
harvesting with 1,327 ktoe of peat was produced (in part to replenish stockpiles), the highest since the earlier spike in
1995. In 2018, peat production was 16% of total indigenous production and 5.5% of the total energy requirement. Peat’s
contribution to the electricity generation mix in 2018 was 10%. Two of Ireland’s three peat-fired generating stations will
cease generation by the end of 2020 [14], while the current planning permission for the third will expire in 2023.
The growth of renewable energy, coming from a low base prior to 2004, has counteracted this reduction in peat production.
In the intervening period, renewable energy production increased 361% or 12% per annum. In 2018, renewable energy
production accounted for 26% of total indigenous energy production and 9% of the total energy requirement. Increasing
the deployment of renewables is part of the strategy to improve energy security for Ireland.
Non-renewable wastes accounted for the remaining 2.9% of indigenous production in 2018 (1.0% of total energy
requirement).
17ENERGY SECURITY IN IRELAND 2020 Report
Figure 6: Indigenous energy sources by fuel 1990-2018
6
5
4
Mtoe
3
2
1
0
1990 1992 1994 1996 1998 2000 2002 2004 2006 2008 2010 2012 2014 2016 2018
Natural Gas Peat Renewables Non-renewable Wastes Coal
Source: SEAI
2.2.2 Energy imports
Figure 7 shows the trend for net fuel imports (imports minus exports) over the period 1990–2018. Imports peaked in 2008
before trending downwards by 23% in the following years. In 2018, energy imports were 33% below the 2008 peak.
The dominance of imported oil is clear. In 2018, oil accounted for 73% of total imports, natural gas 17%, coal 8.2% and
renewables 1.4%.
Oil and coal imports match the profile of demand for these fuels, given that there is no indigenous production. Oil imports
have grown rapidly from the mid-nineties, driven largely by transport demand, reaching a peak in 2005. Coal imports have
declined gradually because of fuel switching in electricity generation and residential heating.
Gas imports show the most dramatic changes over the period. These have been caused by demand growth, which is
largely due to increased usage of gas for power generation, and by the changes in production levels at Kinsale and Corrib.
Renewable imports comprise both liquid biofuels and solid biomass. Electricity imports and exports are via interconnection
with the UK. After being a net importer of electricity for fourteen consecutive years, Ireland has been a net exporter of
electricity since 2016.
Figure 7: Energy imports by fuel 1990-2018
16
14
12
10
Mtoe
8
6
4
2
0
1990 1992 1994 1996 1998 2000 2002 2004 2006 2008 2010 2012 2014 2016 2018
Oil Gas Renewables Coal Electricity
Source: SEAI
18ENERGY SECURITY IN IRELAND 2020 Report
2.2.3 Energy import costs
SEAI estimates that the total cost of Ireland’s energy imports in 2018 was €5.0 billion. Figure 8 provides a breakdown of
this estimate by fuel type. Unsurprisingly, oil imports dominate the energy import bill, accounting for an estimated €4.3
billion, or 87% of the total. This is because of the large proportion of oil imported in energy terms, as seen in Figure 2 and
Figure 7.
Figure 8: Cost of imported energy by fuel 2018
1% 2%
10%
Cost of energy imports
2018: €5.0 billion
87%
Oil Natural Gas Coal Renewables
The most significant factor affecting energy prices in Ireland is global oil prices, which have shown dramatic fluctuations
in recent years. As well as having a direct impact on the prices of heating oil and transport fuels, global oil prices also
influence other energy prices, notably those of natural gas. However, the relationship between oil and gas prices in Europe
has become complex in recent years, partly due to the rapid growth of LNG imports to Europe.
In Ireland, natural gas prices have a significant influence on electricity prices because of the country’s reliance on natural
gas for power generation. This reliance also means that Ireland’s electricity security is closely linked to its natural gas
security.
SEAI publishes a biannual report on electricity and gas prices in Ireland based on EU legislation on transparency of gas
and electricity prices [15]. These reports contribute to the understanding of the key contributing factors underlying price
changes.
2.3 Meeting Ireland’s energy demand
2.3.1 Demand
Final energy demand is a measure of the energy that is delivered to energy end-users in the economy to undertake
activities as diverse as heating and lighting communities, manufacturing, providing essential services, and moving people
and goods. It excludes the quantities of energy required to transform primary energy sources, such as crude oil, into forms
suitable for end-use, such as transport fuels and electricity.
Figure 9 shows the breakdown of final energy demand by fuel over the period 2000–2018. Final consumption peaked
at 13.2 Mtoe in 2008, fell by 19% by 2012 and increased by 15% by 2018. 2018 final consumption was 12.3 Mtoe, which
is 6.6% below the 2008 peak. Oil dominates, accounting for 57% of the total in 2018, with 71% of this being used in
transport. Electricity, natural gas, and renewables account for 19%, 16% and 3.8% respectively. It is noteworthy that final
consumption of renewables accounts for renewable energy consumed directly by end-users (for example, biomass for
heat and biofuels for transport) but not the large amount of renewable energy used to generate electricity.
19ENERGY SECURITY IN IRELAND 2020 Report
Figure 9: Final consumption by fuel 2000-2018
14
12
10
8
Mtoe
6
4
2
0
2000 2001 2002 2003 2004 2005 2006 2007 2008 2009 2010 2011 2012 2013 2014 2015 2016 2017 2018
Oil Gas Electricity Renewables Coal Peat Wastes Non-Renewable
Source: SEAI
Figure 10 illustrates the sectors in which energy is being used. The scale of the transport and residential sectors are notable.
Together they account for 65% of final demand. Both these sectors comprise very large numbers of relatively small end-
users. This is a challenge for energy policy makers because achieving meaningful change, in terms of both strengthening
demand-side energy security and decarbonisation, depends on influencing very many individual decision makers about
their consumption patterns and fuel choices.
Figure 10: Final consumption by sector 2018
2%
12%
21%
23%
42%
Industry Transport Residential Services Agriculture & Fisheries
Source: SEAI
It is also interesting to examine the trend in final consumption over time and its relationship with economic activity. Figure
11 shows the trends in total energy demand, transport's consumption and modified domestic demand5 as indices relative
to their 2000 values. It illustrates how transport final energy demand was very strongly coupled to economic activity
during the 2000-2009 period.
5 Modified domestic demand is an indicator of domestic demand calculated by the CSO that is designed to give better insight into Irish domestic economic
activity. It excludes trade in aircraft leasing and R&D-related intellectual property (IP) imports.
20ENERGY SECURITY IN IRELAND 2020 Report
Figure 11: Index of modified domestic demand and final consumption by sector 2000-2018
160
140
120
Index (year 2000 = 100)
100
80
60
40
20
0
2000 2002 2004 2006 2008 2010 2012 2014 2016 2018
MDD Transport Total final consumption
Source: SEAI & CSO
With the onset of the economic crisis in 2008, transport consumption reacted strongly to the fall in economic activity,
mainly due to a significant reduction in activity in road freight and international aviation. Between 2007 and 2011,
modified domestic demand fell by 5.3% per annum while transport consumption fell by 6.2% per annum. For the period
2013 to 2015, transport energy growth matched growth in modified domestic demand, with annual growth rates of 4.7%
and 4.5% respectively. Since 2015, the growth in transport consumption has softened to 2.2% per annum, while the annual
growth in modified domestic demand has been 3.7%.
2.3.2 Future demand
Despite evidence of relative decoupling of energy demand from economic activity in recent years, there remains an
enduring relationship between the two. This has implications for energy security, especially in the case of transport, which
is the dominant driver for oil imports. Transport is considered the most difficult of all sectors to diversify from fossil fuel
consumption and decarbonise.
Figure 12 shows the historical trend in final energy demand since 2000 and the national energy projections prepared
by SEAI for the period to 2030. The lower projection is based on higher fossil fuel prices and the implementation of the
policies and measures contained in the Climate Action Plan [7]. This projection could be lowered further in due course
in accordance with the more ambitious decarbonisation targets proposed in the European Green Deal [6]. The higher
projection is a worst-case scenario used for comparison and is not considered likely6. The projections indicate an annual
change in final energy demand of between -2.9% and +1.0% between 2018 and 2030.
6 Additional information on SEAI’s projections is provided in section 1.4.
21ENERGY SECURITY IN IRELAND 2020 Report
Figure 12: Historical and projected final energy demand 2000-2030
16
14
12
10
Mtoe
8
6
4
2
0
Historical demand Lower demand forecast Upper demand forecast
Source: SEAI
2.3.3 Supply
Primary energy is the total amount of energy used in Ireland. It includes the energy overhead required to convert primary
sources of energy into forms that are useful for the final consumer, for example, the energy used in oil refining processes
and for power generation, transmission, and distribution. This energy overhead is not all directly related to the level
of economic activity. Instead, it is dependent to a large extent on the efficiency of the transformation process and the
technologies involved.
Ireland’s primary energy requirement in 2018 was 14.6 Mtoe, 19% more than final demand. Figure 13 shows the trends in
both final energy demand and primary energy supply over the period 2000–2018, as indices relative to their 2000 values.
The primary energy requirement in 2018 was 5.2% higher than it was in 2000, whereas final demand was 12.9% higher.
The main reason for this is an improvement in the efficiency of Ireland’s electricity supply over this period – from 36% in
2000 to 52% in 2018.
Figure 13: Index of final consumption and primary energy supply 2000-2018
130
120
Index (year 2000 = 100)
110
100
90
80
70
2000 2002 2004 2006 2008 2010 2012 2014 2016 2018
Final consumption Primary enegry
Source: SEAI
Greater efficiency of transformation improves energy security because it decreases the amount of primary energy required
to meet a given level of final demand.
22You can also read