Society of Actuaries Research Brief Impact of COVID-19 - April 16, 2020 - April 2020 - SOA.org
←
→
Page content transcription
If your browser does not render page correctly, please read the page content below

Society of Actuaries Research Brief
 Impact of COVID-19
 April 16, 2020

April 2020
2

Society of Actuaries Research Brief
Impact of COVID-19
April 16, 2020

AUTHORS                 R. Dale Hall, FSA, MAAA, CERA, CFA
                        Cynthia S. MacDonald, FSA, MAAA
                        Peter J. Miller, ASA, MAAA
                        Achilles N. Natsis, FSA, MAAA
                        Lisa A. Schilling, FSA, EA, FCA, MAAA
                        Steven C.Siegel, ASA, MAAA
                        J. Patrick Wiese, ASA

REVIEWERS               Michael C. Dubin, FSA, FCAS, FCA, MAAA
                        Jing Lang, FSA, FCIA
                        Max J. Rudolph, FSA, MAAA, CERA, CFA
                        Nazir Valani, FSA, FCIA, MAAA
                        Greger Vigen

Caveat and Disclaimer

This study is published by the Society of Actuaries (SOA) and contains information from a variety of sources. The study is for informational purposes only
and should not be construed as professional or financial advice. The SOA does not recommend or endorse any use of the information provided in this
study. The SOA makes no warranty, express or implied, or representation whatsoever and assumes no liability in connection with the use or misuse of this
study.

Copyright © 2020 by the Society of Actuaries. All rights reserved.

                                                                                                                  Copyright © 2020 Society of Actuaries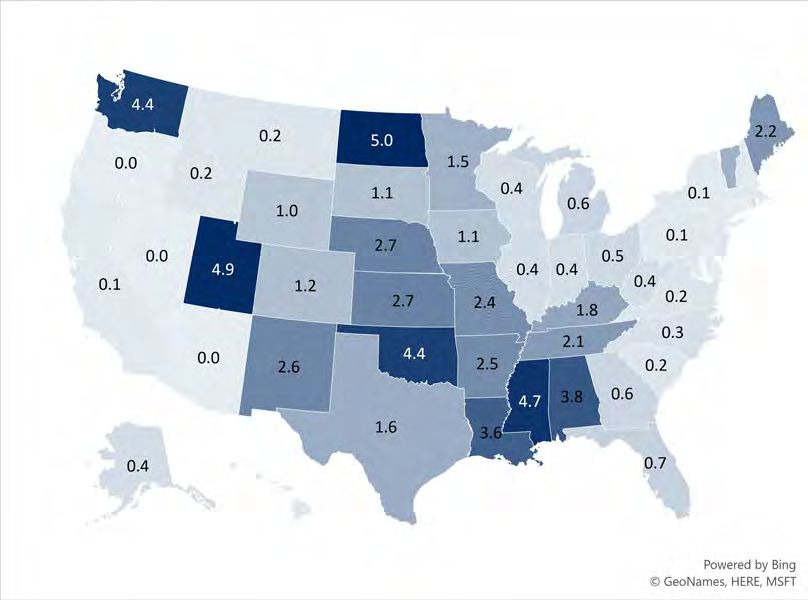
3

CONTENTS
Introduction.............................................................................................................................................................. 5
Key Statistics............................................................................................................................................................. 6
       Reported Cases .............................................................................................................................................................. 6
                Worldwide Cases ............................................................................................................................................... 6
                U.S. Cases ........................................................................................................................................................... 7
       Case Fatality and Mortality Rates ................................................................................................................................. 8
                CFRs by Age Group ............................................................................................................................................ 9
                U.S. Subpopulations ........................................................................................................................................ 10
                CFR Limitations ................................................................................................................................................ 11
                Reported Cases vs. Actual Cases..................................................................................................................... 13
       Comparison to Past Pandemics and Influenza ........................................................................................................... 14
                COVID-19 and Past Pandemics ....................................................................................................................... 14
                COVID-19 and Influenza .................................................................................................................................. 14
       Health Care Cost and Utilization ................................................................................................................................. 16
                Supply of Medical Resources .......................................................................................................................... 17
                Hospitalization Rates ....................................................................................................................................... 18
                COVID-19 Treatment ....................................................................................................................................... 22
                Non-COVID-19 Health care ............................................................................................................................. 23
                Mental Health .................................................................................................................................................. 23
       Infection Spread Rate .................................................................................................................................................. 24
Economic and Asset Impact .................................................................................................................................... 26
      Macroeconomic Variables ........................................................................................................................................... 26
      Asset Values and Volatility........................................................................................................................................... 28
      Low Interest Rate Environment .................................................................................................................................. 30
      Reinvestment and Default Risk ................................................................................................................................... 30
Impact on Insurance Industry.................................................................................................................................. 32
       Impact on Life and Health Insurance Companies....................................................................................................... 32
       Impact of Property/Casualty Coverages ..................................................................................................................... 32
              Business Interruption Insurance ..................................................................................................................... 33
              Cancellation Insurance .................................................................................................................................... 33
              Workers’ Compensation ................................................................................................................................. 33
              Personal Automobile Insurance...................................................................................................................... 34
              Medical Malpractice Insurance ...................................................................................................................... 34
              Financial Guaranty/Mortgage Guaranty ........................................................................................................ 35
       Changes in Insurance Regulation and Contractual Requirements ............................................................................ 35
       Cyber Risk ..................................................................................................................................................................... 35
Operational and Emerging Risks.............................................................................................................................. 36
      Loosening COVID-19 Restrictions................................................................................................................................ 36
      Hospital Operations ..................................................................................................................................................... 36
      Food Supply Risks......................................................................................................................................................... 38
      Remote Work ............................................................................................................................................................... 38
      Employment Law ......................................................................................................................................................... 39
      Internet Service Provider and Virtual Private Network Capacity .............................................................................. 39
      Stockpiling .................................................................................................................................................................... 40
      Event Cancellations and Restaurant Closings............................................................................................................. 40
      International Trade Dependency ................................................................................................................................ 41
      Alternative Entertainment Distribution ...................................................................................................................... 41

                                                                                                                                                    Copyright © 2020 Society of Actuaries
4
Risk of Extreme Weather and Other Natural Hazards ............................................................................................... 41
Previous SOA Research Highlights ........................................................................................................................... 43
Impact on the U.S. Life Insurance Industry................................................................................................................. 43
Comparison to Current COVID-19 Events................................................................................................................... 43
Impact on the U.S. Health Insurance Industry ........................................................................................................... 44
Low and Negative Interest Rate Research .................................................................................................................. 44
End Notes ............................................................................................................................................................... 45
Additional References ............................................................................................................................................. 54
Key Statistics................................................................................................................................................................. 54
Economic and Asset Impact ........................................................................................................................................ 55
Operational and Emerging Risks ................................................................................................................................. 56
Appendix: Reported Cases by U.S. State ................................................................................................................. 57
About The Society of Actuaries ............................................................................................................................... 59
Copyright © 2020 Society of Actuaries5
Society of Actuaries Research Brief
Impact of COVID-19
April 16, 2020
Introduction
In late December 2019, doctors in the city of Wuhan, China, began to piece together information from several
medical cases showing similar symptoms. As 2019 ended, Chinese officials announced a pneumonia-like outbreak
and began to identify a “novel coronavirus” linked to the cases. As the Lunar New Year banquet tradition occurred in
Wuhan, a city in Hubei, in mid-January 2020, infections began to rapidly increase. By January 23, over 600 cases had
been confirmed, 1 and Wuhan and other areas in China instituted social distancing policies and travel restrictions. 2
On March 11, WHO publicly characterized COVID-19 as a pandemic, 3 and on March 13, the United States declared
the COVID-19 outbreak a national emergency. 4
To stem the spread of the virus, several countries worldwide and many U.S. states and cities have issued travel
restrictions or “stay at home” orders. 5 Some markets that were early to detect and treat the virus have eased travel
restrictions while remaining vigilant for a second wave of the outbreak. 6
By April 2, 2020, the disease had spread to nearly all corners of the world. By April 14, 2020, the number of
confirmed cases involving the novel coronavirus now named “SARS-CoV-2”—which causes the respiratory disease
now named “coronavirus disease 2019” (COVID-19) 7—was approximately 1.98 million worldwide with general
agreement that the number is higher due to delays in full testing and reporting in many countries. Approximately
170 countries have reported at least one case and nearly 126,000 deaths have resulted from COVID-19. 8 It is
important to recognize that the number of reported cases for any disease typically lags behind the number of actual
cases. As a result, the number of reported cases typically continues to rise after the actual number of new cases
declines. A key differentiation among some countries is the speed at which they have ramped up testing and
identification processes across their populations.
The health, mortality and economic focus has become one of international concern. The impact of travel and
shipping restrictions in a modern, interconnected international economy has had an exacerbating effect of the
outbreak into logistics and the financial markets. Financial markets have seen high volatility as new economic
information becomes available, monetary policies are implemented, and value and opportunity come in and out of
favor with investors. Supply chains of international operations are greatly impacted as well, as many major
worldwide manufacturers are evermore connected across continents. Unemployment rates have risen as the world
adjusts to lower levels of economic activity.
By mid-April 2020, a confluence of risks has come together. Additional operational and financial risks may emerge,
compounding the current situation. Actuaries will be watching for any additional risk events that layer on to the
current environment, especially ones that may cause additional property, mortality and health risks such as
catastrophic weather events. Morbidity, mortality, asset/liability management and operational risks are all a part of
the evolving story. This update to the Society of Actuaries (SOA) Research Brief on the Impact of COVID-19 has been
constructed to highlight some of the key continuing and new features of the pandemic all around the world and
contemplate the risks for the actuarial profession to consider in their work.
Copyright © 2020 Society of Actuaries6
Key Statistics
REPORTED CASES
WORLDWIDE CASES
National health organizations around the world have been fast at work in connecting with health care providers to
collect current case information. Confirmed case are a function of the ability for any public health agency across
countries to distribute, administer and collect results from their respective health systems Through April 14, 2020,
approximately 1.98 million cases have been reported worldwide. Seven countries comprise 70% of the world’s
cases, with nearly half (48%) of the world’s cases in three countries: U.S., Italy and Spain. Figure 1 shows the weekly
progression of confirmed cases for the 15 countries that have reported the most COVID-19 cases as of April 14,
2020.
Figure 1
CONFIRMED COVID-19 CASES FOR 15 COUNTRIES WITH THE MOST CASES, APRIL 14, 2020
Number of Cases Confirmed During Period Ending...
28-Jan 25-Feb 3-Mar 10-Mar 17-Mar 24-Mar 31-Mar 7-Apr 14-Apr % of World
U.S. 30.8%
Spain 8.7%
Italy 8.2%
Germany 6.7%
France 6.6%
United Kingdom 4.8%
China 4.2%
Iran 3.8%
Turkey 3.3%
Belgium 1.6%
Netherlands 1.4%
Canada 1.4%
Switzerland 1.3%
Brazil 1.3%
Russia 1.1%
0 100 200 300 400 500 600 700
Thousands
Data source: Johns Hopkins University
To put the number of reported cases in context of country size, consider the number of confirmed cases per million
of population. Figure 2 shows that cases per million vary significantly by country. For Figure 2, the day that a country
first reported 3,000 or more cumulative cases of COVID-19 is considered day zero (day 0).
Copyright © 2020 Society of Actuaries7
Figure 2
CONFIRMED COVID-19 CASES PER MILLION THROUGH APRIL 14, 2020
6,000
5,500
5,000 Luxembourg
4,500
4,000
Spain
3,500
Switzerland
3,000
Ireland Italy
Belgium
2,500
2,000 France
U.S.
1,500 Qatar Germany
1,000
Canada Iran
500 South Korea World
0 China
0 5 10 15 20 25 30 35 40 45 50 55 60 65 70 75 80
Days Since the 3,000th Reported Case
Data source: Johns Hopkins University
U.S. CASES
Within the U.S., Figure 3 shows cases per million for states with at least 3,000 confirmed cases as of April 14, 2020.
Figure 3
CONFIRMED CASES PER MILLION FOR U.S. STATES WITH 3,000 CASES, APRIL 14, 2020
10,000
9,000
New York
8,000 New Jersey
7,000
6,000
5,000 Louisiana
Connecticut
4,000 Rhode Island Massachusetts
3,000 Michigan
Illinois U.S.
2,000
Washington
1,000
California
0
0 5 10 Pennsylvania 15 Florida 20 25 30
Days Since the 3,000th Reported Case
Data source: Johns Hopkins University
Copyright © 2020 Society of Actuaries8
As of April 14, 2020, 10 U.S. counties contained approximately 40% of the confirmed cases and 50% of COVID-19
deaths (Table 1). In total, these counties comprise only about 8.6% of the U.S. population.
Table 1
TOP 10 U.S. COUNTIES FOR COVID-19 CASES, APRIL 14, 2020
Number Percent of U.S. Total
County Cases Deaths Population Cases Deaths Population
New York City 110,465 7,905 5,803,210 18.2% 30.6% 1.8%
Nassau, NY 25,250 1,001 1,356,924 4.2% 3.9% 0.4%
Suffolk, NY 22,691 608 1,476,601 3.7% 2.4% 0.4%
Westchester, NY 20,191 596 967,506 3.3% 2.3% 0.3%
Cook, IL 16,323 577 5,150,233 2.7% 2.2% 1.6%
Wayne, MI 12,209 820 1,749,343 2.0% 3.2% 0.5%
Bergen, NJ 10,426 550 932,202 1.7% 2.1% 0.3%
Los Angeles, CA 10,047 360 10,039,107 1.7% 1.4% 3.0%
Rockland, NY 8,335 263 325,789 1.4% 1.0% 0.1%
Hudson, NJ 8,242 277 672,391 1.4% 1.1% 0.2%
Total 244,179 12,957 28,473,306 40.3% 50.2% 8.6%
Data source: Johns Hopkins University
It is important to recognize that these data show reported cases, not actual cases. Major differences exist between
testing and reporting, and the differences vary by country. Countries with the highest reported case rates likely
reflect serious infection rates, while countries with low reported case rates may reflect slower reporting or
underreporting. For example, as of early March, Indonesia, the world’s fourth most populous country, had reported
only two cases. Epidemiologists noted this was implausible and statistically impossible, especially given Indonesia’s
close ties to China and visits between the two countries. 9
CASE FATALITY AND MORTALITY RATES
The ultimate rate of mortality from COVID-19 will evolve over time, after the actual number of cases, rather than
the reported number of cases, is better understood. 10 This may take years. Some key health officials in the U.S.
expect an ultimate case fatality rate from the disease, once all known cases are included in the calculation, to settle
in the 0.1%–1.0% range. 11
At the start of a pandemic, mortality rates are crudely estimated using a statistic known as the “case fatality rate”
(CFR), which divides the known deaths by the identified number of cases. 12 Using this methodology and the Johns
Hopkins University database through April 14, 2020, the COVID-19 CFR across the worldwide set of case information
is 6.4%. These raw estimates, however, often are adjusted to produce updated rates, due to the current likelihood
of underreporting of actual cases. Many potential cases may yet be identified in some countries due to limited
supply of testing kits and a reduced ability to process tests in laboratory settings. In addition, individuals with
asymptomatic and mild cases of the disease may not actively seek treatment in the local health care systems. Death
rates are also substantially impacted by other factors such as age, smoking and social interactions in each country.
Initial CFRs in the U.S. ranged between 3.5% and 4.5%, slightly higher than the worldwide rate, primarily due to the
disease initially being seen in higher age groups, per the Centers for Disease Control and Prevention (CDC). As more
cases have been identified, the CDC’s estimate of the U.S. CFR has trended downward to the 1.8%–3.4% range. 13
Copyright © 2020 Society of Actuaries9
As of April 14, 2020, the U.S. CFR was 4.3%, based on Johns Hopkins University data. Because the epidemic is rapidly
evolving, the U.S. CFR is likely overstated because the number of new cases each day has been increasing
significantly. In Hubei province, China, where the pandemic began, the number of new cases daily had declined to a
relatively small level by the beginning of March. The stability of the Hubei province data reduces the risk of CFR
overestimation. 14 As of April 14, the CFR for Hubei province, China, was 4.8% compared to 4.7% for each day from
March 23 through April 12, 2020.
While the CFR is a useful starting point for mortality analysis, it does not address the fact that some symptomatic
individuals—particularly those with mild symptoms—may be excluded from the data. With enough time,
researchers may be able to assemble the information required to estimate the size of this pool of individuals. The
estimate can be used to calculate the symptomatic case fatality rate, which is equal to the number of deaths divided
by the estimated number of individuals who developed symptoms associated with the virus. Joseph T. Wu and other
researchers estimated the COVID-19 symptomatic case mortality rate for Wuhan—the capital city of Hubei province
and the location of most of the COVID-19 deaths in the province—to be 1.4%, with a 95% confidence interval
running from 0.9% to 2.1%. 15
CFRS BY AGE GROUP
CFR and mortality rates by age have become available as the pandemic progresses. Figure 4 compares ranges of
COVID-19 CFR by age group in the U.S. estimated by the CDC to the most recent mortality rates for the U.S. general
population computed by the Social Security Administration. For someone between the ages of 45 and 84 who
contracts COVID-19, the probability of dying from COVID-19 is generally higher than the probability of dying from all
other causes combined. However, the chance that children who become infected with COVID-19 die from it is nearly
zero, much lower than their mortality rates from all other causes combined.
Figure 4
U.S. GENERAL POPULATION MORTALITY AND COVID-19 CASE FATALITY RATE RANGES BY AGE GROUP
0% 5% 10% 15% 20% 25% 30% 35%
Low High
85–100 10.4% 27.3%
75–84 4.3% 10.5%
Age Group
65–74 2.7% 4.9%
55–64 Probability of Death, All Causes 1.4% 2.6%
COVID-19 Case Fatality Rate
45–54 0.5% 0.8%
20–44 0.1% 0.2%
0–19 0.0% 0.0%
Data sources: Centers for Disease Control and Prevention, Morbidity and Mortality Weekly Report, March 27, 2020 (published as early
release March 18, 2020); Social Security Administration Period Tables for 2016, the most current tables available.
CFRs have also been calculated by age group in China, Italy, Spain and South Korea as shown in Figure 5. Italy has the
highest rate in most age groups, while South Korea has the lowest CFR in most age groups. The range of CFR across
these countries is greatest at the older age groups. CFR for the 70–79 age group ranges between 5.2% in Spain and
15.3% in Italy. And for those above age 80, CFR ranges between 10.0% in South Korea and 23.6% in Italy. 16
Copyright © 2020 Society of Actuaries10
Figure 5
SELECTED COUNTRIES COVID-19 CASE FATALITY RATES BY AGE GROUP
0% 5% 10% 15% 20% 25%
80+
70–79
60–69 Italy
Age Group
50–59 Spain
40–49 China
30–39 South Korea
20–29
10–19
0–9
Data source: Sánchez, R.; Ordaz, A., Mendoza, S. P., eldiarios.es, March 22, 2020
Gender differences in CFRs have also been emerging in the available data, and men have fared worse than women.
In mainland China as of February 11, 63.8% of the deaths are male. 17 In Spain, as of April 13, 61.6% of the deaths
have been male. 18 Other risk factors are also prevalent in those who have died. Of the 8,644 people who died in
Spain as of April 1, 80.6% had one or more risk factors such as heart disease, respiratory disease or diabetes. 19 In the
U.S., 71% of the non-ICU hospitalizations and 78% of the ICU patients have had multiple risk factors. 20
U.S. SUBPOPULATIONS
New York City also has statistics on the number of cases and deaths by gender and age group (Figure 6). As of April
14, 2020, the New York City CFR for males is 6.9% and for females is 4.9%. Because the city’s age groupings do not
align with those shown for Italy, China, Spain and South Korea, it is difficult to compare results. However, New York
City’s CFRs appear to be higher than the estimated CDC ranges (Figure 4).
Figure 6
NEW YORK CITY CASE FATALITY RATES, APRIL 14, 2020
0% 5% 10% 15% 20% 25% 30%
Age 0–17 0.1%
18–44 0.7%
45–64 3.9%
65–74 12.0%
75+ 26.5%
Females 4.9%
Males 6.9%
Total 6.1%
Data source: New York City Department of Health
Copyright © 2020 Society of Actuaries11
Several states and large cities have released preliminary data that COVID-19 is infecting and causing fatalities for
African Americans at significantly higher rates. For instance, statistics released for Chicago show that African
Americans make up more than half of those who have tested positive and 72 percent of virus-related fatalities in
Chicago, even though they are slightly less than one-third of the population. Michigan and Louisiana have also
reported disproportionate rates. 21
Some health researchers and officials have attributed these rates to several factors including higher rates of
underlying health conditions; less access to care; more individuals working essential jobs, which reduces social
distancing; less available information about COVID-19; housing disparities; and living in more densely packed areas.
At present, experts say the data is too limited to make broad conclusions. Federal authorities are currently working
to provide further statistics on what might be explanations for these preliminary data. 22
Further, to the above reference about densely packed areas, an article prepared by the CDC COVID-19 response
team noted that population density could be a significant factor in the transmission of COVID-19. Since COVID-19 is
transmitted mainly by respiratory droplets, increased density could lead to acceleration in the transmission. Urban
areas such as New York City and the District of Columbia are exceeding national averages. Louisiana has shown
greater incidence and increase in incidence than other states in the South. This could be connected to the level of
population density that occurred during Mardi Gras celebrations, before many major events were cancelled. 23
CFR LIMITATIONS
It should continue to be reinforced that emerging statistics on the pandemic contraction and case fatality rates lag
real-time information. In the early onset of the disease, cases might often be realized in datasets between one to
two weeks after the first identification of the case occurred. The amount of time between contraction of the
disease, onset of symptoms, and its ultimate treatment and identification in public health statistics could be much
longer in counties without complete implementation of test processing. Deaths also occur on a lagged basis. Deaths
and death rates will greatly increase in many countries and communities over the next month.
As with other viruses such as influenza, climate conditions may have an impact on the ability of the virus to survive.
Viruses often survive better in cold weather because of the coatings that allow them to survive in the air and be
passed on from person to person. These features degrade in warm temperatures. However, it is questionable
whether COVID-19 is similar to other viruses in this regard. In the Southern hemisphere, South America and
Australia have seen significant outbreaks even in their warmer seasons.
Death rates and reported cases will grow rapidly over the coming weeks. However, the pace will be very different in
each community and country. It is important to understand the different timing of different numbers. Deaths are a
lagging indicator. Deaths will greatly increase in many communities over the next month—even if the personal and
private actions have slowed the growth of the virus. The same is true for reported cases. The numbers of reported
cases will greatly increase over the next months.
One technique to limit wild fluctuation in and gross under- or overstatement of CFRs that often occur during early
reporting is to “lag” the number cases in the denominator by seven or 14 days. The lag better aligns the deaths with
an appropriate exposure for calculating a CFR. However, CFRs calculated with a “lagged” case number could
potentially be significantly higher than a CFR using a non-lagged case number, especially during the early days of an
epidemic.
Another approach for avoiding misrepresentation of mortality rates because of early reporting issues is to analyze
data for a location only after a certain number of deaths have been recorded there.
Copyright © 2020 Society of Actuaries12
A word of caution: Many of the CFRs shown in and quoted in this brief have been pulled from sources that did not
clearly document whether a lag is included. The reader should be aware of these potential shortcomings when
reviewing these statistics and other reported CFRs.
Figure 7 highlights the effect of using lagged CFRs for Hubei province, China, as well as the impact of analyzing data
only after 1,000 deaths were recorded in Hubei province. Without adjustment for reflecting unconfirmed and
unreported cases, it appears the lagged and unlagged CFRs for Hubei province are converging and may stabilize
between 4.7% and 4.8%.
Figure 7
COVID-19 CASE FATALITY RATES FOR HUBEI PROVINCE, CHINA, THROUGH APRIL 12, 2020
8% 8%
14-day lag
7% 7%
7-day lag 14-day lag
7-day lag
Case Fatality Rate (CFR)
6% 6%
5% 5%
4% 4%
no lag no lag
3% 3%
2% 2%
0 5 10 15 20 25 30 35 40 45 50 55 60 65 70 75 80 85 0 5 10 15 20 25 30 35 40 45 50 55 60
Days Since First Death Days Since 1,000th Death
4.8%
4.7% 14-day lag
4.6%
7-day lag
4.5%
no lag
4.4%
4.3%
25 30 35 40 45 50 55 60
Days Since 1,000th Death
Data source: Johns Hopkins University
The reader can see in Figure 8 that COVID-19 CFRs show clear effects of early reporting for all countries with at least
1,000 deaths through April 14, 2020, with the possible exception of Hubei province and all provinces of China.
Although it is too early to draw conclusions about the likely long-term CFRs among countries, the differences are
striking. At this early stage, CFRs in Italy significantly outpace those of all other countries that have suffered at least
1,000 COVID-19 deaths. Italy’s higher CFRs may be in part because in Italy the cases are geographically
Copyright © 2020 Society of Actuaries13
concentrated, which is overwhelming Italy’s health care system, while in other countries, the cases are more
geographically spread out.
Figure 8
CFRS WITHOUT LAG FOR COUNTRIES WITH AT LEAST 1,000 COVID-19 DEATHS, THROUGH APRIL 14, 2020
14% Belgium U.K. Italy
13%
12%
France
11% Netherlands
Case Fatality Rate (CFR)
Spain
10%
9%
8%
7% World
Iran
6%
5% Hubei Province, China
U.S
4% .
China (all provinces)
3%
2% Germany
1%
0 5 10 15 20 25 30 35 40 45 50 55 60 65
Days Since 1,000th Death
Data source: Johns Hopkins University
REPORTED CASES VS. ACTUAL CASES
As previously stated, at this early stage in the epidemic, the CFR focuses on mortality rates relative to only
confirmed and reported cases. Due to resource constraints, most countries have focused COVID-19 testing almost
exclusively on individuals who exhibit severe symptoms. 24 Consequently, a key question remains unanswered: What
percentage of the population has already been exposed to the virus?
A high exposure percentage would be good news, indicating that a significant portion of the population has already
contracted the virus, experiencing either mild or no symptoms. The greater the number of infected individuals who
have experienced little or no discomfort as a result of the virus—relative to the number who have experienced
severe complications or death—the less danger the virus poses to the population that has not yet been infected.
In the absence of random testing of the general population, some researchers have used indirect approaches to
estimate the portion of the population that has already been infected by SARS-CoV-2, the coronavirus that causes
the illness known as COVID-19. For example, researchers from Penn State University and Montana State University
examined publicly available U.S. influenza-like illness (ILI) data for this past March and identified a surge in non-
influenza ILI. The surge defied patterns seen in prior years. Across U.S. states, the researchers found that the surge
correlates with COVID-19 case counts. The authors conclude that the “symptomatic case detection rate of SARS-
CoV-2 in the U.S. to be 1/100 to 1/1000.” 25 This conclusion, in turn, suggests that tens of millions of Americans have
already been infected by the SARS-CoV-2 and, correspondingly, implies that the mortality rate among infected
persons may be far lower than previously believed.
Copyright © 2020 Society of Actuaries14
COMPARISON TO PAST PANDEMICS AND INFLUENZA
COVID-19 AND PAST PANDEMICS
By comparison, the spread of COVID-19 has been much greater than similar epidemics witnessed in the 21st century
but also with much lower mortality rates. SARS-CoV-2 is one of seven distinct coronaviruses that can infect humans
and get their name from the crown-like spikes on their surfaces. Four common coronaviruses (known as 229E, NL63,
OC43 and HKU1) rarely cause serious complications or mortality events. Two other coronaviruses have been more
prominent in their impact on human illness and mortality. The SARS-CoV virus caused the severe acute respiratory
syndrome (SARS) outbreak of 2003 26 and the MERS-CoV virus created the Middle East Respiratory Syndrome (MERS)
in 2012. 27
Table 2
COMPARISON OF SELECTED CORONAVIRUS EPIDEMICS
Number of Estimated
Countries Estimated Estimated Case Fatality
Coronavirus Epidemic Reporting Cases Deaths Contracted Cases Rate
SARS (2002–2003) 29 774 8,098 9.6%
MERS (2012–2014) 27 858 2,494 34.4%
COVID-19 (2019–4/14/2020)
No lag 170 125,578 1,972,254 6.4%
Lag-7 -- -- -- 8.8%
Lag-14 -- -- -- 14.7%
Note: Significant differences between the estimated COVID-19 case fatality rates (CFRs) with and without lags indicate that CFRs are
likely distorted by reporting issues that often exist in the early stages of epidemics. COVID-19 CFRs are expected to change as the
epidemic matures.
Table 2 shows comparative statistics of COVID-19 compared to the severe acute respiratory syndrome (SARS)
outbreak of 2003 and the Middle East Respiratory Syndrome (MERS) in 2012. 28
The U.S. was a very small part of these previous outbreaks in comparison to the level of activity seen with COVID-19.
Eight U.S. patients had evidence of the SARS infection, and no deaths occurred in the U.S. due to SARS. The U.S. saw
only two cases and no deaths due to MERS in 2014, both associated with individuals who had lived or worked on the
Arabian Peninsula. As of 14, 2020, the U.S. had reported 607,670 cases of COVID-19, about 31% of the world’s
confirmed cases.
COVID-19 AND INFLUENZA
In addition, it can be beneficial to compare the extent of the impact of a sample influenza year to understand the
magnitude and strain on health care systems and population mortality. The most recent full year of mortality in the
U.S. is from 2018, which was also a fairly harsh year for the age-adjusted influenza mortality rate. The U.S. influenza
season across 2017–2018 saw over 48 million people become ill, with over 950,000 people hospitalized and over
79,000 deaths. 29 The annual case fatality rate for influenza in the U.S. typically is observed between 0.1% and 0.2%,
with population mortality generally in the range of 12 to 20 deaths per 100,000 of population (0.012% to 0.020%)
depending on the severity of the season. 30
During the 1918 influenza H1N1 pandemic as World War I was ending, mortality was high in people younger than 5
years old, people aged 20 through 40, and in people age 65 years and older. 31 The high mortality in healthy people,
Copyright © 2020 Society of Actuaries15
including those in the 20–40-year age group, was a unique feature of this pandemic. Health officials estimate
mortality was approximately 50 million deaths worldwide. Since 1918, the world has experienced three additional
pandemics, in 1957, 1968 and most recently in 2009. 32 These subsequent pandemics were less severe and caused
considerably lower mortality rates than the 1918 pandemic. The 1957 H2N2 pandemic and the 1968 H3N2
pandemic each resulted in an estimated 1 million global deaths, while the 2009 H1N1 pandemic resulted in fewer
than 300,000 deaths in its first year. 33
Besides total number of deaths, each influenza outbreak can differ by the time of year it will peak, the severity by
age group, the number of outpatient influenza-like illness visits, and the number of hospitalizations required. A flu
season in the U.S. is measured by week and typically begins in week 40 of a calendar year through week 39 in the
following calendar year. Week 40 in a calendar year will be flu week #1. The 2009–2010 season was unusual in that
it peaked early in flu week 3, whereas the 2011–2012 flu season peaked in flu week 24. Cumulative hospitalizations
were higher for flu seasons 2014–2015 and 2016–2017 than the 2009–2010 pandemic. 34 The 2009–2010 pandemic
was unusual in that it tended to affect younger people, whereas most flu outbreaks impact older people. Emerging
data on the COVID-19 pandemic indicates that older people are at greater risk, unlike the 2009–2010 pandemic. 35
Life insurance companies will focus on how general population mortality rates translate into the ultimate mortality
of their own insured populations. Socioeconomic factors may be a key driver of how mortality plays out, because an
individual’s access to health care services and current health condition are often factors that drive survival rates in a
confirmed case.
Insurers who can segment their policyholders into various income level groupings may be able to make use of U.S.
population mortality data, shown in Figure 9, to benchmark their own flu/pneumonia. This along with an
understanding of the relationship between past flu events and the emerging COVID-19 experience can be useful in
estimating the potential impact of COVID-19 on an insured block of business.
Figure 9 demonstrates how flu and pneumonia death rates in the U.S. have varied historically by various county level
income percentile groups. U.S. counties were ranked based on median household income and split into five county
level groups. The 80–100% group represents the quintile of counties with the highest income, and the 0–20% group
is the quintile of counties with the lowest income. The bottom income quintile (0%–20%) has had significantly higher
mortality, ranging from 8.4% to 22.7% higher, than the total population. The other quintile groups have clustered
together, and their rank order has shifted over time. However, the top income quintile (80%–100%) has had the
lowest mortality rates since 2005 and has ranged from 0.2% higher to 12.7% lower than the total population. 36
Copyright © 2020 Society of Actuaries16
Figure 9
U.S. POPULATION DEATHS FROM FLU AND PNEUMONIA BY COUNTY INCOME PERCENTILE
County Income
95 Percentile
Group
85 0%–20% (Bottom
Incomes)
Deaths per 100,000
20%–40%
75
40%–60%
65
60%–80%
55
80%–100% (Top
45 Incomes)
All Counties
35
Calendar Year
Data source: CDC WONDER Online Database
In a recent survey completed by the SOA, the Life Insurance Marketing and Research Association (LIMRA), Oliver
Wyman and the American Council of Life Insurers (ACLI), life insurance companies were asked which median
household income quintile their policyholders fell into on average. 37 The results were across the board. Thirty-two
of 53 responded with the following percentile groups: 7 in the top 20th; 4 in the 21st–40th; 9 in the 41st–60th; 9 in
the 61st–80th; and 3 in the 81st–100th. The remaining 21 could not provide an answer. The results show a lack of
homogeneity in the insurance industry and indicate that each insurer needs to consider its own block of business if
using population mortality as a benchmark to its own flu/pneumonia and COVID-19 claims.
HEALTH CARE COST AND UTILIZATION
Data on the cost and utilization of treatment for individuals who are diagnosed with COVID-19 still appear to be
emerging. On March 24, Covered California, an independent part of the California state government whose job is to
make the health insurance marketplace work for California’s consumers, released a national projection of health
care costs due to COVID-19. 38 Estimated one-year projected costs related to treatment and care of COVID-19 in the
U.S. commercial health insurance market, which covers a population of approximately 170 million people, ranges
from a low of $34 billion to $251 billion or more. As a percent of commercial health premium, these costs could
range from about 2% to over 21% of premiums. Covered California also estimated that 2021 premium increases
could range from 4% to 40% if carriers look to recoup 2020 costs, price for the same level of costs for the 2021
calendar year and look to protect their solvency.
Insurance premiums filed and approved for calendar year 2021 will depend on actuarial analysis and their insurance
companies’ forecasts for claim activity in 2021, as well as the level of certainty in the forecast. Current year results
for 2020 could show that margins for unexpected fluctuation were too small if COVID-19 causes excessive claim
costs and are not mitigated fully by reductions in other health case services. In the U.S., state insurance
Copyright © 2020 Society of Actuaries17
departments generally do not allow companies to build prior-year losses into future premium rates. Premium rates
may be higher in 2021 due to higher uncertainty as to whether there will be a rebound of COVID-19 claims costs as
predicted by some epidemiologists. Additionally, some insurers could project higher overall claim costs in 2021 due
to pent-up demand for services in 2020 that had to be postponed.
The financial impact of COVID-19 is seen through increases in underlying expenses for providers and is driven by
costs for testing, special equipment, protective systems for health care workers and additional staffing needs. In
some locations, additional hospital beds are needed, and they are being built or converted from other sources. 39
These increased costs may be passed onto payers immediately through fee-for-service claims or later in other
payment arrangements. In the U.S., many insurers, are waiving out-of-pocket costs for health care treatment
related to COVID-19. 40 As an example, a broad list of health care insurance activities being used to provide access to
care and support in the current environment can be found on the website of America's Health Insurance Plans
(AHIP), a U.S. national association whose members provide health insurance coverage and health‐related services. 41
Increases in costs are directly connected to the critical care needed for the sickest patients who have contracted the
virus. Intensive care units for these patients are very expensive and the costs are further compounded by the need
for isolating them. The impact also varies by the outbreak situation in local areas depending on demographics and
efforts such as social distancing to slow the spread. Additional details on the range of estimates for COVID-19 health
care claims can be seen in the Society of Actuaries report COVID-19 Costs to Commercial Health Insurers at
https://www.soa.org/resources/research-reports/2020/covid-19-cost-commercial/.
SUPPLY OF MEDICAL RESOURCES
An issue in many countries, including the U.S., is that the supply of many testing and critical care resources is lower
than the current demand. 42 Countries around the world are looking to find ways to improve their ability to meet this
demand. As an example, medical centers within the University of California system have been converting laboratory
space into in-house coronavirus testing centers. 43
Testing for the virus involves collecting respiratory specimens from a patient and running it through test kits at
public health laboratories that perform real-time RT-polymerase chain reaction (rRT-PCR) detection of the SARS-
CoV-2 virus. Inside the labs, reagents are required to test the specimen provided. Supply of test kits is appearing to
grow, but one constraint may also be the amount of public and clinical lab capacity that can be used or increased.
Some countries have dramatically increased capacity for testing over recent weeks, leveraging off past investments
in health care infrastructure. As an example, South Korea has had a high number of detections of SARS-CoV-2 but
has also seen the number of new cases decline since the start of March 2020. In many parts of the country, drive-
through test centers have been established to expedite the process and extend testing ability. These methods also
help limit health care workers from having extended direct exposure to the virus. 44
The U.S. has commenced this process through health facilities in some states and is also eyeing expansion to private
sector pharmacy partners. 45 A new test that could expedite detection was granted “emergency-use authorization”
by the Food and Drug Administration (FDA) on March 27 for rollout the week of March 30. 46 Manufacturers are
currently producing 50,000 tests per day and looking to increase production. Some jurisdictions were able to
purchase and implement large quantities of rapid tests to help increase the response to testing and treatment.
Allocation of rapid tests have been under debate between various levels of government. 47 From insurer and
consumer cost perspectives, on March 18, 2020, Congress passed a new law, the Families First Coronavirus
Response Act, that requires most private health plans to cover testing for the coronavirus with no cost-sharing
during the current emergency period. 48
Copyright © 2020 Society of Actuaries18
Testing is most important early in the cycle of a pandemic to help detect infections and contain the spread of the
virus. As the infection has spread and containment is no longer possible, the strategy has shifted from containment
to protection of the most vulnerable through social distancing and self-isolation.
HOSPITALIZATION RATES
Hospitalization rates for COVID-19 patients appear to be high. Based on analysis of data from China, the CDC found
that 21% of COVID-19 patients were hospitalized, a much higher percentage than the hospitalization rate of 1%–2%
for influenza patients (Figure 10).
Figure 10
PERCENTAGE OF CHINESE COVID-19 AND U.S. INFLUENZA CASES THAT REQUIRED HOSPITALIZATION
COVID-19 CASES INFLUENZA CASES
Hospitalized
1.6%
21%
Hospitalized
7%
Unknown
72%
98.4%
Not Hospitalized Not Hospitalized
Data source: Centers for Disease Control and Prevention
Figure 11 digs into hospitalization rates a little deeper and compares COVID-19 hospitalization rates by age groups
for COVID-19 and influenza. Based on COVID-19 data from China and Spain and influenza data from the U.S., COVID-
19 hospitalization rates significantly exceed influenza hospitalization rates for ages 18 and up. 49
However, there are other comparisons of COVID-19 to influenza that may be used to get a better understanding of
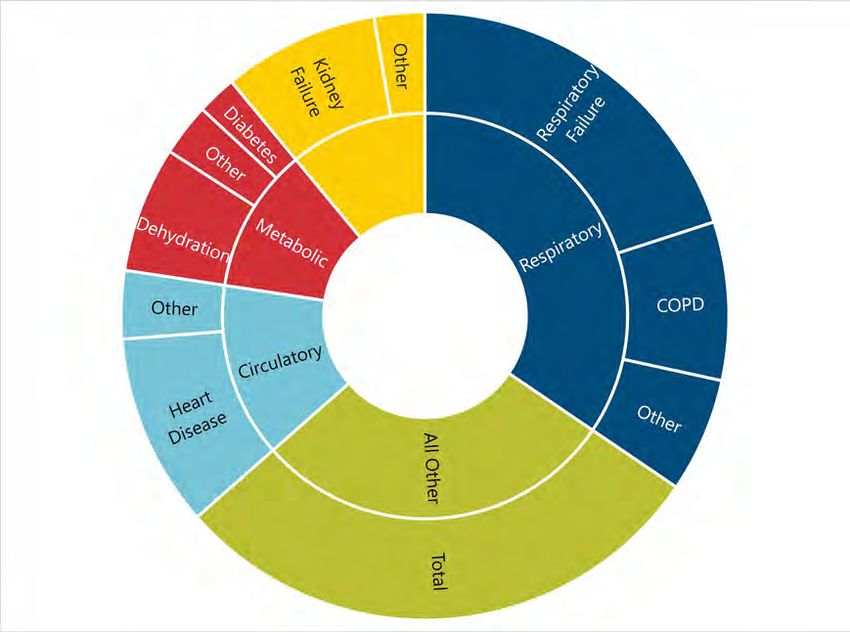
COVID-19 populations as they relate to comorbidities. According to the CDC, comorbidities played a key role in
helping to determine the severity of COVID-19 patients. In fact, according to one of their recent studies, individuals
with underlying conditions had a 40.5% chance of hospitalization versus 9% of those with no underlying conditions.
Similarly, Hospitalized patients had underlying health conditions 71% of the time for non-ICU admissions and 78% of
ICU patients. This helps to validate the frequently repeated trope that comorbidities and underlying medical
conditions can lead to more severe cases of COVID-19. 50
Copyright © 2020 Society of Actuaries19
Figure 11
PERCENTAGE OF CASES REQUIRING HOSPITALIZATION BY AGE GROUP
0% 5% 10% 15% 20% 25% 30%
Age 80+ 27.3%
70–79 24.3%
60–69 16.6% COVID-19:
50–59 10.2% China,
40–49 4.9%
30–39 3.2% through
20–29 1.2% February
10–19 0.3%
0–9 0.1%
80+ 16.6%
70–79 16.2%
60–69 16.9%
50–59 19.0% COVID-19:
40–49 15.3% Spain,
30–39 10.0% April 6,
15–29 5.6% 2020
5–14 0.3%
2–4 0.1%20
Figure 12
MAIN COMORBIDITIES FOR HISTORICAL INFLUENZA CLAIMS
Source: Health Care Cost Institute Enrollment and Inpatient Claims Data from 2013-2017
Figure 11 emphasized the distribution of hospitalization related to influenza claims. Figure 13 shows the incidence
rates of influenza hospitalizations by age group for each flu season. These results are similar in that there are
significant increases in flu hospitalizations as members age, with incidence rates more than doubling as members
shift into different 10-year age bands. In addition, males tend to have slightly higher hospitalization rates with those
discrepancies increasing at higher ages.
Copyright © 2020 Society of Actuaries21
Figure 13
HOSPITAL ADMISSION RATE PER THOUSAND MEMBERS DUE TO INFLUENZA 2013–2017
3.0
2.5
2.0
All Genders
1.5
Male
Female
1.0
0.5
0.0
0–18 19–34 35–44 45–54 55–64 65–74 75–84 85+
Source: Health Care Cost Institute Enrollment and Inpatient Claims Data from 2013–2017.
New York City released data of the cumulative number of COVID-19 cases and hospitalizations in the city, as shown
in Figures 14 and 15. The data show that persons age 18 to 44 are more likely than other age groups to contract
COVID-19. However, compared to all older age groups, a much smaller percentage of persons age 18 to 44 who
contracted COVID-19 have been hospitalized. 53
Figure 14
CUMULATIVE NUMBER OF NEW YORK CITY COVID-19 CASES AND HOSPITALIZATIONS, APRIL 14, 2020
Age Group Gender Total
120,000 Total Cases 111,424
100,000
80,000 Not
59,051 Hospitalized
60,000 51,934
42,127 40,559
40,000
14,025 12,331 Hospitalized
20,000
2,150 232 439
0
0 to 17
18 to 44
45 to 64
65 to 74
75 +
Unknown
Female
Male
Unknown
Total
Data source: New York City Department of Health
Copyright © 2020 Society of Actuaries22
Figure 15
PERENTAGE OF NEW YORK CITY COVID-19 CASES THAT HAVE BEEN HOSPITALIZED, APRIL 14, 2020
0% 5% 10% 15% 20% 25% 30% 35% 40% 45% 50% 55% 60% 65%
Total 27%
Male 29%
Female 23%
Age 75 + 62%
65 to 74 47%
45 to 64 27%
18 to 44 11%
0 to 17 9%
Data source: New York City Department of Health
New York City’s data shows that through April 14, 2020, 27% of COVID-19 patients have been hospitalized. It also
shows that males are more likely than females to contract COVID-19, and they are more likely to get sicker from
COVID-19 than are females. While males have contracted 53% of the cases, 58% of the hospitalized cases have been
males.
This report previously mentioned that during the 2017–2018 influenza season, about 8% of hospitalized influenza
patients died.
On a cautionary note, data from China and New York City are instrumental to understanding the COVID-19 situation
in those specific locales; however, experience in other locations may differ.
Other factors that may impact resource demand include the region where a facility is located. Regions prone to
extreme weather or other disaster events should plan for additional health care resource strain and the need for
more beds in case such an extreme event occurs concurrently with the pandemic. The level of additional strain will
vary based on how well these regions have planned previously for future extreme events and the need for increased
capacity.
COVID-19 TREATMENT
Several companies have been developing and testing treatments for symptoms of COVID-19, though results are still
preliminary. 54 In addition to these antiviral and anti-infective treatments, preventive medicines and therapeutic
antibodies are being reviewed. The newness of the virus complicates research efforts, even with increasing
information coming from early cases in China to help guide what might be potential treatments or solutions. On
March 30, the FDA issued an emergency-use authorization for two anti-malarial drugs for use in treating patients
infected with COVID-19. 55 The drugs, chloroquine phosphate and hydroxychloroquine sulfate, have been previously
used off-label anecdotally.
The World Health Organization (WHO) and its partners launched the Solidarity international clinical trial in March to
help find an effective treatment for COVID-19. The Solidarity trial is comparing four treatment options to assess
their relative effectiveness against COVID-19. The four treatment options are: remdesivir (previously tested for
Ebola treatment); lopinavir/ritonavir (used for HIV treatment); lopinavir/ritonavir with interferon beta-1a (used for
multiple sclerosis treatment); and chloroquine or hydroxychloroquine (used for malaria treatment—see above). The
Copyright © 2020 Society of Actuaries23
goal is to assess as quickly as possible the effectiveness of the treatment options by enrolling patients in multiple
countries. As of April 8, over 90 countries are participating. 56
The Gates Foundation, the Wellcome Trust and Mastercard announced in mid-March the launch of the COVID-19
Therapeutics Accelerator, a $125 million fund for coronavirus pandemic initiatives. The Accelerator’s initial efforts
are focused on exploring how existing drugs can help treat COVID-19. It has two current trials: one for the drug
chloroquine and the other for hydroxychloroquine. The goal of these trials is to see how the two drugs can stop
people who are exposed to the virus from getting sick. This differs from the WHO’s Solidarity trial, which is
investigating chloroquine treatment for its use to shorten COVID-19 patient symptoms. 57 In addition, efforts to
develop vaccines are well underway. More than 30 companies and academic institutions are racing to create such a
vaccine, several of which already have candidates they have been testing in animals. It is expected that human trials
will begin soon. Some estimates indicate that it may take up to 12–18 months to know the effectiveness and safety
of any proposed vaccines.
NON-COVID-19 HEALTH CARE
Overall health care cost and utilization in many countries will also be impacted by the decisions that individuals
make surrounding other typical illnesses that may arise and elective procedures that have been scheduled. Some
patients have procedures that may not be able to be deferred indefinitely due to the nature of the illness, such as
scheduled chemotherapy treatments. In these cases, hospitals are looking to make sure high-risk patients with
compromised immune systems are not exposed to the virus.
With encouragement by public health officials to reduce social interaction, however, individuals may be nervous
about entering a hospital setting where the virus may be present. Consequently, individuals may defer some
services, and health care providers may see minor ailments less frequently. In addition, health officials are strongly
encouraging patients to carefully consider use of emergency room services and not to use them for minor health
issues.
Telemedicine providers may see an expected rise in utilization. Low utilization of telehealth services in the U.S. to
date have been typically attributed to lower consumer awareness and higher comfort with traditional methods but
are expected to grow with increased emphasis on technology for social engagement and remote work. Related to
this, insurers should be prepared to see an increase in short-term disability claims as patients recover from the
disease and other complications.
MENTAL HEALTH
Mental health concerns and treatments may see an increased demand in the coming weeks as populations deal
increasingly more with self-isolation and reduced social interaction. 58 Mental side effects of the COVID-19 crisis are
increasingly looking to be addressed by health professionals and heightened as health resources are diverted to the
most immediate concerns. In past national disasters, such as terrorism attacks or large-scale weather catastrophes,
the primal human social instinct has been to seek comfort in a larger group—whether it be family, friends,
neighbors or co-workers. 59 In the COVID-19 pandemic, isolation is recommended to reduce the spread of the virus.
While social media outlets have certainly increased since past national disasters in the U.S., such as 9/11 and
Hurricane Katrina, it may not be a full replacement for social interaction or as available and used by older or more
remote segments of the population. To give perspective on the stress of isolation and to offer advice on ways to
contend with living in confined spaces for long periods of time, the U.S. National Aeronautics and Space
Administration (NASA) identified key skills the public can consider. Using insights from NASA astronauts, the agency
promoted personal skills including maintaining a plan and schedule; taking time for creative and fun activities; and
finding time, if possible, to get in a daily walk and fresh air. 60
Copyright © 2020 Society of ActuariesYou can also read