THE COMMITMENT TO REDUCING INEQUALITY INDEX 2018 - Oxfam Novib
←
→
Page content transcription
If your browser does not render page correctly, please read the page content below
DEVELOPMENT FINANCE INTERNATIONAL AND OXFAM REPORT                         OCTOBER 2018

THE COMMITMENT TO REDUCING
INEQUALITY INDEX 2018
A global ranking of governments based on what they
are doing to tackle the gap between rich and poor
EMBARGOED UNTIL 00:01HRS GMT 9 OCTOBER 2018
In 2015, the leaders of 193 governments promised to reduce inequality under Goal 10 of
the Sustainable Development Goals (SDGs). Without reducing inequality, meeting SDG 1
to eliminate poverty will be impossible. In 2017, Development Finance International (DFI)
and Oxfam produced the first index to measure the commitment of governments to
reduce the gap between the rich and the poor. The index is based on a new database of
indicators, now covering 157 countries, which measures government action on social
spending, tax and labour rights – three areas found to be critical to reducing the gap.

This second edition of the Commitment to Reducing Inequality (CRI) Index finds that
countries such as South Korea, Namibia and Uruguay are taking strong steps to reduce
inequality. Sadly, countries such as India and Nigeria do very badly overall, as does the
USA among rich countries, showing a lack of commitment to closing the inequality gap.

The report recommends that all countries should develop national inequality action plans
to achieve SDG 10 on reducing inequality. These plans should include delivery of
universal, public and free health and education and universal social protection floors.
They should be funded by increasing progressive taxation and clamping down on
exemptions and tax dodging. Countries must also respect union rights and make
women’s rights at work comprehensive, and they should raise minimum wages to living
wages.

See www.oxfam.org or https://policy-practice.oxfam.org.uk/publications for links to the
CRI Index website, the full report and methodology details.

                              www.oxfam.org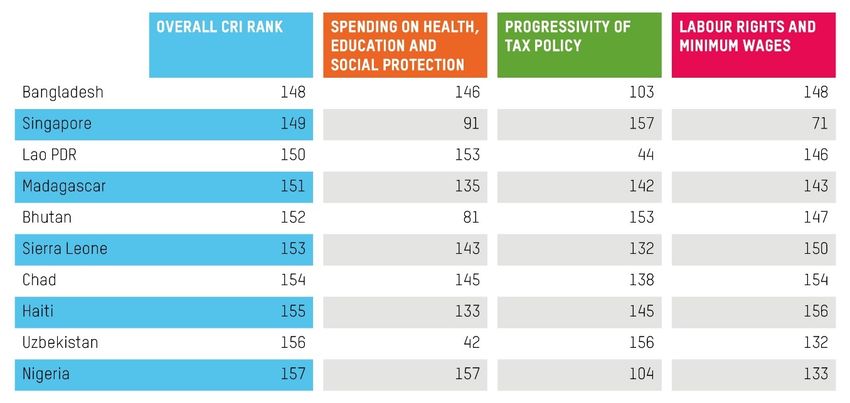
CONTENTS

Summary ...................................................................................................................... 3
    The Inequality Crisis, the Fight against Poverty and the Role of Governments ....................... 3
    The Commitment to Reducing Inequality INDEX ...................................................................... 3
    Methodology improvements to this year’s index ....................................................................... 6
    What are the main findings of the CRI index? ........................................................................... 7
    Which countries are doing best? ............................................................................................... 7
    Which countries have improved their performance since last year?......................................... 9
    Which countries are doing worst? ........................................................................................... 10
    What are some of the overall trends emerging from the new CRI index? .............................. 12
    Areas for improvement and further development .................................................................... 17
    Recommendations .................................................................................................................. 19

1      Reducing inequality through social spending ....................................................... 20

2      Reducing inequality through tax policies .............................................................. 30

3      The role of work and wages in reducing inequality ............................................... 41

4      Conclusion ........................................................................................................... 48
    Annex 1: The Commitment to Reducing Inequality findings ................................................... 49
    Regional rankings .................................................................................................................... 54

Notes .......................................................................................................................... 62

Acknowledgements ..................................................................................................... 74
    Endorsements ......................................................................................................................... 75

2                                                                             Commitment to Reducing Inequality Index 2018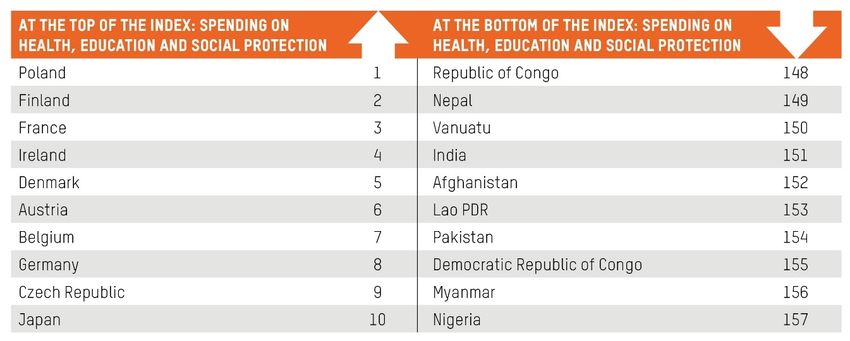
SUMMARY
THE INEQUALITY CRISIS, THE FIGHT AGAINST
POVERTY AND THE ROLE OF GOVERNMENTS
Many countries across the world, rich and poor, have experienced rapid growth in the gap
                                                                                  1
between the richest people in society and everyone else over the past 30 years. Failure to
tackle this growing crisis is undermining social and economic progress and the fight against
poverty. Oxfam’s research has shown that, since the turn of the century, the poorest half of the
world’s population have received just 1% of the total increase in global wealth, while the top 1%
                                     2
have received 50% of the increase.

Inequality is bad for us all. It reduces economic growth, and worsens health and other
            3
outcomes. The consequences for the world’s poorest people are particularly severe. The
evidence is clear: there will be no end to extreme poverty unless governments tackle inequality
and reverse recent trends. Unless they do so, the World Bank predicts that by 2030 almost half
                                                          4
a billion people will still be living in extreme poverty.

The rise of extreme economic inequality also undermines the fight against gender inequality and
threatens women’s rights. Women’s economic empowerment has the potential to transform
many women’s lives for the better and support economic growth. However, unless the causes of
extreme economic inequality are urgently addressed, most of the benefits of women-driven
growth will accrue to those already at the top end of the economy. Economic inequality also
compounds other inequalities such as those based on race, caste or ethnicity.

Development Finance International (DFI) and Oxfam believe that the inequality crisis is not
inevitable and that governments are not powerless against it. Inequality is a policy choice, and
our findings this year show this clearly. All over the world, governments are taking strong policy
steps to fight inequality. President Moon of South Korea tops the class, having increased tax on
the richest earners, boosted spending for the poor and dramatically increased the minimum
wage. But others are doing well too. Ethiopia has the sixth highest level of education spending
in the world. Chile has increased its rate of corporation tax. Indonesia has increased its
minimum wage and its spending on health.

These positive actions shame those governments that are failing their people. Nigeria remains
at the bottom of the CRI Index, failing the poorest people, despite its president claiming to care
about inequality. Hungary has halved its corporation tax rate, and violations of labour rights
have increased. In Brazil social spending has been frozen for 20 years. And Donald Trump has
                                                                                            5
slashed corporation tax in the USA, in one of the biggest giveaways to the 1% in history.

THE COMMITMENT TO REDUCING INEQUALITY INDEX
This is the second edition of the Commitment to Reducing Inequality (CRI) Index, which ranks
157 governments across the world. The full rankings, along with regional rankings, can be found
in Annex 1. The Index is based on our comprehensive database, including countries where DFI
has strong data and research contacts or Oxfam has country programmes or affiliates, to build
up a unique perspective on the extent to which governments are tackling the growing gap
between rich and poor in three key policy areas. This year’s Index has seen significant changes
in methodology from 2017, including new indicators on tax avoidance and on gender-based
violence.

3                                                      Commitment to Reducing Inequality Index 2018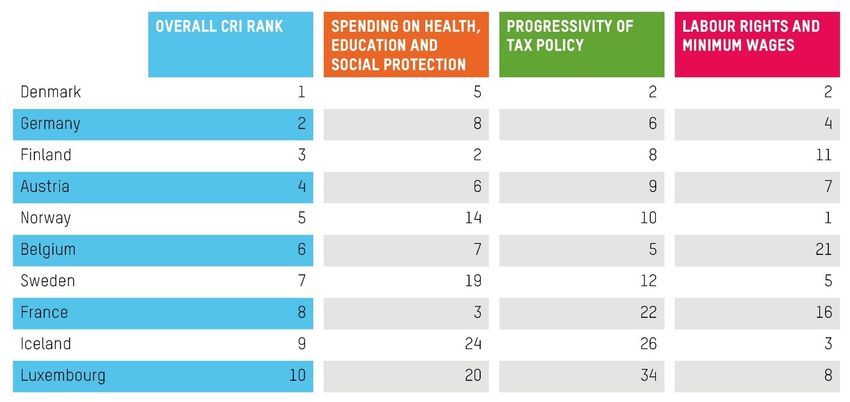
The CRI Index was reviewed by the Joint Research Centre of the European Commission
in both 2017 and 2018. Following the 2017 review, several adjustments were made to
match best practice in constructing composite indicators. A number of refinements
along the 2018 review are in the pipeline for next year's version. Thereafter, both indexes
were statistically audited. In 2018, the JRC concluded that the CRI is robust statistically
and is ‘paving the way towards a monitoring framework that can help identify
weaknesses and best practices in governments’ efforts to reduce the gap between rich
and poor’. The 2017 audit is available
at https://oxfamilibrary.openrepository.com/bitstream/handle/10546/620316/tb-cri-index-
statistical-audit-170717-en.pdf;
The 2018 audit is available at: XXX
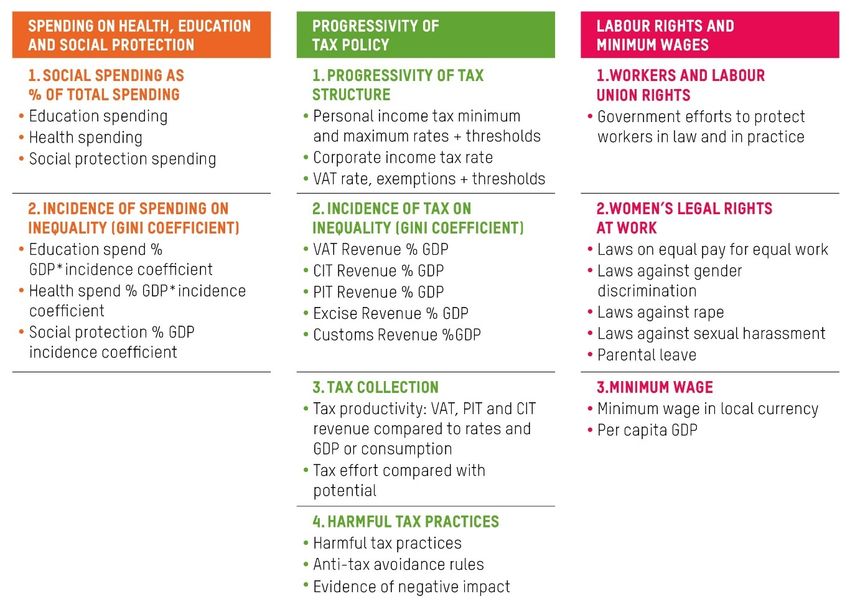
The CRI Index measures government efforts in three policy areas or ‘pillars’: social spending,
6
taxation and labour. These were selected because of widespread evidence that government
actions in these three areas have in the past played a key part in reducing the gap between rich
and poor.
1. Social spending on public services such as education, health and social protection has
been shown to have a strong impact on reducing inequality, particularly for the poorest
women and girls who are the most dependent on them. For example, a study of 13
developing countries that had reduced their overall inequality levels found that 69% of this
7
reduction was because of public services. Social spending is almost always progressive
because it helps reduce existing levels of inequality. Despite this, in many countries, social
spending could be far more progressive and pro-poor. Social spending can play a key role in
reducing the amount of unpaid care work that many women often do – a major cause of
gender inequality – by redistributing child and elder care, healthcare and other domestic
8
labour.
2. Progressive taxation, where corporations and the richest individuals are taxed more in
order to redistribute resources in society and ensure the funding of public services, is a key
tool for governments that are committed to reducing inequality. Its potential role in reducing
9
inequality has been clearly documented in both OECD countries and developing
10
countries, and highlighted recently by the International Monetary Fund (IMF) in its October
11
2017 Fiscal Monitor. However, taxation can be progressive or regressive, depending on
the policy choices made by government. Equally, a belief that taxation is gender-neutral has
led to a lack of attention to how taxes levied have increased the gender gap. The ability of
countries to collect progressive taxes is also undermined by harmful tax practices which
facilitate tax dodging.
3. There is strong evidence that higher wages for ordinary workers and stronger labour
12
rights, especially for women, are key to reducing inequality. Governments can have a
direct impact here by setting minimum wages and raising the floor of wages; they can also
have an indirect impact by supporting and protecting the right of trade unions to form and
organize. Evidence from the IMF and others shows that the recent decline in trade union
organization has been linked to the rise in inequality, as workers lose bargaining power and
13
more of the value of production goes to profits and the owners of capital. Women are
disproportionately represented in the lowest-paid jobs, with poor protection and precarious
14
conditions of employment. Governments can help correct this by passing and enforcing
laws against discrimination and violence against women, and laws that promote equal pay
and parental leave.
Actions across all three areas are mutually reinforcing. While progressive taxation is a good
thing in itself, its impact is greatly increased when used for progressive spending, and the CRI
Index reflects this in the scoring of countries’ efforts.
Clearly, tackling inequality requires other policy interventions: but, like the UN’s Human
Development Index (HDI), the three critical variables – action on social spending, taxation and
labour – can arguably be used as a proxy for a government’s general commitment to tackling
inequality.
4 Commitment to Reducing Inequality Index 2018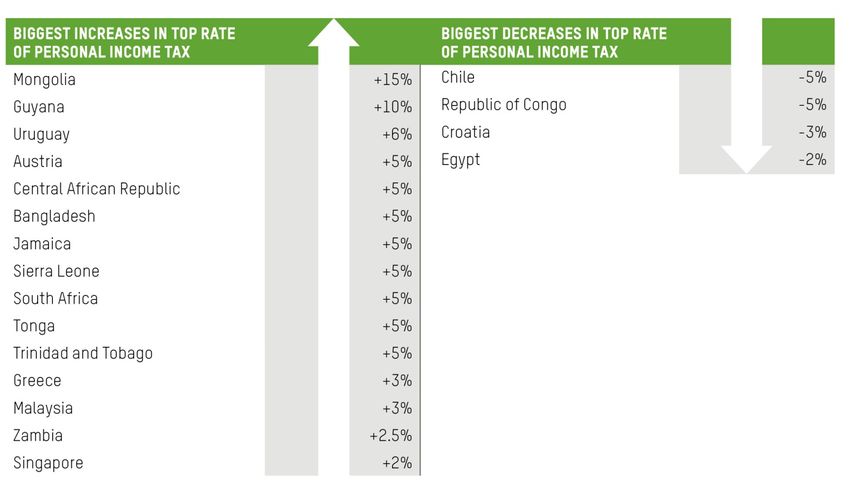
Why monitor government policy? Why not just monitor levels of inequality?

There are three reasons why DFI and Oxfam have chosen to measure the commitment of
governments to reducing inequality.

First, in 2015 governments across the world made a commitment to reduce inequality and
eradicate poverty through the Sustainable Development Goals (SDGs) and specifically Goal 10
on reducing inequality. Goal 10 will be reviewed in 2019, and the CRI Index will contribute to
this in enabling citizens to hold governments to account for their progress or lack of it.

Second, DFI and Oxfam strongly believe that the different levels of inequality that exist from one
national context to another show that inequality is far from inevitable; rather, it is the product of
policy choices made by governments. There are, of course, contextual challenges to consider in
every situation, as well as contextual advantages in some cases. All countries are also subject
to global forces that they cannot fully control (e.g. pressure to reduce wages and tax rates), and
this is particularly true of developing countries. The worldwide system of tax havens, which
undermines scope for government action, is a clear example.

Nevertheless, despite these global issues, DFI and Oxfam believe that governments have
considerable powers to reduce the gap between rich and poor women and men in their
countries. If this were not the case, there would not be so much variation in the policy actions of
different countries. Therefore, it is vital to be able to measure and monitor government policy
commitments to reducing inequality.

The final reason for developing the CRI Index is that existing systems to measure incomes and
wealth (e.g. national household surveys) collect data infrequently and contain major data errors
                                                                           15
– notably under-reporting of the incomes and wealth of the richest people. This means that the
data are very weak and rarely updated, especially for the poorest countries, so they are a poor
measure by which to hold governments to account. There is a need for urgent and significant
improvements in both the coverage and frequency of national data on levels of inequality.

The relationship between the CRI findings and the level of inequality in a given country was
                                                16
discussed at some length in last year’s report. In short, there was no automatic relationship,
but a more complex one. Some countries, like Namibia, have very high levels of inequality but
are strongly committed to reducing them. Others, like Nigeria, have high levels of inequality and
are failing to do anything about it. Other countries, like Denmark, have relatively low inequality
levels because of policies they have followed in the past but which they have increasingly
stepped away from, which is now leading to an increase in inequality. This is true for most high-
income, low-inequality countries. However, others, like Finland, remain committed to keeping
inequality levels low.

5                                                       Commitment to Reducing Inequality Index 2018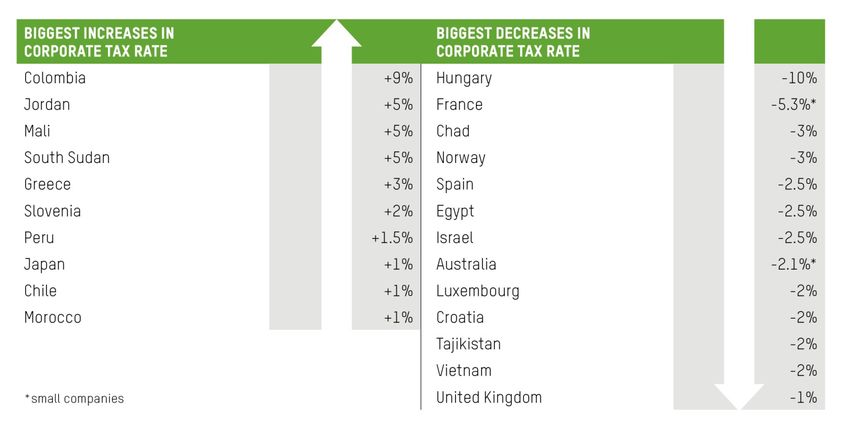
METHODOLOGY IMPROVEMENTS TO THIS YEAR’S
INDEX
Figure 1: The CRI 2018 pillars and indicators

The first edition of the CRI was launched in July 2017, covering 152 countries (CRI 2017). It
was published deliberately as a ‘beta’ version, and comments were sought from experts across
the world. These invaluable inputs have led to some significant refinements to the Index this
year (CRI 2018). The core methodology remains unchanged, focusing on the three pillars of
spending, tax and labour. Nevertheless, at a more detailed level there have been some
                                   17
important additions and changes.

The most significant change is the inclusion of three new sub-indicators, one in the tax pillar and
two in the labour pillar. One of the concerns voiced by many who commented on the Index last
year was that we had not considered the extent to which a country was enabling companies to
dodge tax. This meant that countries like Luxembourg or the Netherlands were getting higher
scores than they should. The negative role played by the Netherlands as a corporate tax haven
has become a hot topic in the country and Oxfam and allies are putting pressure on the
                                             18
government to take clear steps to stop this. This year we have added a new indicator on
harmful tax practices (HTPs) to address this.

In the labour pillar, many suggested that women’s labour rights are fundamentally undermined
                                                         19
by violence and harassment against women at work. Working women can sometimes
                                                                                            20
experience greater levels of domestic violence in response to greater economic autonomy. In
India for example, 6% of women (15–49 age group) have experienced spousal sexual violence
                                                                                    21
in their lifetime, with 5% experiencing this type of violence in the past 12 months. This has led
                                                                                22
to new indicators on the quality of laws against sexual harassment and rape.

In addition to these new indicators, there has been a lot of detailed work on improving data
sources, ensuring that we are using the most up-to-date sources. Across all pillars, major
progress has been made on including more recent data. In CRI 2018, virtually all tax and labour

6                                                     Commitment to Reducing Inequality Index 2018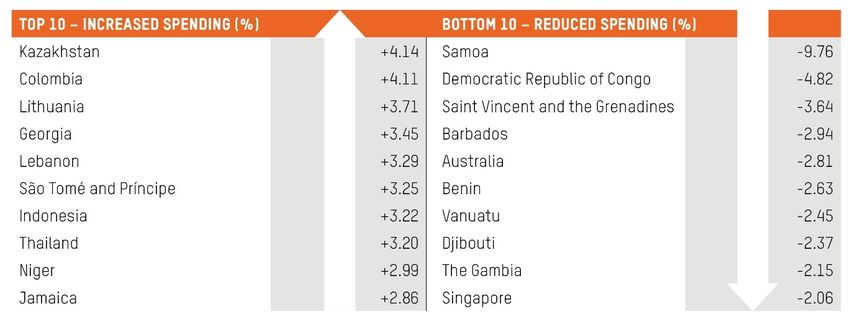
data are for 2017, compared with 2015 in CRI 2017. The average years for education and
health spending data have improved from 2014 to 2016, and for social protection from 2012 to
2015. The cut-off for data for this year’s Index is the end of 2017, so any policy changes from
2018 are not included, although we do refer to some of the more notable ones in the text. We
                                                                                    23
have also managed to add five new countries this year, bringing the total to 157.

These changes to the methodology and improvements in the quality of data mean that a straight
comparison between the scores of a country this year and last year may not give an accurate
picture of its performance. Countries’ movements up and down in terms of their scores are the
result of a combination of changes in their policies and changes to the methodology of the
Index.

For this reason, our analysis does not focus on simple comparisons of the scores for countries
between CRI 2017 and CRI 2018. However, it is possible to compare concrete policy changes
between the two editions of the CRI Index; for example, increases in health spending, or cuts to
the top rate of personal income tax, or increases in maternity leave; so we have highlighted
these. We also look at some of the key overall trends emerging since the first CRI Index.

WHAT ARE THE MAIN FINDINGS OF THE CRI INDEX?

All countries could do more, even those near the top

The first and most important point is that no country is doing particularly well, and even those at
the top of the listings have room for improvement. Even the top performer, Denmark, does not
get a perfect score and could be doing more. Furthermore, 112 of the 157 countries included in
the Index are doing less than half of what the best performers are managing to do.

WHICH COUNTRIES ARE DOING BEST?
The full CRI rankings, along with regional rankings, can be found in Annex 1 of the full report.
The top 10 performers in this year’s Index are highlighted in Table 1.
                                                                  24
Table 1: CRI Index ranking out of 157 countries – the top 10

7                                                      Commitment to Reducing Inequality Index 2018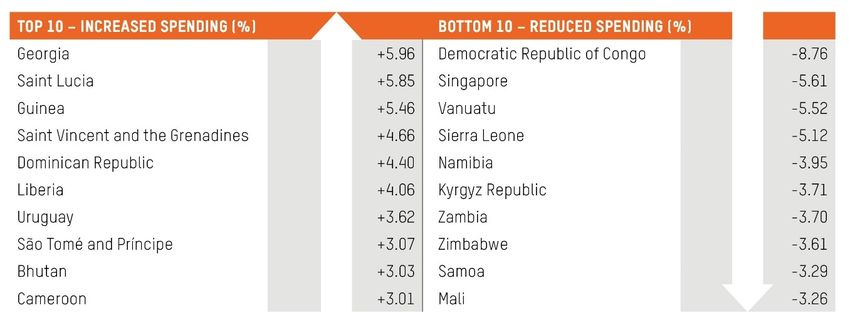
Box 1: The best and the worst

    Denmark tops this year’s CRI Index with the highest score. The northern European
    country has some of the most progressive taxation policies in the world. It also has some
    of the best labour market policies, and its protection of women in the workplace is the best
    in the world.
    Nigeria has the unenviable distinction of being at the bottom of the Index for the second
    year running. Its social spending (on health, education and social protection) is shamefully
    low, which is reflected in very poor social outcomes for its citizens. One in 10 children in
                                                    25
    Nigeria does not reach their fifth birthday, and more than 10 million children do not go to
            26                                     27
    school. Sixty percent of these are girls. The CRI Index shows that in the past year
    Nigeria has seen an increase in the number of labour rights violations. The minimum wage
    has not increased since 2011. Social spending has stagnated. The CRI Index shows that
                                                                                   28
    there is still significant potential for Nigeria to raise and collect more tax, so it scores very
    badly on this aspect too. There have however been very recent improvements in this area
    in 2018, which will show up in next year’s CRI. The IMF has given clear advice on the
                                                                                        29
    importance of tackling inequality, referring to Nigeria’s score in the CRI Index. The
    president of the country has also said that tackling inequality is important, as inequality
                                   30
    leads to political instability. Yet little has been done.

Most of the countries near the top of the index are OECD countries, headed this year by
Denmark. In this way, the rankings are similar to those of the HDI. With more national wealth,
these countries have much more scope to raise progressive tax revenues because there are
more citizens and corporations with higher incomes that can pay more tax; likewise, they have
greater scope to spend those revenues on public services and social protection. The leading
countries are also trying to tackle wage inequality by increasing the minimum wage and
supporting labour rights and women’s rights. Finally, they have a smaller informal sector than is
typical in developing countries, although precarious forms of employment are on the increase.

For most rich countries, the main body of policies measured by the Index was introduced in a
different period of history, when significant action in these areas was broadly accepted as the right
thing to do and paid dividends in terms of social and economic progress. Today, however, in many
rich countries, political support for these measures has eroded, with governments across the
industrialized world chipping away at progressive spending, taxation and labour rights (see Box 4).

Most of the highest-ranked non-OECD countries in the CRI are in Latin America, the most unequal
region in the world (see Box 3). They are headed by Argentina, followed by Costa Rica and
Brazil. In the last decade, in all of these countries, governments have made strong efforts to
reduce inequality and poverty through redistributive expenditure and (in some) by increasing
minimum wages. In Argentina, for example, the Gini coefficient fell from 0.51 in 2003 to 0.41 in
      31
2013 and the poverty rate fell from 23% to 5.5%, with 40% of the reduction in inequality and
                                                               32
90% of the reduction in poverty due to redistributive policies. Unfortunately, however, the new
governments in Brazil and Argentina have already moved to reverse many of these policies. In
                                                        33                                 34
Brazil social spending has been frozen for 20 years. In Argentina, government austerity has
                                                                  35
led to sweeping cuts in the social protection budget (see Box 3).

Lower-middle-income countries (LMICs) can also show strong commitment to reducing
inequality. The CRI 2018 shows that Lesotho, for example, spends 14% of its national budget
on education and 12% on health, and has a progressive tax structure as well as progressive
policies on trade unions and women’s labour rights; Georgia has strong and progressive social
spending and progressive tax collection and has implemented big increases in education
spending. Low-income countries can also demonstrate strong commitment to tackling
inequality. For example, since the 2017 CRI, Ethiopia has increased its budget for education to
23% from 22%, the sixth highest proportion in the world. This continued high investment has
                                                                    36
seen the numbers of children going to school increase dramatically.

8                                                         Commitment to Reducing Inequality Index 2018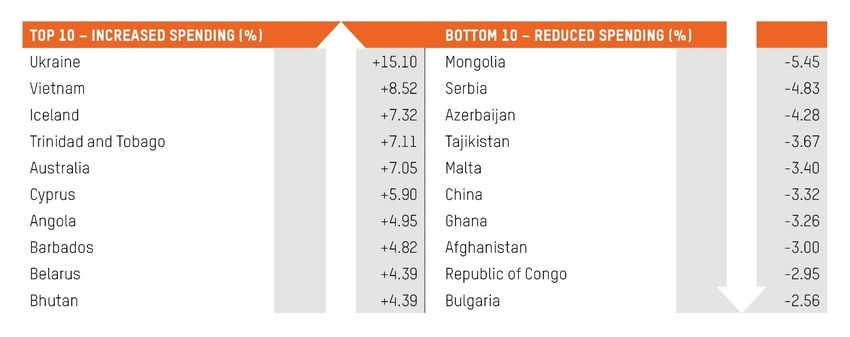
Namibia remains one of the highest-ranked African countries in the Index and is fifth among the
middle-income countries. It is a good example of the difference between a country’s CRI
ranking and traditional measures of inequality. Despite being one of the most unequal countries
in the world, its high CRI score reflects the commitment of the Namibian government to reducing
inequality, particularly through its high levels of social spending (with secondary education free
for all students) and some of the most progressive taxation policies. Its commitment has been
recognized by economist Joseph Stiglitz and others and, although inequality remains very high,
it has been continually reducing inequality since 1993 and is no longer the world’s most unequal
          37
country. Since CRI 2017, the government has increased spending on social protection and
has also increased the minimum wage substantially, and a new study has shown that its
                                                                       38
taxation and spending policies are reducing inequality significantly.

WHICH COUNTRIES HAVE IMPROVED THEIR
PERFORMANCE SINCE LAST YEAR?
While we cannot make a general comparison of last year’s rankings with this year’s, due to
improvements in methodology, we have been able to carry out a detailed analysis of countries
that have made significant positive or negative policy moves. The most positive story this year
across all three pillars is from South Korea.

    Box 2: Showing real commitment to reduce inequality – South Korea

    President Moon Jae-in took office in early 2017, promising to tackle inequality in South
    Korea. The country’s inequality levels have been increasing rapidly. Over the past two
    decades the income growth of those at the bottom has stagnated while the top 10% have
    seen their incomes grow by 6% each year, so that they now lay claim to 45% of national
            39
    income. South Korea comes second to bottom of the OECD countries in the CRI Index.
    To pursue a reduction in inequality and an increase in inclusive growth, President Moon
    has acted in all three areas measured by the Index. He has committed to dramatically
    increasing the minimum wage and in his first year in office has delivered, increasing it by
           40
    16.4%.
    He has also increased taxation on the most profitable and largest corporations in South
    Korea, raising their corporate income tax (CIT) rate from 22% to 25%, which is expected to
                                          41
    raise revenues of US$2.3bn annually. He has also raised income tax for the highest
                                                              42
    earners, a move that had the support of 86% of Koreans.
    Finally, he has embarked on a programme of expanded welfare spending. South Korea
                                                            43
    has some of the lowest welfare spending in the OECD. President Moon has increased
                                                                       44
    spending, including provision for a universal child support grant.
    In an address to the UN General Assembly on 21 September 2017, President Moon
    stated: ‘As of now, my Administration is pursuing bold measures to change the economic
    paradigm in order to deal with economic inequalities that stand in the way of growth and
                                                                           45
    social cohesion…. This is what we call a “people-centered economy”.’

The CRI 2018 also shows that there are quite a number of other governments which have taken
clear steps in one or more of the CRI Index policy areas since the CRI 2017, demonstrating that
progress is possible. Indonesia stands out for its moves to increase the minimum wage
substantially and to equalize it across the country, and in its move to increase spending on
health, to help finance the move towards universal health coverage (UHC), although at 7% of
the government budget, Indonesia still needs to increase this substantially in the coming years
to deliver health for all. Mongolia and Guyana have substantially increased income tax for high
earners, and Mali and Colombia have increased taxes on corporates significantly. Colombia

9                                                       Commitment to Reducing Inequality Index 2018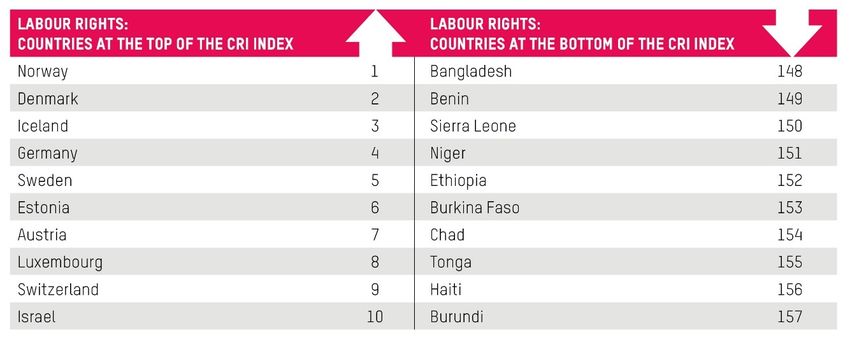
has also increased health spending, although the privatization of the health system and
                                                         46
corruption scandals undermine the value of this increase. Colombia has also extended
maternity leave. Mozambique has increased maternity leave by 50%.

Iceland has given social protection a big increase and has passed a law requiring companies to
                                                                             47
obtain official certification that they are paying women and men the same. Guinea and Liberia
have both increased education spending significantly, although in the case of Liberia this is
                                                                               48
likely to be linked to its controversial moves to privatize primary education.

The new president of Sierra Leone, Julius Maada has made some promising steps to tackle
inequality. The minimum wage has been increased, as has personal income tax, and new steps
taken to improve tax collection, including cracking down on unnecessary tax incentives. His
                                                                        49
recent move to make primary education free is particularly encouraging.

WHICH COUNTRIES ARE DOING WORST?
Table 2: CRI Index ranking out of 157 countries – the 10 countries at the bottom of the
Index

The degree to which rich OECD countries are using government policy to tackle inequality
varies dramatically. The USA and Spain among the major economies, for example, are much
further down the list of rich countries in the CRI Index

As this report highlights, many middle-income countries (MICs) have the scope to do far more to
tackle inequality than they are doing currently. For example, Indonesia today is richer in terms
                                                                                          50
of per capita income than the USA was when it passed the Social Security Act in 1935. Yet
Indonesia has some of the lowest tax collection rates in the world, at just 11% of gross domestic
                                                                                51
product (GDP); the new finance minister has made increasing this her priority. Recently, a
paper from the Center for Global Development demonstrated that most developing countries
could if they chose raise enough resources of their own through tax to eliminate extreme
          52
poverty. This also echoes Oxfam’s previous research into inequality in the BRIC countries,
                           53
Turkey and South Africa.

India also fares very badly, ranking 147th out of 157 countries on its commitment to reducing
inequality – a very worrying situation given that the country is home to 1.3 billion people, many
of whom live in extreme poverty. Oxfam has calculated that if India were to reduce inequality by
                                                                  54
a third, more than 170 million people would no longer be poor. Government spending on
                                                                                                 55
health, education and social protection is woefully low and often subsidizes the private sector.
                                                                     56
Civil society has consistently campaigned for increased spending. The tax structure looks

10                                                     Commitment to Reducing Inequality Index 2018
reasonably progressive on paper, but in practice much of the progressive taxation, like that on
the incomes of the richest, is not collected. On labour rights and respect for women in the
workplace India also fares poorly, reflecting the fact that the majority of the labour force is
employed in the agricultural and informal sectors, which lack union organization and
enforcement of gender rights.
57
Box 3: Latin America – making a wrong turn
In the past 15 years, Latin America as a region has bucked the trend in terms of reducing
inequality. Although there are, of course, some exceptions, governments in Brazil,
Uruguay, Bolivia, Ecuador and other countries had put in place strong policies to tackle
inequality, mostly by increasing public revenues and social spending and, in some
countries, raising minimum wages. This is reflected in the CRI Index, with a number of
Latin American countries ranking relatively highly.
However, the global economic slowdown since 2010 and the fall in commodity prices (on
which many countries in the region depend) has led to an increase in poverty rates since
2015. In some countries this has combined with a shift of government towards the centre-
right, with less interest in reducing inequality. As a result, inequality reduction is already
slowing.
The impact of these policy changes is yet to show up in the data. Our data for this year for
the Latin America region is 2015, so before these cuts had taken effect. They will show up
in subsequent iterations. Countries taking regressive actions are likely to begin to slip
down the Index unless they make further policy changes, and will start to show contrasts
with those countries in Latin America which remain on a progressive path.
These are just some of the many stories behind the numbers in the CRI Index. There is, of
58
course, a story for every country, and we encourage readers to share them with us.
Which countries have got worse since last year?
Singapore is now in the bottom 10 countries in the world in terms of reducing inequality. This is
partly because of the introduction of the new indicator on harmful tax practices, because
59
Singapore has a number of these. It has increased its personal income tax (PIT) by 2%, but
the maximum rate remains a very low at 22% for the highest earners. Apart from tax, its low
score is also due to a relatively low level of public social spending – only 39% of the budget
goes to education, health and social protection combined (way behind HICs South Korea and
Thailand at 50%). On labour, it has no equal pay or non-discrimination laws for women; its laws
on both rape and sexual harassment are inadequate; and there is no minimum wage, except for
cleaners and security guards.
Hungary this year more than halved its corporate tax rate to just 9%, the lowest in the
European Union. Violations of labour rights have increased, and social protection spending has
60
fallen. Croatia and Egypt both cut their maximum rates of personal and corporate income tax.
Mongolia had the highest cut in social protection spending. It has recently been forced by the
61
IMF to end its universal child benefit, so further cuts could well be on the way. The
Democratic Republic of Congo (DRC) has also cut both education and health spending.
11 Commitment to Reducing Inequality Index 2018WHAT ARE SOME OF THE OVERALL TRENDS
EMERGING FROM THE NEW CRI INDEX?
Overall, the average proportions of government spending going to the three key anti-inequality
social sectors have risen marginally since CRI 2017, from 43.15% to 43.22% of total spending.
The countries increasing their spending the most were Guinea, Georgia, Mauritania, Saint
Lucia, São Tomé and Príncipe, Angola, Ukraine, Kazakhstan, Liberia, Indonesia and South
Korea. In the OECD, key upward movers were Iceland, Portugal and Slovenia.
• Spending on education has risen from an average 14.7% to 14.8% of government budgets.
Significant increases were registered by Georgia, Saint Lucia, Guinea, Saint Vincent and
the Grenadines, the Dominican Republic, Liberia, Uruguay, São Tomé and Príncipe, Bhutan
and Cameroon. DRC, Vanuatu and Singapore saw some of the biggest decreases.
• Spending on health has risen from 10.36% to 10.6% of budgets, with significant increases
by Kazakhstan, Colombia, Lithuania, Georgia, São Tomé and Príncipe, Thailand, Niger,
Jamaica, Lao PDR and Indonesia. Australia and DRC were among the biggest cutters of
health spending.
• Spending on social protection appears to have stayed broadly the same at 18.5% on
average. Within the OECD, Iceland, Australia, Cyprus, Latvia and Portugal have increased
their spending. Since the installation of their new governments, South Korea and Indonesia
have also considerably increased their social protection spending. China, Mongolia and
Serbia saw some of the biggest decreases in spending.
The top 10 spenders and cutters in each area of education, health and social protection can be
found in section 1 on social spending.
The impact of spending on inequality has also increased somewhat, potentially reducing the
62
average national Gini score by 18%, compared with 17.7% in CRI 2017.
There has also been mixed progress on making taxation more progressive:
• On value added tax (VAT), a few countries reduced rates last year (Brazil, Romania and
Trinidad), but just as many increased them (notably Colombia and Sri Lanka). In addition, a
few countries, such as Burkina Faso and Senegal, made VAT exemptions more pro-poor,
and Cambodia increased its minimum threshold for paying VAT, leaving out small traders.
Overall, average rates fell slightly to 15.5%.
• On corporate income tax, global average rates fell very slightly, from 24.65% to 24.48%.
Although 15 countries cut their CIT rates in 2017 compared with only 10 raising them, some
63
of these cuts were limited to smaller companies (e.g. in Australia) which can be positive,
and most cuts were relatively small at under 2.5%. Those cutting rates tended to be more
64
economically significant countries. Hungary stands out as the worst performer for having
cut CIT to 9% from 19%, but several other countries have gradually been introducing cuts
over the last 4–8 years, resulting in major reductions over time in Israel, Norway, Pakistan,
Spain and the UK. On the other hand, Colombia, Mali, Jordan, Greece and Peru were
among those increasing. However, these changes are dwarfed by the USA’s 2018 federal
rate cut from 35% to 21%. This change will appear in next year’s CRI, and the key question
will be whether many countries will follow suit (so far, based on 2018 tax codes, the
opposite seems to be the case, with only Argentina and Belgium cutting CIT, and Burkina
Faso, Ecuador, South Korea, Latvia and Taiwan increasing their rates).
• On personal income tax, average top rates rose very slightly from 30.5% to 30.8% in
2017. Governments increasing top rates in 2016–17 included Mongolia, Guyana, Uruguay,
Austria, South Africa, Jamaica and Zambia. On the other hand, Chile, Croatia and Egypt all
cut their top rates. Countries increasing rates in 2018 (not represented in this year’s Index,
12 Commitment to Reducing Inequality Index 2018but will be in next year’s) include Barbados, Colombia, Ghana, South Korea, Latvia (which
has moved from a flat to a progressive tax structure), the Philippines and Sri Lanka. There
are still two countries with no CIT or PIT (Bahrain and Vanuatu) and two others with no PIT
(Maldives and Oman), all of which therefore have highly regressive tax systems.
However, at the same time as tax rates have been rising, effectiveness in collecting the more
progressive income taxes has been falling. Tax collection effectiveness as measured by
productivity has fallen by around 3%. On the other hand, countries such as Luxembourg, Togo,
Fiji, Japan, Bolivia and Ukraine managed to increase their tax collection considerably in 2017.
Because of this weaker collection, the impact on inequality, or incidence of taxes has also
fallen, so that taxes are likely to be reducing inequality by only 2.7%, down from 3.5% last year.
Clearly a lot more could be done to improve the inequality-reducing impact of taxation. More
positively, though, countries like Morocco, China and Ukraine have also managed to make their
tax collection less regressive, by collecting more of the progressive taxes and less of the
regressive ones.
On labour, much remains unchanged, but there have been positive changes on minimum
wages since last year:
• On labour rights, the Global Labour University reports that there has been a small
65
improvement in country scores from 4.107 to 4.165 on its scale of 1 to 10. This is due
almost entirely to countries that have reduced the number of legal violations of trade union
and worker rights. On the other hand, virtually no countries have improved their laws and
none of the countries which ban independent trade unions has changed its laws (Belarus,
China, Equatorial Guinea, Eritrea, Iran, Iraq, Lao PDR, Libya, Qatar, Saudi Arabia, Sudan,
Syria, Turkmenistan, UAE, Uzbekistan, Vietnam).
• As for women’s rights at work, relatively few countries – only Barbados, Liberia and
Lithuania – have introduced stronger anti-discrimination and equal pay laws since 2015.
This still leaves 27 and 23 countries respectively without such laws. Unlike general labour
rights, there is no global system for measuring whether such laws (and the laws measured
in the new CRI 2018 indicator on violence against women) are actually being implemented
66
and are improving women’s lives.
• There has been much more progress on parental leave, with improvements in at least 13
countries. Notable among them are Bhutan and India, which doubled both maternity and
paternity leave in 2016 and 2017 respectively; Mozambique, which increased maternity
leave by 50%; and Paraguay, which will increase the proportion of prior salary paid from
75% to 100% from November 2018. Colombia, the Dominican Republic and Israel have
increased maternity leave by small periods (although for the Dominican Republic this has
taken 15 years since ratifying the relevant ILO convention), Cyprus has introduced 14 days’
paternity leave and compared with 2016, Spain more than doubled paternity leave to 35
days in 2017, adding one more week in 2018. New Zealand is gradually increasing
maternity leave from 18 to 26 weeks by 2022, and there are ongoing parliamentary efforts in
Guyana and the Philippines to reach the same levels. There are still five countries (Lesotho,
Papua New Guinea, Suriname, Tonga and the USA) that have no statutory paid parental
leave for all employees.
• More than half of countries have increased their minimum wages more rapidly than per
capita GDP. The most dramatic increases include those in Korea and Indonesia (which
have increased the minimum wage by 16% and 9% respectively) and in Burkina Faso,
Madagascar, Mali, the Gambia, Kiribati, Sierra Leone, Timor-Leste, Ecuador, El Salvador
and Costa Rica. A few OECD countries have also increased minimum wages considerably:
Portugal, Malta and Japan. Other countries are taking dramatic steps to change their
systems: Indonesia is trying to equalize wages by increasing them more rapidly in poorer
13 Commitment to Reducing Inequality Index 2018regions, Austria supplemented its industry-specific bargaining with a nationwide minimum
wage last year, and India introduced a nationwide floor to try to limit regional divergences.
Other countries are in the process of introducing national minimum wages (e.g. South
Africa, planned for 2019 and its content remains hotly debated) or least for some sectors
(e.g. Cambodia for the textiles sector). This puts pressure on countries which do not yet
have minimum wages (like Djibouti, South Sudan) or which limit them to specific sectors
(Cambodia, Saint Lucia, Singapore, Tonga, Jordan).
In addition to these trends since last year, the following general conclusions made in 2017 still
stand:
• Many countries are doing relatively well on the scale of social spending. The overall average
for all 157 countries is that they are spending more on social protection (18% of budgets
overall) than on education (14.8%) or health (10.6%). The average spending levels for
education and health are still well below the political commitments to which many countries
have signed up, as part of the Abuja and Incheon Declarations (20% and 15%
67
respectively). In most low- and lower-middle-income countries, social protection spending
also remains well below the levels needed for basic social protection floors, as estimated by
68
the Bachelet Commission (3–5% of GDP). Most countries across the world still need to
increase their spending on all three sectors dramatically.
• Many countries are doing rather poorly in ensuring that their social spending benefits their
poorest citizens more than the wealthy and thereby reduces inequality. In 85 of the countries
analysed, social spending is reducing the Gini coefficient by less than one-tenth. Countries
need to do much more to ensure that their social spending reaches the poorest citizens
through universal, free public provision, which is the best way to reduce inequality
• On tax, corporate taxes have fallen slightly from last year’s CRI to this year’s, and a number
of economically significant countries have already made – or are planning to make – cuts to
their corporate tax rates, as the broad pattern of the race to the bottom on corporate tax
rates continues. Personal income taxes have risen a little, but the long-term trends are
unclear. Reversing the race to the bottom means making both PIT and CIT more progressive
and ensuring higher rates of collection from richer individuals and companies. Rates of the
much less progressive VAT have stopped rising, having reached high levels in many
countries. It remains to be seen whether the huge income tax cuts announced in the USA’s
2018 budget will provoke a round of copycat measures elsewhere. It remains essential in
many countries to ensure that rates of progressive taxes are higher, and to make VAT less
regressive by exempting basic foodstuffs and small traders.
• Most countries are also doing very poorly on collecting personal and corporate income taxes,
with collection levels averaging well below 15%, compared with 40% for VAT. To improve
the impact on inequality, countries need to collect a much higher proportion of their potential
corporate and personal income taxes, by clamping down on exemptions for large
corporations and deductions for rich individuals, renegotiating tax treaties and ending the era
of tax havens.
• On labour, the average minimum wage is only just over half of national GDP per capita. Over
80% of the 157 countries have laws mandating equal pay and non-discrimination in hiring by
gender (a much higher figure than last year due to new primary research); but only 45% and
40% respectively have adequate laws on sexual harassment and rape, and these gender
equality laws are poorly enforced in almost all countries. Countries are only scoring 6.4 out
of 10 (on average) on the CRI labour rights indicator, with a much lower score on
enforcement than on the existence of laws. In addition, across the world, 8% of the
workforce have no labour rights because they are unemployed, while 38% often have
minimal labour rights because they work in the informal sector. A further 35% have reduced
rights due to non-standard employment contracts. Countries need to increase their minimum
wages, reinforce gender equality laws, implement labour rights laws much more rigorously
and extend labour rights and minimum wages to employees on non-standard contracts.
14 Commitment to Reducing Inequality Index 2018The patterns vary dramatically for countries with different levels of income.
• Developing countries are spending 16% of their budgets on education, compared with only
12% among OECD countries. However, the lower a country’s income, the less it spends on
health (8% for low-income countries compared with 15% for OECD countries) and on social
protection (7% for low-income countries compared with 37% for OECD countries).
• Developing countries (especially low-income countries (LICs)) often have a more
progressive tax system on paper than OECD countries because of VAT exemptions for basic
goods and small traders, and higher corporate tax rates. Nevertheless, OECD countries
reduce inequality more effectively because they are better at collecting income taxes. There
are different priorities here for different countries, according to their level of income:
developing countries (especially MICs) should collect more personal and corporate income
taxes; OECD countries need to improve their tax structures (enhance pro-poor exemptions
from VAT and reverse the race to the bottom on corporate tax rates); and OECD countries
and upper-middle-income countries (UMICs) must end harmful tax practices that affect the
ability of other countries to collect corporate taxes.
• OECD countries generally score much higher than developing countries on labour and
gender rights – especially on the existence of relevant laws and paid parental leave. On the
other hand, low-income countries perform best on statutory minimum wages, due to far-
sighted minimum wage increases by a small number of governments (albeit potentially
undermined by poor enforcement). A large number of developing countries still need to
adopt and enforce laws guaranteeing labour and gender rights, while many OECD and
middle-income countries need to focus on increasing minimum wages.
LIMITATIONS OF THE CRI INDEX
The CRI Index can only ever be a simple tool that gives one measure of how countries are
fighting inequality. The subsequent sections discuss the specific limitations of each of the three
pillars, but there are also some overall limitations that are worth mentioning here.
What is clear is that the Index can never substitute for context-specific knowledge and the story
of each country’s path to reducing inequality, or for detailed analysis of each government’s
proposals or positions. Wherever possible, DFI and Oxfam have worked with colleagues in each
country to ensure the most accurate representation of their government’s efforts, and in many
countries Oxfam continues to work on detailed country reports on inequality that are far more
comprehensive. In the online tool accompanying the Index, many countries have added
additional narrative sections with links to the work they are doing to combat inequality at country
levels.
Nevertheless, in a broad index such as this, some individual countries may be unfairly praised
(see Box 4), while others may be unfairly penalized. But on balance, DFI and Oxfam consider
that the Index provides a strong foundation from which to gauge the commitment of a
government to tackle the inequality crisis.
15 Commitment to Reducing Inequality Index 2018Box 5: Trading on past glories – when is commitment not commitment?
DFI and Oxfam have called this index the Commitment to Reducing Inequality (CRI) Index
because we want to highlight the purposeful and proactive role that committed
governments can play in tackling inequality. Nevertheless, this is not without its problems.
Although we use the most up to date data we can, it can mean that some governments
may be receiving credit for commitments based on policies or approaches developed by
previous administrations. In some cases, current governments actively oppose these
policies and are seeking to undo them.
In a significant number of rich countries, many of the policies that have seen them perform
well were actually put in place in a previous era and are now under serious threat. In the
UK, for example, while the key hallmarks of the welfare state such as the National Health
Service remain in place and contribute to a relatively good ranking, recent governments of
69
all parties have been nervous about reducing inequality as a specific aim of government.
Some analysts have highlighted how current tax policies and the recently introduced cuts
70
to welfare benefits will significantly contribute to a forecast increase in inequality.
Denmark comes top of our Index, based on its high and progressive taxation, high social
spending and good protection of workers. However, recent Danish governments have
focused on reversing all three of these to some extent, with a view to liberalizing the
economy, and recent research reveals that the reforms of the past 15 years have led to a
71
rapid increase in inequality of nearly 20% between 2005 and 2015. Germany’s
longstanding welfare institutions significantly reduce inequality. However, since the early
1990s, income gains have predominantly gone to those earning more, leading to increases
in the level of income inequality before redistribution by the state. Regressive tax reforms
over the last 20 years have in turn diminished the redistributive impact of government
72
policy. Together, these factors have led to growing inequality. The French government is
progressively tumbling down in the tax ranking following its tax reform in 2017, taking the
corporate tax down from 33% to 28%. Further cuts should occur soon, with the corporate
tax rate progressively being taken down to 25% by 2022. Together with the removal of the
wealth tax and the increase of regressive taxes, this tax reform in France illustrates the
global trend towards more regressive tax systems. This will be reflected further in the next
iteration of the Index as the impact on revenues is felt.
Equally, across Latin America, new governments have been elected that are not as
committed as their predecessors to reducing inequality and are even (in some cases)
taking steps to reverse progressive policies.
Nevertheless, the majority of the data that have been collected for the Index are recent and
are based on budgets, which means that the Index can be updated each year, with
countries moving up or down the rankings depending on changes in their policies. If a
country substantially increases the minimum wage or boosts education spending in the
next budget, then it will be rewarded with an increased CRI Index score. Over time, this will
enable a more accurate assessment of the commitment of governments.
The CRI Index focuses mainly on redistributive actions that governments can take, rather
than those that would prevent rising inequality in the first place. While it looks at how a
government can intervene to make the labour market fairer, it does not, for example, look at
corporate governance (to reduce excessive shareholder control of the economy), land
redistribution or industrial policy as ways to ensure greater equality. The situation in countries
such as South Africa, which has rising levels of inequality despite a relatively good score on the
Index, can only be explained by looking at these structural issues. Oxfam’s recent papers, An
73 74 75
Economy for the 99%, and Reward Work, Not Wealth also address these issues directly.
Data constraints have prevented the inclusion of these structural policies and many
other suitable indicators, because the Index has aimed to cover the largest group of countries
possible. Many potential indicators have not been used because they do not extend beyond a
16 Commitment to Reducing Inequality Index 2018small range of countries, usually those with higher incomes. A massive, concerted effort to
improve data on inequality and its contributing factors is urgently needed, especially within
poorer countries. Gender-disaggregated data are also essential. Later in this report is a
discussion of some other areas that the Index might explore in subsequent versions.
Finally, the CRI Index does not aim to cover all actors in the fight against inequality.
Other key players – notably the private sector and international institutions such as the World
Bank and the IMF – have an important role to play, as do rich individuals. However, while
Oxfam’s campaigns and those of its allies target all of these actors, governments remain the
key players. Democratic, accountable government is the greatest tool for making society more
equal, and unless governments across the world do much more in these three policy areas,
there will be no end to the inequality crisis.
AREAS FOR IMPROVEMENT AND FURTHER
DEVELOPMENT
Economic inequality and gender
Within each of the three areas – spending, tax and labour rights – action to combat economic
inequality overlaps significantly with action to combat gender inequality. Gender inequality is
exacerbating the growing gap between rich and poor, while growing inequality is in turn making
the fight for gender equality harder in countries across the world. Oxfam has shown in its recent
76
papers that the fight against economic inequality is inextricably linked with the fight against
gender inequality. Women are hardest hit by regressive taxation and by low or regressive public
spending, and they are consistently among the worst paid in the most precarious jobs, while
both laws and social conventions limit their ability to organize for their rights. They also provide
the majority of unpaid care work and so are most affected when public services are
inadequately funded, further entrenching inequality.
Each section of this report has specific sections on gender. Sadly, the availability of data allows
for specific indicators only in the labour pillar. This year we have added two more indicators to
this pillar, so it now has indicators on parental leave and legal protections for equal pay, gender
discrimination, sexual harassment and rape. While there are datasets with gender-related
statistics available (such as the World Bank’s Women, Business and the Law database and the
OECD’s Social Institutions and Gender Index), unfortunately we were not able to use some or
all of the data due to issues with their reliability and age, nor could we carry out an exhaustive
corroboration of the gender indicators with our country programmes for this version of the Index
due to time constraints. There are also not currently enough reliable data for enough countries
to look at either spending or taxation from a gender perspective for the purposes of this Index.
Only relatively few countries have engaged in sustained gender budgeting, so no overall
comparative assessment is possible of the degree to which tax and spending policies fight
gender inequality, although the benefits of gender budgeting are well documented.
However, there are upcoming initiatives to close the gender data gap, whose data may be used
to bolster future iterations of the CRI Index. For example, UN Women is helping to collect data
related to gender-responsive budgeting, specifically on the SDG indicator that tracks public
allocations for gender equality and women’s empowerment. They are also working with the
United Nations Statistics Division on the Evidence and Data for Gender Equality (EDGE)
initiative to improve the integration of gender issues in statistics. Oxfam strongly supports efforts
to increase both gender-responsive budgeting and the collection of gender-disaggregated data,
as the gender data gap can prevent countries from understanding the effects of inequality on
women and girls, leading to the creation of programmes and policies that are gender-blind and
ultimately further reinforcing gender inequality.
17 Commitment to Reducing Inequality Index 2018You can also read