Analysis of Single Molecule Fluorescence Microscopy Data: a tutorial
←
→
Page content transcription
If your browser does not render page correctly, please read the page content below
Analysis of Single Molecule Fluorescence Microscopy Data: a
                                                                              tutorial
                                                                        Mohamadreza Fazel1,2 and Michael J. Wester1,3
                                                              1
                                                                Department of Physics and Astronomy, University of New Mexico,
                                                                               Albuquerque, New Mexico, USA
                                                      2
                                                        Center for Biological Physics, Department of Physics, Arizona State University,
arXiv:2103.11246v2 [physics.bio-ph] 22 May 2021

                                                                                    Tempe, Arizona, USA
                                                           3
                                                             Department of Mathematics and Statistics, University of New Mexico,
                                                                               Albuquerque, New Mexico, USA

                                                                                                   Abstract
                                                            The diffraction of light imposes a fundamental limit on the resolution of light microscopes.
                                                        This limit can be circumvented by creating and exploiting independent behaviors of the sample at
                                                        length scales below the diffraction limit. In super-resolution microscopy, the independence arises
                                                        from individual fluorescent labels switching between dark and fluorescent states, which allows the
                                                        pinpointing of fluorophores either directly during the experiment or post experimentally using a
                                                        sequence of acquired sparse image frames. Finally, the resulting list of fluorophore coordinates
                                                        is utilized to produce high resolution images or to gain quantitative insight into the underlying
                                                        biological structures. Therefore, image processing and post-processing are essential stages of
                                                        super-resolution microscopy techniques. Here, we review the latest progress on super-resolution
                                                        microscopy data processing and post-processing.

                                                  1     Introduction
                                                  Some ancient Greeks believed that vision was due to light rays originating from the eye and traveling
                                                  with infinite speed. Ibn al-Haytham, latinized as Alhazen (965 AD-1040 AD) explained that eyesight
                                                  was due to light which comes to the eyes from objects. He also described the optical properties of
                                                  convex glasses in his Book of Optics [1]. The works of Alhazen were introduced to European
                                                  scholars such as Roger Bacon (1219 AD-1292 AD) via Latin translations. The use of convex lenses
                                                  as eye-glasses dates back as far as the 13th century in Europe. Telescopes and microscopes came
                                                  into existence in the 17th century and credit is often given to the Dutch scientists Zacharias Janssen
                                                  (1585 AD-1638 AD) and Hans Lippershey (1570 AD-1619 AD) [2]. Robert Hooke (1635 AD-1703
                                                  AD) was the first person that wrote a book on microscopes, Micrographia, and was the first person
                                                  to see a cell through a microscope [3].

                                                  1.1     Limits of Light Microscopy
                                                  The diffraction of light emitted by a point source and collected by a microscope lens (objective) has
                                                  an intensity pattern called the Airy disk. In general, the actual pattern may differ from the Airy disk
                                                  due to optical aberrations, etc., and is referred to as a point spread function (PSF). The resolution
                                                  of a microscope is often defined as the minimum separation between two emitters in which they can
                                                  still be recognized as individual point sources of light by the microscope user. In 1873, Ernst Abbe
                                                  defined resolution as the inverse of the maximum spatial frequency passed by the microscope, which

                                                                                                        1
gives a resolution distance of [4]
λ
d= (1)
2Na
where λ and Na are, respectively, the wavelength of light and the numerical aperture of the micro-
scope (Na = n sin θ, where n is the refractive index of the medium and θ is the maximum angle of
of the light rays that can be collected by the microscope). For visible light, λ ∼ 600 nm, and for a
typical objective, Na ∼ 1.5, so the resolution is approximately 200 nm. Other significant limiting
factors of light microscopy are that only strongly refractive objects can be imaged effectively, the ob-
jective lens only collects a small portion of light/information from the sample, and the contribution
of unwanted out of focus light from parts of the specimen outside the focal plane.
In the beginning of 20th century, the realization of fluorescence microscopy was a major break-
through in the examination of living organisms since these organisms are mostly transparent and
only reflect a very small portion of light [5]. The advent of fluorescence microscopy was an impor-
tant step in overcoming the substantial limit of weak refractivity of the sample. Illumination and
optical techniques, such as the confocal microscope [6], total internal reflection fluorescence (TIRF)
microscope [7], two-photon microscopy [8], 4-pi microscope [9], structured illumination microscopy
(SIM) [10], and light-sheet microscopy [11] were developed to reduce the out of focus light and
enhance the resolution and contrast of microscope images. Theses techniques pushed the Abbe
diffraction barrier to its very limits, however, it was not until the end of 20th century that scientists
were able to overcome this barrier and achieve resolutions better than the diffraction limit [12].
2 Wide-field, Point Scanning and Light-sheet Microscopy
The microscopy techniques listed in the previous section can be divided into three main categories,
wide-field microscopy, point scanning microscopy and light-sheet microscopy. In the wide-field ap-
proach, the entire specimen is exposed to a light source and therefore there is fluorescent light from
out-of-focus points/planes, which obscures the underlying structure and reduces the image contrast.
Point scanning microscopes only illuminate a single spot of the sample at a time and use pinholes em-
bedded in the optical setup to considerably reduce the out-of-focus light. In light-sheet microscopy,
the focal plane is illuminated rather than the focal point.
2.1 Wide-field Microscopy
Total Internal Reflection Microscopy. In TIRF microscopy, a beam of light is incident upon
the coverslip at an angle greater than the critical angle of the coverslip, Fig. 1a. At this angle, light
undergoes a total internal reflection and is entirely reflected back from the coverslip. However, an
exponentially decaying electromagnetic wave called the evanescent wave penetrates the sample with
intensity
I = I0 e−z/d (2)
where z, I0 and d are, respectively, depth, the intensity of the evanescent wave at z = 0, and the
effective depth that the evanecsent wave travels within the specimen. d is of the order of the wave-
length, d ∼ λ, and fluorophores further than d from the coverslip will not be effectively activated
and therefore result in an extensive reduction of the out-of-focus light. This approach is simple to
implement and is usually suitable for imaging structures close to the coverslip, z ∼ 0, such as the
cell membrane [7,13]. TIRF microscopy is a wide-field approach, but it provides better contrast due
to the small penetration of the evanecsent wave into the sample, described by (2), and therefore less
out-of-focus light.
2a c
Detector
Laser
Coverslip
Evanescent wave
b d
s
le
n ho
Pi
Excitation laser
Flourescent emission
Dicroic mirror
Lens
Beam-Splitter
Fluorophore
Figure 1: Microscope setups. (a) TIRF microscope: The evanescent wave penetrates to a shallow
depth and do not excite fluorophores far from the coverslip. (b) confocal microscope: The pinholes
used in the excitation and detection arms reduce the out-of-focus light. (c) 4-pi microscope: Two op-
posing objective lenses are used for more efficient collection of the fluorescence light. (d) Light-sheet
microscope: The generated thin sheet of light only illuminates the focal plane and thus decreases
the light form out-of-focus fluorophores.
Structured Illumination Microscopy. One of the barriers of light microscopy is the limited size
of the objective, which prevents collection of all the light/information available from the sample.
The numerical aperture in the denominator of (1) is related to the ability of the objective in col-
lecting light/information. Structured illumination microscopy (SIM) collects more information by
illuminating the sample with a periodic field instead of a uniform field.
A sinusoidal periodic field is usually used in a SIM experiment which has a Fourier transform
with three different spatial frequencies. The fact that a sinusoidal field is represented by more than
one frequency component in the Fourier domain adds complications to the actual problem. However,
for the sake of explanation, we presume that one can generate a field with a single spatial frequency
and employ it for a SIM experiment.
3Assuming that f (x) describes the sample with Fourier transform
Z
F (k) = f (x)e−ikx dx, (3)
the product of f (x) with e−ik0 x , which stands for a periodic field with spatial frequency k0 , leads to
a shift in the frequency domain:
Z
F (k + k0 ) = f (x)e−ik0 x e−ikx dx (4)
Taking advantage of this simple math, one can make more information available through the objective
lens by shifting the frequency plane illuminating the sample by using fields with different spatial
frequencies, Fig. 2.
Images acquired by different illumination fields are then combined to obtain an image with
enhanced resolution. SIM provides a resolution of ∼ 100 nm in the lateral direction [10, 14]. Note
that this is still not breaking the diffraction limit, but SIM permits reconstruction of images with
higher spatial frequencies than allowed by Na , which pushes the diffraction barrier to its very limits.
a c ky e ky
Periodic Fields
ky
k0=k4 k0=k1
k0=0
* =
kx kx kx
k0=k3 k0=k2
b d f
Figure 2: Structure illumination microscopy. (a) The frequencies of the modulated fields used for
illumination. ’∗’ shows convolution. (b) Original monkey image. (c) The Fourier transform of the
monkey in (b). The objective is only able to collect the frequencies inside the green circle. (d) The
reconstruction of the monkey employing the frequencies inside the circle. (e) The area within the
green curve contains the frequencies collected making use of the structure illumination. (f) The
monkey reconstruction using the frequencies within the green curve in (e).
42.2 Point Scanning Microscopy
Confocal Microscopy. In the wide-field illumination approach, the entire sample is exposed to a
beam of light and out-of-focus fluorophores are activated as well as in-focus fluorophores. The light
from the out-of-focus fluorophores interferes with the light from in-focus structures and results in
blurry details of in-focus structures. A confocal microscope uses two pinhole apertures after the light
source and before the camera to reduce the out-of-focus light, Fig. 1b. A single spot of the sample is
illuminated at each time and the specimen is scanned point-by-point to obtain an image of the entire
sample with improved contrast due to the reduction of out-of-focus fluorescence background [6, 15].
4-pi Microscopy. 4-pi microscopy was initially developed as a variant of confocal microscopes,
Fig. 1c. [9, 16]. When a fluorophore is activated, it emits fluorescent light in all directions (solid
angle of 4π), but the light is only collected from one side in a regular microscope. Inefficient light
collection causes an increase in the size of the PSF, particularly in the axial direction, which reduces
the image resolution. 4-pi microscopy makes use of two opposing objectives for either or both of
sample illumination and collecting the fluorescent light [17]. Similar to SIM, 4-pi microscopy permits
collection of more light which yields a larger numerical aperture, Na , giving a better resolution (1).
Due to isotropic light collection, 4-pi microscopy yields an almost symmetric PSF in all directions
and hence is of special interest in 3D microscopy [18].
2-photon and Multi-photon Microscopy. Certain fluorophores can be activated by absorb-
ing two or more photons at the same time. Due to the superposition of the fields from the photons
arriving at the focal point simultaneously, the resulting focal point has a smaller size. Therefore, the
out-of-focus fluorophores are less likely to be activated, which reduces the out-of-focus fluorescent
light. In this approach, the specimen is scanned point by point to acquire an image of the whole
sample with enhanced contrast [8, 19].
2.3 Light-sheet Microscopy
In light-sheet microscopy, a thin sheet of laser beam is generated and used to illuminate the in-focus
plane and then a wide-field light collection approach is used to collect the fluorescent light from the
fluorophores within the focal plane [11,20]. The illumination and light collection are in perpendicular
directions, Fig. 1d. Two common approaches to generate a thin layer of light are using a cylindrical
lens or rapid movement of the focal point across a plane [20]. Because the out-of-focus fluorophores
are not illuminated, the out-of-focus light is at a minimum and also photo-damaging is less for the
fluorophores. This approach has been widely adopted for 3D-imaging of samples by imaging one
plane of the sample at a time.
3 Super-resolution Microscopy
Fluorescence microscopy techniques along with various illumination and light collection methods
pushed the diffraction limit to its extreme. For example, TIRF microscopy, confocal microscopy,
2-photons microscopy and light-sheet microscopy were developed using different illumination tech-
niques to eliminate spurious fluorescent light from out-of-focus fluorophores. SIM and 4-pi mi-
croscopy employ light collection techniques to gather more information from the emitted fluorescent
light to increase the numerical aperture and obtain better resolutions. However, these techniques do
not break the diffraction limit resolution and the resolution still depends on the size of the PSF. The
microscopy approaches that break the diffraction limit barrier are called super-resolution microscopy
or nanoscopy [21–27]. Super-resolution techniques achieve sub-diffraction resolution by creating inde-
pendent behavior for individual dyes at scales below the diffraction limit. Many super-resolution pro-
cedures use the reversible switching property of some fluorescent probes between a fluorescent state
5and a dark state to obtain sub-diffraction limit resolution. These approaches can be classified into
two different groups based on how they switch the probes between the dark and fluorescent states:
targeted switching procedures and stochastic switching procedures. The microscopy techniques un-
der the first category are STimulated Emission Depletion (STED) microscopy [12,28], Ground State
Depletion (GSD) microscopy [29], REversible Saturable Optically Linear Fluorescence Transition
(RSOLFT) microscopy [30] and Saturated Structured Illumination Microscopy (SSIM) [31]. These
techniques deterministically switch off the fluorophores in the diffraction limited vicinity of the target
fluorophore to accomplish sub-diffraction resolution. Stochastic Optical Reconstruction Microscopy
(STORM) [32], direct Stochastic Optical Reconstruction Microscopy (dSTORM) [33], Photoacti-
vated Localization Microscopy (PALM) [34], Fluorescence Photoactivation Localization Microscopy
(FPALM) [35], Super-resolution Optical Fluctuation Imaging (SOFI) [36] and DNA-Point Accumu-
lation for Imaging in Nanoscale Topography (DNA-PAINT) [37, 38] can be categorized as stochastic
switching techniques. These approaches activate a small random subset of the probes to avoid
simultaneous fluorescent light from more than one probe in a diffraction limited region.
3.1 Targeted Switching Super-resolution Microscopy
Stimulated Emission Depletion Microscopy. In STED, the specimen is simultaneously illumi-
nated by two sources of light. The first source of light is used to excite the fluorophores and the
second one restricts the fluorescent emission [12]. When a fluorophore in an excited state encounters
a photon with the same energy as the difference between the excited state and ground state, it can
emit a photon and return to the ground state via stimulated emission. The beam profile of the
second laser has a donut-like shape where the intensity of light is almost zero in the middle and the
chance for stimulated emission is very small. Therefore, fluorophores in the surrounding region will
be depleted and fluorescent emission only occurs in the middle. The resolution is given by the size
of the middle area with zero intensity. The diameter of this region (resolution) is given by [39, 40]
λ
d= p (5)
2Na 1 + Is /I
where I and Is are the intensity of the laser used for suppressing the spontaneous fluorescent emission
and the saturation intensity. The stimulated emission depletion of the exited state has to compete
with the fluorescence decay of this state, and the fluorescence decay is overcome at the saturation
intensity, Is . Higher laser power gives a smaller hole in the center of the donut-like laser profile and
thus better resolution. This technique bypasses the diffraction limit and achieves resolution of 20-50
nm [41–43]. Advantages of STED are computational post-processing is not required, and two chan-
nel imaging is easy to implement [44]. Disadvantages of this technique are long image acquisition
time and high power lasers, such as pulsed lasers.
Ground State Depletion Microscopy. GSD is another approach that makes use of patterned
excitation to achieve sub-diffraction resolution [29]. Fluorophores have singlet and triplet spin excited
states with spins of zero and one, in turn [45, 46]. In this technique, a triplet spin state is employed
as the dark state rather than the ground state, Fig. 3.
A first laser excites the fluorophores to the singlet state, S1 . A second laser is then utilized to
pump the electrons from S1 to the triplet state T1 outside the region of interest (ROI). The lifetime
of the triplet state, T1 , is much longer than that of the singlet state, S1 , because transition from the
triplet state to the ground state, S0 , with spin zero is prohibited by angular momentum conservation.
Therefore, the electrons in the triplet state do not emit fluorescent light. GSD requires lower intensity
for depletion and has a smaller threshold intensity Is (5) than STED [47]. This super-resolution
scheme has yielded resolutions better than 20 nm [48].
6Figure 3: Energy levels in a fluorophore. The ground state, S0 and the excited state, S1 are singlet
spin states. T1 is a triplet spin state, which has a long liftime and is used as a dark state in GSD.
Reversible Saturable Optically Linear Fluorescence Transition Microscopy. RESOLFT
is a more general approach that uses any fluorophore with a dark state and a bright state with
reversible switching between the two states to accomplish super-resolution [30]. STED and GSD are
specific cases of RESOLFT where the ground state, S0 and the triplet state, T1 , are the bright and
dark states, respectively, Fig. 3.
Saturated Structured Illumination Microscopy. SSIM uses a high power laser with a sinusoidal
spatial pattern to deplete the ground state of fluorophores. The generated pattern has very narrow
line-shaped dark regions with sub-diffraction widths. The dark lines can later be exploited to retrieve
features of the sample with sub-diffraction resolution.
3.2 Stochastic Switching Super-resolution Microscopy
3.2.1 Single Molecule Localization Microscopy
A high-resolution image of a structure, for example, a cellular organelle, can be reconstructed from
fluorophore positions, Fig. 4. This is the foundation of Single Molecule Localization Microscopy
(SMLM) super-resolution approaches, such as STORM [32], PALM [34] and FPALM [35], conceived
by different groups around the same time, and other variants introduced later [33, 37, 38, 49–57].
A fluorophore in its fluorescent state emits N photons that form a PSF pattern on the camera.
The PSF can be used to localize the fluorophore with a localization precision much better than the
diffraction limit [58, 59]
σPSF
σ= √ (6)
N
where σ and σPSF are the localization precision and size of the PSF, respectively. However, two major
detriments to accurate and precise localizations are overlapping PSFs when multiple fluorophores
in close proximity are activated [60, 61], and small photon counts per blinking event, which leads to
low signal to noise ratio.
SMLM super-resolution approaches were originally demonstrated by making use of a wide-field
illumination method to activate a sparse subset of fluorescent probes that can be stochastically
switched between a dark and a fluorescent state. Sparse activation is necessary to prevent activation
7of more than one fluorophore in a diffraction limited area and avoid overlapping PSFs [32–35,49–51].
Some other SMLM approaches overcome the problem of overlapping PSFs by separating the fluores-
cent signals from molecules with different emission spectra [52–54] or lifetimes [62]. Photo-bleaching
of fluorophores has also been employed to achieve low density images of PSFs with minimum over-
laps [55, 56]. Another promising SMLM technique is based on stochastic binding and unbinding of
the diffusing fluorescent emitters to the target, such as DNA-PAINT [37, 38, 57], and lifeact [63, 64].
The sparsity constraint results in a small subset of activated fluorophores and therefore a few
localizations per frame. On the other hand enough localizations are required to obtain high-resolution
images [65], which demands undesired long data acquisition times [66, 67]. This problem can be
alleviated by multiple-emitter fitting methods that are able to localize emitters in denser regions of
the data [68–70].
For various fluorescent probes, the number of emitted photons per blinking event ranges from a
few hundreds to a few thousands with a few blinking events per probe, where more photons and a
larger number of blinking events are desired for better localization precision and image contrast [71].
Although wide-field techniques are the most common illumination procedures in SMLM ap-
proaches, other illumination methods such as confocal [72], 2-photons [73] and light-sheet [74, 75]
approaches have been utilized to demonstrate SMLM super-resolution microscopy.
Cellular organelle are inherently 3D structures and therefore 3D microscopy images are desirable.
SMLM super-resolution approaches are able to provide 3D images of cellular structures by exploiting
the variance in the PSF shape as a function of axial distance from the focal plane. The variance in
the PSF shape can be achieved by different optical techniques. STORM was first implemented in
3D by using an astigmatic PSF [76]. Later approaches used more complex engineered PSFs such as
double-helix [77], etc. [78–80].
a c e
b d fe
Figure 4: SMLM concept. (a & c) Sample frames of raw super-resolution data. (b) Image recon-
structed using localizations from a single frame. (d) Image reconstructed using localizations from 50
frames. (e) Bright-field image, which is the sum image of 5000 frames of raw super-resolution data.
(f) Super-resolution image reconstructed using localizations from 5000 frames.
83.2.2 Fluctuation Analysis
Super-resolution Optical Fluctuation Imaging (SOFI) is another technique that utilizes stochastic
switching of fluorophores to realize sub-diffraction details of cellular structures. However, this ap-
proach does not reconstruct super-resolution images using probe locations. It employs temporal fluc-
tuation analysis methods to generate images with resolution beyond the diffraction limit [36, 81, 82].
More recently, Super-Resolution Radial Fluctuations (SRRF) has been introduced that takes ad-
vantage of radial and temporal fluctuations in the fluorescent intensity to realize sub-diffraction
information from the sample [83, 84].
4 Image Formation
Raw super-resolution data is comprised of a sequence of image frames, where each frame is a two
dimensional array of pixels whose values are a function of the number of photons captured by the
camera over a fixed exposure time. Photons reaching the camera are often originated from multiple
sources of light: the fluorescent light from in-focus fluorophores that label the target structure, the
fluorescent light from out of focus fluorophores which might be fluorophores bound to undesired
cellular structures, and the autofluorescence of the specimen or other sources of light that exist
in the area. The contribution of the light from sources other than the in focus fluorophores is
unwanted and degrades the quality of images [65,85]. The undesired light reaching the camera gives
rise to two types of background noise, an approximately uniform, homogeneous background, and a
heterogeneous background called structured background [85–88].
For each data frame, a subset of emitters is activated and the image frame is described by
X
Model = Ii δ(x − xi )δ(y − yi ) ∗ PSF(zi ) + b, (7)
i
which is the convolution of the emitter X and Y locations with the PSF plus a uniform background,
Fig. 5. The sum is over the activated emitters. Ii , xi , yi , zi and δ represent the intensity and
location of the ith emitter and Dirac delta, respectively. Note that PSF shape is a function of the
Z-location (offset from the focal plane) of the emitter [86, 89], and hence the out-of-focus emitters
have a different PSF. Some effects like dipole orientation [90, 91], sample movements [92, 93] and
optical aberrations [91, 94] also result in distortions of the PSF. The additive term models the
homogeneous uniform background, while the structured background, usually coming from the out-
of-focus emitters, is mixed with the in-focus emitters and is given by the convolution term.
The pixel values recorded by the camera are not the same as the photon counts, but they are a
function of photon counts. The camera detectors amplify the signal from the detected photons and
multiple photoelectrons are produced per photon, which is used to generate the pixel values [95].
The detector also has Gaussian fluctuations when there is no signal, which is called read-out-noise.
To obtain the correct number of photons, therefore, these two effects have to be taken into account
[96–99]. The pixel values are scaled by the camera gain, which gives the amplification factor, and
the average of the camera offset is subtracted from the given pixel values to get photon counts,
where the Gaussian fluctuations are negligible in most cases [96, 97]. Another major source of noise
is shot noise, which comes from the particle nature of photons and can be modeled by a Poisson
process [59, 96, 100, 101]. Model (7) yields the expected number of photons for individual pixels,
but the number of photons captured by the detector over a fixed exposure time have a Poisson
distribution, Fig. 5.
9a b c
Figure 5: Image Formation. (a) Emitter locations. (b) Model is a convolution of emitter locations
with the PSF. (c) Model corropted with shot (Poisson) noise. The emitters are assumed to be in
focus.
5 Image Processing
Image processing is a key step in SMLM super-resolution approaches. This step is comprised of mul-
tiple stages: pre-processing, identification of candidate emitters, and localization, filtering and image
rendering. The pre-processing step often alleviates the noise introduced during data acquisition, such
as camera and background noise.
Estimation of location and/or intensity of emitters using the point spread function predates the
advent of SMLM super-resolution approaches and had been employed in other scientific disciplines
such as electrical engineering [102–104], astronomy [87, 100, 105, 106], particle tracking [107, 108],
etc. There are two major classes of localization approaches, single-emitter localization algorithms
and multiple-emitter localization algorithms. The single-emitter algorithms are only able to localize
isolated emitters where there is no overlapping PSFs. Single-emitter candidates are usually identified
by applying a threshold to detect local maxima and then ROIs of a certain size including those
local maxima are selected for further analysis [58,101,109,110]. Other common detection algorithms
employ wavelet transform [111–113], different types of filters [60,114] and other detection approaches
[115, 116]. The performance of different detection algorithms is highly correlated with the signal to
noise ratio (SNR) and signal to background ratio. For a comparison of different detection algorithms,
see [117, 118]. The single-emitter localization procedures estimate the locations of the detected
emitters employing either a non-iterative or an iterative algorithm.
Dense regions of data with overlapping PSFs from closely spaced activated emitters, Fig. 5, can be
generated due to either dense labeling of the sample or fast data collection. Multiple-emitter fitting
algorithms localize emitters in the dense regions of the data with overlapping PSFs. Multiple-emitter
approaches may be categorized based on their outputs [68] or based on the algorithm itself [69, 70].
After the localization stage, there is often a rejection step that filters out bad localizations to
reduce the artifacts in the final reconstructions [119, 120]. A popular filtering criteria is based on
the found parameter values and their uncertainties that removes the localizations with uncertainties
larger than given thresholds [32, 88, 119]. An additional filtering approach is based on the nearest
neighbor distances where localizations with less than N neighbors within a certain distance are
eliminated from the final list of localizations [121, 122].
In single-emitter localization approaches, artifacts may arise due to fitting two or more overlap-
ping PSFs as a single emitter. To reduce this effect, the localization algorithms make use of different
criteria for recognizing this type of bad fits, Fig. 6. The filtering of the ROIs, including closely spaced
active emitters with overlapping PSFs, can be done before localization. The ROIs with overlapping
PSFs are identified by a deviation in shape of the bright blob from the given PSF [32]. Another
algorithm recognizes the bad fits due to overlapping PSFs by computing the p-value assuming a
single PSF as the null hypothesis. If the resulting p-values are smaller than a given threshold, the
10fits are rejected [101]. Finally, the remaining localizations are used to reconstruct a super-resolved
image, Fig. 6.
5.1 Background Detection
The ultimate objective of SMLM techniques is reconstructing high resolution images from precise
and accurate [86] estimates of the emitter locations from raw super-resolution data. In order to
accomplish this goal, a correct measure of background noise is required as incorrect background
leads to biased position estimates [68]. The correction of uniform background noise is simple, and
various approaches have been conceived to address this issue. These approaches usually select a ROI
and use that to compute a local uniform background noise as the average of pixel values, median
of pixel values, average of pixel values after bleaching of the fluorophores, Xth percentile of pixel
values or estimating the additive term in (7) using an iterative approach [89, 101, 123–126].
Structured background is significantly more complicated to remove and its presence results in
poor position estimates. A few methods have been put forward to cope with this problem including
an approach that uses a temporal median filter to subtract structured background from the signal
[127]. This technique inspects the fluctuations of pixel values over time to find the background
value. The found background can be overestimated in the dense regions of the data where there is
at least one active emitter at each time. An alternative procedure detects all the emitters regardless
of being signal or background and then sets a threshold and remove the emitters with intensities
below that as structured background [128]. Wavelet decomposition has been employed to subtract
structured background as well as uniform background, prior to emitter detection [129]. Recently, a
deep learning method has been proposed to detect structured background using the PSF shape [85].
Faze1, et al. used a Bayesian approach to model structured background with a collection of PSF-
sized dim emitters [88]. In the field of astronomy, methods such as sigma clipping had been developed
to deal with structured background in dense data sets [87]. In the sigma clipping procedure, the
brightness mean, m, and standard deviation, σ, are calculated and those intensities outside the range
of [m − ασ, m + ασ] are considered noise [87].
5.2 Single Emitter Fitting
The single-emitter localization algorithms can be classified into two major categories: the algorithms
that use non-iterative approaches to localize emitters and the algorithms that use an iterative pro-
cedure. Studies show that the iterative algorithms are more accurate than the non-iterative al-
gorithms [130]. However, iterative algorithms are computationally more demanding and require a
precise PSF model.
5.2.1 Non-iterative Algorithms
Non-iterative algorithms do not need any information about the PSF and are usually fast and easy
to implement. However, they are not as accurate as iterative algorithms that utilize the PSF to
generate a model of the data. The lack of enough accuracy is often a consequence of different types
of noise.
A few non-iterative approaches such as QuickPALM [131] calculate the emitter locations as
center of mass of ROIs containing single emitters [77, 131]. This gives a good estimation of location,
however, failure in background correction results in biased localizations towards the center of the
ROIs. Virtual Window Center of Mass (VWCM) [132] ameliorates this issue by iteratively adjusting
the selected ROI to minimize the separation of the emitter location and the center of the ROI.
FluoroBancroft borrows the Bancroft procedure from the satellite Global Positioning System
(GPS) to localize emitters [111, 133]. This approach uses three pixel values within a PSF to draw
three circles where the emitter is located within the intersection of these three circles. The size of
11the intersection region is a measure of the localization precision. A correct measure of background
is also of great importance in this approach to calculate accurate radii.
Single emitters can also be localized by finding the gradient of the phase of the Fourier transform
of ROIs. For a single emitter, equation (7) reduces to
I(m, n) = I0 δ(x − x0 )δ(y − y0 ) ∗ PSF(z0 ) + b(m, n) (8)
where m and n count rows and columns of pixels in the ROI, and x and y give the centers of those
pixels. The Fourier transform of intensity in pixel k and l is given by
˜ l) = H(k, l) exp −i2π x0 k + y0 l + b̃(k, l)
h i
I(k, (9)
M N
where M and N are the two array dimensions and H is a real function. For data sets with large
SNR, the background term is negligible and Fourier Domain Localization Algorithm (FDLA) gives
the emitter position by the average of the gradient of the phase [134]:
∂φ M ∂φ N
x0 = mean , y0 = mean (10)
∂k 2π ∂l 2π
˜
where φ = arctan Im( I)
˜ . The performance of this approach suffers from the presence of background
Re(I)
noise as well. Another approach localizes single emitters by calculating the first Fourier coefficients
in both X and Y directions, and the phase of these coefficients are then employed to find the emitter
location [135].
Radial symmetry of the PSF has also been employed to calculate emitter locations [114, 136].
Due to the radial symmetry of PSFs, intensity gradient vectors for diefferent pixels converges to the
region with maximum intensity where the emitter is located. This approach is robust in the presence
of uniform background noise and achieves precision close to the Cramer Rao Lower Bound (CRLB).
5.2.2 Iterative Algorithms
Iterative algorithms are the most rigorous approaches for emitter localization. In these approaches,
the parameters in model (8) are adjusted in an iterative manner to fulfill a certain criterion. In
the localization problem, the parameters are (x0 , y0 , z0 , I0 , b), the emitter location, the number
of photons from (intensity of) the emitter and a uniform background noise. The criteria that are
extensively utilized in the emitter fitting literature are the Least Square (LS) difference between data
and model and maximizing the likelihood function via a Maximum Likelihood Estimate (MLE).
Cramer Raw Lower Bound (CRLB) states that the fundamental limit of variance for estimating
a parameter from given data is given by the inverse of the Fisher Information [58,59,137]. Therefore,
the fundamental limit of precision is given by the inverse of the square root of the Fisher Information.
Theoretically, MLE achieves the best localization precision, equivalent to CRLB [59, 86, 94, 101,
137–141]. LS performance is comparable to the MLE under certain conditions described below
[94, 139–142].
The performance of weighted LS approaches that of MLE at high signal to noise ratio, when
the Poisson noise (shot noise) can be well approximated by a Gaussian model, or when read-out
noise is dominant. Note that neither of these scenarios are correct for super-resolution data where
the read-out noise is usually negligible in the presence of Poisson noise and the SNR is not too
high. In general, MLE yields better localization accuracy and is more robust in the presence of PSF
mismatch, but is computationally more complex and requires an accurate model of noise [94, 139].
Least Squares Fitting. The least-squares approaches iteratively vary the parameters of the model
to minimize the sum of differences between the pixel values from the data and the model. This
12difference is given by
X (data − model)2
D= (11)
expected variance
pixel
where in weighted LS the differences are scaled by the expected variance of the noise which scales
the errors for individual pixels [77, 94, 143–146]. A pixel with a high signal is expected to have a
large noise variance and therefore it is allowed to have a larger error in the weighted LS procedure.
However, the scaling factor is replaced by one in the unweighted LS algorithm, which we call LS
hereafter, and does not accommodate noises [58, 110, 147–149]. The developed algorithms use the
Gaussian PSF [58, 94], theoretical PSFs [145, 146] or experimentally acquired PSFs [143, 148] to
make a model of the data. The Levenberg-Marquardt iterative procedure [145, 148, 149] or other
procedures [143] are then employed to iteratively adjust the parameters of the model.
The weighted least square algorithms accomplish accuracies close to the CRLB when the photon
count is high, but the noise variance needs to be known as well as an accurate PSF model. The
PSF mismatch, particularly in the tail of the PSF, results in large errors when scaled by a small ex-
pected noise variance in the pixels far from the emitter [68]. Therefore, the unweighted least square
algorithm is more suitable when a reasonable PSF model and/or noise model are not accessible.
Maximum Likelihood Estimator. The photons from a point-like emitter have an approximate
spatial Gaussian distribution [60, 94, 101, 109, 144, 150, 151] on the camera which can be employed
to calculate the photon counts for different pixels eq. (12). In cases where the Gaussian PSF is
not an appropriate approximation, theoretical PSF models [101, 139, 152] can be used or numerical
PSFs can be obtained from calibration experiments [153–156]. The array of PSF samples is then
utilized to generate a likelihood model of the ROI via either linear or cubic spline interpolation
approaches [154, 156].
Using the Gaussian approximation for a PSF, the photon count is given by
Z xk +0.5 Z yk +0.5
(x − x0 )2 + (y − y0 )2
I0
∆k = exp dx dy (12)
2πσPSF (z0 )2 xk −0.5 yk −0.5 2σPSF (z0 )2
where ∆k , σPSF , I0 , x0 , y0 , z0 , xk and yk are, respectively, the number of photons in the kth pixel
from the emitter, the half width of the Gaussian PSF, total number of photons from the emitter,
the emitter location and the center of the kth pixel.
The total photon count in the kth pixel is the sum of the photons from the emitter and the
uniform background noise
λk = ∆k + b (13)
Equation (13) yields the expected number of photons for pixel k for a fixed exposure time. Con-
sequently, the number of detected photons in pixel k has a Poisson distribution, which gives the
likelihood of the kth pixel
λDk e−λk
Pk (D|θ) = k (14)
Dk !
where θ stands for the set of parameters (θ = (x0 , y0 , I0 , b)). D represents data, which is a two
dimensional array of pixels whose values are related to the number of photons detected by the
camera. Dk selects the kth pixel in D. Since the pixels are independent, the likelihood of the ROI
can be written as the product of the likelihoods of all the pixels in the ROI.
Y
P (D|θ) = Pk (D|θ) (15)
k
The two main iterative algorithms employed in the literature to find the parameters that optimize
the above likelihood are variations of the Newton method [94, 101, 150–152, 154, 155] and a modified
version of Levenberg-Marquardt [60, 144, 156, 157] adopted from LS procedures.
13The Newton approach is employed to find the root of the derivative of the likelihood function
(15), and therefore one needs to calculate the second derivative of the likelihood as well, which is
computationally demanding. On the other hand, the Levenberg-Marquardt algorithm only calculates
the first derivative of the likelihood, which makes it computationally less demanding in comparison
[144, 156]. Different strategies have been exploited to speed up the Newton optimization algorithm
including implementation on Graphical Processing Units (GPUs), which allows parallel analysis
of ROIs [101, 109, 150, 151, 155]; starting from better initial values [139]; and estimating X and Y
positions individually utilizing the separability property of the Gaussian function [151].
5.3 Multiple Emitter Fitting
Raw SMLM super-resolution data is often acquired via a wide-field illumination procedure and the
whole sample is exposed to the excitation laser. Emitter activation is a stochastic process and
hence there will always be activated emitters at close proximity. Therefore, overlapping PSFs are
unavoidable, even under sparse activation conditions. The overlapping PSFs are eliminated in a
filtering step in single-emitter approaches, which results in losing information [138], as well as the
appearance of artifacts, for instance, contrast inversion, Fig. 6.
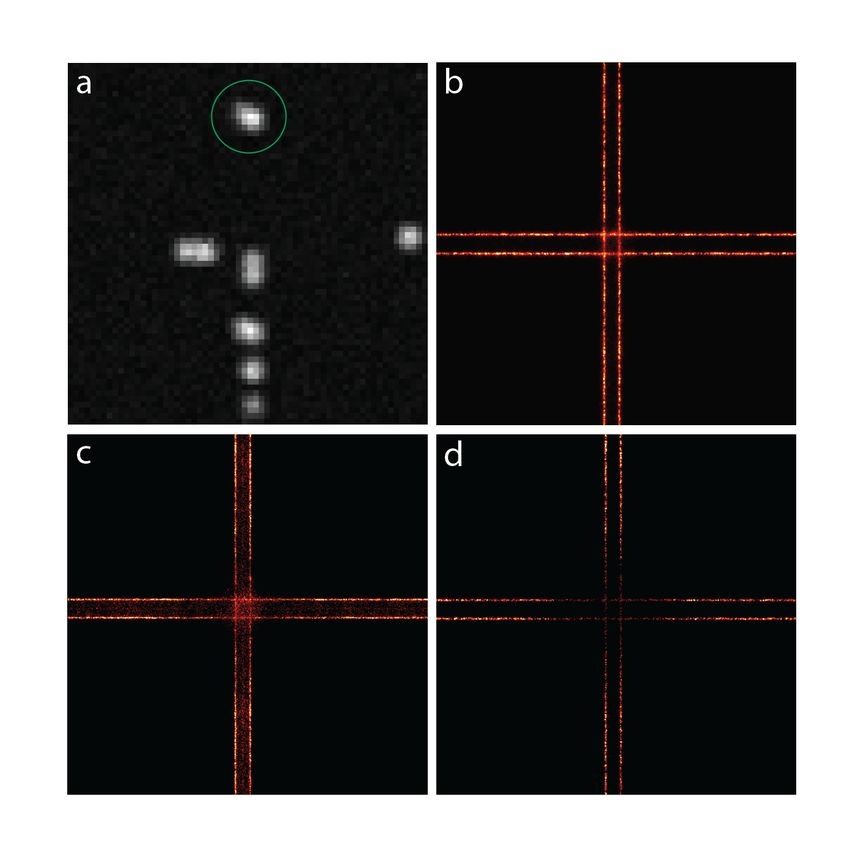
14Figure 6: Reconstructions from dense data with overlapping PSFs. (a) A frame of dense raw super-
resolution data of a cross with parallel lines. The green circle shows an example of two overlapping
PSFs. (b) Reconstruction from multiple-emitter algorithm with no filtering. (c) Reconstruction
from single-emitter algorithm with no filtering. The localizations in the area between the lines are
the results of fitting overlapping PSFs with a single PSF. (d) Reconstruction from single-emitter
algorithm after filtering. The dense regions of data appear sparse when processed with a single-
emitter algorithm due to the inability to localize overlapping PSFs, which is called the contrast
inversion artifact.
The inability of single-emitter algorithms to localize activated emitters in a diffraction limited
vicinity enforces the sparse activation of emitters. This is followed by a long acquisition time to build
a full list of localizations to reconstruct an image with high resolution. In some experiments, such
as studies of live or dynamic samples, fast data acquisition is preferred and hence dense activation
of emitters is inevitable. Therefore, proper analysis of dense super-resolution data with overlapping
PSFs is necessary to reduce data acquisition time, avoid artifacts, facilitate live sample imaging, etc.
Numerous multiple-emitter fitting algorithms have been devised to fit emitters with overlapping
PSFs, some borrowed from other areas, such as astronomy, statistical analysis, etc. The reported
15algorithms employ a very wide range of approaches and have a broad spectrum of performance
[69, 70]. These procedures are often iterative algorithms or include an iterative training step.
5.3.1 Least Squares
The LS algorithm has been employed to fit multiple-emitters in the field of astronomy [87]. It
was modified for SMLM super-resolution microscopy, called DAOSTORM in this context [158].
DAOSTORM uses isolated emitters in the raw data to estimate the PSF and then uses the found
PSF to fit emitters in dense data sets. The algorithm starts with an initial number of emitters
located at the brightest pixels of the ROI, and then uses least squares fitting to localize them with
sub-diffraction precision. Next, the residuum image is calculated by subtracting the model from the
data, and is used to detect new emitters in the pixels brighter than a given threshold. The detected
emitters are then localized to obtain subdiffraction precision. This step is repeated until there is no
pixel with intensity above the threshold in the residuum image.
5.3.2 Maximum Likelihood
The MLE approach that was described before can be modified for multiple-emitter fitting within
ROIs with overlapping PSFs. The total photon counts in the kth pixel is given by
N
X
λk (N ) = b + ∆k,i (16)
i=1
where ∆k,i is the number of photons received in the kth pixel from the ith emitter and can be
calculated using (12). N and b are the number of emitters and the uniform background. The
likelihood of the pixel is then given by
λk (N )Dk e−λk (N )
Pk (D|θ) = (17)
Dk !
The likelihood of the ROI is obtained from the product of the likelihoods of individual pixels (15).
The likelihood (17) has more than one emitter and therefore more parameters to estimate, de-
manding more iterations and computational time. The MLE approach is implemented in the same
manner as single-emitter fitting to estimate the parameters. Nevertheless, there is a new param-
eter, N , the number of emitters, which cannot be directly estimated from the likelihood itself.
The approaches that find the number of emitters are called model selection algorithms. Several
model selection algorithms have been reported along with the MLE localization procedure, including
thresholding of the residuum image [159], p-value of the likelihood ratios [138], Bayesian Information
Criteria (BIC) [160, 161], PSF size and nearest neighbor distance [162] and others [163–165].
The 3D-DAOSTORM [159] is a 3D multiple emitter fitting approach. 3D fitting procedures will
be discussed in the next section and here we explain how this procedure deal with overlapping PSFs.
3D-DAOSTORM fits overlapping PSFs by fitting only choices from the brightest emitters in the
ROI at the beginning. It then subtracts the obtained model from the ROI intensities and uses the
residuum image to find pixels brighter than a given threshold to detect new emitters. It employs
MLE to localize the new emitters. The new emitters are added to the list of detected emitters and
this step is repeated until there is no pixel brighter than a given value.
Simultaneous multiple-emitter fitting [138] starts from one emitter, N = 1, and goes up to
N = Nmax . For each model, this method localizes the emitters employing the MLE approach. The
log-likelihood ratio (LLR) " #
P (D|θ̂)
LLR = −2 log (18)
P (D|D)
16has an approximate chi-square distribution [138], where θ̂ is the parameters that maximize the
likelihood and P (D|D) gives the upper limit of the likelihood. The model with lowest N that meets
a threshold p-value is accepted as the best fit.
The MLE approach suffers from overfitting, and adding more parameters (emitters) tends to
give larger values for likelihoods. Bayesian Information Criteria is a model selection algorithm
that penalizes adding new parameters to an MLE problem. SSM-BIC [160] selects the model that
maximizes the following function
(Data − Model)2
BIC(N ) = + (3N + 1) log (m) (19)
Data
where m is the number of pixels in the given ROI. Note that there are 3N + 1 parameters in a
model with N emitters. This approach has also been implemented on GPUs with ∼100 times faster
computational time [161].
QC-STORM [162] uses a weighted likelihood
Y
PW (D|θ) = Wk Pk (D|θ) (20)
k
to localize emitters, where Wk is the weight of the kth pixel and is smaller for pixels closer to the
edges of the ROI. The weighted likelihood suppresses the signal close to the edges of the ROI and
it is therefore an effective method to localize emitters within ROIs with signal contaminations close
to their edges. QC-STORM identifies ROIs with more than one emitter based on the ROIs’ nearest
neighbor distances and the size of the PSF estimated using weighted MLE. This algorithm has been
implemented on GPUs and is capable of processing very large fields of view.
Some other approaches use an iterative deconvolution algorithm to accomplish maximum like-
lihood employing the Richardson and Lucy procedure [166, 167]. These approaches return a grid
image with finer pixel sizes than the camera pixel size with non-zero pixel values at the emitter
locations rather than returning a list of localizations.
5.3.3 Bayesian Inference
The MLE algorithm suffers from overfitting as discussed above. Bayes’ formula (21) provides an
elegant way to include prior knowledge into the problem, allowing the problem to be restricted to
reasonable number of parameters. It however adds complications to the problem by including more
distributions. It has been shown that the Bayesian approach can achieve localization uncertain-
ties better than those from MLE by inclusion of reasonable prior knowledge [168]. The Bayesian
paradigm is equivalent to MLE when there is no prior knowledge available. The posterior is given
by
P (D|θ)P (θ)
P (θ|D) = (21)
P (D)
where P (θ) and P (D) are, respectively, the prior on the parameters θ and the normalization constant,
Z
P (D) = P (D|θ)P (θ)dθ (22)
called the evidence. Another difference of MLE and Bayesian approaches is that MLE returns fixed
emitter parameters (location and intensity), while the Bayesian procedure returns a probability
distribution, the posterior, for the emitter parameters. A few fully Bayesian algorithms have been
developed for multiple-emitter fitting so far [88, 169, 170], where we discuss two of them here.
The Bayesian multiple-emitter fitting (BAMF) algorithm [88] employs the Reversible jump
Markov chain Monte Carlo (RJMCMC) [171, 172] technique to explore model spaces with differ-
ent dimensions or equivalently different number of emitters, and returns a posterior distribution
17which is a weighted average of different possible models. BAMF uses either a Gaussian PSF model
or an arbitrary input numerical PSF along with an empirical prior on emitter intensities to attain
precise and accurate localizations in dense regions of data. This technique performs emitter fit-
ting, model selection and structured background modeling simultaneously and therefore takes into
account various sources of uncertainties which are often ignored.
The 3B algorithm [169] analyzes the entire data set at the same time by integrating over all
possible positions and blinking events of emitters. This algorithm makes inference about the emitter
locations, intensities, width of the Gaussian PSF and blinking of emitters. The posterior of this
problem is given by
P (D|a, b, M )P (a)
P (a, b, M |D) = (23)
P (D)
where a, b and M represent the emitter parameters, blinking events and the number of emitters,
in turn. 3B uses a uniform prior for the locations and a log-normal prior for other parameters.
The discrete parameter, b, is then integrated out using an MCMC [173] approach to obtain the
posterior distribution of a, P (a, M |D). Next, the Maximum A Posteriori (MAP) is computed using
the conjugate gradient approach to obtain the emitter locations, intensities and PSF sizes. After
that, the parameter a is also marginalized to get the model probability, P (M |D), for model selection.
The 3B algorithm models the entire data set and is able to use all the collected photons from
multiple blinking events to achieve better localization precision. The returned image is a probabil-
ity map of the weighted average of all possible models rather than a selected single model [174].
Moreover, it needs a simple experimental setup for data collection [169]. However, it is reported
that 3B suffers from artificial thinning and thickening of the target structures [169]. This technique
is very slow because calculating the integrals to marginalize parameters a and b is extremely com-
putationally demanding. There have been several attempts to speed up the algorithm including 3B
implementation in cloud computing [175], use of more informative priors [176], and initializing the
algorithm with better starting parameter values [177].
5.3.4 Compressed Sensing
A frame of super-resolution data can be considered as a matrix y
y = Ax + b (24)
where x is the signal, which is an up-sampled discrete grid (image) with non-zero elements at the
emitter locations, A is the PSF matrix and b is the uniform background. The objective is to recover
the non-zero elements of the signal x where most of the elements are zero due to sparse activation
of fluorescent emitters in SMLM microscopy. Compressed Sensing (CS) theory states that a signal
x can be recovered from a noisy measurement y if the signal is sufficiently sparse [178]. This
mathematically can be expressed as
Minimize :||x||1
(25)
Subject to :||y − (Ax + b)||2 ≤
P
where ||x||1 = i |xi | is the L1-norm of the up-sampled image, and the L2-norm of the residuum
image is given by sX
2
||y − (Ax + b)||2 = (yi − (Ax + b)i ) (26)
i
The inequality allows fluctuations from the expected model due to different types of noise.
Various mathematical approaches have been utilized to minimize the L1-norm in the presence
of the given restriction in (25) including the convex optimum algorithm [179], L1-Hotomopy [180],
gradient descent [129] and others [181, 182]. These algorithms are able to detect and localize the
18emitters in very dense regions of the data. However, due to the large size of the up-sampled image,
the CS algorithms are slow and the resolution cannot be better than the grid size of the up-sampled
image.
The issues mentioned above have been addressed in later literature using different approaches.
FALCON [129] accelerates the algorithm by implementing CS on GPUs. It ameliorates the grid-size
problem by refining the found locations in the subsequent steps after the deconvolution stage. CS
has recently been implemented over continuous parameter spaces to remove the limits imposed by
the up-sampled grid [183,184]. To lower the computational cost of the CS algorithm, a recent paper
models the entire sequence at the same time rather than employing a frame by frame analysis of the
data [185]. Another approach implements the CS algorithm in the correlation domain by calculating
the frame cross-correlations [186].
Singular Value Decomposition
Assuming A as a n × n square matrix with non-zero determinant, it can be factorized into
A = U ΣU −1 (27)
where U is a n × n matrix whose columns are the eigenvectors of decomposition and Σ is a diagonal
n × n matrix where the diagonal elements are the eigenvalues. A non-square matrix B can also be
decomposed in a similar fashion, called the singular value decomposition (SVD)
Bn×m = Vn×n Λn×m Wm×m (28)
where V and W are, respectively, n × n and m × m matrices. Λ is a diagonal n × m matrix with
diagonal elements the eigenvalues of B [187].
The MUltiple SIgnal Classification ALgorithm (MUSICAL) for super-resolution fluorescence mi-
croscopy [188] takes B as a collection of frames of super-resolution images where each column of B
is a frame of the raw data. B is then a non-square matrix that can be factorized into a diagonal
matrix and unitary matrices where the eigenvectors are eigenimages. The eigenimages are next clas-
sified into signal and noise based on their eigenvalues using a given threshold. Finally, MUSICAL
calculates the projection of the PSF at different locations in the eigenimages to identify and localize
the emitters. An alternative method makes use of the SVD in the Fourier domain, analyzing the
sequence of raw data frame by frame to localize the emitters [189].
Deep Learning
Deep learning approaches are non-iterative optimization algorithms that perform calculations in a
parallel manner and hence are very fast. Theses approaches are based on Artificial Neural Networks
(ANN) that are inspired by animal brains and neural systems. The building blocks of the brain are
neurons equivalent to perceptrons or sigmoid neurons in ANNs [190]. Perceptrons take a few binary
inputs and generates a binary output, Fig. 7.
The output of the perceptron is one if the sum of inputs times their weights is larger than a
threshold and is zero otherwise, eq. (29).
( P
0 if wi inputi < threshold
Output = Pi (29)
1 if i wi inputi > threshold
19Figure 7: Perceptron takes several binary inputs and gives a binary outcome. wi s are the weights
of the inputs.
It can be shown that certain combinations of perceptrons produce logical operations such as AND,
OR and NAND, which are the underlying bases of computation and any mathematical function could
be generated using them [190]. Therefore, ANNs are capable of producing any mathematical function
using perceptrons. A network of perceptrons can be trained to perform different tasks by adjusting
the weights, wi . Sigmoid neurons are more sophisticated versions of perceptrons where the output is
a value within the interval of [0, 1] rather than a binary output. Sigmoid neurons are more flexible
in the training process and are used in neural networks.
ANNs have been employed to attack various problems in the field of biomedical imaging [191,192],
specifically for SMLM image processing [193]. Convolutional Neural Networks (CNNs) have been
employed for super-resolution image processing. CCNs consist of two stages. The first stage of the
network receives the input image and then encodes the information into a smaller number of pixels
via multiple layers of neurons. This step averages out insignificant details and helps with denoising.
Next, the encoded information in the first step is decoded and upsampled to a super-resolved image
with a finer pixel size than the input image [191].
CNNs designed to localize emitters in super-resolution raw data can be categorized into three
different types based on their training approach:
1) ANNs are trained using simulated data where the ground truth is available or using localizations
found using a standard iterative algorithm [194–196]. In the training stage, the ANN learns by
minimizing the sum of distances between the found localizations and the given locations. Using
synthesized data, there will always be adequate training data.
2) ANNs are also trained using two well-registered sets of data acquired from the same sample
where one of them is used as ground truth. The ground truth image has high SNR that can be
acquired employing different procedures such as confocal microscopy [197, 198], using an objective
with high numerical aperture [199], or using a sparse data set to reconstruct a super-resolved image
with high SNR [200] to train the network. In the training stage, the network learns by minimizing
the difference between the output image and the acquired image with high SNR. The minimization
of differences can be implemented via a standard iterative optimization algorithm [197] or by using
a sub-network in the training stage called a discriminative network [199, 200]. The discriminative
network takes the output of the CNN along with the ground truth images and labels the output as
real or fake.
3) In an alternative training approach, there is no additional inputs for the training step and the
network is trained by reproducing the input data from the list of found emitters and minimizing
the difference between the original input and the synthesized image [201]. This training procedure
is called unsupervised learning.
The deep learning procedures are very fast during the analysis. There are no required input
parameters or thresholds, and their performance is comparable to the MLE algorithm [196, 202].
However, the training process is very sensitive and has to be done very carefully. Some pitfalls
of training are the hallucination problem, the generalization problem, etc. [191]. Deep learning
algorithms might make mistakes in identifying patterns from random inputs when there is not
adequate training, which is called the hallucination problem. If there are new patterns that are not
20You can also read