The GrowTh of Soy Impacts and Solutions 2014 - WWF
←
→
Page content transcription
If your browser does not render page correctly, please read the page content below
REPORT
 IN T

2014

The Growth of Soy
Impacts and Solutions

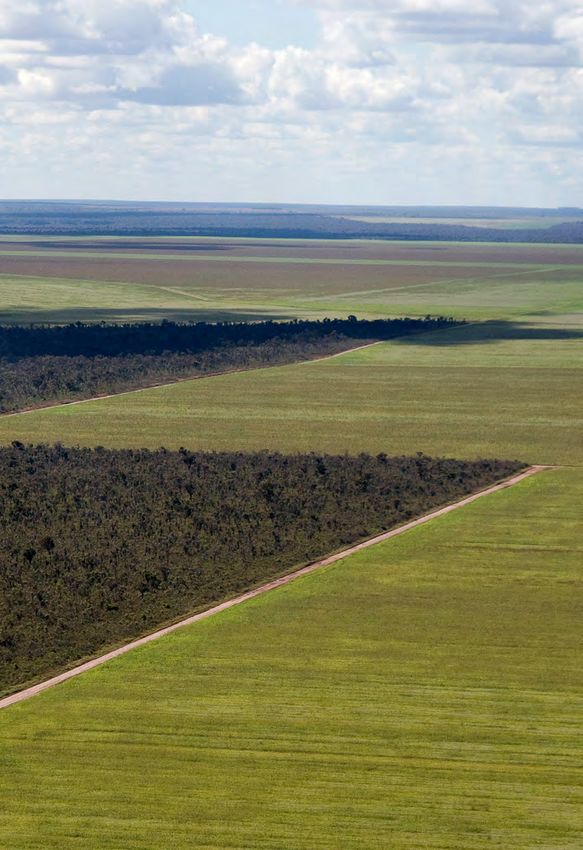
The Growth of Soy
Impacts and Solutions
WWF is one of the world’s largest and most experienced independent
conservation organizations, with over 5 million supporters and a global
network active in more than 100 countries.
WWF’s mission is to stop the degradation of the planet’s natural environment
and to build a future in which humans live in harmony with nature, by
conserving the world’s biological diversity, ensuring that the use of renewable
natural resources is sustainable, and promoting the reduction of pollution and
wasteful consumption.
Published in January 2014 by WWF – World Wide Fund for Nature (formerly
World Wildlife Fund), Gland, Switzerland. Any reproduction in full or in part
of this publication must mention the title and credit the above mentioned
publisher as the copyright holder.
Recommended citation:
WWF. 2014. The Growth of Soy: Impacts and Solutions. WWF International,
Gland, Switzerland
ISBN: 978-2-940443-79-6
Text and graphics: 2014 WWF
All rights reserved.
Reproduction of this publication for educational and other non-commercial
purposes is authorized without prior written permission from the copyright
holder. However, WWF does request advance written notification and
appropriate acknowledgement. Reproduction of this publication for resale or
other commercial purposes is prohibited without prior written permission of
the copyright holder.
The designation of geographical entities in this report, and the presentation of
the material, do not imply the expression of any opinion whatsoever on the part
of WWF concerning the legal status of any country, territory or area, or of its
authorities, or concerning the delineation of its frontiers or boundaries.
Original research by Sue Stolton and Nigel Dudley, Equilibrium Research
Edited by Barney Jeffries
Design by millerdesign.co.uk
Cover photo: Aerial view of unpaved roads dividing a soy monoculture
from the native Cerrado, in the region of Ribeiro Gonçalves, Piauí, Brazil.
© Adriano Gambarini/WWF Brazil
Contents
EXECUTIVE SUMMARY                                  4   5. SOY CONTROVERSIES                                   62
Uses of soy                                        4   Soy, soil, water and resource use                      62
Growing demand                                     5   Soy cultivation: Social impacts                        64
Loss of natural ecosystems                         5
Steps toward sustainable soy                       6   6. STEPS TOWARD RESPONSIBLE SOY                        68
                                                        1. Market responses                                    71
1. INTRODUCTION                                   10   2. Consumer country responses                          74
Natural ecosystems affected by soy                11   3. Producer country legislation                        76
                                                        4. Land-use planning                                   78
2. SOY AND ITS USES                               12   5. Better Management Practices                         79
Soy for feed                                      14   6. Payments for Ecosystem Services (PES)               81
Soy for food                                      15   7. Responsible investment                              82
Soy for fuel                                      15   8. Reducing consumption and reducing waste             82

3. THE CONTINUING RISE OF SOY                     18   7. WHAT YOU CAN DO                                     84
Soy cultivation: the search for land              21   Soy producers                                  84
Where next?                                       24   Soy traders                                    84
Local producers for the global market             25   Buyers in feed, meat and dairy, food processing
The market for soy in Europe                      25   and retail sectors                             85
Big players in the soy market                     27   Financial institutions                         85
Moving markets: China from exporter to importer   29   Consumers86
                                                        Governments in soy-producing countries         86
4. SOY AND DEFORESTATION32                             Governments in consumer countries              87
Soy, deforestation and the loss of                      NGOs87
valuable ecosystems                               34
The Amazon                                        38
The Cerrado                                       42
The Atlantic Forest                               46
The Gran Chaco                                    50
The Chiquitano Forest                             54
North American Prairies                           58

Tables                                                  Figures
1. Area and yields of soybean                           1. Ecoregions impacted by soy
   - projections to 2050                  21              in South America                                    11
2. Soybean production 2008-13                           2. Soy product flows                                   16
   in thousand tonnes                     21           3. Current and projected development of
3. Soybean major harvested areas          24              soy bean and meat production: 1961-2020             22
4. Soybean importers 2008-13                            4. Soy global trade flows for key regions              26
   in thousand tonnes                     31           5. EU soy imports averages for 2006-10                 29
5. Largest soy-importing
   countries/regions31
6. Forest lost in Argentina, 1998-2008    37
7. Proportion of GM soy grown
   in countries considered in this report 67

                                                                  The Growth of Soy: Impacts and Solutions | page 3
EXECUTIVE SUMMARY Over recent decades, soy has
undergone the greatest expansion
of any global crop, threatening
forests and other important natural ecosystems.
This report explains the extent of the problem, the
drivers behind it and how we all have a role to play
in implementing solutions.
High in protein and energy, soy is a key part of the global food supply. But its growth
has come at a cost. Millions of ha of forest, grassland and savannah have been
converted to agriculture, either directly or indirectly, as a result of the global boom
in soy production. With demand continuing to rise, more natural ecosystems will
be lost – unless we take action urgently. Everybody can contribute to the transition
toward a more responsible soy industry, including soy producers; traders; buyers
in feed, meat and dairy, food processing and retail sectors; financial institutions;
governments in producer and consumer countries; NGOs; and consumers.
In the last 50 Soybeans have been cultivated for thousands of years in Asia, but over the last
century cultivation has expanded dramatically. In the last 50 years, the area devoted
years, the area to soy has grown tenfold, to over 1 million square kilometres – the total combined
devoted to soy has area of France, Germany, Belgium and the Netherlands. The fastest growth in
grown tenfold,
recent years has been in South America, where production grew by 123 per cent
between 1996 and 2004. And this expansion shows no sign of stopping: the Food and
to over 1 million Agriculture Organization of the United Nations (FAO) suggests soy production will
square kilometres almost double by 2050.
– the total Soy produces more protein per hectare than any other major crop. It is also one of
combined area of the most profitable agricultural products. Around 270 million tonnes were produced
in 2012, of which 93 per cent came from just six countries: Brazil, United States,
France, Germany, Argentina, China, India and Paraguay. Soy production is also expanding rapidly in
Belgium and the Bolivia and Uruguay. The main importers are the EU and China, while the US has the
Netherlands. greatest soy consumption per capita.
Uses of soy
While soybeans can be eaten directly by humans, most are crushed to produce
protein-rich soy meal, along with vegetable oil and by-products such as lecithin, a
natural emulsifier. The meal is used primarily as livestock feed. Soy oil is used in
food and other consumer goods, such as cosmetics and soaps, and as a biofuel.
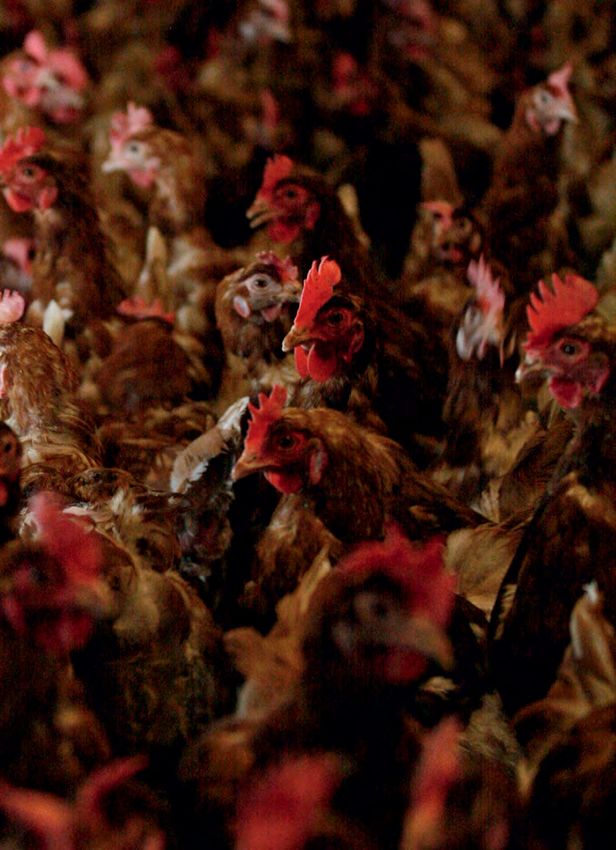
Feed: Increasing meat consumption is the main driver behind soy’s continuing
expansion. Around three-quarters of soy worldwide is used for animal feed,
especially for poultry and pigs. Between 1967 and 2007 pork production rose by
294 per cent, egg production by 353 per cent and poultry meat by 711 per cent; over
the same period, the relative costs of these products declined. As the world’s largest
source of animal feed, soy is a key component of the industrial farming model that
has enabled this.
Food: Some 6 per cent of soybeans are eaten directly, mainly in Asian countries, as
whole beans or in products such as tofu and soy sauce. Soy is used as an ingredient
in many baked and fried products, as margarine, in frying fats, or bottled as cooking
The Growth of Soy: Impacts and Solutions | page 4
Executive summary

                         oil. Lecithin derived from soy is one of the most common additives in processed
                         foods, found in everything from chocolate bars to smoothies.

                         Fuel: Soybean oil can be used to produce biodiesel. Although this remains a small
                         proportion of global soy production, use of soy as a fuel is driving expansion in
                         countries such as Argentina.

                         Growing demand
                         Soy production is expected to increase rapidly as economic development leads
                         to higher animal protein consumption, especially in developing and emerging
                         countries. Recent FAO projections suggest an increase to 515 million tonnes by 2050;
                         others project a 2.2 per cent increase per year until 2030. Soy consumption in China
                         doubled in the last decade, from 26.7 million tonnes in 2000 to 55 million tonnes in
                         2009, of which 41 million tonnes were imported; China’s imports are projected to
                         increase by 59 per cent by 2021-22. Markets in Africa and the Middle East are also
                         expected to expand rapidly in the next decade.

                         The challenge is clear: we are going to be growing more soy, and will need more land
                         to grow it on.

   In total, the area    Loss of natural ecosystems
                         Over the last few decades, vast areas of forest, grassland and savannah have been
     of land in South    converted to agriculture. In total, the area of land in South America devoted to soy
 America devoted to      grew from 17 million ha in 1990 to 46 million ha in 2010, mainly on land converted

   soy grew from 17
                         from natural ecosystems. Between 2000 and 2010, 24 million ha were brought into
                         cultivation in South America: soybean production expanded by 20 million ha in the
million ha in 1990 to    same period.

46 million ha in 2010.   While this has helped to increase meat production and brought economic benefits
                         to the countries that produce and trade it, converting natural ecosystems carries a
                         heavy cost. Biodiversity is in decline, forest loss is a key factor in climate change, and
                         as ecosystems are destroyed or degraded, we lose many of the ecological services we
                         rely on, from clean water and healthy soils to pollination and pest control.

                         Soy production poses a threat to forests, savannahs and grasslands of global
                         importance:
                           • The Amazon is home to one in every 10 animals on Earth, and plays a vital role in
                             regulating the global climate. Soy has contributed to deforestation in the Brazilian
                             and Bolivian Amazon, both through direct conversion and in some cases by
                             displacing cattle production to the forest frontier.
                           • The Cerrado holds around 5 per cent of the world’s biodiversity and is one of
                             South America’s most important water sources. But in the last 40 years, around
                             half of the Brazilian Cerrado has been converted to agriculture and pastures. Soy
                             cultivation now takes up around 7 per cent of the Cerrado biome, or an area the
                             size of England.
                           • Though the Atlantic Forest has been reduced to a fraction of its original extent
                             over the centuries, it remains immensely rich in biodiversity, with over 8,000
                             endemic species. Soy has been a leading driver of deforestation. Legal protection
                             has limited this in recent years, though existing laws are being threatened.
                           • Agricultural expansion, largely driven by soy, is the biggest threat to the Gran
                             Chaco, a species-rich, sparsely populated plain that straddles Argentina, Paraguay
                             and Bolivia. The region is undergoing one of the fastest rates of conversion in the

                                                                   The Growth of Soy: Impacts and Solutions | page 5
Executive summary

                                     world, with half a million ha of native vegetation cleared between 2010 and 2012.
                                   • Bolivia’s Chiquitano forest is the world’s largest tropical dry forest, one of the
                                     most endangered ecosystems on the planet. Soy production is expanding rapidly
                                     in Bolivia, accompanied by high rates of forest clearance.
                                   • Soy has also replaced natural grassland, including in the Uruguayan Campos, the
                                     North American prairies and the Argentinian Pampas.

  Carrying on with              Steps toward responsible soy
                                Demand for soy will continue to rise over the coming decades, at a time when
“business as usual”             the world’s population and consumption of natural resources is growing to
 will mean further              unprecedented levels. Carrying on with “business as usual” will mean further loss

    loss of natural
                                of natural environments, leading to huge and irreversible losses of biodiversity. The
                                natural capital and ecosystem services that underpin not only agriculture but the
     environments,              entire global economy will be further eroded: ecological processes could be pushed

leading to huge and             beyond tipping points, leading to catastrophic failures. Increased carbon emissions
                                will exacerbate the already formidable challenges of climate change.
irreversible losses
    of biodiversity.            But we do not have to follow this pathway. Solutions exist that will allow us to meet
                                the need for soy and other agricultural commodities while conserving biodiversity
                                and crucial ecosystems.

                                Producer country legislation: Policies to conserve forests and native vegetation
                                have the potential to contain the irresponsible expansion of soy and other
                                agricultural production – though in some cases, these policies have merely displaced
                                problems to other areas. While most governments have established protected areas
                                to conserve a proportion of their country’s native ecosystems, regions such as the
                                Cerrado and the Gran Chaco lack adequate protection. Legislation is also needed to
                                support conservation outside protected areas, including on farms and other privately
                                owned land. Just as importantly, all of these policies need to be implemented
                                effectively.

                                Land-use planning: WWF wants to see all countries introduce transparent,
                                systematic planning processes for balancing different land uses with conservation of
                                natural environments. Various tools exist to identify “go” and “no go” zones – areas
                                suitable for production, such as degraded lands and low-productivity pasture, and
                                areas of high conservation value (HCV) that should be protected from development.

                                Market responses: Private companies have begun to take steps to reduce the
                                environmental impact of soy. Responses include individual and collective pledges
                                to avoid deforestation, such as the Soy Moratorium in the Brazilian Amazon,
                                and voluntary certification schemes developed in collaboration with civil society
                                organizations, such as the Round Table on Responsible Soy (RTRS). The RTRS
                                standard does not allow the conversion of any native forests, as well as non-forest
                                habitats such as grasslands and wetlands of high conservation value.

                                Consumer country responses: Consumer countries have an important role
                                to play in influencing the shift to more responsible soy production practices. The
                                Netherlands – the second-largest soy importer in the world – is aiming for 100 per
                                cent of soy for the Dutch market to be certified to RTRS standards, or equivalent,
                                by 2015. Similar initiatives exist or are under way in other European countries,
                                including Switzerland, Belgium, Denmark and Sweden. Public procurement policies
                                that favour responsibly produced soy could be another important tool.

The Growth of Soy: Impacts and Solutions | page 6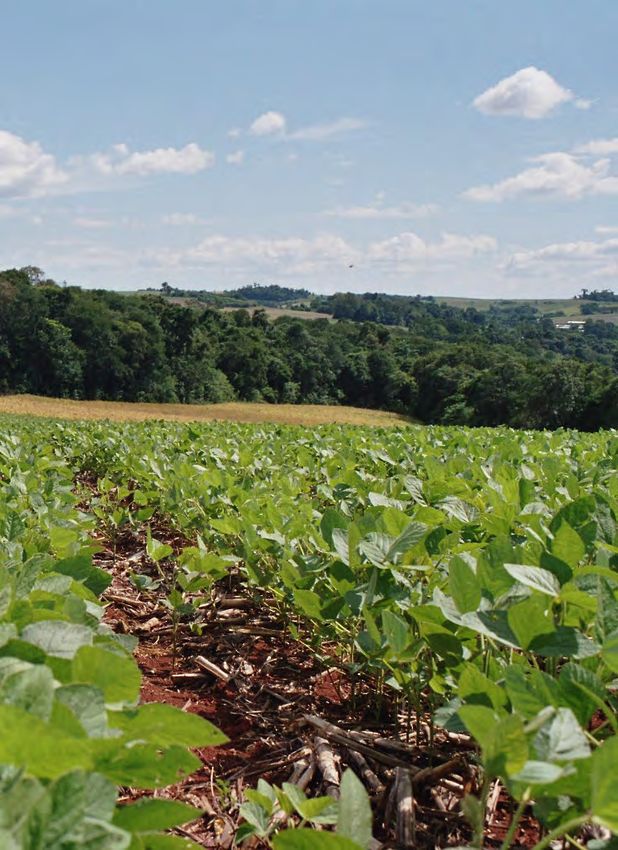
Executive summary

Better Management Practices (BMPs): BMPs can help farmers improve soil
health and productivity, reduce the use of inputs such as agrochemicals and water,
and mitigate negative environmental impacts. In areas where yields are low, such as
India and China, BMPs can help soy producers to increase yields without expanding
production areas. Yield increase in one area can contribute to less expansion in
others. Similarly, increasing livestock productivity in areas of very low-intensity
grazing could free up land for soy cultivation: the cattle sector in Brazil recognizes
that it could increase beef production even with 30-40 per cent less land.

Payments for Ecoystem Services (PES): Converting forests to soy is usually
more profitable in the short term than conserving them. PES schemes can help
to balance this by rewarding those who conserve natural ecosystems and the
services they provide: a new PES law in Paraguay, and Brazil’s revised Forest Code,
for example, will allow landowners who conserve more than the legal minimum
forest cover to sell certificates to those who are not in compliance. Climate finance
mechanisms such as REDD+ and carbon markets also offer incentives for conserving
and restoring natural vegetation.

Responsible investment: Financial markets can help to shape the future of
the soy industry by diverting capital away from projects that threaten natural
ecosystems toward sustainable production. Investors in agricultural commodities
such as soy are waking up to the fact that environmental risks can have a material
impact on profitability. Increasingly, banks are providing better terms for clients that
meet credible certification standards, such as those of the RTRS: this will influence
traders and processors, as well as producers.

Reducing consumption and reducing waste: Reducing waste and eating fewer
animal products could keep soy demand in check. Opportunities exist to reduce
waste at every step of the soy supply chain, from farm to consumer. Developed
countries adopting a healthy, balanced diet with animal protein consumption in
line with nutritionists’ recommendations could reduce the pressure on natural
ecosystems: a recent report from WWF-Germany suggests that if all Germans
reduced their meat consumption to levels recommended by the German Society for
Nutrition, it would reduce the amount of land needed for agricultural production
by 1.8 million ha, including 826,000 ha used to produce soy as animal feed,
predominately in South America.

While there is no single solution, all of us, from companies that
produce, buy and finance soy to consumers of soy and meat products,
have the power to make choices that will help build a more responsible
soy industry.

But we need to act urgently in order to reduce the pressure on the
Amazon, the Cerrado and the Chaco, and other rich and valuable
ecosystems that are vital to the health of the planet and people.

                                         The Growth of Soy: Impacts and Solutions | page 7
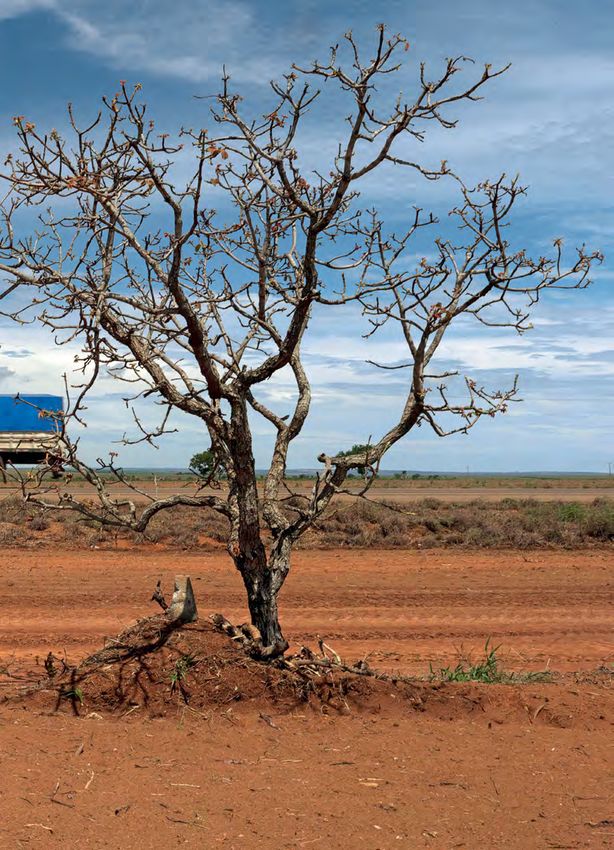
CONVERSION OR
CONSERVATION?
A lone tree stands as a reminder of the Atlantic Forest that once covered
100 million hectares in Brazil, Argentina and Paraguay. Around it, soy
monocultures stretch into the distance.
Demand for soy – mostly for animal feed – has risen dramatically in recent
decades. In South America, vast areas of natural forest, savannah and
grassland have been cleared to make way for soy production. And as the
world’s appetite for the products made with soy increases ever further,
more and more land will be needed.
So will more natural habitats be destroyed to make way for soy fields?
Or can we find ways to produce more soy while conserving forests and
important ecosystems?
Naranjal, Atlantic Forest, Paraguay
© Peter Canton
Conversion or conservation?

1. INTRODUCTION                                      Soy has become one of the world’s most
                                                     important crops, but we urgently need
                                                     to produce it more responsibly
                                A century ago, the soybean was practically unknown outside Asia. Today, hundreds
                                of millions of people around the world eat meat, eggs and dairy products from
                                animals fed on soy, and traces of soy are found in countless processed foods. In the
                                last 50 years, the area of land devoted to soy has grown tenfold, to over 1 million
                                square kilometres – equivalent to the total combined area of France, Germany,
                                Belgium and the Netherlands. And this expansion shows no sign of stopping: the
                                United Nations Food and Agriculture Organization (FAO) suggests soy production
                                will almost double by 2050 (Bruinsma, 2009).

                                Soy is fast growing and highly nutritious, producing more protein per hectare than
                                any other major crop. Capable of being grown in many environmental conditions, it
                                has the potential to play a key role in addressing the challenge of global food security.
                                As the largest source of animal feed in the world, soy is a valuable commodity, which
                                has forged powerful trade links across continents while making major contributions
                                to the economies of the countries that grow, export and trade it.

                                But soy’s growth has come at a cost. Huge areas of forest, grassland and savannah
                                in South America, as well as large swathes of North American prairie, have been
                                converted to agriculture, either directly or indirectly, as a result of the global boom
                                in soy production. Given high meat consumption in developed countries, rapidly
                                rising meat consumption in growing economies and the potential for increased use of
                                soy oil as a biofuel, natural ecosystems will come under increasing pressure.

                                Several forests of global importance for conservation are affected by soy production,
                                including the Amazon and the Atlantic Forest. Important savannahs and mixed
                                landscapes, such as the Cerrado and the Gran Chaco, and natural and semi-natural
                                grasslands are also being lost, and there’s a danger that efforts aimed at forest
                                conservation will push even more production into these under-valued, under-
                                protected non-forest habitats.

                                We urgently need to find ways to produce soy more responsibly, or these natural
                                ecosystems could be lost forever, along with the priceless biodiversity they support
                                and the vital services they provide. WWF believes that it is possible to produce soy
                                without destroying forests and other important ecosystems. But this will require a
                                concerted effort from many quarters: all along the soy value chain from producers
                                to feed companies to manufacturers to retailers; from policymakers to financers
                                to consumers.

                                This report presents an overview of the soy industry and the issues around it. We
                                outline the uses of soy, chart its extraordinary rate of growth, and present the data
                                on where soy is produced and consumed. We explore those regions most at risk from
                                the expansion of soy production, as well as discuss its other environmental and
                                social impacts. Finally, and most crucially, we look at some possible solutions for
                                reducing soy’s footprint – and what you can do to help.

The Growth of Soy: Impacts and Solutions | page 10
Conversion or conservation?
In the last 50 years, the area of land
devoted to soy has grown tenfold,
to cover around 1 million km2
Natural Landscapes at risk from soy expansion
ecosystems Brazil
affected by soy Caracas
VENEZUELA
Greatest threat today is
ME
A
GU CH
to the Cerrado; residual
A
YAN
INA
IAN
N
Bogotá and indirect impacts
FRE
GU
SUR
(and potentially future
COLOMBIA
threats) to the Amazon
and Atlantic Forest
Quito
ECUADOR
Amazon
Bolivia
Forests: are areas spanning
more than 0.5ha, with trees
PERU BRAZIL
at least 5m high and a canopy
cover of at least 10 per cent (FAO
definition). Forests covered in Highest levels of
conversion in the
Lima
BOLIVIA Cerrado
this report include the Amazon,
the Atlantic Forest and the Chiquitano dry forests;
Chiquitano Dry Forest. also in the Gran
La Paz
Chiquitano Brasilia
Chaco, Cerrado and
downstream pollution
impacts in the Pantanal
CHILE PARAGUAY
Dry Asunción
Chaco Humid
Atlantic Forest
Savannahs: are grassland
Paraguay Chaco
areas that include a significant ARGENTINA
A temporary land conversion URUGUAY
number of trees and woody
Uruguay
moratorium has dramatically
plants, but not so densely spaced
slowed clearance in the Buenos Aires
as to form a canopy. Much of the
Atlantic Forest although
Cerrado and the Gran Chaco fall
remnants remain at threat;
under this category, though both Primary impact on the
however, soy expansion on
also contain forest areas. campos grassland,
Argentina
agricultural land in
particularly around the
the Atlantic Forest
River Uruguay, with
region is displacing
pollution impacts onto
cattle production into
Primary impacts are wetland areas and to
the Gran Chaco and
on the Gran Chaco wildlife throughout
the Pantanal
and various parts of
the Pampas grassland;
also impacts on the
Grasslands: are dominated by
Yungas forests
grasses and other herbaceous
plants. Examples include the
North American prairies, the
Argentinian Pampas and the
Campos in Uruguay. This report Figure 1
distinguishes between natural Ecoregions impacted by soy in South America
grasslands and cultivated As production continues to expand across South America, soy poses a
pastures, which have been sown threat to some of the most remarkable and biodiverse places on the planet.
with a small number of often non- We look at the key ecoregions at risk in more detail later in this report.
native grass species.
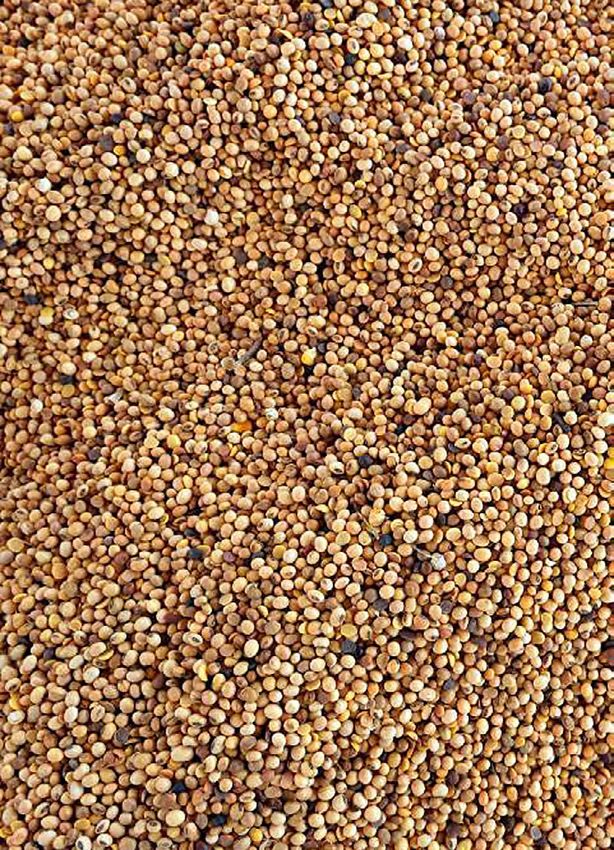
The Growth of Soy: Impacts and Solutions | page 11SOY AND ITS USES A small bean, a huge reach… Soybeans have been grown for thousands of years in Asia, where they are eaten whole and used in ingredients like tofu and soy sauce. But most soy is consumed more indirectly. The vast majority of soy today is milled into high-protein soy meal, which has become the world’s number-one animal feed. Soy oil is used for cooking, in margarines and in other consumer goods, such as cosmetics and soaps. Soy oil is also increasingly used as a biofuel. And soy derivatives, like the emulsifier lecithin, are used in a wide range of processed foods, including chocolate, ice cream and baked goods.
© Peter Caton/WWF UK
Soy and its uses

2. SOY AND ITS USES                                       From animal feed to fuel, the
                                                          soybean has become an integral
                                                          part of everyday life
                                Soybeans have been grown for thousands of years in Asia, where they are eaten
                                whole and used in ingredients such as tofu and soy sauce. But most soy is consumed
                                more indirectly. The vast majority of soy today is milled into high-protein soy meal,
                                which has become the world’s number-one animal feed. Soy oil is used for cooking,
                                in margarines and in other consumer goods, such as cosmetics and soaps. Soy oil
                                is also increasingly used as a biofuel. And soy derivatives, such as the emulsifier
                                lecithin, are used in a wide range of processed foods, including chocolate, ice cream
                                and baked goods.

        93%
                                Soy or soya (Glycine max) is an annual legume grown for its edible bean. It has
                                been cultivated for thousands of years in its native Asia, but over the last century
                                cultivation has expanded dramatically. Soy is a source of both protein and energy:
                                it has about 40 per cent protein and 20 per cent vegetable oil by weight in its seeds
                                (Boucher et al., 2011). It produces more protein per hectare than any other major
     of the world’s             crop, and has a higher percentage of protein than many animal products: dried

    soy comes from              soybean contains 35.9g protein per 100g, compared to 34.2g for cheese and 21.1g for
                                pork (RIVM, 2011).
 just six countries:
      Brazil, United            Crop breeding has made the soybean adaptable to a wide variety of climatic
                                conditions, which means that it can be grown in both temperate and tropical
 States, Argentina,             countries. Today it is one of the world’s major agricultural commodities, and one
    China, India and            of the most profitable for producers and traders. Around 270 million tonnes were

           Paraguay             produced in 2012, of which 93 per cent came from just six countries: Brazil, United
                                States, Argentina, China, India and Paraguay (USDA statistics, 2013). Soy production
                                is also expanding rapidly in Bolivia and Uruguay.

                                While soybeans can be eaten directly by humans, most are crushed to produce
                                protein-rich soy meal, vegetable oil and by-products such as lecithin, a natural
                                emulsifier. The meal, which is the end-product of three-quarters of the world’s soy, is
                                used primarily as a protein feed for livestock. Soy oil is used both in food and, more
                                recently, as a biofuel.

                                Soy for feed
                                Around three-quarters of soy worldwide is used for animal feed. As global demand
                                for cheap meat and dairy products has grown, so has the demand for soy meal as a
                                high-protein livestock feed. And that demand will be likely to continue to rise.

                                Between 1967 and 2007 pork production rose by 294 per cent, egg production by
                                353 per cent and poultry meat by 711 per cent (FAO, 2011); over the same period, the
                                relative costs of these products declined. Soy meal has been an essential component
                                in this. The combination of rapidly rising production and falling costs has only
                                been possible through the use of industrial farming: most pigs and poultry are kept
                                indoors and rely on protein-rich feed to speed growth rate. Increased production
                                of livestock is particularly noticeable in countries with a high demand for soy, with
                                China producing over 50 million tonnes of pork in 2010, almost half the global total
                                (Schneider, 2011).

The Growth of Soy: Impacts and Solutions | page 14
Soy and its uses
Average grams
of soy used per
kilo of product
Pork 263g Chicken
(Hoste and Bolhuis, 2010) 575g
Beef 173g Eggs 307g
Soy for food
Few of us are aware of quite how much soy we eat. A typical beefburger, for example,
can contain meat raised on soy meal, margarine containing soy, mayonnaise with soy
lecithin and soy additives in the bread bun.
Three-quarters of Some 6 per cent of soybeans are used directly as food (Dutch Soy Coalition, 2012),
mainly in Asian countries such as China, Japan and Indonesia. Whole beans may
the world’s soy be eaten as a vegetable, or crushed and incorporated into tofu, tempeh, soy milk
is used as animal or soy sauce. Two per cent of the meal is further processed into soy flours and
feed, making it the
protein additives. Soy is used as an ingredient in many baked and fried products, as
margarine, in frying fats, or bottled as cooking oil. Lecithin derived from soy is one
world’s largest of the most common additives in processed foods, found in anything from chocolate
protein source for bars to smoothies.
the animals we eat While the majority of soy production is destined for animal feed, the proportionate
economic value of soy oil is significantly larger. So while feed constitutes 79 per cent
and oil 19 per cent of the volume of crushed soy, the economic value of feed is 57 per
cent and soy oil is 36 per cent (van Gelder and Kuepper, 2012).
Soy for fuel
Few of us are More recently, soybean oil has also been used to produce biodiesel, although this
remains a small proportion – just 2 per cent – of total soy production. Proponents
aware how much argue that as the majority of the soy crop is used for livestock feed or directly in
soy we eat. A human food, using the remaining soybean oil for energy represents less of a trade-off
typical beefburger
between food and fuel than for other biofuels (United Soybean Board, 2008).
can contain meat Nonetheless, interest in soy as a source of fuel is helping to drive expansion in
raised on soy countries such as Argentina, which overtook Brazil as a producer of soy biodiesel in
2011 (Biofuels Digest, 2011). Argentina’s biodiesel production for 2013 was projected
meal, margarine to reach 2.8 billion litres – around 40 per cent of its total soy oil production (Joseph,
containing soy, 2012) – with most of this exported to Europe. Soy is predicted to supply about 10
per cent of EU biofuel production by 2020 (Laborde, 2011). Biofuels will continue to
mayonnaise with drive demand for soy; analysts predict that a sharp rise in production will be needed
soy lecithin and by 2025 (Hart Energy, 2013).
soy additives in the In the United States, about 3 billion litres of biodiesel annually comes from
bread bun soybeans, compared with 34 billion litres of corn ethanol (Martin, 2010). In 2012
biodiesel used 5.7 per cent of the US soy crop (United Soybean Board Market View
Database, 2012).
The Growth of Soy: Impacts and Solutions | page 15Soy and its uses
Products derived from soy
Conversion
level
Soybeans
Crushed whole Beans
other hull extracted extracted
Step I Applications Products Crude oil Meal Toasted fermented
edible Margarine Biofuel Industrial Animal other food Soysauce
Step II oils /Spreads Usage feed Products
Step III Poultry Beef Pork eggs Milk
Production
Bones, Skins Meat egg Dairy
Step IV & offal Products Products Products
Figure 2
Soy product flows
1. KPMG analysis of soy
balance in focus country
2. Endres, 2011
3. Hoste and Bolhuis, 2010
The Growth of Soy: Impacts and Solutions | page 16© xxx
© Mattes/Wikipedia
xxxxxxxxxxxxxxxxx
Commons
Growing globalad
Quis nostrud demand forpro
nostris meat has led
amat. Sedtoaliquo
growing
ut demand forego
nisi alter soy qid
as livestock
propter feed
anno– et
and that demand
cetera. Ullam continues
venit cumto rise
Quis nostrud ad nostris pro amat. Sed aliquo ut nisi alter eTHE CONTINUING RISE OF SOY Millions of hectares of land are given over to soy for chicken feed, allowing the world to consume more than four times more eggs and eight times more poultry meat than half a century ago. With the rise of industrial-scale livestock farming, soy has undergone the largest expansion of any crop. Since 1970, the area of land devoted to cultivating soy has more than tripled. And demand continues to increase, particularly in China: projections suggest that global soy production could almost double by 2050. The challenge is clear: we are going to be growing more soy, and will need more land to grow it on.
© Steve Morgan/WWF UK
The continuing rise of soy

3. THE CONTINUING                                                 Soy production has more than doubled
                                                                  over the last two decades, and is

       RISE OF SOY                                                continuing to increase at a rapid rate
                                                            Over recent decades, soy has been undergoing the greatest
                                                            expansion of any global crop (Agralytica, 2012). The area of
                                      land devoted to cultivating soy has grown from less than 30 million ha in 1970 to
                                      over 100 million ha today (Agralytica, 2012). Global output grew by 58 per cent
                                      between 1996 and 2004, from 130 million to 206 million tonnes (FAO, 2007) and
                                      reached almost 270 million tonnes by 2012 (USDA, 2013). The fastest growth in
                                      recent years has been in South America, where production grew by 123 per cent
                                      between 1996 and 2004. Growing demand from the EU and, more recently, from
                                      China, is the main driver behind this expansion, though domestic markets are also
                                      significant. Soy consumption in Brazil and Argentina is growing, for meat production
                                      for domestic consumption and export, while the United States has the highest meat
                                      consumption per capita.

                                      Soy production continues to increase rapidly. Recent projections from FAO suggest
                                      an increase to 515 million tonnes by 2050 (Bruinsma, 2009), while other projections
                                      suggest a 2.2 per cent increase per year until 2030 (Masuda and Goldsmith, 2009).
                                      While the scale of some of these projections has been questioned (e.g., Grethe et
                                      al., 2011), there is no doubt that soy demand is continuing to increase. Along with
                                      ever-increasing demand from China, the markets in Africa and the Middle East
                                      are projected to expand rapidly in the next decade (USDA, 2012). World population
                                      growth and dietary trends will have a major influence on future demand for soy.
                                      Other factors include issues relating to demand and source of fuel, and the policies,
                                      agreements, market tools, corporate commitments, regulations and directives
                                      related to soy’s many uses. But the key challenge is clear: we are going to be growing
                                      more soy, and will need more land to grow it on.

                                                                                                                               © Anton Vorauer/WWF

Intensification of cattle grazing can free up degraded pastures for soy production

The Growth of Soy: Impacts and Solutions | page 20
The continuing rise of soy
Table 1 1961-63 2005-07 2050
Area and yields of
soybean – projections Soybean production (million tonnes) 27 218 514
to 2050
Source: Bruinsma, 2009 Harvested area (million ha) 24 95 141
Yield (tonnes/ha) 1.14 2.29 3.66
Table 2 Soybean Production
Soybean production
2008-13 2008-09 2009-10 2010-11 2011-12 2012-13
in thousand tonnes Brazil 57,800 69,000 75,300 66,500 82,500
Source: United States
United States 80,749 91,417 90,605 84,192 82,055
Department of Agriculture,
Foreign Agricultural Service. Argentina 32,000 54,500 49,000 40,100 54,000
Data as of January 2013
China 15,540 14,980 15,100 14,480 12,600
India 9,100 9,700 9,800 11,000 11,500
Paraguay 3,647 6,462 7,128 4,357 7,750
Canada 3,336 3,581 4,445 4,298 4,930
Other 9,464 10,605 12,211 13,798 14,079
Total 211,636 260,245 263,589 238,725 269,414
Domestic use of soy by country (in millions of tonnes)
Source: ISTA Mielke, Germany, oilworld.de. Domestic use includes
both domestic consumption and animal production for export
Total: 260
72.1 83.1
37 34.7 18.6 8 6.5
China US EU Brazil India Argentina Others
Soy cultivation: the search for land
Soy has been cultivated for thousands of years in East Asia, and was considered
sacred in ancient Chinese mythology. Though it was introduced to Europe and
North America in the 18th century, mainly as a forage crop, soy wasn’t grown
on a significant scale outside Asia until relatively recently. Large-scale soybean
production took off in the United States after World War II and by 1970 it was
producing three-quarters of the global crop. But after years of expansion, the United
States had few options for bringing new land into production, and soy began its
march into South America. Initial expansion in the 1970s was in the Atlantic Forest
and the cooler, temperate regions of southern Brazil and Argentina, where expansion
occurred at the expense of natural grasslands or cultivated pasture.
By 1975 Brazil had overtaken China to become the world’s second largest producer,
with soybean production concentrated in the states of Rio Grande do Sul, Santa
Catarina, Paraná and São Paulo where natural soil fertility was relatively high. Here
soy could grow without heavy application of chemical fertilizers, an uncommon
technology in Brazil at that time. Production pushed northwards into the Cerrado
The Growth of Soy: Impacts and Solutions | page 21The continuing rise of soy
savannah when the use of agricultural lime and chemical fertilizer became available
to producers, allowing sustained cropping on soils previously thought too poor for
intensive agriculture. In the late 1990s, development of new soy varieties suited to
lower latitudes allowed for further cultivation in the Cerrado and Amazon. By 2005,
Brazil had become the largest soybean exporter in the world (Boucher et al., 2011).
The geographical reach of soy continued to grow, moving north in Argentina into the
Chaco, to Mato Grosso and other central, north and northeastern states in Brazil,
into the Bolivian lowlands in eastern Santa Cruz and to the Chaco region in northern
Paraguay (Pacheco, 2012). The area harvested for soy in Argentina increased
dramatically, with production rising from 8.5 million ha in 1999-2000 to 19.5
million ha in 2012-13 (USDA, 2013). Soybean production in Bolivia, although small
compared with the major producers, is projected to reach 1.3 million ha by 2014.
However, Bolivia is already the sixth largest soy producer in the Americas and the
8th largest globally, with rapid increase in production (ANAPO 2012; FAO, 2007).
More recently, soy has also been expanding in Uruguay, with almost 1 million ha
already in production (MercoPress, 2012).
In total, the area of land in South America devoted to soy grew from 17 million ha in
1990 to 46 million ha in 2010, mainly on land converted from natural ecosystems.
Conversion has not always been direct: often land would be cleared for cattle pasture
initially, then planted with soy later. In total, some 24 million ha were brought into
cultivation in South America between 2000 and 2010, while soybean production
expanded by 20 million ha in the same period (Pacheco, 2012).
Global soy production
(in millions of tonnes)
514
Source: Bruinsma, 2009;
USDA-FAS, 2013;
FAO, 2007
130 206 270
1996 2004 2012 2050
Figure 3
Current and projected
development of 1,400
soy bean and meat
1,200
production: 1961-2020
(Source: KMPG, 2013) 1,000
800
Key
600
400
Pork
200
Poultry
0
Soybean
2011
1961
1971
1981
1991
2001
1963
1967
1969
1973
1977
1979
1983
1987
1989
1993
1997
1999
2003
2007
2009
2013
2017
2019
1965
1975
1985
1995
2005
2015
The Growth of Soy: Impacts and Solutions | page 22© xxx
© Pablo
xxxxxxxxxxxxxxxxx
Herrera/Lab. Ecología Regional - FCEyN UBA
Burning is used to clear land for soy cultivation in the Argentine Chaco: the harvested area devoted to soy has increased
Quis nostrud ad nostris pro amat. Sed aliquo ut nisi alter ego qid propter anno et cetera. Ullam venit cum
fourfold in Argentina in the last 25 years
Quis nostrud ad nostris pro amat. Sed aliquo ut nisi alter eThe continuing rise of soy
Growth in global soy area
(in millions of hectares)
Source:
Agralytica, 2012;
FAOSTAT, 2013;
141
Bruinsma, 2009
over
under
30 100
million ha
million ha
million
ha
1970 2012 2050
Area harvested (thousand ha)
1990 2000 2010 2012
Argentina 4,962 8,638 18,131 19,350
Bolivia 143 617 1,086 1,090
Brazil 11,487 13,640 23,293 24,938
Paraguay 900 1,176 2,671 3,000
Uruguay 29 9 863 1,130
China 7,564 9,307 8,516 6,750
Table 3 USA 22,869 29,303 31,003 30,799
Soybean major Other 9,235 11,673 17,050 19,568
harvested areas
World total 57,209 74,363 102,613 106,625
Source: FAOSTAT, 2013
Where next?
Part of the future demand for soy can be met by increasing productivity. Since the
1960s soybean yields have doubled (Masuda and Goldsmith, 2009). Projections
have suggested they could rise by a further 50 per cent globally by 2050 (Bruinsma,
2009), but this will be hugely challenging. Brazil and Argentina have invested
heavily in research and crop breeding to increase yields, but the large productivity
gains they have experienced are expected to tail off sharply. In other developing
producer countries yields remain relatively low; in Bolivia, for example, poor road
infrastructure combined with heavy rains during the summer growing seasons
lead to significant loss of beans in the field, while seasonal drought in the winter
growing season constrains yield. Irrigation, fertilizer management and extension
support for smallholders would all boost yields. In China and India, most soy is
grown by smallholders, and there is potential to increase productivity considerably
– particularly in India (see box). However, there is a risk that improved productivity
in soy production will in fact accelerate expansion of soy by making it even more
profitable and more competitive with other land uses, especially those that involve
conserving natural areas.
The Growth of Soy: Impacts and Solutions | page 24The continuing rise of soy
Even with higher yields per hectare, however, FAO calculates that by 2050 the soy-
growing area will need to increase by almost half as much again (up to 141 million
ha from 95 million ha in 2005-07). And this doesn’t include the potential rise in
soy for biofuel, which could further add to demand (Bruinsma, 2009). While Brazil,
Argentina, China and India, along with the United States, will continue to dominate
the market, other countries are starting to develop soy production, including Nigeria,
Mozambique and Ukraine. Large-scale expansion in these countries poses its own
problems, of course. In Mozambique, for example, the ProSavanna project supported
by Japan and Brazil aims to use the experience of developing the Cerrado to facilitate
agricultural expansion in a vast area of savannah. Farmers’ groups and NGOs have
accused the project of encouraging land grabs (GRAIN, 2012, 2013).
National projections tell a similar story. In Brazil, for example, the Ministry of
Agriculture projects an expansion of soy plantations from about 23 million ha today
to 26.5 million ha by 2018-19. It projects that this will be met by an annual increase
in productivity of 2.43 per cent and an annual increase in production area of 1.95 per
cent, primarily in the Cerrado and Amazon regions. This will mean both replacing
livestock or other crops with soybeans, and converting native vegetation (Brown-
Lima et al., undated). Argentina plans to increase the area of soy by 3.7 million
ha this decade, from 18.3 million ha in 2010 to 22 million ha in 2020 (Argentine
Ministry of Agriculture, 2011).
Local producers for the global market
Soy is produced for the international market by growers varying from smallholders
to some of the world’s largest agribusinesses. The rapid growth of the soy business
has brought a shift toward progressively larger farming units which are more
competitive in the commodities markets. Soy has developed into a commodity traded
at almost unique levels. Five of the seven largest bilateral trade flows in agriculture
and food products include soy: 1. United States to China; 2. Brazil to China; 3. Brazil
to EU; 6. Argentina to China; 7. Argentina to EU (Lee et al., 2012). Most soy is bought
from producers, then exported by a handful of international traders, though some
producers are starting to organize themselves into groups and exporting directly.
The trade remains changeable: a wet summer in Canada and a drought in Brazil
and Argentina in 2010 increased the price of soy by 50 per cent (McLaughlin, 2012).
Soybean derivatives (oil and meal) are also traded on futures markets. Soybean
growers often make forward-sales (at planting time) to companies in return for
seed, fertilizer and chemicals. This model gives the companies indirect control
over large amounts of land and production without having to internalize long-term
environmental costs (Pacheco, 2012), but it also reduces risk for small growers,
allowing them to participate in global supply chains.
The market for soy in Europe
Europe relies on soy, most of it imported from South America, to meet demand for
meat and dairy products. The EU produces less than 1 million tonnes of soy a year,
but imports around 35 million tonnes (extrapolated from EU, 2012). Demand for
soy within the EU uses an area of almost 15 million ha, 13 million in South America.
To give some idea of the scale of Europe’s dependence on imported soy, this is
equivalent to 90 per cent of Germany’s entire agricultural area (von Witzke et al.,
2011). The main European importers of soy are countries with large industrial-scale
pig and chicken production.
Under European agricultural policy, tariffs on animal feed are lower than for many
other agricultural products, so soy meal is a relatively cheap import (EC, 2011). Demand
The Growth of Soy: Impacts and Solutions | page 25The continuing rise of soy
Soy global trade flows
Figure 4 Key
Soy global trade
flows for key regions Total trade flows mMT* Composition of trade flows
(Source: Soy trade:
US to EU: 1.9
ISTA Mielke, Germany meal bean
(oilworld.de). 2011-12) US to China: 24.2
Brazil to EU: 16.6
Brazil to China: 25.9
Brazil to India: 0.3
oil
Argentina to EU: 10.8
Arg. to China: 7.3
Arg. to India: 0.9
Global
Production 240 mMT
Consumption 260 mMT
Traded volumes 161 mMT
United States EU27 China
Production 84.2 mMT Production 1.3 mMT Production 13.8 mMT
Consumption 37 mMT Consumption 34.7 mMT Consumption 72.1 mMT
Import 0.8 mMT Import 35.1 mMT Import 60.8 mMT
Export 47.9 mMT Export 1.7 mMT Export 2.7 mMT
Argentina Brazil India
Production 40.1 mMT Production 66.8 mMT Production 10.6 mMT
Consumption 6.5 mMT Consumption 18.6 mMT Consumption 7.7 mMT
Import 0.0 mMT Import 0.2 mMT Import 1.3 mMT
Export 37.8 mMT Export 52.9 mMT Export 4.1 mMT
*millions of Metric Tonnes
The Growth of Soy: Impacts and Solutions | page 26The continuing rise of soy
From smallholders to agribusiness: the relative size of soy farms
in different countries
Argentina: Almost all soy is grown Paraguay: 44 per cent of farms are
by large- and medium-sized producers more than 1,000 ha, 43 per cent are
with at least 150 ha. between 100 and 1,000 ha, and 13 per
cent are less than 100 ha.
Bolivia: Farm sizes vary, from large
corporate farms of 500-5,000 ha to China: Around 40 million
smallholdings of around 40-100 ha. smallholders grow soy, usually on less
than half a hectare, but organized into
Brazil: In the Cerrado, most soy collectives.
farms are medium (300-2,000 ha) or
large (2,000-30,000 ha). Soy farms in India: Some 5 million smallholders
the Amazon are predominantly large grow soy on 1 or 2 ha each.
(more than 3,000 ha). Only in the
Atlantic Forest region is soy grown by
smaller farmers (5-300 ha).
Currently the for soy grew following the ban on processed animal proteins in animal feed, such
as meat and bone meal, as a result of the bovine spongiform encephalopathy (BSE
United States, or “mad cow disease”) outbreak in the 1990s. It has risen further because fishmeal,
Brazil and another potential animal feed, is increasingly used in fish farming. European
soybean imports also surged after the World Trade Organization was formed in 1995,
Argentina produce removing many restrictions on international trade. The increase in support for the
around four-fifths production of biofuels is also a factor in the soy imports into Europe.
of the world’s Big players in the soy market
soybean crop and A relatively small number of big companies control large volumes of the soy value
account for nine- chain. These include crushers and traders, meat and dairy companies, and retail and
catering businesses. They have a considerable influence on soy producers, and have
tenths of global the potential to play a prominent role in ensuring soy expansion doesn’t come at the
soybean exports expense of natural ecosystems (all information from WWF internal report, based on
various sources).
Crushers/traders: A small group of multinationals controls much of the crushing
and trading of soy. US companies Archer Daniels Midland (ADM), Bunge and Cargill,
and Louis Dreyfus Commodities from Switzerland (CH) are among the major players
in all regions, including China. A growing role can be seen for Asian companies
involved in trade and/or crushing in China, such as Wilmar (Singapore), Marubeni
(Japan) and China Agri/COFCO (China). These companies can be crucial players in
transforming soy markets.
Pork, poultry and dairy: Most soy meal is used as feed for chickens and pigs, so
ends up in pork and poultry products. In the northern hemisphere meat processing
is concentrated in large-scale companies. In Europe most are national, with a
tendency to grow toward multinational companies. These include, for pork, Danish
Crown (Denmark), VION (Netherlands) and Tönnies (Germany); for poultry, LDC
and Groupe Doux (France) and Plukon Food Group (Netherlands). In Brazil, pork
and poultry processing is concentrated: JBS, Brasil Foods and Marfrig have a joint
The Growth of Soy: Impacts and Solutions | page 27The continuing rise of soy
Demand for soy market share of around 30 per cent for poultry. Similarly, the top three poultry
processors in the United States – Tyson Foods, Pilgrim’s (a subsidiary of JBS) and
within the EU uses Perdue – have a 45 per cent market share. For pork, Smithfield is by far the largest
an area of almost player, followed by Tyson Foods and JBS; together, they control more than half
the US market. Smithfield has recently been acquired by the Chinese Shuanghui
15 million ha, 13 (Shineway) Group (though at the time of writing the deal had yet to be approved
million in South by regulators), in the largest ever takeover of a US company by a Chinese company.
America Shineway is the largest player in the China pork industry, though its market share
is only 4 per cent. The trend, however, seems to be toward increasing concentration.
Soy is also used as feed for dairy cows. Leading dairy companies are Fonterra
(NZ), Kraft Foods (USA), Dean Foods (USA), Unilever (UK and NL), Nestle (CH),
FrieslandCampina (NL) and Arla (Denmark); Yili and Mengniu are key companies
in China.
Retail, fast food and food service: Being closest to the end consumer, retailers
are sensitive to public opinion, and can have a major influence throughout their
supply chains. In terms of revenue, the biggest retailers in the world are Walmart
(US), Carrefour (France) and Tesco (UK). Fast-food chains and food service
companies, including those supplying institutions such as schools and hospitals, play
a similarly important role. Measured by number of outlets, the world’s biggest fast
food companies are McDonald’s, Subway and Yum Brands (KFC, Taco Bell and Pizza
Hut) (all US-based companies), while some of the biggest food service companies
are Compass (UK), Aramark (USA) and Sodexo (France). While meat consumption
is growing fast in China, most meat is still sold via independent outlets rather than
large brands.
Smallholder soy production in India and China
India cultivates about 10 million ha of soy. Almost all of this is grown by some
5 million small farmers, each with just 1 or 2 ha. Soy is a profitable crop, and
provides them with around two-thirds of their income. But with unpredictable
rainfall, old varieties and low investment, yields are low (Mondal, 2011): the
average yield is around 1 tonne per hectare, compared to over 2.9 tonnes per
hectare in Brazil, Argentina and the United States. Some producers who have
received technical assistance have already increased yields by 50 per cent.
China also has a large domestic soy production, concentrated in the northeast.
Around 40 million farmers grow soy, with the average farm size being around
0.2-0.3 ha. Average yields are below the global average, at around 1.7-1.8 tonnes
per hectare, because of continuous cultivation without rotation, low-yield seed,
poor nutrient and soil management, and environmental stresses. However, state
farms in Heilongjiang province have much higher average yields (2.67 tonnes per
hectare in 2005) (calculations by WWF-China programme).
Technical assistance to increase yields in China and, particularly, in India could
in theory help to meet demand for soy while reducing pressure on land in other
parts of the world. However, with millions of small farmers involved, improving
production practices will be a major challenge.
The Growth of Soy: Impacts and Solutions | page 28The continuing rise of soy
Origins of EU soybean import Origins of EU soy meal import
Exporting countries
Canada
Paraguay
United States
Brazil
Argentina
Other
Importing countries
Other
Poland
Denmark
Germany
UK EU soy meal importers EU total soy consumption
Italy
Spain
France
Netherlands
Figure 5
EU soy imports averages
for 2006-10
(Source: ISTA Mielke,
Germany, oilworld.de)
Moving markets: China from exporter to importer
As with many other natural resources, the future of soy will be increasingly dominated
by the demands of the Chinese market. China’s economic development is leading to
higher meat consumption, which is coupled with a serious shortage of cropland. The
country used to be an important exporter of soy, but has been a net importer since
the 1990s: it now imports 70 per cent more than the EU. Soy consumption in China
doubled in the last decade, from 26.7 million tonnes in 2000 to 55 million tonnes in
2009, of which 41 million tonnes were imported (Brown-Lima et al., undated).
China’s imports are projected to increase by 59 per cent by 2021-22 (USDA, 2012).
Trade between China and Brazil is particularly significant. Between 2000 and 2010,
trade between the two countries increased tenfold (Lee et al., 2012). More than
half of Brazil’s soy exports go to China: Brazil’s bilateral trade with China is worth
over US$20 billion, with soy representing 31 per cent of total exports. If current
trends continue, by 2019-20 China’s demand could account for over 85 per cent of
all soybean traded internationally. While China’s influence on global trade is indeed
huge, it should be noted that this statistic on its own exaggerates China’s share
of global trade, as it does not account for soy meal. Europe, for example, imports
predominantly soy meal. Nevertheless, China’s increasing demand will lead to even
The Growth of Soy: Impacts and Solutions | page 29The continuing rise of soy
larger exports from Brazil and the United States, as well as from other producers
such as Argentina and Paraguay (Brown-Lima et al., undated), and potentially
African countries such as Mozambique.
The changing destination of trade could have political and environmental impacts
as well. In recent years, pressure from European consumers and environmental
organizations has helped to check the spread of soy into natural ecosystems, notably
the Amazon. To date Chinese consumers have not demonstrated the same concern
over deforestation that has influenced European buyers. However, because of its
importance to food security, the long-term sustainability of soy and the effects of
climate change on soy productivity and soy prices could be important issues for
China in the future.
© Peter Canton
Soymeal ready to be transported in Brazil, the world’s largest exporter of soy
The Growth of Soy: Impacts and Solutions | page 30The continuing rise of soy
Soybean Imports
Country 2008-09 2009-10 2010-11 2011-12 2012-13
China 41,098 50,338 52,339 59,231 63,000
EU 27 13,213 12,674 12,474 11,810 11,300
Mexico 3,327 3,523 3,498 3,400 3,350
Japan 3,396 3,401 2,917 2,759 2,750
Taiwan 2,216 2,469 2,454 2,285 2,300
Indonesia 1,393 1,620 1,898 1,922 2,000
Thailand 1,510 1,660 2,139 1,906 1,950
Egypt 1,575 1,638 1,644 1,600 1,550
Vietnam 184 231 924 1,225 1,230
Table 4 Turkey 1,076 1,648 1,351 1,057 1,200
Soybean importers
2008-13 in thousand Other 8,403 7,636 7,158 5,882 5,880
tonnes Total 77,391 86,838 88,796 93,077 96,510
Source: USDA, 2012
Country Soy (million tonnes)
Beans Meal Oil Total
China 52.6 0.2 1.2 54
EU 13.2 23.3 0.7 37.2
Indonesia 2.1 2.9 5.0
Japan 2.8 2.2 5.0
Table 5 Mexico 3.4 1.5 4.9
Largest soy-importing Thailand 2.0 2.4 4.4
countries/regions
Source: ISTA Mielke, 2012
Other 15.9 27.6 7.3 50.8
China’s Growth in
Soybean Imports
(thousand tonnes)
41,098 50,338 52,339 59,231 63,000
2008-09 2009-10 2010-11 2011-12 2012-13
The Growth of Soy: Impacts and Solutions | page 31You can also read