WORKING DRAFT November 11, 2020
←
→
Page content transcription
If your browser does not render page correctly, please read the page content below
Norwell 2021 Open Space and Recreation Plan
WORKING DRAFT
November 11, 2020

This version of the Norwell 2021 Open Space and Recreation Plan (OSRP) is a working document
intended to involve and collect feedback from interested stakeholders and community members early
in the drafting process. Feedback will be considered and integrated where appropriate into the draft
OSRP in mid-December 2020. The final OSRP will be completed in late winter. A few key
components of the draft OSRP are still forthcoming and noted within the text of the OSRP. Examples
of forthcoming components include the ADA Self-Assessment and the full Open Space Inventory.

In order to promote easy editing, this working draft is provided with minimal formatting. The final
OSRP will be graphically designed with images and photos. We are collecting photos to include in
the final OSRP from the community—please submit your favorite images!

Please send comments and/or photos to Marynel Wahl by Monday, December 1, 2020.
Marynel Wahl, Chair of the Conservation Commission
mwahl@isdsi.com
WORKING DRAFT Norwell 2021 OSRP

In memoriam

The Norwell 2021 Open Space & Recreation Plan is dedicated to the memory of:
Nancy Lynn Hemingway-Ryder
 Norwell’s respected Conservation Agent who passed away during the development of this Plan
on September 2, 2020.

Wesley H. Osborne Jr.
Wes was the town's tree warden for 35 years and was also its first conservation agent. He is
being fondly remembered as a gentleman who affected the lives of three generations of Norwell
residents through his work protecting and planting the trees that line town streets and his
leadership in building a network of walking trails.
As a conservation agent and in retirement, he developed walking trails near Jacobs Pond with the
town's Boy Scouts and maintained them. In 2000, conservation officials dedicated the 2-mile Wes
Osborne Trail at Jacobs Pond. He was also recognized by the Nature Conservancy in 1992 for
helping to preserve Black Pond Bog Preserve, a 1-acre kettle hole formed by a glacier.

Section 1 – Plan Summary    Norwell 2021 OSRP_working draft November 2020.docx
                                          1 of 98
WORKING DRAFT Norwell 2021 OSRP

                                                              Contents
In memoriam ..............................................................................................................................1
1.    PLAN SUMMARY .................................................................................................................3
2. INTRODUCTION .....................................................................................................................4
3. COMMUNITY SETTING ...........................................................................................................6
REGIONAL CONTEXT .................................................................................................................6
4. ENVIRONMENTAL INVENTORY AND ANALYSIS .................................................................28
GEOLOGY, SOILS & TOPOGRAPHY .........................................................................................28
LANDSCAPE CHARACTER ........................................................................................................31
G. ENVIRONMENTAL CHALLENGES .........................................................................................52
5. INVENTORY OF CONSERVATION AND RECREATION LANDS ............................................58
6. COMMUNITY VISION ...........................................................................................................70
7. NEEDS ANALYSIS .................................................................................................................72
8. GOALS & OBJECTIVES ..........................................................................................................86
9. ACTION PLAN ......................................................................................................................88

Section 1 – Plan Summary                Norwell 2021 OSRP_working draft November 2020.docx
                                                      2 of 98
WORKING DRAFT Norwell 2021 OSRP

                                     1. PLAN SUMMARY
This Open Space and Recreation Plan (OSRP) continues the ongoing efforts by the Town of
Norwell to protect natural resources, conserve open space, and provide a variety of well-
maintained recreational opportunities. The previous OSRPs were completed in 1977, 1987, 1997,
2005, 2010, and 2012.

Section 2 includes a statement of purpose and outlines the planning and public participation
process undertaken for this OSRP.

Sections 3 and 4 provide background information on the Town, including history, demographic
data, development patterns, and the natural environment. This information helps to set the
community and natural context for the inventory of the Town’s present open spaces and recreation
facilities, contained in Section 5. Sections 6 through 8 identify the Town’s future open space and
recreation needs and outline community priorities. Finally, the detailed Action Plan in Section 9
provides a prioritized seven-year program to address the identified community needs.

The open space and recreation goals of the Town identified in this Plan are as follows:

   1. Protect the quality and quantity of Norwell’s water supply
   2. Provide a safe pedestrian and bicycle network
   3. Support and enhance passive and active recreation in balance with nature
   4. Protect Norwell’s scenic quality and historic resources
   5. Protect natural resources and promote biodiversity
   6. Create reliable and strategic means for implementing the OSRP

Section 1 – Plan Summary    Norwell 2021 OSRP_working draft November 2020.docx
                                          3 of 98
WORKING DRAFT Norwell 2021 OSRP

                                    2. INTRODUCTION
STATEMENT OF PURPOSE

The purpose of the 2020 Norwell Open Space and Recreation Plan (OSRP) is three-fold: (1) to
serve as a seven-year roadmap for addressing the Town’s open space and recreation needs; (2)
to ensure Norwell’s eligibility for grants from the Commonwealth of Massachusetts to acquire new
land parcels for conservation and recreation purposes; and (3) to inform Norwell citizens about
the Town’s current open space and recreation resources so that they may be used and enjoyed to
their maximum potential.

As a planning document, the 2021 OSRP is designed to work in concert with Norwell’s 2005
Master Plan, which describes a vision of Norwell in 2021 as “green, with a network of protected
open space and regulations that promote environmentally-sound, appropriate development.” The
2020 Plan’s goals and objectives are consistent with other Master Plan objectives including:
   •   Shaping development to be in harmony with town character and environmental constraints
   •   Protecting the town’s natural beauty, water resources, and environmental health through
       a network of “green infrastructure.”
   •   Preserving historic buildings and landscapes
The 2021 OSRP also ensures Norwell’s eligibility for future land grants from the state. Norwell
has benefited from state grants in the past, which have enabled the Town to purchase significant
open space resources. In order to continue to qualify for these and other grants, the Town must
have an updated and state-approved OSRP. The 2020 updated Plan will meet that requirement
for the next seven years.

This OSRP is not only a valuable planning document; it is an outreach and educational tool as
well. It provides a wealth of information about the Town’s history, regional setting, demographics,
and development patterns. It offers an overview of important natural resources found in Town
and a comprehensive parcel-based inventory of all lands that hold open space and recreational
value. The 2021 OSRP Committee hopes that the information provided in the 2012 Plan helps
further engage Norwell citizens in advancing open space, conservation, and recreation goals in
Norwell.

PLANNING PROCESS & PUBLIC PARTICIPATION

The planning process and preparation of this OSRP were coordinated by the Metropolitan Area
Planning Council (MAPC), under the direction of, and with input from the OSRP Committee
(Committee) composed of staff and members of the Conservation Commission, Recreation
Department, Planning Department, Water Commission, Historical Commission, Pathways
Committee, Athletic Fields Committee, and Town residents.

As a first step in the public outreach process, the OSRP Committee and MAPC developed an
OSRP Survey that aimed to identify community goals and priority projects, assess community
satisfaction of open space and recreation resources, and invite input on community actions to
preserve open space and improve recreation facilities. The survey was primarily distributed on-

Section 2 – Introduction                                                                          4
WORKING DRAFT Norwell 2021 OSRP

line and paper copies were available at Town Hall. The survey was distributed through the
following means: Distribution of the survey included:
   •   Postcard with link to an online survey mailed to every household;
   •   Press releases in local newspapers;
   •   Announcements on cable TV;
   •   Town email listservs;
   •   Social media;
   •   Individual outreach to nonprofits and community groups;
   •   Individual outreach to Town Boards and Committees; and
   •   Individual outreach to members of the public who have been involved in past planning
       efforts.
There were 691 responses to the survey, providing valuable insight into the community’s open
space and recreation use, goals, and needs.

The OSRP Committee also hosted a virtual public forum on October 1, 2020, available through
computer and phone, which approximately 45 residents attended. Due to the coronavirus
pandemic and public health concerns, an in-person forum was not possible. The purpose of the
forum was to introduce the OSRP planning process, present the survey findings, and discuss the
2021 OSRP goals. In addition, participants at the forum engaged in small group discussions about
the objectives of each goal

As the OSRP was being prepared, the OSRP Committee conducted targeted outreach to
community leaders, including the Select Board, Planning Board, and the Council on Aging.

[Forthcoming: more information on the public outreach as the planning process progresses]

Section 2 – Introduction                                                                       5
WORKING DRAFT Norwell 2021 OSRP – November 11, 2020
3. COMMUNITY SETTING
REGIONAL CONTEXT
• County: Plymouth
• Land Area: 21.2 square miles or 13,548 acres
• Neighboring municipalities: 23 miles south of Boston. Adjacent Towns include Hanover and
Rockland to the west, Pembroke to the south, Marshfield to the southeast, Scituate to the
east, and Hingham to the north, as shown in Map 1: Regional Context.
• Defining natural features: The Town’s eastern boundary with Marshfield is defined by the
North River, a tidal estuary that is also a state-designated Scenic River. While Norwell
does not have a coastal waterfront, it is considered a “South Shore” Town and is part of
the Massachusetts South Coastal Watershed.
Regional Planning
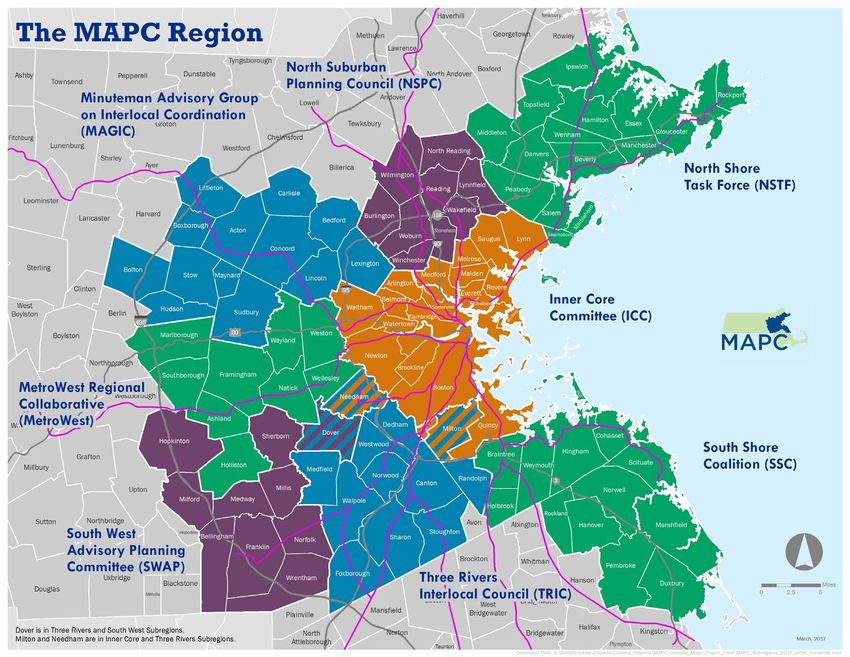
Norwell is a part of the 101 municipalities in the Boston metropolitan area that are represented by
the Metropolitan Area Planning Council (MAPC). MAPC works with communities through eight sub-
regional organizations whose members are appointed by chief elected officials and planning
boards. Figure 1 illustrates Norwell is a member of one of such eight sub-regional organizations,
the South Shore Coalition (SSC), which also includes the Towns of Braintree, Cohasset, Duxbury,
Hanover, Hingham, Holbrook, Hull, Marshfield, Pembroke, Rockland, Scituate, and Weymouth.
Section 3 – Community Setting Norwell 2021 OSRP_working draft November 2020.docx
6 of 98WORKING DRAFT Norwell 2021 OSRP – November 11, 2020
Section 3 – Community Setting Norwell 2021 OSRP_working draft November 2020.docx
7 of 98WORKING DRAFT Norwell 2021 OSRP – November 11, 2020
Figure 1. MAPC Region
MetroFuture is the long-term regional plan for the Boston metropolitan area. 1 The plan includes
goals and objectives as well as strategies for accomplishing these goals. Some of the goals
particularly relevant to Norwell’s Open Space & Recreation Plan include:
• #9 The region’s landscape will retain its distinctive green spaces and working farms.
• #10 Growth in the region will be guided by informed, inclusive, and proactive planning.
• #11 The region will be prepared for and resilient to natural disasters and climate change.
• #23 All neighborhoods will have access to safe and well-maintained parks, community
gardens, and appropriate play spaces for children and youth.
• #25 More residents will build regular physical activity into their daily lives.
• #31 The region’s residents—including youth, seniors, and immigrants—will be well
informed and engaged in civic life and community planning.
1 MAPC, MetroFuture, May 2008.
Section 3 – Community Setting Norwell 2021 OSRP_working draft November 2020.docx
8 of 98WORKING DRAFT Norwell 2021 OSRP – November 11, 2020
• #47 Most people will choose to walk or bike for short trips.
• #63 The ecological condition of wetlands will improve, and fewer wetlands will be lost to
development.
• #64 The region will retain its biodiversity and will have healthy populations of native
plants and animals, and fewer invasive species.
• #65 A robust network of protected open spaces, farms, parks, and greenways will
provide wildlife habitat, ecological benefits, recreational opportunities, and scenic
beauty.
It is imperative that municipal governments coordinate their efforts to identify and protect important
shared resources. Many of Norwell’s ecologically valuable resources, including wildlife and
waterways, extend beyond the Town’s borders. While this coordination is not always easy to
accomplish, especially in New England, which prides itself on home rule governance, it is an
important and necessary goal that communities actively pursue. Norwell is cognizant of this fact and
has worked successfully with neighboring communities in various municipal projects in the past, and
will continue to do so in the future. For example, Norwell’s Conservation Agent initiated the South
Shore Conservation Commission Network to increase education, awareness, and collaboration
around conservation issues.
Coordinated efforts are increasingly focused on building resiliency to the effects of climate change,
as communities along the South Shore are threatened by more significant inland flooding, more
extreme storms, sea-level rise, high heat, and drought. The South Shore Climate Resiliency Network
is a new collaboration between Massachusetts Coastal Zone Management, Massachusetts Audubon
Society, Massachusetts Bays National Estuary Partnership (MassBays), the municipalities in the South
Shore Coalition (as referenced above), Kingston, and Plymouth. The South Shore Climate Resiliency
Network meets quarterly to share information and resources and, as of November 2020, aims to
start pursuing regulatory changes in an effort to strengthen resiliency.
Section 3 – Community Setting Norwell 2021 OSRP_working draft November 2020.docx
9 of 98WORKING DRAFT Norwell 2021 OSRP – November 11, 2020
HISTORY 2
• Pre 1600: The history and development of Norwell has been shaped by the North River.
The first inhabitants of the land, the Massachusett tribe, lived in what is now the greater
Boston area. Their territory extended across the Mystic, Charles, Neponset, Weymouth
Fore and North Rivers, which they called home for thousands of years. The Massachusett
managed the land for agriculture, hunting, fishing, and gathering of wild seeds, nuts,
greens, berries, and fruits. Their settlements were mostly along the North River and in the
Assinippi area. The Massachusett spoke the same language as their native neighbors to
the south, the Wampanoag.
• Early 1600’s: The first European settlers arrived and introduced disease that decimated
the densely populated coastal areas of the Massachusett. With mortality rates as high as
90 percent, the Massachusett were left vulnerable to attack from other tribes, as well as
an onslaught of English colonists in the mid-1600’s. 3
• 1634: Robert and Honor Stetson left the Scituate harbor area and settled upriver--thus
becoming the pioneer European settlers of what would become South Scituate (in 1849)
and then eventually Norwell (in 1888).
• 1653: Within only 50 years of the arrival of Europeans, the Indian title to the lands
comprising Scituate and today’s Norwell was purchased from Josiah Wompatuck, Chief
of the Mattakeesets.
• 1670: The prolific shipbuilding industry in Norwell began with the establishment of the
Wanton Yard. The confluence of natural materials (timber from the forests lining the river
and iron from the ponds of Hanover and Pembroke upstream) made the tidal river an
ideal location.
• Norwell was primarily an agricultural town. Hay was harvested in the salt marshes and
used as animal forage. The endless web of stone walls today attests to the former layout
of fields and to the previously tree-less landscape—a result of both shipbuilding and fuel
needs.
• 1675-1678: King Philip’s War marked the final and unsuccessful armed attempt by
Native Americans to defend their land from colonization. After the conclusion of the war,
the European settlement at South Scituate began to prosper.
• 1675-1775: Shipbuilding increased, and more families settled on the North River.
• 1720s: European development began in the Assinippi area when David Jacobs of
Greenbush built grist and sawmills at the boundary of Hanover and Norwell. At this time,
Third Herring Brook was dammed to form Jacobs Pond. These mills operated for nearly
two centuries.
• 1775-1830: Shipbuilding on the river peaked with five shipyards in operation, after which
increased demand for larger ships requiring deeper water led to a decline in shipbuilding
on the North River.
2 2012 Norwell Open Space Plan, unless otherwise indicated.
3 https://en.wikipedia.org/wiki/Massachusett
Section 3 – Community Setting Norwell 2021 OSRP_working draft November 2020.docx
10 of 98WORKING DRAFT Norwell 2021 OSRP – November 11, 2020
• Larger-scale farming and poultry farming increased.
• 1849: 213 years after the incorporation of the Town of Scituate, the people of what is
now known as Norwell voted to establish South Scituate as a separate Town.
• 1870s: The High Street area of town was home to the successful Grose Shoe Factory—
one of the biggest employers in the area.
• 1870-1915: The Late Industrial Period saw the construction of a trolley line on Washington
Street (Route 53) between Assinippi/High Street and Accord Pond in Hingham, increasing
growth at Assinippi.
• 1874: The James Library in Norwell Center was dedicated after the land was donated
by Israel Nash and funds donated by Josiah James and matched by numerous
townspeople.
• 1888: Summer resident Henry Norwell offered the Town $2,500 ($68,500 in today’s
money) per year for ten years toward the upkeep of the roads, and the residents voted
to change the Town’s name to Norwell in his honor.
• 1895: Thomas Gaffield offered eight acres between River and Forest Streets to be used
as a park for the town.
• 1919: The prevalence of poultry thefts in town necessitated the presence of the state
police, who first occupied a small building in Norwell Center and, in 1935, built a modern
facility which still stands today.
• 1921: The Ridge Hill Grove on High Street was purchased by the Union Athletic
Association and hosted numerous baseball leagues.
• 1930s: “Jacobs Lake Shores” was built off of Route 53 on Jacobs Pond.
• After World War II, the GI Bill enabled many veterans to obtain low-interest mortgages,
and home building increased sharply—roughly 73% of the homes seen in Norwell today
were built between 1940 and 1990.
• 1942: The first zoning bylaws were created for Norwell. Business districts were
established in Norwell Village, Queen Anne’s Corner, and on Route 53. Residential districts
restricted building height, setbacks, and lot sizes—which were set at 20,000 square feet
(less than ½ acre).
• 1947: The land court ruled that the zoning bylaws were invalid.
• 1948: Planning Board established.
• 1950: Zoning Board was established.
• 1952: New zoning bylaws are enacted. Business District A (Norwell Center) and B
(Washington Street) are created. Residential Districts are restricted to 1-acre lots or ½
acre lots with frontage of 100 feet or more.
• 1952: The Zoning Board granted permission for 163 lots to be created on Franklin Road,
off Grove Street, called Norwell Homes.
Section 3 – Community Setting Norwell 2021 OSRP_working draft November 2020.docx
11 of 98WORKING DRAFT Norwell 2021 OSRP – November 11, 2020
• 1953: The Subdivision Control Law, (MGL c.41 §§81K-GG) is adopted.
• 1961: Conservation Commission was established. 1961: The construction of the Southeast
Expressway (Route 3) to Derby Street was completed and plans to complete the final 11
miles to Duxbury were imminent. Norwell became less of an agricultural community and
more of a commuter town.
• 1962: Saltmarsh Conservation District was established.
• 1963: Route 3 was completed between Boston and Cape Cod.
• 1974: Floodplain, watershed, and wetlands protection districts were established.
• 1978: The Zoning Act, (MGL c.40A) is adopted.
• 2002: The Community Preservation Act (MGL c.44B) is adopted.
• 2015: The Complete Streets Program (MGL c.90I) is adopted.
Section 3 – Community Setting Norwell 2021 OSRP_working draft November 2020.docx
12 of 98WORKING DRAFT Norwell 2021 OSRP – November 11, 2020
POPULATION CHARACTERISTICS
Population
The population of Norwell is estimated at 11,153 4 residents. Figure 2 illustrates Norwell’s
population growth between 2012 and 2019. Over the seven years, the population increased by
about 5%; over the same time period, the population of Plymouth County grew a similar amount of
4%.
Figure 2. Population
2012-2019
11,153
11,115
11,075
10,965
10,923
10,839
10,662
10,603
2012 2013 2014 2015 2016 2017 2018 2019
The current growth rate is modest compared to the mid-twentieth century. Table 1 illustrates
Norwell’s population grew rapidly between 1950 and 1970, tripling from 2,525 residents to
7,796.
Table 1. Norwell Population 1930-2019
Year 1930 1940 1950 1960 1970 1980 1990 2000 2010 2019
Population 1,519 1,871 2,525 5,207 7,796 9,182 9,279 9,765 10,506 11,153
Percent 23% 34% 107% 50% 18% 1% 5% 8% 6%
Change
Source: US Census
Demographics
• Race: Norwell’s population is racially homogenous—95% of residents are non-Hispanic
white. About 2% of the residents are Latino, and another 2% Asian American.
• Age: Median age is 42.5 years, a decrease from 43.8 in 2010. Figure 3 illustrates the
percentage of the population by age and the projected age distribution by 2030. There
are a substantial number of young people in Norwell—28% of the population is 18 years
4 US Census Population Estimates, July 1, 2019
Section 3 – Community Setting Norwell 2021 OSRP_working draft November 2020.docx
13 of 98WORKING DRAFT Norwell 2021 OSRP – November 11, 2020
or under, compared to 20% in Plymouth County. 5 Twenty-three percent of Norwell
residents are 60 years of age or older (same as in 2010).
However, the current age distribution is projected to shift. As is true in most municipalities
in Massachusetts, Norwell’s population is getting older. Currently, 17% of Norwell
residents are 65 or older. 6 In comparison, about ten years ago, only 9% of the population
was 65 or older. 7 The senior population is projected to increase rapidly to an estimated
total of 28% of the population by the year 2030. 8 The Town should plan for this potential
growth by working through the Town’s Council on Aging to examine services, recreational
needs, and housing options for the elderly population. In addition, the portion of the
population under 18 years is expected to decline by 2030. 9
Figure 3. Population Distribution by Age
18%
16%
14%
% of Population
12%
10%
8%
6%
4%
2%
0%
9 and 10-17 18-29 30-39 40-49 50-59 60-69 70-79 80 and
under over
Age
2014-2018 average 2030 projection
Sources: MAPC, Stronger Region Projections, 2014; US Census: American Community Survey, 2014-2018
• Disability: Eight percent of the population has a disability, compared to 12% in Plymouth
County. Most residents with disabilities are seniors, yet almost one in five people with a
disability are youth under the age of 18. Although a relatively small portion of Norwell’s
population has a disability, this updated OSRP aims to provide access and serve each
Norwell resident.
• Environmental Justice: In 2002, the Massachusetts Executive Office of Energy and
Environmental Affairs (EOEEA) adopted an Environmental Justice Policy to provide equal
5 US Census: American Community Survey, 2014-2018.
6 US Census: American Community Survey, 2014-2018
7 US Census: American Community Survey, 2005-2009
8 MAPC, Stronger Region Projections, 2014
9 MAPC, Stronger Region Projections, 2014
Section 3 – Community Setting Norwell 2021 OSRP_working draft November 2020.docx
14 of 98WORKING DRAFT Norwell 2021 OSRP – November 11, 2020
protection and meaningful participation for all Massachusetts residents with respect to
environmental regulations and policies. This policy also supports equitable access to
environmental assets, including parks, open space, and recreation areas. 10 The State has
identified communities that contain Environmental Justice Populations–communities with
high percentages of low-income households, residents that identify as a race other than
white, and households that have no one over the age of 14 who speaks English very well.
Map 2 illustrates that Norwell does not have any formally identified Environmental Justice
Populations. Nonetheless, it is critical to assess the distribution of environmental benefits
such as open space and parks, and burdens such as polluted sites, across the Town. The
distribution of and access to open space and parks is further discussed in Section 4:
Environmental Inventory and Analysis under Environmental Equity.
There are no active landfills in Town that would impact the environmental health of
adjacent neighborhoods.
10 Massachusetts Executive Office of Energy and Environmental Affairs. “Environmental Justice Policy”
Section 3 – Community Setting Norwell 2021 OSRP_working draft November 2020.docx
15 of 98WORKING DRAFT Norwell 2021 OSRP – November 11, 2020
Section 3 – Community Setting Norwell 2021 OSRP_working draft November 2020.docx
16 of 98WORKING DRAFT Norwell 2021 OSRP
Economy
• Income: Norwell is an affluent town with an annual household median income of $151,300.
In comparison, the median household income in Plymouth County during the same time was
$85,700. 11 However, the number of residents experiencing poverty is increasing.
Approximately 10 years ago, there were between 100-300 residents in poverty and
now there are between 200-500. 12 The definition of “poverty” depends on the household
size—for example, the poverty line for a family of four is $26,200 annual income.
• Unemployment: According to data showing the average between 2014-2018, the
unemployment rate in Norwell is 4%. 13 The coronavirus pandemic that began in spring
2020 has dramatically impacted the economy of Massachusetts. Between March 16 and
April 11, over 561,000 initial unemployment claims were filed in Massachusetts. 14 Data
on the impact of the pandemic on Norwell’s economy is not yet available.
• Job growth: Figure 4 illustrates the increase in the number of jobs located in Norwell.
Between 2012 and 2018, the number has increased by seven percent from 8,378 to
9,030 jobs. At the same time, the number of “establishments” (i.e. employers) as well as
the average wage, adjusted for inflation, has also grown. However, as stated above, the
coronavirus pandemic has resulted in substantial unemployment, which would seem to
suggest that the number of jobs in Norwell will likely decline.
Figure 4. Total Number of Jobs in Norwell,
All Industries
(2012-2018)
9,200
9,021 9,030
9,000 8,939
8,848
8,800 8,749
8,630
8,600
8,378
8,400
8,200
8,000
2012 2013 2014 2015 2016 2017 2018
11 US Census: American Community Survey, 2014-2018.
12 US Census: American Community Survey, 2005-2009.
13 US Census: American Community Survey, 2014-2018.
14 MAPC 2020
17 of 98
Section 4 – Environmental Inventory and Analysis
Norwell 2021 OSRP_working draft November 2020.docxWORKING DRAFT Norwell 2021 OSRP
• Industry: Health Care and Social Assistance is the dominant industry in Norwell, providing
almost a quarter of the jobs in town. Figure 5 illustrates employment distribution by
industry. 15 The coronavirus pandemic has hit the hospitality and retail industries the
hardest, thus suggesting that Norwell’s jobs in other industries may be more insulated from
the pandemic’s economic effects.
FIgure 5. Jobs by Industry in Norwell, 2018
Public Administration
Other Services, Except Public Administration
Accommodation and Food Services
Arts, Entertainment, and Recreation
Health Care and Social Assistance
Educational Services
Administrative and Waste Services
Management of Companies and Enterprises
Professional and Technical Services
Real Estate and Rental and Leasing
Finance and Insurance
Information
Transportation and Warehousing
Retail Trade
Wholesale Trade
Manufacturing
Construction
- 500 1,000 1,500 2,000 2,500
Number of Jobs
Source: Executive Office of Labor and Workforce Development, 2018
Housing
• Units: 3,700 occupied housing units, including 250 renter-occupied units. 16
• Cost of housing: The median sales price for a single-family home in Norwell in 2019 was
$639,000, an increase of 35% from 2012. 17 Table 2 shows the median prices for single-
family homes in Norwell from 2012-2019. A household would have to have an annual
income of approximately $160,000 to afford the typical single-family home in Norwell,
15 Executive Office of Labor and Workforce Development, 2018
16 US Census: American Community Survey, 2014-2018
17 The Warren Group
18 of 98
Section 4 – Environmental Inventory and Analysis
Norwell 2021 OSRP_working draft November 2020.docxWORKING DRAFT Norwell 2021 OSRP
almost double the median income of Plymouth County. 18 Therefore, Norwell housing costs
are prohibitively expensive for most residents of the County.
Table 2. Norwell Median Sales Price for Single-Family Homes, 2012-2019
Year Median Price % Annual Change
2012 $ 475,000
2013 $ 546,250 13%
2014 $ 500,000 -9%
2015 $ 542,500 8%
2016 $ 588,575 8%
2017 $ 594,625 1%
2018 $ 599,450 1%
2019 $ 639,000 6%
Source: The Warren Group
There are more than 1,000 households in Norwell that are “cost-burdened” by housing
(15% of the total number of households). “Cost-burdened” is defined as spending more
than 30% of annual income on housing. Households that rent are particularly cost-
burdened—approximately half of all households that rent in Norwell spend more than
30% of their annual income on housing. 19
Without new low-cost housing options, Norwell will continue to exclude households with
lower incomes and wealth and will continue to stay economically homogenous. In addition,
limiting housing options also perpetuates Norwell’s racial homogeneity and regional
segregation. As explained in the Greater Boston Housing Report Card 2019, “lack of
diversity in the housing stock means a lack of diversity in our communities—whether it be
by income, race, ethnicity, family type, or generation.” 20 This Plan considers the need for
new housing, as well as the potential to provide access to Norwell’s open space and parks
to non-residents, especially those unable to become Norwell residents due to income.
• Subsidized housing: Approximately 100 subsidized housing units. The Commonwealth
has a goal that 10% of each municipality’s units are subsidized to promote income
diversity and reduce concentrations of wealth and poverty in the region. 21 Norwell
falls far short of this goal, with about three percent of its units subsidized. The Town is
working to build more affordable housing, and there are a few projects are currently
in process.
18 Mortgage affordability was determined based on a calculated monthly mortgage payment according to a 30-
year term with a standard down payment of 5%, $1,000 in annual homeowner’s insurance, a 4% annual interest
rate, and a PMI factor of 7.5%.
19 US Census: American Community Survey, 2014-2018
20 The Boston Foundation. The Greater Boston Housing Report Card 2019: Supply, Demand and the Challenge of Local
Control. June 2019.
21 In order to promote more affordable housing, the Chapter 40B Comprehensive Permit Law allows housing proposals
to seek exemptions from local zoning and other regulations in municipalities where less than 10% of the total housing
stock is affordable for low or moderate-income residents (households at or below 80% of median area) [finish
parenthetical]
19 of 98
Section 4 – Environmental Inventory and Analysis
Norwell 2021 OSRP_working draft November 2020.docxWORKING DRAFT Norwell 2021 OSRP
GROWTH & DEVELOPMENT PATTERNS
Patterns and Trends
With the arrival of European settlers, shipbuilding along the North River and agriculture became
the primary industries beginning in the 1600’s continuing through the early 1800’s (shipbuilding)
and early 1900’s (agriculture). As land was cleared and harvested of trees for shipbuilding, farms
were developed. As shipbuilding waned, the sawmills continued, and tanneries, shoemaking,
produce farming, and poultry farming was pursued. Forested areas began to rebound.
The population increased sharply during the mid-twentieth century. Roughly 73% of the homes
seen in Norwell today were built over a 50-year period (1940–1990). This growth in residential
homes is directly related to the construction of the Southeast Expressway, which provided highway
access from Norwell and the rest of the South Shore to Boston for employment, goods, and services.
In addition, federal and state policies and programs of the early and mid-twentieth century
contributed to the development of low density, predominately white, suburban growth. For
example, the Federal Housing Administration’s loan program explicitly discriminated against
people of color by assessing credit-worthiness based on the racial composition of neighborhoods,
commonly known as “redlining.” In addition, a substantial portion of white residents in Boston moved
out of the city as a result of the effort to integrate the City’s schools, resulting in what is called
“white flight” to suburban areas, such as Norwell. 22
Residential growth first began in the section of Town adjacent to Route 53 (Washington Street).
Small houses typical of that era were built on lots as small as 7,000 square feet, but in 1973,
residential zoning was changed to one-acre lot minimum and has remained so since. If the zoning
had continued to allow smaller lot sizes, then the same population growth might have had less
impact on the open space and natural resources of Norwell. Smaller lot sizes allow for a smaller
footprint on the land, requiring less land for each new resident and less land for new roads and
infrastructure. Smaller lot sizes also often require less water as lawns are smaller, and they emit
fewer greenhouse gas emissions as destinations are closer to each other, allowing for residents to
walk to their destinations or to take shorter automobile trips. Instead, the increase in low-density
development resulted in the conversion of agricultural and forested land. The Trust for Public
Lands has found that since 1950, Massachusetts has developed land at a rate six times that of its
population growth.
In the past 20 years, a few subdivision projects have both included new homes and conservation
of open space, as described below.
• Donovan Farms: Donovan Farm is a 55 years and older restricted Village Residence
Development (VRD) built-in 1999 under the 55+ Village Overlay District (VOD).
Developments in the VOD require a two-thirds supermajority Town Meeting vote but allow
for cluster development on any parcel(s) of land within the VOD.
• Wildcat Hill: This 46-lot “cluster” development was the first approved and built under
Norwell’s Open Space and Residential Development (OSRD) Bylaw adopted in 2009. The
houses are on half-acre lots surrounded by open space.
22https://www.brandeis.edu/investigate/race-justice/busing-
desegregation.html#:~:text=In%20Boston%2C%20%E2%80%9Cwhite%20flight%E2%80%9D,overwhelmingly%20
black%2C%20Hispanic%20and%20poor.
20 of 98
Section 4 – Environmental Inventory and Analysis
Norwell 2021 OSRP_working draft November 2020.docxWORKING DRAFT Norwell 2021 OSRP
21 of 98
Section 4 – Environmental Inventory and Analysis
Norwell 2021 OSRP_working draft November 2020.docxWORKING DRAFT Norwell 2021 OSRP
• Hitching Post Lane: This 5-lot OSRD subdivision is under the permitting stage, as of 2020.
The site plan exemplifies the purpose of the OSRD Bylaw, with relatively smaller lots and
large amounts of contiguous open space that is connected by a trail to surrounding public
open space and trail system.
22 of 98
Section 4 – Environmental Inventory and Analysis
Norwell 2021 OSRP_working draft November 2020.docxWORKING DRAFT Norwell 2021 OSRP
Infrastructure
Municipal Groundwater Wells and Drinking Water
Norwell is served almost entirely by a municipal water system that relies on ten wells that pump
groundwater after treatment into the municipal system. A few residences in Norwell are served by
the Hingham and Scituate municipal systems.
All of the Norwell municipal water is disinfected with chlorine and adjusted for pH with potassium
hydroxide. Treatment locations are located at Grove Street (Wells 2,3,5, and 10), Washington
Street (Wells 4, 7, and 8), South Street (Wells 1 and 6), and Bowker Street (Well 9). The wells in
the South Street Wellfield are also treated to remove elevated levels of iron, manganese, and
organic color.
Every year, Norwell conducts more than 1,000 water quality tests for more than 100 drinking water
contaminants. The results are summarized in a Consumer Confidence Report that the Town mails to
all residents every summer and is available on the Water Departments.
The Town has a permit from the Massachusetts Department of Environmental Protection to pump an
average of 1.35 million gallons per day (mgd), with a peak day demand (usually in early June) of
over 2 mgd. The system now serves nearly 3,550 residential, commercial, municipal, and industrial
customers. The system pumps about 360 million gallons of water per year, resulting in an average
daily demand of just less than one million gallons. Long term systematic improvements have resulted
in higher and more sustainable yields of drinking water.
The system is managed by a Superintendent who reports to an elected three-member Board of
Water Commissioners. The Town by-laws empower the Board to impose water restrictions during
periods of high demand. In the summer of 2020, the Commissioners instituted voluntary water
restrictions due to demand that exceeded the safe removal of water from the well fields. The search
for new water supplies is ongoing.
Wastewater
The Town has no municipal or industrial wastewater treatment system. Wastewater disposal is on-
site, except for a few buildings located in Assinippi Industrial Park, a portion of which is tied into
the Rockland Wastewater Treatment System.
Increasingly, residential developments within the Town are providing shared septic systems,
innovative/alternative technology systems, and/or small on-site wastewater treatment plants for
multiple residences. The on-site innovative/alternative technology systems and small wastewater
treatment plants improve the resulting effluent quality.
Transportation
In recent years, Norwell’s connection to public transportation has improved, restoring the rail
access to Boston that the area historically had benefited from. In 1845, the Old Colony Railroad
Company built a train line from Boston to Plymouth. Usage hit an all-time high in 1911, but started
to decline soon after as service reductions were mandated during World War I to conserve fuel,
equipment, and labor for the war effort. The decline continued with competition from the
automobile in the 1920’s, and ultimately ended in June of 1959, coinciding with the opening of
the Southeast Expressway (Route 3). However, rail access between the South Shore and Boston
23 of 98
Section 4 – Environmental Inventory and Analysis
Norwell 2021 OSRP_working draft November 2020.docxWORKING DRAFT Norwell 2021 OSRP
was restored in 2007, when the Greenbush Line was completed, with stations in bordering
Scituate and Hingham, as well as Cohasset, Weymouth, Quincy, and Boston.
Historically, population growth has paralleled the Town’s improved transportation infrastructure as
more residents commute to jobs and opportunities outside of Town. The restoration of the commuter
rail from Boston to Scituate may contribute to population growth in the area, as new residents are
attracted to the convenience and climate benefits of commuter rail. The terminus of the commuter
line resides in the Greenbush area of Scituate, located less than a mile from the Norwell town line,
at the intersection of Routes 3A and 123. Unless new housing is built in infill (vacant parcels within
previously built areas) and higher-density locations, population growth may result in loss of open
space.
The bicycle infrastructure is limited. The Bicycle & Pedestrian Path (Pathway), which, when complete,
will run east/west connecting the High School to the Town Center, provides a paved, off-road
bicycle, walking, and ADA-compliant path. As of 2020, Phase I and II of the Pathway have been
completed, extending from the High School to Gaffield Park and connecting the Middle School
along the way. Phase IIIA from Gaffield Park to Norris Reservation and Town Center is under
construction. In addition, there are shared-lane markings (sharrows) along Old Oaken Bucket Road.
There is also an ongoing project to improve the sidewalks along Main Street from the Hanover Town
line to the Town Center. Phases I and II are completed with improved sidewalks from the Town line
to the Town Hall, and the final phase from the Town Hall to Town Center is in progress. The sidewalks
are intended for both pedestrians and bicyclists.
Most subdivisions in Town are granted a waiver to construct a sidewalk on one side of the road
instead of on both sides; In return, the developer donates to the Planning Board’s Pedestrian
Enhancement Fund, which funds pedestrian enhancements in other areas of Town. The Complete
Streets Committee has utilized most of those funds for the construction and design of the Main Street
Sidewalk Project.
Long Term Development Patterns
Norwell has a relatively simple zoning structure with two residential zoning districts (Residence A
and B), three business districts (Business A, B and C), and seven overlay districts (Village, Aquifer,
Wireless, Adult, Salt Marsh Conservation, Route 3 Buffer, and Solar 23), as shown in Map 3: Zoning.
All districts have a one-acre minimum lot size, and the Town is primarily zoned for residential use.
23 The Solar overlay is not shown in Map 3: Zoning.
24 of 98
Section 4 – Environmental Inventory and Analysis
Norwell 2021 OSRP_working draft November 2020.docxWORKING DRAFT Norwell 2021 OSRP
25 of 98
Section 4 – Environmental Inventory and Analysis
Norwell 2021 OSRP_working draft November 2020.docxWORKING DRAFT Norwell 2021 OSRP
Recent Zoning amendments include: allowances for medicinal marijuana (2013) as well as medicinal
and recreational marijuana cultivation, research, and development (2020); the creation of a solar
overlay (2015); updated FEMA mapping (2017); increased signage (2020); stormwater MS4
compliance (2020); and the creation of the Accord Pond Park Economic Development District
(2020).
Figure 6 shows the number of building permits granted each year over the past few decades in
Norwell. The number of permits tracks with trends in the national economy, including a decrease in
building during the Great Recession. The figure also shows that nearly all residential development
in Norwell is single-family units, rather than multi-family. Hhowever, this trend may be changing
with the 2018 development of 40 River Street ), a 18-unit multi-family development called “Herring
Brook Hill 40B,” and the approval of a couple of multi-family affordable housing projects.
Figure 6. Building Permits
by Single-family and Multi-family Units,
1980-2018
70
# of Building Permits
60
50
40
30
20
10
0
1980 1985 1990 1995 2000 2005 2010 2015
Single-family units Multi-family units
Source: Census Building Permit Survey, 1980-2018
Table 3 lists recent and planned development projects in Norwell from 2012 to 2000.
26 of 98
Section 4 – Environmental Inventory and Analysis
Norwell 2021 OSRP_working draft November 2020.docxWORKING DRAFT Norwell 2021 OSRP
Table 3: Recent and Planned Development Projects in Norwell (2012-2020)
Development Type/Description Status Location
White Barn Village 40 residential Planning South of Route 123 near the
units Middle School
Simon Hill Village 126 residential Planning Central Norwell, near Simon
units Hill and the Howe
Conservation Land
Hitching Post Lane 5 residential units Planning Central Norwell, off of
OSRD Circuit Street
Anthemion Memory 60-bed memory Permitted Western Norwell, off
Care Center care facility Cordwainer Drive
Elevated Access 20,000 sq. ft. Permitted Western Norwell, off
Center marijuana Cordwainer Drive
manufacturing
facility
Old Oaken Bucket 26 residential Permitted Northern Norwell, north of
Estates units Cross Street
Schooner Estates 9 residential units In Construction Southern Norwell, north of
Stetson Road
Damon Farm at 32 residential In Construction Corner of Routes 53
Queen Anne’s Corner units (Washington Street) and
228 (Pond Street)
Norwell Estates 15 residential In Construction Southern Norwell, west of
units River Street
40 River Street 18 senior Completed in 2018 Downtown, off of River
Herring Brook Hill residential units Street
Forest Ridge 5 residential units Completed in 2017 Northern Norwell, east of
Summer Street
Wildcat Hill 46-lot residential Completed in 2017 South-central Norwell, off
units Wildcat Lane
Henry’s Lane 8 residential units Completed in 2017 Northern Norwell, off
Norwell Avenue
Cowings Cove 7 residential units Completed in 2015 Northern Norwell, east of
Summer Street
South Shore Medical Medical buildings Completed in 2015 Off of Route 3, in Assinippi
Center and office space Business Park
Source: MAPC, 2020,
27 of 98
Section 4 – Environmental Inventory and Analysis
Norwell 2021 OSRP_working draft November 2020.docxWORKING DRAFT Norwell 2021 OSRP
4. ENVIRONMENTAL INVENTORY AND ANALYSIS
GEOLOGY, SOILS & TOPOGRAPHY
Geology
Norwell’s surficial geology was created by glacial and wind action. Glacial action and soft bedrock
material are responsible for carved-out valleys that were later filled with a variety of materials,
including till, clay, sand, gravel, cobbles, and boulders. Now, Norwell’s surficial geology is defined
mostly by till or bedrock, with large areas of sand and gravel in the western portion of the Town
and floodplain alluvium along the waterways. As shown in Map 4: Surficial Geology, Avalon
Granite is the dominant rock type. There are a number of wetland areas that may have been
historic ponds that are now characterized by many feet of peat, clay, sands, and gravel deposits.
The deepest layer of these historic pond deposits discovered to date is an area of 90-foot thick
materials in Old Pond Meadows, south of Route 3 and about a half-mile east of the end of South
Street. The second deepest layer of deposits above bedrock is at the end of South Street near the
present course of Third Herring Brook at Municipal Pumping Well No. 1, where the deposits are
about 60 feet deep. In some locations, there are ledge outcrops where bedrock reaches ground
elevation.
Norwell’s few bedrock outcrops give a glimpse of the glacial influences that shaped this area:
1. Hoop Pole Lane directly behind Town Hall, likely the largest rock outcrop in Town
2. East Side of Damon Pond
3. Just West of Wildcat Brook on Forest Street (Diorite, mafic rock)
4. Gaffield Park
5. The far end of High School Rock Football Field (Dedham Granite)
6. The Rapids on the North River
7. The intersection of Mill and South Streets (Removed – was a Dedham Granite outcrop)
8. Tiffany Road by Third Herring Brook
9. Main Street
“Eskers”, characterized by long winding ridges of stratified sand and gravel, are found in several
locations in Norwell. It is believed that eskers were formed within ice-walled tunnels by streams that
flowed within, above, and under glaciers as they slowed. After the retaining ice walls melted,
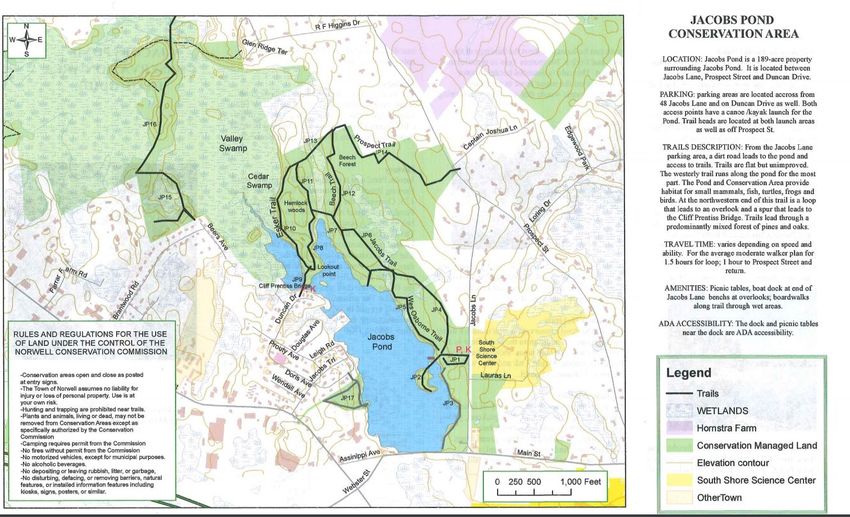
stream deposits were left behind as long winding ridges. The esker trail around Jacobs’s Pond is an
excellent local example of this phenomenon.
Norwell’s soils are primarily a Scituate-Essex-Merrimac soil association characterized by nearly-
level to gently-sloping, moderately well-drained soils formed in glacial till. Scituate soils tend to be
very stony sandy loams, wet in spring and fall, and most suitable for pastureland or woodland.
Essex soils also are well-drained but stonier and tend to follow the higher elevations in Town.
Merrimac soils were formed in sand and gravel and are very well-drained.
28 of 98
Section 4 – Environmental Inventory and Analysis
Norwell 2021 OSRP_working draft November 2020.docxWORKING DRAFT Norwell 2021 OSRP
These soils usually present no major barriers to construction. However, because nearly 30% of the
Town is comprised of wetlands and there are areas with pockets of boulders and other obstacles,
it is often necessary to try several locations to find a suitable site for a septic system for a private
residence. This often results in a need for larger lots and sometimes limits the number of lots in a
subdivision.
Norwell’s sloping hills are the creation of a Town-wide drumlin field leftover from the ice ages. The
lowest points in Town are found along the North River (sea level), while the highest is Mt. Blue (220
ft.) and Judge’s Hill (240 ft.) at the northern end of the Town. The top of both Judge’s and Paradise
Hills (200 ft.), are home to water standpipes that create a gravity-pressurized municipal water
system. Most of the rest of the Town gently rises and falls between 75 foot and 150-foot elevations.
The North River and its floodplain cuts a half-mile-wide channel through this sandy plateau, leaving
fairly steep 50’-100’ wooded bluffs in some areas.
29 of 98
Section 4 – Environmental Inventory and Analysis
Norwell 2021 OSRP_working draft November 2020.docxWORKING DRAFT Norwell 2021 OSRP
30 of 98
Section 4 – Environmental Inventory and Analysis
Norwell 2021 OSRP_working draft November 2020.docxWORKING DRAFT Norwell 2021 OSRP
LANDSCAPE CHARACTER
The Town of Norwell is located in the “Southern New England Coastal Plain and Hills” region as
defined by the EPA. Norwell’s landscape character is defined by scenic roadways lined with trees
and stone walls. Common, treasured Town features include open fields, ponds, large wetland
resource areas, and the North River. The North River forms a portion of the Town’s boundary
stretching from Scituate to Pembroke. Norwell’s landscape can be characterized as a sloping
coastal plain dotted with small hills and valleys.
Norwell contains many broad, flat swamps, some of which are associated with streams and others
that are isolated, including one notable wetland southeast of the intersection of Grove and Prospect
Streets that is completely isolated from any other surface waters. Surface and subsurface hydrology
and flow direction are significant factors that impact land use as well as resource areas.
WATER RESOURCES
Watersheds
Roughly 30% of the Town’s area is comprised of water and wetlands. Norwell is part of the
Massachusetts South Coastal Watersheds, but more specifically, the Town lies in two major
watershed basins: the Weir River in the north, and the North River Basin for the remainder and
majority of the Town, as shown in Map 5a: Water Resources. The following lists the watershed sub-
basins and significant surface water bodies found in Norwell:
• Accord Pond along Norwell’s west border flows into the Weir River Basin to the north.
• Jacobs Pond (Upper Third Herring Brook) drains into the Third Herring Brook to the south
and ultimately the North River to the southeast.
• Wildcat Brook watershed includes, from west to east, Wildcat Creek, Margaret’s Brook
(just east of the Town Offices), and Wildcat Brook, all flowing into Third Herring Brook.
• Upper Second Herring Brook flows south into the North River Basin at Norris Reservation.
• Stony Brook at the easterly end of Norwell flows southeasterly into the North River.
• First Herring Brook at the northeast portion of Norwell flows south and then easterly into
the tidal Herring River before merging into the North River estuary in Scituate.
• The North River Basin which includes the creeks and streams along River Street, including
Dwelley’s Creek, Copeland Tannery Brook, and the un-named stream that crosses Lantern
Lane and Tiffany Road before flowing into the Third Herring Brook at Tack Factory Pond.
Under the Massachusetts Rivers Protection Act, the area within 200 feet of the mean annual high
water line of a permanently flowing river is designated as “Riverfront Area” and afforded special
protection as a resource area (rather than a buffer zone). In addition to having jurisdiction over
various wetlands and 100-year floodplain, the Norwell Conservation Commission also has
jurisdiction over any project proposed in the 200-foot Riverfront Area. Further, the Norwell Town
Code §61.3(B) affords a 50-foot no-disturb zone around any jurisdictional wetland, vernal pools
and perennial rivers and streams.
31 of 98
Section 4 – Environmental Inventory and Analysis
Norwell 2021 OSRP_working draft November 2020.docxWORKING DRAFT Norwell 2021 OSRP
The upper reaches of streams, or headwaters, are essential habitats for the food chain base within
aquatic systems. These areas can also provide high species diversity, which is a measure of system
health.
32 of 98
Section 4 – Environmental Inventory and Analysis
Norwell 2021 OSRP_working draft November 2020.docxWORKING DRAFT Norwell 2021 OSRP
Ponds
Norwell has one natural pond, Black Pond, identified as a kettle hole. There are 13 man-made
ponds of varying sizes throughout Norwell that were primarily built for saw and grist mills in the
1700’s and1800s. None of the ponds are suitable for swimming, but many are used as fishing spots,
for ice-skating, and some for non-motorized boating. The most notable ponds include:
• Jacobs Pond, a man-made recreational pond used for fishing, canoeing, and skating and
historically also used for swimming, located between Washington Street (Route 53) and
Jacobs Lane, is the Town’s largest and most visible pond with more than 50 acres. Although
Jacob’s Pond was listed on the 1998 Massachusetts DEP 303d list of impaired waterways
due to “noxious aquatic plants,” it has since been removed and is now identified as
“Category 4B”. 24
• Hatch Pond, which connects to Cole School and contains trails, observation platforms,
benches, and outdoor classroom areas.
• Accord Pond is located partially in Norwell, and the water rights belong to Hingham.
• Bound Brook Pond (aka Stockbridge Pond) is a significant resource to wildlife, especially
waterfowl. It also provides skating, fishing, and other recreational values. It, too is
plagued by noxious weeds and poor water quality.
• Torrey’s Pond off of Mill Lane, a man-made pond from the damming of Second Herring
Brook and a popular skating location.
Eutrophication, which is a very slow process when naturally occurring, taking five to 10 thousand
years in kettle holes, has resulted in the conversion of a number of kettle holes to swamps. The bulk
of this conversion has occurred more recently within the last 100-200 years. The increased density
of houses and other impervious surfaces can expedite eutrophication due to associated nutrients
entering the waters in runoff containing fertilizers.
The Black Pond Bog property was purchased by The Nature Conservancy in 1962 as its first
purchase in the Commonwealth due to its unique features and surrounding habitats. The flows from
the Pond and wetlands complex reach the Second Herring Brook just below Torrey Pond.
The North River
The North River is a tidal estuary that comprises most of the Town’s eastern border and is one of
the South Shore’s most scenic and historically significant attractions. An estuary is a river that is
heavily influenced by the tides and has both fresh and saltwater features. The headwaters of the
river are in Pembroke, and the River and/or its tributaries pass through Hanson, Pembroke,
Hanover, Marshfield, Norwell and Scituate before emptying into the ocean between 3rd and 4th
Cliffs in Scituate. Many different habitat types are found in and around the North River estuary,
including shallow open waters, freshwater tidal marsh (one of three in Massachusetts), salt marshes,
mud flats, wooded swamps, and even a freshwater Wild Rice stand. The North River is a unique
natural resource and as such is afforded special protection as the Commonwealth’s only Scenic River
to date.
24 Category 4b is reserved for waters impaired by one or more pollutants that are expected to attain their
designated uses without TMDL implementation
33 of 98
Section 4 – Environmental Inventory and Analysis
Norwell 2021 OSRP_working draft November 2020.docxYou can also read