Agricultural Policy Action Plan - (APAP) - agriculture, forestry & fisheries - Tralac
←
→
Page content transcription
If your browser does not render page correctly, please read the page content below

Agricultural Policy
Action Plan
(APAP)

      agriculture,
      forestry & fisheries
      Department:
      Agriculture, Forestry and Fisheries
      REPUBLIC OF SOUTH AFRICA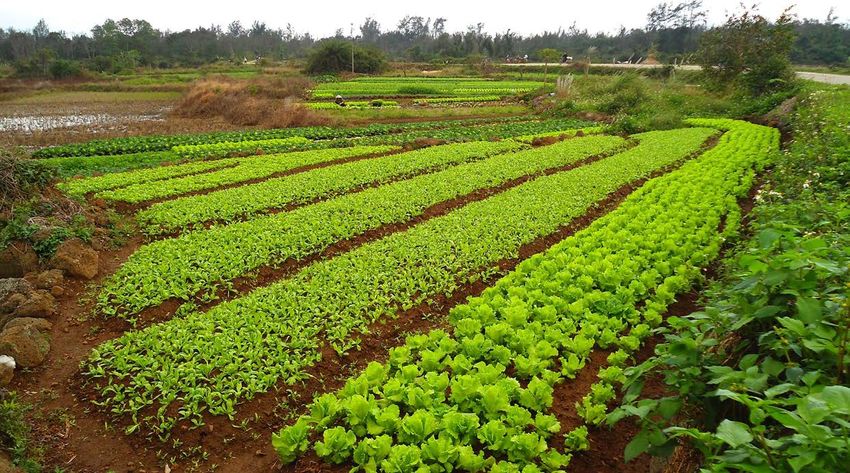

Agricultural Policy Action Plan (APAP)
2015–2019

Department of Agriculture, Forestry and Fisheries

November 2014

                Agricultural Policy Action Plan
2014

Published by
      Department of Agriculture, Forestry and Fisheries

Design and layout by
      Directorate Communication Services
      Private Bag X144,
      Pretoria 0001

                                                          Agricultural Policy Action Plan
CONTENTS
1. Executive summary                                                                   1
2. Policy framework                                                                    2
   2.1 National Development Plan (NDP)                                                 2
   2.2 New Growth Path                                                                 4
3. Problem statement                                                                   6
   3.1 Introduction                                                                    6
   3.2 Primary agriculture                                                             6
   3.3 Forestry                                                                        11
   3.4 Fisheries                                                                       16
   3.5 Agri business                                                                   17
4. Decent work in agriculture, forestry and fisheries                                  19
5. Overview of the response                                                            20
6. Sectoral interventions                                                              22
   6.1 Poultry/soya beans/maize integrated value chain                                 22
   6.2 Red meat value chain                                                            28
   6.3 Wheat value chain                                                               34
   6.4 Fruit and vegetables                                                            38
   6.5 Wine industry                                                                   43
   6.6 Sugar value chain                                                               47
   6.7 Biofuels value chain                                                            51
   6.8 Forestry                                                                        53
   6.9 Small-scale fisheries                                                           60
   6.10 Aquaculture Competitiveness Improvement Programme (ACIP)                       63
7. Transversal interventions                                                           68
   7.1 Fetsa Tlala                                                                     68
   7.2 Research and innovation                                                         69
   7.3 Promoting Climate-Smart Agriculture (CSA)                                       72
   7.4 Trade, agri business development and support                                    74
   7.5 SIP11                                                                           77
   7.6 Biosecurity                                                                     78
8. APAP Planning, monitoring and evaluation                                            79
   8.1 Introduction                                                                    79
   8.2 APAP planning process                                                           80
   8.3 Planning, monitoring and reporting responsibilities                             81
   8.4 APAP high level (outcome) indicators                                            83
9. Bibliography                                                                        82
Tables and figures
Table 1: The employment creation potential of South African agriculture (NDP, 2012)    3
Table 2: Land utilisation comparisons                                                  14
Table 3: Concentration ratios by total income for top 5 and top 10 enterprises, 2008   18
Table 4: Poultry/soya beans/maize integrated value chain                               25
Table 5: Red meat integrated value chain                                               30
Table 6: Wheat value chain                                                             35
Table 7: Fruit and vegetable value chain                                               40
Table 8: Sugarcane value chain                                                         49
Table 9: Forestry value chain                                                          55
Table 10: Aquaculture value chain                                                      64
Table 11: Agricultural research expenditures in South Africa, 2000 and 2007            70

III               Agricultural Policy Action Plan
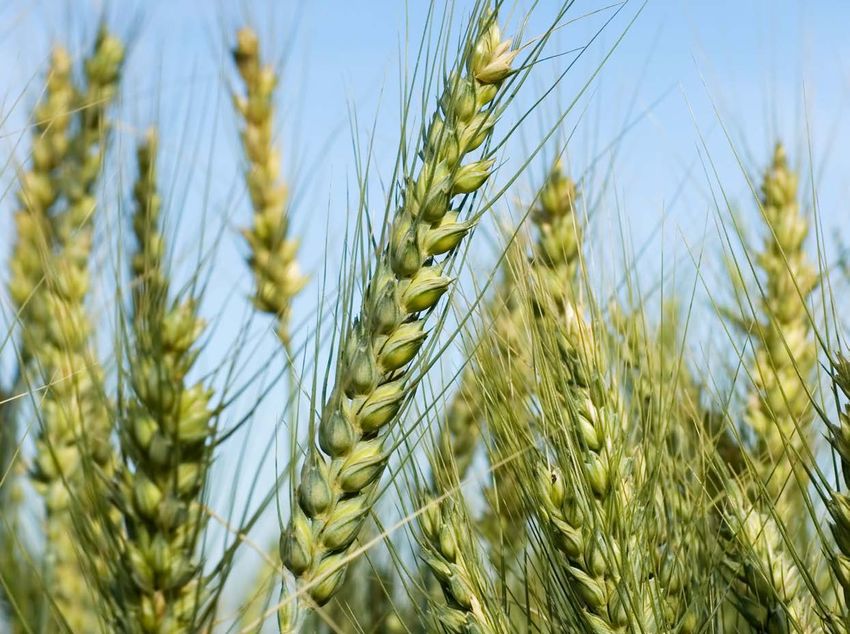
Table 12: Planning, monitoring and reporting responsibilities                                            81
Table 13: APAP impact indicators                                                                         82
Table 14: Reporting template for APAP                                                                    82

Figure 1: Policy alignment                                                                               2
Figure 2: Agricultural growth and employment potential (NDP, 2012)                                       4
Figure 3: Real value added in agriculture, forestry and fisheries                                        6
Figure 4: Long-term trends in number of farm units and average farm size                                 7
Figure 5: Long-term trends in farm employment                                                            7
Figure 6: Fertiliser production, trade and use, 1965-2011                                                8
Figure 7: South Africa’s fertiliser imports and exports in metrics tons                                  8
Figure 8: Value of imported agricultural inputs relative to agricultural net exports                     9
Figure 9: Cost of production as % of turnover (1994-2013)                                                9
Figure 10: Price indices of fertiliser, fuel and animal feed (1980-2012)                                 10
Figure 11: Estimated numbers of smallholder households, 2009-2013                                        10
Figure 12: The contribution of agriculture to GDP 1993-2012 (agriculture as a % of GDP)                  11
Figure 13: Value added to GDP at current prices (Rest of the South African economy versus Agriculture)   11
           1993—2012
Figure 14: Forestry contribution to GDP                                                                  12
Figure 15: Forestry imports and exports                                                                  12
Figure 16: Commercial forestry by main use                                                               13
Figure 18: Plantation area by province                                                                   13
Figure 19: Total plantation area                                                                         14
Figure 20: Commercial forestry hectarage by main use, 1979/80 – 2011/12                                  15
Figure 21: Investment in plantations by province 2011                                                    15
Figure 22: Investment in sector by type of processing plant                                              16
Figure 23: Exports and imports of fish and seafood, 1988-2011 (inflation adjusted)                       18
Figure 24: Trends in formal and informal employment in agro-processing                                   19
Figure 25: Capital-labour and employment-output ratios for food products, 1970-2010                      22
Figure 26: Meat consumption in South Africa                                                              23
Figure 27: Chicken production over consumption                                                           23
Figure 28: Broiler consumption                                                                           24
Figure 29: South African beef production,consumption and price                                           29
Figure 30: Sheep meat production, consumption and imports                                                29
Figure 31: Area planted and production of wheat                                                          35
Figure 32: Production and consumption of wheat                                                           35
Figure 33: Total crop area                                                                               47
Figure 34: Number of SS and LS growers                                                                   48
Figure 35: Sugar value chain                                                                             49
Figure 36: New afforestation by product 2012                                                             53
Figure 37: New afforestation by province, 2012                                                           54
Figure 38: Plantation area by ownership 2011                                                             54
Figure 39: Full-time employment in the South Africa’s aquaculture sector, represented by species         64
           group during 2012
Figure 40: APAP approval process                                                                         80
Figure 41: APAP institutional framework                                                                  81

                                                                Agricultural Policy Action Plan          IV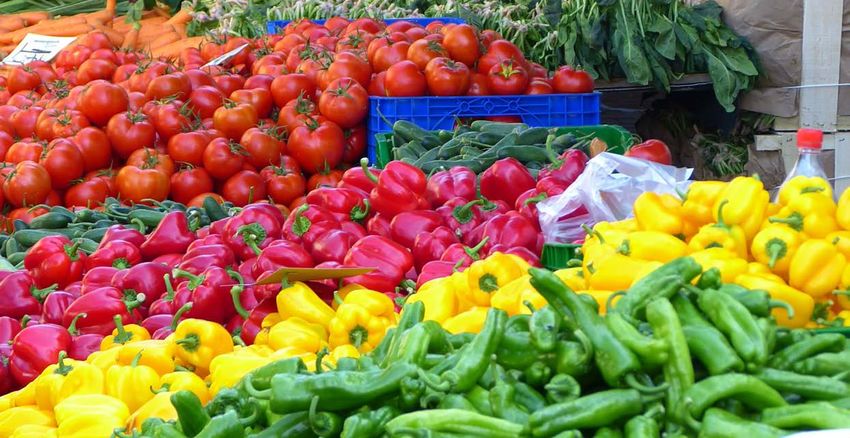
V Agricultural Policy Action Plan

Acknowledgements

                   In Loving Memory of Comrade Nkosinathi Nomatiti, one of the pioneers of the
                   Agricultural Policy Action Plan (APAP)

                                                       Agricultural Policy Action Plan           VI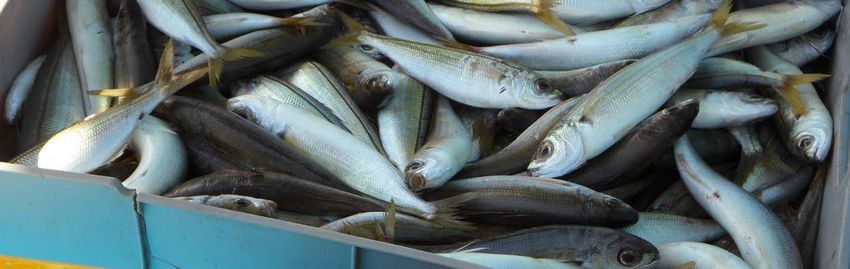
1. EXECUTIVE SUMMARY
Agriculture, forestry and fisheries (AFF) are widely recognised as sectors with significant job creation potential
and with strategic links to beneficiation opportunities. However, although between 1994 and 2012 the real
contribution of AFF to GDP increased by 29%, over the same period employment declined in both primary
production and agro-processing by about 30% to 40%. This combination of slow-to-modest growth and
declining employment, continues a longer-term trend evident since at least the 1970s. The challenges facing
AFF are numerous: rising input costs, an uneven international trade environment, lack of developmental
infrastructure (rail, harbour, electricity), and a rapidly evolving policy and production environment. At the same
time, transformation of the AFF sectors has been slow and tentative.
While there have been a variety of sector strategies established in the past, and while some progress has
been made, there is recognition of a need to sharpen our analysis of what accounts for sluggish growth
and job losses in AFF, and what is required to reverse this trend. At the same time, it is recognised that
while the Agriculture, forestry and fisheries sectors play various strategic roles in respect of food security,
agrarian transformation and rural development, and in supporting industrial development, it is also the case
that AFF is under-funded: according to National Treasury’s estimates of consolidated government budgets and
expenditure (‘functional classification’), the share of public money going to agriculture, forestry and fisheries
has been at around 1,7% over the past four years, and is expected to decline to 1,6% over the next two. The
OECD recognises South Africa’s agriculture sector as among the least supported in the world: South Africa’s
Producer Support Estimate is currently 3,2%, versus 4,6% for Brazil, 7,1% for the US, and 18,6% for the
OECD. Of particular concern is the lack of attention to R&D: according to the 2009/10 R&D survey conducted
by HSRC on behalf of the Department of Science and Technology (the most recent survey for which the results
are available), agriculture accounted for only 6,9% of South Africa’s total R&D spend. This state of affairs can
in part be explained by the absence of a compelling, widely-supported strategy and implementation plan.
A detailed analysis of the various challenges is given in the Integrated Growth and Development Policy for
Agriculture, Forestry and Fisheries, or ‘IGDP’. Based on this analysis, the IGDP also outlines appropriate
responses. The Agricultural Policy Action Plan (APAP) seeks to translate the high-level responses offered in the
IGDP into tangible, concrete steps. However, this first iteration of APAP is not offered as a fully comprehensive
plan; rather, based on the model of the Industrial Policy Action Plan (‘IPAP’), it identifies an ambitious but
manageable number of focused actions, in anticipation of future APAP iterations that will take the process
further. APAP is planned over a five-year period and will be updated on an annual basis. Aligning itself with
the New Growth Path (NGP), the National Development Plan (NDP) and Industrial Policy Action Plan (IPAP),
APAP seeks to assist in the achievement of Outcome 4, Decent Employment through Inclusive Growth, and
that of Outcome 7, Comprehensive Rural Development and Food Security.
This document is organised as follows:
• Chapter 2 describes the policy context and arguments presented in key guiding documents such as the New
  Growth Path (NGP), the National Development Plan (NDP) and Industrial Policy Action Plan (IPAP).
• Chapter 3 offers the over-arching problem statement by way of an economic analysis of growth and em-
  ployment trends within the three sectors. Each of the three sectors has its own issues and dynamics, with
  the common threads being a tendency towards greater capital intensity in both primary production and
  processing/beneficiation, high levels of concentration in beneficiation subsectors, and an inadequate pace
  of transformation.
• Chapter 4 briefly recaps the main response areas outlined in the IGDP, namely Equitable growth and com-
  petitiveness; Equity and transformation; Environmental sustainability; and Governance.
• Chapters 5 and 6 present the main ‘actions’ of the Agricultural Policy Action Plan; Chapter 5 focuses on the
  ‘sectoral interventions’ that concern selected subsectors/value chains, while Chapter 6 covers APAP’s initial
  ‘transversal interventions’, meaning those actions which will support multiple subsectors, e.g. by means of
  addressing common constraints or addressing core competencies.
• Lastly, the document describes in Chapter 7 the implementation management, monitoring and evaluation
  processes of APAP, ensuring that it remains an action plan addressing binding constraints and key chal-
  lenges in creating decent employment and an inclusive rural economy.

1                 Agricultural Policy Action Plan

2. POLICY FRAMEWORK
APAP aligns itself with the New Growth Path (NGP), the National Development Plan (NDP), and the Medium
Term Strategic Framework in respect of Outcomes 4, 7 and 10. This is illustrated schematically in the figure
below, and detailed in the paragraphs that follow.

Figure 1: Policy alignment

2.1 National Development Plan (NDP)
Vision 2030 of the National Development Plan (NDP) calls for an inclusive rural economy wherein:
“...rural communities should have greater opportunities to participate fully in the economic, social and political
life of the country. People should have access to high-quality basic services that enable them to be well-
nourished, healthy and increasingly skilled. Rural economies will be supported by agriculture, and were
possible by mining, tourism, agro-processing and fisheries…better integration of the country’s rural areas,
achieved though successful land reform, job creation and poverty alleviation”
The 2030 vision speaks of the inclusivity and integration of rural areas, through successful land reform, job
creation and poverty alleviation, and places Agriculture as the driving force behind this vision. The NDP
identifies the following as key catalytic interventions include “expansion of irrigated agriculture, supplemented
by dry-land production where feasible. In areas of low economic potential, the NDP speaks of the importance
of basic services such as basic education, health care, basic services and social security to support the
development of human capital.
As the primary economic activity in rural areas, the NDP sees agriculture as having the potential to create
close to 1 million new jobs by 2030, a significant contribution to the overall employment target. To achieve this
target the NDP identified the following key activities:
• Expand irrigated agriculture: Evidence shows that the 1,5 million hectares under irrigation (which produce
  virtually all South Africa’s horticultural harvest and some field crops) can be expanded by at least 500 000
  hectares through the better use of existing water resources and developing new water schemes.
• Underutilised land in communal areas and land reform projects for commercial production. Better land
  use in communal areas could improve the livelihoods of at least 370 000 people, and create around 300 000
  jobs by 2030.
• Pick and support commercial agriculture sectors and regions that have the highest potential for growth
  and employment.
• Support job creation in the upstream and downstream industries.
• Find creative combinations between opportunities. For example, emphasis should be placed on land
  that has the potential to benefit from irrigation infrastructure, and priority should be given to successful farm-
  ers in communal areas, which would support further improvement of the area and industries and areas with
  high potential to create jobs should receive the most support. All these will increase collaboration between
  existing farmers and the beneficiaries of land reform.
• Develop strategies that give new entrants access to product value chains and support from better-
  resourced players.

                                                                    Agricultural Policy Action Plan                2
The above strategy is depicted by the NDP in a tabular form below, discussed in the sections following.
Table 1: The employment creation potential of South African agriculture (NDP, 2012)
TARGET GROUP PRIMARY JOBS CREATED SECONDARY JOBS CREATED
Subsistence farmers with
83 000 41 500
5 hect-
75 000 37 500
ares of land
Better use of redistributed
70 000 35 000
land
Labour intensive winners 200 000 100 000
Labour-extensive field
10 000 5 000
crops
Labour extensive livestock 40 000 25 000
TOTAL 643 000 326 500
GRAND TOTAL 969 500
Jobs and livelihoods in communal areas
The NDP provides evidence for job creation if the right conditions are created, such as the better utilisation of
land. Better land use in communal areas could improve the livelihoods of at least 370 000 people, and create
about 300 000 jobs, based on the following assumptions.
Firstly, assuming that 831 871 plots of less than half a hectare are largely vegetable gardens and that the
34 546 farmers with more than 20 hectares farm in commercial areas, leaving some 440 000 households who
farm on between 0,5 and 20 hectares of land. The NDP calculates that if one out every 10 households with
less than 0,5 hectares is improved, about 83,187 jobs are created; and if at least 25 000 smallholder farmers
with access to more than five hectares of dry land employ at least 2 people, about 50 000 jobs can be created.
In addition, if farmers on between 0,5 and 5 hectares benefit from better livelihoods, an estimated 165 000.
The following are extracts from the NDP.
Large labour-intensive agriculture
The NDP further argues the importance of commercial agriculture for job creation, which has the potential to
create 250 000 direct jobs and a further 130 000 indirect jobs. The NDP identifies agricultural subsectors with
the potential for long-term, sustainable expansion in production and value adding processes, as illustrated in
figure 2. Those looked at in chapter 6 of the NDP include citrus, table grapes and vegetables.
Citrus
The employment requirement to produce citrus fruit is estimated at one worker per hectare of an estimated
60 000, translating into about 60 000 workers employed on citrus farms. Direct downstream labour requirements
for citrus are estimated at one labourer per 2 500 cartons packed: with about 100 million cartons packed
per year, some 40 000 jobs are created in packing plants for a period of six months, or 20 000 full-time
equivalents. In addition, there are labour requirements for transportation, warehousing, port handling, research
and development, and processing.
Table and dried grapes
Opportunity to expand table and dried grape vineyards lies mainly in the Orange River region. At present,
water rights are available for an extra 8 000 hectares, of which about 4 700 are expected to be planted for table
and dried grapes over the next decade, this represents about 23 500 hectares of table and dried grapes, with
an employment requirement of 1,6 workers per hectare, so about 38 000 workers are currently employed on
these farms. This represents an expansion of 4 200 hectares since 2000, indicating that 6 720 additional jobs
were created.
3 Agricultural Policy Action PlanSubtropical fruit
Farms have either become unproductive or producers are not willing to reinvest, choosing to move production
to better locations in other African countries. The NDP identifies failing land reform projects as the major cause
e.g. the banana industry, where the area under production has declined from 18 000 to 12 000 hectares over
the past decade.
Figure 2: Agricultural growth and employment potential (NDP, 2012)
The Subtropical fruit industry, with a labour multiplier of two workers per hectare, can create a significant
number of jobs if the necessary technical and financial support is injected into just one third of the underused
area.
Similarly, the avocado industry has a lot to offer in employment creation. While the hectares under banana
production have been declining over the past decade, the area under avocado production has expanded
rapidly. The industry argues that production could expand by a further 70% (9 275 hectares) over the next
decade. With a labour multiplier of almost two labourers per hectare and upstream and downstream linkages
of about 1,3 jobs per hectare, roughly 30 000 jobs can be created over the next 10 years. About 90 000 tons
of avocados are now produced, of which more than 50% is exported, 10% processed and the rest sold into
the fresh market.
2.2 New Growth Path (NGP)
The New Growth Path (NGP) is South Africa’s vision to place jobs and decent work at the centre of economic
policy. It sets a target of five million additional jobs by 2020, and sets out the key employment drivers and the
priority sectors that the country will focus on over the medium term.
The NGP seeks to shift the economy towards strong, sustained, and inclusive economic growth with an emphasis
on the rebuilding of the productive sectors of the economy. Infrastructure development and agriculture, in
particular, have been identified as a foundation for more jobs and addresses rural underdevelopment. The
NGP set targets of increasing the smallholder sector by 300 000 households, ensuring 145 000 additional jobs
in agro-processing, and upgrading conditions for 660 000 farm workers.
The NGP provides the following broad policy guidelines for agriculture, forestry and fisheries:
• Restructuring of land reform to support smallholder schemes with comprehensive support around infrastruc-
ture, marketing, finance, extension services, etc.
• Upgrading employment in commercial agriculture, especially through improved worker voice
• Measures to support growth in commercial farming and to help address fluctuations in maize and wheat
prices while supporting national food security
• Acceleration of land claims processes and better support to new farmers following restitution settlements
• Programmes to ensure competitive pricing of inputs, especially fertiliser
• Support for fishing and aquaculture.
Agricultural Policy Action Plan 4Medium Term Strategic Framework (MTSF) The first cycle (i.e., 2014–2019) of this Medium Term Strategic Framework (MTSF) for the rural sector will focus primarily on seven imperatives that are a core foundation for an inclusive and integrated rural economy, as follows: • Improved land administration and spatial planning for integrated development, with a bias towards rural areas • Improved and sustainable agrarian reform and food security • Smallholder farmer development and support (technical, financial, infrastructure) • Increased access to quality basic infrastructure and services, particularly in education, healthcare and pub- lic transport • Sustainable rural enterprises and industries characterised by strong rural-urban linkages, increased invest- ment in agro-processing, trade development and access to markets and financial services • Reduce rural unemployment • Improved integration and coordination of rural development across all spheres of government and between government departments as a result of implementation of synchronised rural development strategies. To achieve the seven imperatives as listed above, and due to the potential for job creation envisaged through agriculture, there is a need for a clear direction and a consistent focus on four aspects during 2014–2019, namely: • Provision of comprehensive support to smallholders to ensure increased productivity • Investment in agro-processing to enhance job creation • Trade development and market access through harmonisation of agricultural policies and targeted support to strategic initiatives • Sustainable management of natural resources. 5 Agricultural Policy Action Plan
For subsequent cycles, the rural sector as a whole will focus on the following:
• Leveraging on established institutional arrangements and spatial planning tools and instruments to further
  advance affective urban-rural integration
• Strengthening development planning based on effective spatial development frameworks at all three spheres
  to further unlock benefits in agricultural, forestry and fisheries value chains
• Up-scaling implementation towards achieving concrete targets in the relevant sectors.

3. PROBLEM STATEMENT
3.1 Introduction
The agriculture, forestry and fisheries sectors have a number of commonalities, they are each based on renew-
able resources which require careful management, they each contribute significantly to the agro-processing
sector; they each operate in highly competitive and uneven international markets, and each is characterised
by a wide range of producers, from very large to very small.
However, they also face distinct challenges and offer diverse opportunities. Agriculture has undergone enor-
mous structural changes, such that it has tended on the whole to lose jobs rather than gain them; fisheries is
facing depleted stocks of marine and coastal wild capture fisheries, but shows enormous potential in terms of
aquaculture; and forestry is constrained by stringent water regulations, under-investment in long-rotation saw-
log plantations, and theFigure
                          need3:toReal
                                    find value
                                         a strategic,
                                               addedcoordinated approach involving the State, the private sector,
communities, and 2
                   public  entities.

Figure 3: Real 1.8
               value added in agriculture, forestry and fisheries, 1993-2012 (1993=1)
                        1.6
                        1.4
          Percentages

                        1.2
                         1
                        0.8
                        0.6
                        0.4
                        0.2
                              1993
                                     1994
                                            1995
                                                   1996
                                                          1997
                                                                 1998
                                                                        1999
                                                                               2000
                                                                                      2001
                                                                                             2002
                                                                                                    2003
                                                                                                           2004
                                                                                                                  2005
                                                                                                                         2006
                                                                                                                                2007
                                                                                                                                       2008
                                                                                                                                              2009
                                                                                                                                                     2010
                                                                                                                                                            2011
                                                                                                                                                                   2012

                                                                                              Year

                                                     Agriculture                               Forestry                                Fisheries

                              Source: Stats SA 2012

3.2   Primary agriculture
Between 1950 and the present, the number of commercial farming units in primary agriculture has declined
from almost 120 000 to around 39 000. This decline has been remarkably steady, and has been accompanied
by a commensurate increase in average farm size, and a change in the technology mix on farms (see figures 4
and 5). In short, as farms grow larger, they tend to rely less on labour and more on capital and chemical inputs.
In terms of employment it is worth mentioning that agriculture used to be the source of employment for many
unskilled workers in South Africa. The total employment in the 1950s was approximately 1,4 million people
employed in commercial agriculture, and they supported approximately four million dependents. However, the
overall trend has been one of job loss, both in terms of regular/permanent jobs, and casual/seasonal jobs. In
the mid-1990s, the number of people employed in commercial agriculture decreased to 914 000 employees,
of which 67% were employed on a regular basis while 33% were engaged as casual/seasonal workers (DAFF,
2010). Of the 2,2 million people employed in the former homelands, 37% reported that they were engaged in
subsistence farming (StatsSA, 2000). From 2000 to 2012, employment in the agriculture sector decreased by
more than half, i.e. from 1,4 million jobs in September 2000 to a mere 661000 jobs (DAFF, 2010).

                                                                                                                           Agricultural Policy Action Plan                6
Figure 4: Long-term trends in number of farm units and average farm size
Source: Stats SA, misc.
Figure 5: Employment level in agricultural sector
Figure 5: Employment level in agricultural sector
900
800
700
Labour ('000)
600
500
400
300
Source: Stats SA, misc.
South Africa’s pattern of increasing farm size and declining farm employment is common in many other coun-
tries, especially developed countries. However, whereas elsewhere this phenomenon normally coincides with
a growing scarcity of labour because of more attractive opportunities elsewhere, in South Africa it is happening
amidst a deepening problem of rural unemployment. Reversing this trend will require a combination of strate-
gies, further articulated in the National Development Plan:
• Encouraging a shift towards more labour-intensive agricultural subsectors
• Encouraging fuller use of land within commercial farming areas, especially via conservation agriculture and
land redistribution
• Strengthening the smaller stratum of large-scale commercial farms, which account for a disproportionate
share of farm jobs
• Promoting a better balance between large-scale commercial farms and smallholder farms via land reform
and development within the former homelands.
What drives average farm size to get larger over time? One of the key factors is the continuous reliance on
capital intensive production systems, in turn leading to declining returns per hectare. This is further evident in
the decreasing rate of income generated in the primary sector, and further aggravated by the fact that since
the 1990s South African farmers have not benefited from generous state subsidies as do many producers of
developed economies.
Figures 6 and 7 illustrates one aspect of the problem, relating to fertiliser. Since around 1999, South Africa’s
domestic production of fertiliser started to decline appreciably, and the gap between domestic use and produc-
tion has thereafter increasingly been made up by fertiliser imports, which are expensive.
7 Agricultural Policy Action PlanFigure 6: Fertiliser production, trade and use, 1965-2011
Source: FAO Stat 2013
Figure 7: South Africa’s fertiliser imports and exports in metrics tons
Source: Fertiliser Association of Southern Africa, 2013.
In fact, South Africa’s agriculture sector relies increasingly on imported agricultural inputs–not only industrial
inputs such as chemical fertilisers, diesel and machinery, but also ingredients for animal feed.
In 1990, less than 20% of fertiliser needs were imported. It increased to 40% in 1999, and since 2008, over
65% of South Africa’s nutritional fertiliser needs were imported (GrainSA, 2011). Fertiliser imports, excluding
ammonia, phosphate rock and phosphoric acid, exceeded one million metric tons per year since 2010 while
exports remained stable around the 400 000 tons per year mark. The result was a net import volume of more
than one million tons in 2011 and 2012, reaching a height of 1,2 million tons (see figure 6). Increasing imports
is attributed to the absence of potassium sources, no urea production facilities and limited production capacity
for downstream fertiliser products in South Africa (Fertiliser Association of Southern Africa, 2014). The implica-
tion is increasing fertiliser prices (relative to commodity prices) which influences the long-term profitability of
production systems. The knock-on effects are both downstream and upstream of the value chain. The influ-
ence of high fertiliser prices will in turn have a negative impact on South Africa’s food security. Our heavy reli-
ance on imported fertiliser presents a considerable risk for the agricultural industry as a whole, and in particular
for the grain crop sub-sector.
The risks of being increasingly reliant on imports to satisfy local demand should be sufficient motivation to
engage in more sustainable production systems by revitalising the local fertiliser and animal feed industry. To
be solely dependent on imports lends itself to price volatility and producers ability to produce affordable food
for the country.
The value of imported fertiliser, diesel and machinery have for many years exceeded the value of agricultural
net exports (see figure 8), meaning that even though agriculture may appear to make a positive contribution
to the trade balance, this is not necessarily the case. In Figure 8, wherever the trend line rises above the
horizontal line at 100%, the value of imported fertiliser, diesel and machinery more than negates the surplus
Agricultural Policy Action Plan 8of agricultural exports over agricultural imports, and this appears to be happening with increasing frequency.
Years in which the value of imported agricultural inputs is especially high relative to agricultural net exports
(1992, 1995, and 2007) are those in which domestic production conditions were poor; typically imported farm
inputs were more or less average, while agricultural net imports were especially low.
The cost of production as a percentage of the annual turnover shows an upward trend from 1994 to 2013 (See
figure 9). In 1994, the cost of production as % of turnover was 42,7 %, which rose to 56,9% in 2013.
Figure 8: Value of imported agricultural inputs relative to agricultural net exports
Source: DAFF 2013 and the dti
Figure 9: Cost of production as % of turnover (1994-2013)
Source: DAFF 2014
In 2013, expenditure on intermediate goods (fuel, fertilisers, seeds, animal health remedies, transport, electric-
ity and insurance) made up 79,1% of total production costs. The increase in farm production costs is the result
of increases mainly in the price of farming requisites rather than the quantities consumed. Figure 10 shows
an upward trend in the prices of agricultural inputs from 1980 to 2012 and this appears to be happening with
increasing frequency.
9 Agricultural Policy Action PlanFigure 10: Price indices of fertiliser, fuel and animal feed (1980–2012)
Source: DAFF: 2013
For imported animal feed ingredients, the logical response is to produce more of our own, as indeed is already
happening, and which APAP proposes to continue. For the other mentioned inputs, however, an argument is
now emerging that the key is to promote a shift from conventional agricultural production models to forms of
‘Climate-Smart Agriculture (CSA)’ such as conservation agriculture (CA). Whereas CSA has long been argued
on grounds of environmental sustainability and reducing production risk, another critical advantage of CSA is
that it can achieve the same or greater productivity, but with greatly reduced industrial inputs. By lowering input
costs, we potentially improve the competitiveness of South African farmers, and reverse the trend of agricul-
ture’s negative contribution to the trade balance.
Regarding smallholders, meaning small-scale farmers who produce for the purpose of deriving an income,
there are no consistent data sources that help trace their numbers over the long term. Data available between
2009 and 2013 indicate an upward trend (see figure 11).
Figure 11: Estimated numbers of smallholder households, 2009-2013
Source: Stats SA, misc.
The challenge of growing the smallholder sector is closely tied up with the challenge of making smallholder
agriculture more remunerative. Presently, more than half of all smallholder households live below the poverty
line. The footprint of government support services reaching smallholders has been improving. For instance,
in 2010, only 8% of smallholders were visited by extension officers, but this had increased between 13% and
14% for 2012/13. This momentum must be increased, and other forms of support must improve as well.
Presently, about three quarters of smallholders farm within the former homelands, and the rest are split be-
tween urban areas and commercial farming areas. There is scope to increase the size of the smallholder sec-
tor in each of these areas: in former homelands, there are hundreds of thousands of hectares of under-utilised
arable land (if not more) that can be put back into production, especially with concerted support for input ac-
cess, mechanisation services, technical support, and linkages to local and non-local markets. Smallholders in
Agricultural Policy Action Plan 10urban and peri-urban areas are poorly supported at present, but could contribute to local vegetable production
in particular in commercial farming areas, land reform has created few smallholder opportunities to date, but
has the potential to do far more.
The agricultural sector plays an important role on the growth and development of the South African economy,
but contributes a smaller percentage to the country’s GDP compared to other sectors (see figures 12 and 13).
Although the contribution of agriculture to GDP declined over the past 20 years, its contribution to total value
added grew by an annual average rate of 7,7%. The contribution of agriculture to value added amounted to
R56 795 million in 2013 as compared to R17 216 million in 1994. The annual average contribution of agricul-
ture to GDP is 2,8% and showed an average decline of 3,0% per year since 1993.
Figure 12: The contribution of agriculture to GDP 1993–2012 (agriculture as a % of GDP)
Source: Stats S.A
Figure 13: Value added to GDP at current prices (Rest of the South African economy versus agriculture)
1993–2012
Source: Stats S.A
3.3 Forestry
The Forestry Sector is a major contributor to the South African economy through its well-developed and diver-
sified forest products industry. Although forestry’s overall contribution to total Gross Domestic Product (GDP)
is modest (0,7% in 2012), it supports manufacturing subsectors such as sawmilling, paper and pulp produc-
tion, as well as mining and construction. The Forestry sectors’ contribution to agriculture and manufacturing
GDP is indicated in figure 14. In 2012, contribution to agriculture GDP was 10,4% and 6,1% to manufacturing
GDP, which is a decrease from 11,8% and 6,26% recorded in 2011 (ForestrySA, 2014). In addition to its up-
stream and downstream impact, the sector has a strong potential for job and small business creation.
11 Agricultural Policy Action PlanFigure 14 : Forestry contribution to GDP
Source: Forestry SA, 2014
In 2012, the sector created 165 300 jobs across its entire value chain. Commercial forestry had 62 100 direct
jobs and 30 000 indirect jobs. Total processing jobs in subsectors such as pulp & paper (33%), sawmilling
(41%), timber board (8%), mining timber (3%) and other (15%) totalled 73 200 (DAFF, 2014). Furthermore,
the forest products industry ranks amongst the top exporting industries in the country, maintaining a positive
trade balance, with a total value of R19,3 billion in 2013 for exported forestry products (see figure 15). Paper
and paperboard, pulp of wood, wood and articles of wood, and charcoal were the leading export products that
constituted 94% of total forestry products (see figure 16). The main markets for South African forestry exports
in 2013 were China (11%), Indonesia (10%), Namibia (8%), Japan (8%) and Botswana (7%) (UN Comtrade
Database, 2014)
Figure 15: Forestry imports and exports
Source: ITC, 2013
Agricultural Policy Action Plan 12Figure 16: Commercial forestry by main use
Source: ITC, 2013
Of the total land area [122,3 million (mil) hectares (ha)] in South Africa, only 1% or 1, 268, 443 ha is used for
Forestry. The quantity of land under plantation shrunk from 1,5 million ha in 1997 to about 1,2 million ha in
2012 (ForestrySA, 2014).
The sector needs about 1000 mm of rain, so the area for forestry is very limited and competes with agriculture.
The total area for forestry has decreased over the years especially after the introduction of the National Wa-
ter Act, 1998, which specifically led to the industry losing about 80 000 ha to comply with both the water and
environmental legislations. Total forestry land use by province as a percentage of total Provincial Land Area
is indicated in figure 18. In 2012, plantation area as a percentage of Land Area by Province totalled 40,9% in
Mpumalanga, 39,6% in KwaZulu-Natal, 11,2% in Eastern Cape, 4,4% in Western Cape, and 3,8% in Limpopo
(see figure 18). Production of roundwood in the same year increased to 18 775 467 m3, from 18 586 532 m3
in 2010/11. The value of sales on the other hand decreased from R21,4 billion to R20,7 billion, posting a 3,5%
decrease (DAFF, 2012).
Figure 18: Plantation area by province
Source: Forestry SA, 2012
13 Agricultural Policy Action PlanFigure 19: Total plantation area
Source: Forestry SA, 2012
Figure 19 show a marked decline in both softwood and hardwood plantation since the mid-1990s. There has,
however, been a marked increase in hectarage for pulpwood compared to that of sawlogs and mining timber.
The rate of new afforestation according to Forestry SA (2014) has decreased considerably due to a combina-
tion of factors, more especially around the issuing of water licences and the availability of suitable forestry land.
Total new afforested land amounts to 1,045 ha, which is a decrease of 528 ha recorded in 2011. Pulpwood
accounts for 60% (632 ha) of the newly afforested area, sawlogs 28% (290 ha), and for other purposes 12%
(124 ha). The private sector was responsible for 100% of the reported new afforestation.
In 2012, total land afforested equalled 1 045 ha, with Kwazulu Natal planting 58% and Mpumalanga 40% of
these hectares. However, there is a marked decline in the rate of afforestation in KwaZulu-Natal, down from
71% in 2011 to 58% in 2012, whereas Mpumalanga increased from 30% to about 40% in 2012. These trends
indicates that the sustainable supply of sawlogs is under threat, especially that of hardwood which is critical
for industries such as mining and construction. Only 15 ha of land are afforested for hardwood as compared
to 275 ha for softwood.
South Africa Forestry sector has access to a mere 1,3 million ha of land compared to a combined 101,6 mil-
lion ha of the BRICS countries, indicating that South Africa is less competitive in terms of timber volumes
produced. In terms of global costs, the country used to be in the bottom 25 percentile but now finds itself in
the middle 50 percentile, but despite the improvement in costs, competiveness has deteriorated (ForestrySA,
2014). In addition, South Africa’s competitiveness wanes compared to other BRICS countries, Australia and
New Zealand, as they provide subsidies to their forestry industries. Table 2 shows land utilisation comparisons
between South Africa and other countries/regions.
Table 2 : Land utilisation comparisons
Total Area Forestry Area
Country % of Total Area
Million ha Hectares
RSA* 119,3 1 268 443 1,1
Zimbabwe* 39,1 100 000 0,3
EU 313,1 90 799 000 29,0
USA 957,3 287 190 000 30,0
Canada 922,1 359 619 000 39,0
Japan 37,7 25 259 000 67,0
Russia 1 707,5 785 450 000 46,0
13 116,3
World 3 934 490 000 30,0
Agricultural Policy Action Plan 14Figures 20 and 21 shows total investment in South African forestry amounted to R25,6 billion.
Provincially, Mpumalanga has the highest investment in plantations of 42% or R10,7 billion, followed by KwaZulu
-Natal with an investment amount of R8,9 billion (35%), Eastern Cape at R3,2 billion (12,8%), Western Cape
amounting to R1,5 billion (6%) and Limpopo at R1,1 billion (4,2%) (ForestrySA, 2014).
In summary, forestry is regarded as a water diversion land use. Permits are therefore required to expand the
area under plantation. Factors such as the privatisation of state forests have resulted in the private sector
lessees favouring shorter term returns via pulpwood use, over longer term returns from sawlogs. Other
challenges include the poor resourcing of the State’s Category B and C plantations, which have in turn reduced
their productivity. While there is still net surplus of industry exports over imports, the margin has narrowed by
32% since 1992, and the industry predicts that South Africa will soon become a net importer, especially of
sawlogs. These in turn will likely result in a significant increase in costs in the construction industry, with further
implications for the property market and human settlements. One subsector that has already been affected by
the decline in timber supply is sawmilling, with the number of sawmills declining to 90 by 2010. While it is clear
that the private sector has excellent management capacity and has also ushered in efficiencies across the
value chain, the State on the other hand can still play a significant role in ensuring adequate levels of capital
investment, more especially in longer rotation timber/sawlog plantations.
Figure 20: Commercial forestry hectarage by main use, 1979/80 – 2011/12
Source: Forestry SA, 2012
Figure 21: Investment in plantations by province 2011
Source: Forestry SA, 2011
15 Agricultural Policy Action PlanFigure 22: Investment in sector by type of processing plant
Source: Forestry SA, 2011
3.4 Fisheries
The fisheries sector’s contribution of 0,1% to Gross Domestic Product is small, even by the standards of ag-
riculture. It is however more important for economic development in the Western Cape Province where 11 of
the 13 proclaimed fishing harbours is situated. These contribute more than 5% to Gross Provincial Domestic
Product. The total output is estimated at 600 000 tons worth about R6 billion, depending on the Pelagic catch
of sardine and anchovy, which could be as much as 300 000 tons. It is estimated that the direct employment
in the industry constitutes approximately 27 000 jobs (16 000 in the primary sector and 11 000 in the second-
ary and tertiary sectors), while an additional 81 000 people are indirectly employed in industries that are at
least partially dependent on the fishing industry. Fisheries output is determined by catch volumes which in turn
depend on the health and management of fish stocks, varying according to ecological changes and subjected
to over exploitation through illegal, unreported and unregulated fishing activities. Inshore species are more
vulnerable, especially to stock depletion, as they are easily accessed, especially illegally. Studies show that
68% of commercial linefish stocks have collapsed, and another 11% are overexploited (WWF, 2011).
The DAFF therefore seeks to prevent overexploitation through efficient fisheries management by means of
assigning Total Allowable Catch and/or Total Allowable Effort per species, which are adjusted on a regular
basis depending on the estimated state of the resource. The DAFF further seeks to promote transformation
in the sector through inclusion of small-scale fishing communities. An amendment Bill of the Marine Living
Resources Act, nr.12 of 1989, aims to grant small-scale fishing communities better access to fishing rights and
resources.
Figure 23 shows the trends in fisheries exports and imports, distinguishing between ‘live, fresh and frozen’ on
the one hand, and ‘prepared and preserved’, on the other. There was a dramatic increase in exports of ‘live,
fresh and frozen’ fish and seafood up to around 2002, due to dramatic increasing in demand in southern eu-
rope and live product in the East.
In 1977 South Africa established exclusive economic zones as a means to relieving the pressure imposed
by foreign-owned fishing fleets, creating space for fisheries stocks to recover, and/or for the South African
industries to expand. However, it is difficult to discern a clear trend, although the demand for fresh and live fish
will constantly grow due to a discerning customer in the areas mentioned
It is due to this latter fact that aquaculture is becoming more and more important as a substitute for wild
capture fisheries which appear unlikely to expand beyond their present levels, leaving aquaculture to fill the
increasing gap caused by an unsaturated global demand for protein. While the marine-based ‘mariculture’ part
of aquaculture has been around for some years, focusing on species such as abalone, oysters and mussels,
freshwater aquaculture is experiencing a rapid expansion, owing in part to government’s multi-pronged
aquaculture promotion strategy.
Globally the sector produces 67 metric tons (25 marine and 42 freshwater) to the value of $138 billion, which
shows the huge market potential. Interestingly enough is the fact that countries with a similar length of coast-
line (Vietnam and Thailand) to South Africa’s produces a 100 times more. China, India and Indonesia with
longer coastlines produce even more. Egypt produces more than all other African countries combined.
Agricultural Policy Action Plan 16Even though South Africa’s fish consumption is projected to grow at a substantially lower rate than the rest of the world it offers a two-pronged opportunity in the marketplace. Internationally a huge market already exists which South Africa could tap into with rapid increase in production to meet the demand, while locally the oppor- tunity exists to grow consumption by creating a concerted information drive that will sensitise the public about the huge health benefits that can be derived from eating more fish. The omega oils in fish is known to play a vital role in the prevention of cardio diseases through lower cholesterol levels. It can also, as a high source of protein, assist in the country’s serious obesity problems by limiting weight gain and even decreasing, causing weight loss as part of low kilojoule diet. Fortunately South Africa, does not have to reinvent the wheel and can obviously learn a lot from other coun- tries, especially its BRICS partners and from Chile which focused on supply factors, while Australia concen- trated on financial, research and development programmes to grow supply while using marketing strategies to grow demand. Vietnam on the other hand used comprehensive government led programs to rapidly stimulate production while Egypt trained subsistence farmers/new entrants through an enabling environment. However, cognisance must be taken of the raison d’ ètre why aquaculture is such a successful enterprise in the East. The vast population in the East necessitates huge volumes of food and fish is a staple in many countries, unlike South Africa where maize and chicken are in high demand, fish being at the bottom end of the consump- tion chain. Therefore huge strides will need to be taken to create local demand through coordinated industry wide marketing efforts, as the sector needs this development to participate successfully internationally. A showcase is essential for the achievement of this goal, as most wild capture fisheries are demand driven, whilst aquaculture is supply driven. South Africa, identifying the Oceans Economy as a huge up-tapped industry, endeavoured to unlock this po- tential by subjecting all relevant role players to a planning session involving processes of syndication under various work streams known as “labs”. The approach is known as Operation Phakisa. Out of this approach, the Operation Phakisa Aquaculture Lab developed an aspiration to increase aquaculture growth by five-fold in the next five years from the current 4000 tons to 20000 tons, and further create 15,000 jobs and increase the contribution of aquaculture towards GDP. Since there are many challenges to the establishment of a production unit, project specific issues and enabler issues have been identified as a quick win approach to offer solutions and ensure results speedily. Further- more Operation Phakisa initiatives have been ranked in order of priority, budget requirements specified and legislative reform to promote development established, while a globally recognised monitoring and certification system, a centre for research and development excellence, an aquaculture development fund and preferential procurement for aquaculture products were introduced. Especially preferential procurement by government institutions will go a long way to increase sales through stimulated local demand, since a large portion of the population do not know the nutritional value or price of seafood, the protein/price ratio of chicken and shrimp being 1:5. It is pleasing to note that the lab has identified opportunities to achieve tangible results within the next 12 months, while several issues such as access to land, sea spaces and duration of leases facing the industry were resolved. Therefore, it is hoped that through the intiatives and aspirations of Operation Phakisa aquacul- ture, that South Africa will be able to become a world player and be regarded as the industry force it desires to be contributing to global food security. 3.5 Agri business Agri business comprises largely agricultural input suppliers and the agro-processing sector. Trend data for agro-processors suggests that over the past two decades it has followed a similar pattern to primary agricul- ture – modest real growth coupled with declines in formal sector jobs. The development trajectory of both input suppliers and agro-processors resembles that of many other countries, namely a trend towards higher levels of industry concentration. In general terms it reflects the difficult situation in which countries like South Africa find themselves: for domestic agro-processors to compete internationally, they must seek the same scale ef- ficiencies being captured by agro-processors abroad. However, efficiency in agro-processing is not always in the best interests of primary sectors, whether those in South Africa or elsewhere. 17 Agricultural Policy Action Plan
Table 3: Concentration ratios by total income for top 5 and top 10 enterprises, 2008

                                                                                                                 CR5       CR10

 Agro-processors

 Food products and beverages                                                                                         30%     40%

    Prodn, processing & preserving of meat, fish, fruit, vegetables, oils & fats                                     30%     43%

    Dairy products                                                                                                   71%     81%

    Grain mill products, starches and starch products and prepared animal feeds                                      70%     79%

    Bakery products, sugar, chocolate, etc.                                                                          58%     84%

    Beverages                                                                                                        80%     86%

 Textiles, clothing, leather and footwear                                                                            17%     23%

 Wood, wood products, paper, publishing and printing                                                                 30%     41%

 Agro-input manufacturers

 Fertilisers, nitrogen compounds, plastics and synthetic rubber                                                      87%     92%

 Agricultural and forestry machinery                                                                                 23%     33%

Source: Stats SA 2010

The Competition Commission has intervened in numerous instances, particularly in those subsectors in which
the high degree of concentration has tended to allow for collusion or other forms of anti-competitive behav-
iour. The potential for anti-competitive behaviour is problematic for both primary producers and consumers.
However, even in the absence of collusion, the concentration of agro-processing subsectors, together with
the adoption by supermarket chains of centralised procurement and distribution systems, has led to widening
margins between farm-gate prices and consumer prices. This however mirrors international trends.
Regarding the decline in formal agro-processing jobs since the late 1980s, it appears to be associated with
the trend towards more concentration of the sector. Firstly, as shown in figure 23, the decline in formal agro-
processing jobs coincides with a rapid increase in the real gross fixed investment in the sector. Secondly,
between 1970 and 2012, the food processing subsector of agro-processing has become approximately twice
as capital-intensive as indicated by a doubling of the capital-labour ratio index, along with a decline of about
two-thirds in the ratio in the number of jobs per unit output (figure 24). The likelihood is that this has to do with
the shift towards larger, more capital-intensive processing facilities.

Figure 23: Exports and imports of fish and seafood, 1988-2011 (inflation adjusted)

                        Source: the dti, 2013

                                                                                   Agricultural Policy Action Plan                18
Figure 24: Trends in formal and informal employment in agro-processing, 1970-2012
Source: DAFF 2012
It is also worth noting, however, that between 1970 and 2007, there was an increase of about 140 000 informal
jobs in agro-processing, of which half has been since 1994 (figure 19). The assumption is that these are
mainly self-employment and employment opportunities in small-scale, informal sector agro-processors, such
as informal abattoirs, bakeries, etc. This upward trend appears to have halted, but it does suggest the potential
for smaller-scale agro-processing. What is evidently missing is a robust expansion of the informal sector, small-
scale agro-processing. This would have numerous benefits, including contributing to the deconcentration of
the agro-processing sector – both in terms of ownership and geography – and the development of local food
economies, which have the potential to create more rural employment while stimulating production in areas
with underutilised potential such as former homelands. The absence of this appears to relate to the high cost
of capital, the inadequate take up of the dti’s various incentive schemes, and too little investment in marketing
or secondary co-ops, which would be the natural hosts of many such enterprises, as well as poor or lack of
infrastructure. The inference is that government needs to work more closely with the various subsectors in
order to stimulate the development of this sector. The key consideration is whether the lower transport costs
associated with better distributed agro-processing capacity, together with more effective coordination among
primary producers, can enable such enterprises to compete with large-scale agro-processors, which often
benefit from scale economies. This can only be determined on a case-by-case basis.
4. DECENT WORK IN AGRICULTURE, FORESTRY AND FISHERIES
The purpose of this section is to look at the application of decent work in the Agricultural Policy Action Plan
(APAP). It was inspired by the fact that the New Growth Path (NGP) was the first policy post-1994 that articu-
lated the promotion of decent work in agriculture as a means to achieve inclusive growth. The NGP adopted by
the South African government identifies the creation of decent work as a central objective of the new economic
policy. The NGP aims to support employment creation in six sectors, one being the agricultural value chain.
The fundamental goal of the National Development Plan and NGP is the achievement of 1 million jobs by 2030
involving both the commercial and smallholder farmer. The APAP is seen as the programmatic response to the
NDP and NGP, and is underpinned by the IGDP.
Defining what is meant by decent jobs therefore forms a critical component of the sector, especially in the
context of inclusive growth and radical economic transformation.
The APAP defines decent work as being based on the understanding that work is not only a source of income
but more importantly a source of personal dignity, family stability, peace in community, and economic growth
that expands opportunities for productive jobs and employment. In support of the decent work, APAP commit-
ment should be aligned to the attainment of decent work in order to achieve inclusive economic growth.
There are four strategic objectives/pillars of decent work as identified by the International Labour Organization
which must underpin the one million jobs envisaged for Agriculture. These are:
• the promotion of standards and rights at work, to ensure that workers’ constitutionally protected rights to dig-
nity, equality and fair labour practices, amongst others, are safeguarded by appropriate legal frameworks;
19 Agricultural Policy Action Plan• the promotion of employment creation and income opportunities, with the goal being “not just the creation of
jobs, but the creation of jobs of acceptable quality”;
• the provision and improvement of social protection and social security, which is regarded as fundamental to
the alleviation of poverty, inequality and the burden of care responsibilities.
There are different categories of workers employed in agriculture ranging from regular, seasonal to temporary
workers. The application of decent work should not only be limited to permanent employees. The application
should embrace all the pillars underpinning decent work whether the employment is seasonal, regular or
temporary. The ILO key indicators (adequate earnings and productive work; decent hours; stability and
security at work; balancing work and family life; equal opportunity and treatment in employment; safe work
environment) on decent work should be the key instruments to measure decent work in the sector.
5. OVERVIEW OF THE RESPONSE
The sector constraints and challenges as analysed above require a response that is comprehensive and yet
focused. The IGDP identifies four broad sector goals which translate into a comprehensive, abiding intervention
framework, which will be supported through iterations of APAP via short- and medium-term interventions
targeting specific value chains (‘sectoral interventions’) or transversal challenges (‘transversal interventions’)
(see Chapters 5 and 6 for detail).
The four broad sector goals are: Equitable growth and competitiveness; Equity and transformation;
Environmental sustainability; and Governance.
Equitable growth and competitiveness
The IGDP recognises that a prosperous and food secure South Africa requires that all of its farming, forestry
and fisheries subsectors, large and small, are supported to become competitive and resilient. There is also a
recognition, however, that we do not seek competitiveness for its own sake, but in so far as it can contribute to
resolving national challenges such as unemployment, inequality and social exclusion.
Supporting agriculture, forestry and fisheries producers/enterprises across the size spectrum requires that the
distinct challenges affecting large versus small producers are understood and properly addressed. However,
the IGDP also recognises that many of the challenges facing large and small producers are in fact common
ones (especially regarding smallholders and the relatively populous but vulnerable stratum of smaller large-
scale commercial farms), which call for common solutions, and sometimes even solutions that involve active
partnership or collaboration between small and large enterprises.
Large-scale commercial producers tend to become larger and more capital intensive in part because the real
(and relative) returns per hectare tend to decline over time. One way therefore of slowing and possibly revers-
ing this process is to improve the unit returns, for example by means of being more vigilant regarding pest and
disease outbreaks, and by lowering input costs through the uptake of conservation agriculture and the resur-
rection of farmer coops. Promoting a shift towards more intensive land uses is also desirable; expanding the
area under irrigation is one possibility, and expanding the use of climate-smart agriculture is another.
As recent as March 2014, The Trade and Industry Ministry has asserted that the food processing industry has
a huge potential to create sustainable jobs within the economy. Where small-scale producers are concerned,
boosting growth is necessary in order to lift many of them out of poverty, which in turn will make small-scale
production a more attractive choice among rural dwellers across the age spectrum. The expansion of small-
scale production in agriculture, forestry and fisheries is essential to creating a dynamic rural economy in former
homeland areas. Given appropriate infrastructure and marketing support, primary production can provide a
meaningful livelihood to many more people than it presently does, while under-pinning household-level and
local food security through more robust local food networks.
Agro-processing has been highlighted as a key job driver. However, the analysis above also shows that em-
ployment trends in agro-processing are not always positive, and that much depends on the type and seem-
ingly the scale of agro-processing facilities. It is also the case that the recent trajectory of the agro-processing
sector has tended to work to the disadvantage of primary producers, both small and large, implying that to the
extent we seek to mobilise additional investment in agro-processing, its location and nature need to be care-
fully considered.
To create better market access for South Africa’s agriculture, forestry and fisheries products, there is a need
for better coordinated efforts to identify and secure export opportunities, for example through negotiating im-
Agricultural Policy Action Plan 20You can also read