THE LIVING CITY REPORT CARD 2016: A progress report on environmental sustainability in the Toronto region - Toronto and ...
←
→
Page content transcription
If your browser does not render page correctly, please read the page content below
THE LIVING CITY®
REPORT CARD 2016:
 A progress report on environmental
  sustainability in the Toronto region
Produced by:

CivicAction congratulates TRCA and contributors on producing The Living City® Report Card 2016. Like TRCA and
its partners, CivicAction recognizes that a prosperous, flourishing GTA needs a healthy regional environment and an
approach to building that respects the capacity of the region and of the planet to sustain us. That is why the community
of leaders in CivicAction’s Greening Greater Toronto initiative worked with TRCA in 2011 to launch The Living City®
Report Card as an ongoing assessment of regional scale environmental performance in the Greater Toronto Area.

The Living City® Report Card 2016 shows that while there is much to celebrate across the GTA, we are not making
progress as quickly as we need to on critical regional environmental and sustainability issues. Therefore, CivicAction
once again supports the call for municipalities and other levels of government, civic leaders, businesses, and communities
to reflect on The Living City® Report Card and to use this common fact-base for multi-sector collaboration towards an
environmentally sustainable region.

 Sevaun Palvetzian                        Rod Phillips
 Chief Executive Officer                  Chair

Contributions from:
The Living City® Report Card 2016                                      1

INTRODUCTION                         2   LAND USE                     42
How To Read This Report Card             URBAN FOREST
Study Area Map                       5   GREENSPACE
                                         AGRICULTURE
                                         GREEN BUILDINGS
CARBON 				6                             INTENSIFICATION

AIR QUALITY                         12
                                         BIODIVERSITY                 64
                                         FISH
WASTE                               18   TERRESTRIAL BIODIVERSITY
                                         NATURAL COVER

WATER                               24
WATER QUALITY                            LOOKING FORWARD              78
STORMWATER MANAGEMENT                    Standardized Data
FLOOD RISK                               Think Global, Act Regional
                                         Regional Alliance
WATER CONSUMPTION
                                         Collective Impact

                                         ACKNOWLEDGEMENTS 96

                                                                           CONTENTS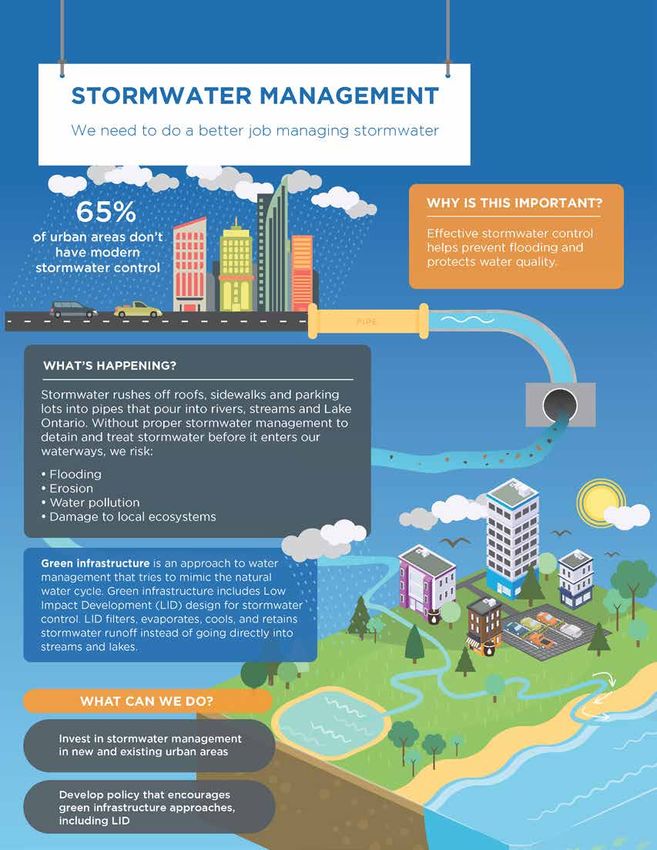
2                                                                                        The Living City® Report Card 2016

ON THE PATH TO SUSTAINABILITY
Report cards are designed to answer important questions: How are we doing? Where have we excelled?
And on what issues will we need to work even harder? The inaugural The Living City® Report Card, released
in 2011, took stock of the environmental health and sustainability of the Toronto region across six themes
that are important measures of a flourishing living city: carbon, air quality, water, waste, land use, and
biodiversity, and set goals that we should aspire to for each theme. It has been five years since the first
report so it is time to ask what has changed and how are we doing in relation to our goals.

GOALS:

reduced carbon

clean air

clean water

reduction of waste

sustainable land use and expanded greenspace

healthy biodiversity

The Living City® Report Card 2016 provides answers to these questions through both detailed analysis and expert
opinion. In its pages, Toronto and Region Conservation Authority (TRCA) and partners share our understanding
of the environmental health and sustainability of the region based on the data we have about current conditions
and change-making activity across the Greater Toronto Area (GTA). Where possible, we have looked at the
progress made in achieving our short- and long-term environmental targets. We also chart some areas where we,
collectively, will need to focus our attention in the future and identify opportunities for joint action by GTA leaders,
governments, businesses, organizations and local residents.

SO HOW ARE WE DOING?                                          • Most of the commonly measured contaminants
                                                                in our rivers, streams, and waterfront such as
We are pleased to report that there have been some              phosphorus and metals are stable or decreasing
notable successes.                                              and Toronto beaches are swimmable over 80%
                                                                of the time. Lake Ontario waterfront fish species
• Our green building industry, one of the cornerstones          biodiversity has been steadily increasing over the
  of a sustainable city, is the largest and fastest             past two decades.
  growing in Canada. Green building initiatives
  are helping to reduce water and energy use,                 • We have planted over one million native trees,
  and greenhouse gas emissions from the region's                shrubs and aquatic plants since the last report card.
  built environment.                                            Healthy forests and wetlands provide habitat
                                                                for wildlife, help cool urban areas, retain water
• Despite a rapidly growing population, the rate of             and reduce runoff, and help reduce impacts of
  land consumption for urban development has 		                 climate change.
  decreased significantly over the past two decades.
The Living City® Report Card 2016                                                                              3

However, rapid population growth, continuing urban        • We continue to see the amount of farmland in
development and the impacts of a changing climate           the GTA shrink despite the growing awareness of
are placing tremendous pressure on the environmental        the importance of local agriculture.
health of our region and our progress towards
sustainability. Our rivers, streams and natural areas     • We are seeing marked changes in the quality of
reflect – and in some cases, are negatively impacted by     the plants and animals surveyed across the region.
– the communities that are growing up around them.
                                                          While we appear to be ‘holding the line’ – maintaining
• More than half of our urban areas do not have           the hard-won environmental gains of the past, progress
  modern stormwater control. Uncontrolled and             has slowed in some areas. The disparity in ecological
  untreated stormwater can increase flood risks           health is widening between the urban core and the
  and degrade water quality.                              less developed headwaters of our watersheds. And
                                                          significant challenges remain in attaining additional
• The amount of chloride from road salt is increasing     greenspace, better managing stormwater, and growing
  in our rivers, streams and the Lake Ontario 		          the urban forest, in the face of continued growth and
  waterfront impacting aquatic life. Microplastics,       competing municipal priorities.
  tiny pieces of plastic, are a new threat in our
  waterbodies.                                            Lastly, while there continues to be a high level of
                                                          activity and effort in reducing greenhouse gas emissions
• Grass Carp, a species of invasive Asian Carp,           across the GTA, the total quantity of emissions has not
  were captured several times in Lake Ontario. 		         been significantly reduced. Much more remains to be
  Although they are not thought to be breeding            done if we are to drastically reduce regional emissions
  in the Toronto waterfront area, they still pose         to address climate change, the most critical and
  a threat to the lake ecosystem.                         pressing environmental challenge of our time.

  A CALL FOR COLLECTIVE ACTION
  The Living City® Report Card 2016 makes a compelling case for TRCA, local governments, businesses,
  non-profit and community organizations, and citizens to renew their collective efforts to improve the
  environmental health and sustainability of the Toronto region. It is clear that we will only achieve environmental
  sustainability and its benefits to our health and prosperity if we think and act as a region. Environmental leaders
  in the public, private, and civil society sectors agree that we need better mechanisms to ensure we are working
  together in the most effective way possible to address these challenges across political and sector boundaries.
  Moving forward, The Living City® Report Card should continue to serve as a progress tracking tool for environmental
  health and sustainability, while evolving to also provide a platform for accelerating collective action by not only
  measuring our results, but also how well we work together.

We are pleased to present this update to The Living City® Report Card. We would like to thank TRCA staff,
our partners, and our funders for their commitment and support. We look forward to working together
with our partners and the residents of the Toronto region to take action towards achieving our goals for
The Living City®.

Brian Denney                         Maria Augimeri                      Scott Fortnum
CEO, TRCA                            Chair, TRCA                         The Living City Foundation
4                                                                                The Living City® Report Card 2016

HOW TO READ THIS PROGRESS REPORT
The Living City® Report Card is comprised of six themes   Long-term target – The long-term targets were set
related to environmental health and sustainability:       out in the inaugural The Living City® Report Card
                                                          in 2011. This regional target is based on local,
•   Carbon                                                provincial, or national targets where they already
•   Air Quality                                           existed, or expert opinion on an appropriate
•   Water                                                 target for the GTA taking into consideration global
•   Waste                                                 benchmarks and the desired healthy long-term
•   Land Use                                              state for the enviroment. The long-term targets
                                                          represent aspirational goals for the GTA, and were set
•   Biodiversity
                                                          irrespective of progress made to date. The long-term
                                                          targets remain the same as the previous report.
The Living City® Report Card 2016 is an update on
progress that has been achieved over the past five
                                                          Progress towards the long term goal is represented with
years towards achieving the short- and long-term
                                                          an arrow. An asterisk "*" represents expert opinion.
targets outlined in the inaugural The Living City®
Report Card in 2011. Within each of the report’s
six themes, there are indicators that provide insights    			              Much better
into the performance of the region in those areas.        			              Better
For each indicator, there is an analysis of the current
state of the environmental issue, the recent progress     			              No change
that has been made, and the work that remains to          			              Worse
be completed. Because resources were limited for
this 2016 update, it was not always possible to           			              Much worse
provide a quantitative measure of the current indicator
condition. However, local experts and thought leaders
have been recruited to provide their insights and         GEOGRAPHIC AREA
advice for these indicators.                              Information in The Living City® Report Card is
                                                          presented either for the GTA or for the geographic
Where possible, this progress report makes two key        boundaries of the TRCA juridiction (see study area
assessments for each indicator:                           map) depending on the type of indicator.

1. an assessment of the achievement of the 2016           The GTA is the largest metropolitan area in Canada -
   short-term target; and                                 home to six million people and counting. It spans an
                                                          area of 7,125 square kilometres and includes the City
2. a progress arrow that shows the general trend 		       of Toronto and the surrounding regional municipalities
   toward the long-term target.                           of Durham, Halton, Peel, and York.

                                                          TRCA’s jurisdiction is 2,506 square kilometres and
TARGETS                                                   it includes nine river systems - from the Etobicoke
                                                          Creek in the west and Carruthers Creek in the east -
Short-term target - Where possible, we assessed the
                                                          and approximately 60 kilometres of the Lake Ontario
completion of the short-term target set out for 2016
                                                          waterfront.
and set new short-term targets for 2021. Where we did
not analyze data to determine if the 2016 target was
met, we did not set a new short-term target. Instead,     COMMONLY USED ACRONYMNS
we suggest that we continue our momentum working
toward the original long-term target.                     GHG – Greenhouse Gas
                                                          GTA – Greater Toronto Area
                                                          LID – Low Impact Development
                                                          NGO – Non-Government Organization
                                                          TRCA – Toronto and Region Conservation Authority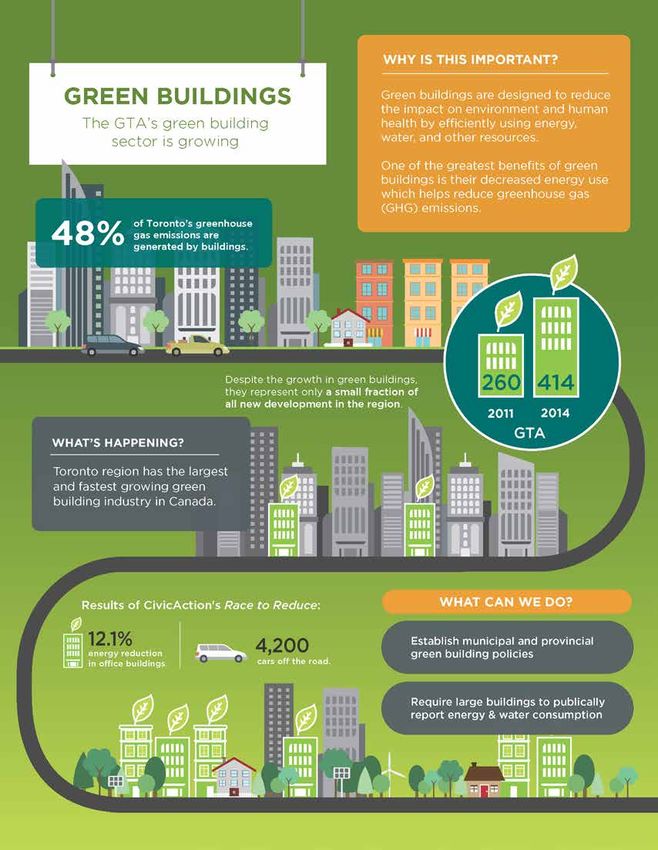
STUDY AREA MAP
BROCK
GEORGINA
The Living City® Report Card 2016
EAST GWILLIMBURY
UXBRIDGE
SCUGOG
D U R H A M
NEWMARKET
WHITCHURCH-STOUFFVILLE
Y O R K AURORA
CLARINGTON
KING
OSHAWA
WHITBY
MARKHAM
RICHMOND
HILL
PICKERING
AJAX
VAUGHAN
CALEDON
P E E L
T O R O NT O
BRAMPTON
LAKE ONTARIO
HALTON HILLS
MISSISSAUGA
H A LT O N
MILTON
LEGEND
OAKVILLE Greenbelt Boundary
N
5
0 10 20 30 40 Kilometers
Disclaimer:
BURLINGTON Produced by Toronto and Region Conservation Authority under Licence with the Ministry of Natural Resources
© Queen's Printer for Ontario. [May 2016]
CARBON
The Living City® Report Card 2016                                     7

WHY DOES CARBON MATTER?

Carbon dioxide is one of the primary greenhouse gases emitted
to the atmosphere by human activities. Burning oil, gas, coal,
and other fossil fuels in our power plants, factories, homes, and
vehicles releases greenhouse gases. In turn, these greenhouse
gases trap heat in the atmosphere and oceans contributing to
global warming and climate change. There is broad consensus
among scientists and decision makers that climate change is the
most serious environmental threat facing our planet, its ecological
systems, and our way of life.
8        The Living City® Report Card 2016

CARBON
The Living City® Report Card 2016                                                                           9

Carbon (GTA)                                                                                PROGRESS

                                                                                                    *

Global greenhouse gas (GHG) emissions have reached the highest levels ever measured.
Most scientists agree that GHGs from human activities are the most significant driver of
climate change. Although we’re working hard to reduce our GHG emissions, there is still a
great deal of work to be done. Municipal leaders need to monitor emerging federal and
provincial government climate change policies to ensure that our region is prepared to take
action on GHG reduction and is positioned competitively in the coming low-carbon economy.

THE CURRENT SITUATION                                   While Toronto's experience is not representative of the
                                                        entire GTA, recent analysis shows that there are two
From 2000 to 2010, global emissions of GHGs             recent developments that have had, or are having,
grew at a faster rate than they did over the previous   a significant impact on local GHG emissions. First,
three decades, reaching the highest levels in human     Ontario’s phase-out of coal-fired electricity generation
history.1 In Ontario, we produced 12.8 tonnes of        over the last several years has drastically reduced the
GHG per capita in 20122, which is 1.7 times             GHG emissions associated with our use of electricity.
higher than the world average of 7.5 tonnes of          Second, federal fuel efficiency standards, provincial
GHG3 and many times higher than the levels we will      support for electric vehicle infrastructure, and support
need to achieve worldwide to prevent the damaging       for a regional mass transit system will assist in the
impacts of climate change. In the The Living City®      transition to a low-carbon transportation system. In
Report Card 2011, analysis showed that transportation   the City of Toronto, these policies are expected to
fuel use and natural gas consumption by homes and       drive GHG emissions downward, helping the city
businesses (mainly for heat) were the two largest       meet and potentially exceed its 30% reduction
sources of carbon emissions in the GTA, followed        target by 2020.
by electricity generation as the third largest.
10 The Living City® Report Card 2016
WHAT NEEDS TO BE DONE Identifying both the conflicts and synergies with other
community benefits will be a critical component
Municipal leaders need to keep in tune with emerging
to long-term GHG reduction planning. Reaching
policy frameworks and, in turn, determine how their
the municipal carbon reduction targets considered
cities can influence, adopt, expedite and build upon
necessary to avoid the most dangerous repercussions
these policies in the local context. They must also
of climate change – i.e., achieving an 80% reduction
learn how to leverage local experience and expertise
by 2050 – will require major changes to the way
on the regional, provincial, and federal scale for
residents of the GTA travel, work and play. But these
maximum impact.
changes also represent an opportunity to pursue
some of our other health, economic and equity goals
For example, emerging policy in Ontario to require
as well. For example, transportation emissions are
large building owners to report their annual energy
a major source of air pollution in Toronto, resulting
consumption was first proposed in Toronto (following
in poor health outcomes; therefore, reducing carbon
New York’s lead). This initiative should be applauded
emissions also offers public health benefits. Instances
and implemented quickly by all municipalities across
of inactivity-related diseases – and the related public
the GTA once it is formalized. The data generated
health care costs – are sharply rising as we spend
by this policy will increase the awareness of – and
more time commuting long distances by car. More
dialogue on – energy use, help building managers
active and public transit options have proven to
understand opportunities for energy savings, and
increase overall public health and reduce health costs
improve the market value of high-performing
in other jurisdictions. Finally, an intensive campaign
buildings (serving as an incentive for improving
to retrofit existing buildings is a key strategy that
energy efficiency). Cities can make direct use of
would address the number one source of GHG
the data to guide the design of new energy efficiency
emissions in cities, while also generating substantial
policies and programs, and to focus resources on
local employment.
those buildings in greatest need of improvement.
Cities should also lead by example, investing
Cities face both opportunities and constraints in
aggressively in energy efficiency retrofits of
minimizing the GHG emissions related to waste
municipal buildings.
management. On one hand, cities oversee waste
disposal and recycling services and are well
A well designed, affordable and seamlessly integrated
positioned to increase the effectiveness of diversion
mass transit system across the region is another
programs (through innovative program design and
important component of a low-carbon strategy.
education efforts). On the other hand, cities have
However, the regional transportation system must
limited tools at their disposal for encouraging waste
be designed in tandem with a broad suite of policies
prevention and shifting society toward the circular
that encourage people to choose transit over single
economy.4 In light of this, cities should focus both on
occupancy vehicle use. Our land use planning policies
local waste diversion strategies and on provincial and
and decisions will have a significant impact on our
federal policies that promote waste reduction, such
future transportation choices.
as the Strategy for a Waste-Free Ontario. Cities can
also play a critical role by using the biogas captured
Land use planning in the GTA is at the centre of our
at landfills, sewage treatment plants and organics
carbon profile. The Province’s Proposed Growth Plan
processing facilities to displace some of the fossil
for the Greater Golden Horseshoe, 2016, will create
fuels used in the electricity generation, heating and/or
new responsibilities and authorities for municipalities
transportation sectors.
to integrate climate change mitigation into official
plans and other policy frameworks. For example,
Ultimately, our region will need to replace the fossil
locating housing and job centres in closer proximity
fuels used in transportation and space-heating with
would reduce transportation needs and facilitate use
alternatives, such as low-carbon grid electricity and
of mass transit. Denser neighbourhoods would also
air/ground source heat pumps. This probably means
reduce building energy use, while more walkable
re-thinking our electricity grid system, allowing it to
neighbourhoods would increase levels of active
handle new loads while taking advantage of new,
transportation, which provides such co-benefits as
de-centralized low-carbon energy sources – creating,
improving public health and promoting a sense of place.
at the same time, a power distribution system that isThe Living City® Report Card 2016 11
more resilient to climate change and other shocks. • Several municipalities have developed sustainability
As we transform our cities to a new low-carbon status guidelines for new development, including Toronto,
and protect them from the impacts of climate change, Pickering, Oakville and Markham. In addition,
we need to invite the input, expertise and innovation the cities of Brampton, Richmond Hill and
inherent in our diverse community members; the Vaughan worked collaboratively to develop the
solutions we build together will be more likely to Sustainability Assessment Tool to measure the
succeed. Similarly, greater understanding of our environmental sustainability performance of new
regional carbon profile will help us work together development applications.
to identify and realize the multi-faceted opportunities
of a low-carbon GTA. • The Ontario Ministry of Transportation funded the
installation of 32 electric vehicle charging stations
at four locations at Toronto Pearson International
WHAT WE ARE DOING Airport. The Level 2 and Level 3 DC Fast Charging
stations were procured by TRCA in partnership
• In 2014, the Province of Ontario was the first
with the Greater Toronto Airport Authority and will
jurisdiction in North America to fully eliminate
be operational and open to the public in spring 2017.
coal as a source of electricity generation.
Coal went from 25% of Ontario’s supply mix
• Region of Peel with its partner municipalities
in 2003 to zero in 2014, resulting in large-scale
(Brampton, Mississauga and Caledon) developed
carbon reduction.
a comprehensive and collaborative Climate Change
Strategy. Region of Peel is a frontrunner in developing
• The Environmental Commissioner of Ontario
a climate change strategy on a regional basis.
released Facing Climate Change, a GHG progress
report for 2016. The report reviewed the science
• The Home Energy Loan Program in the City of
of climate change, its impacts, and why Ontario
Toronto is promoting the use of local improvement
must dramatically reduce its GHG emissions.
charges for energy efficiency retrofits, while the
complementary High-rise Retrofit Improvement
• The Corporation of the Regional Municipality
Support (Hi-RIS) program is doing the same for
of York reduced its GHG emissions in 2015 by
multi-unit residential buildings.
994 tonnes, a 1.1% decrease over the same
period in 2014. Key initiatives in 2015 for
reducing emissions included transit route
optimization and solar panel installation. TARGETS
Long-term target: Reduce emissions to 80% below
• The Ontario Climate Consortium is leading a 1990 levels by 2050 (11 Mt CO2e).
multi-year research initiative – the Community
Energy Knowledge Action Partnership (CEKAP)
– that will explore opportunities to scale-up the
implementation of low-carbon energy policies
at the local and regional scale. CEKAP is a
unique collaborative effort involving five
academic institutions, eight municipalities,
CARBON
the provincial government and a range of civil
society organizations.
by Mary Pickering, Vice President Programs and Partnerships
at The Atmospheric Fund (TAF) - full bio on page 96AIR QUALITY
The Living City® Report Card 2016                                     13

WHY DOES AIR QUALITY MATTER?
Air pollution is responsible for significant health impacts.
Research has linked air pollution to a number of health concerns,
including respiratory illness, cardiovascular disease, cancer,
endocrine system and neurological effects, diabetes and allergies.
Even at low levels, air pollution can cause significant detrimental
health impacts due to long-term systemic exposure. These health
impacts have a strong bearing on our quality of life and place an
unnecessary strain on the health care system.
14 The Living City® Report Card 2016
The Living City® Report Card 2016                                                                               15

Air Quality (GTA)                                                                                PROGRESS

                                                                                                         *

Over the past decade, ambient concentrations of most common air pollutants have declined
across Ontario. However, variations in air quality within a community can be as great as
the variation between communities. Since this variation is rarely measured, there may be
"hot spots" of poor air quality even though air quality is getting better overall. We do know
that when we drive our vehicles and use energy in our offices and homes, we are burning fossil
fuels (such as gasoline, natural gas, oil) and sending pollution into the air. This contributes
to smog and poor air quality, which is directly linked to impacts on our health. In order to
improve air quality in the GTA, we need all levels of governments to continue to encourage the
development of clean industry, energy and transportation. We also need more comprehensive
and detailed local area monitoring within urban neighbourhoods to better understand how air
quality is affecting people at the local level.

THE CURRENT SITUATION                                       in creating appropriate indicators, alerts and
                                                            prevention strategies for vulnerable populations,
Air pollution is made up of a variety of substances,
                                                            and in determining the necessity and effectiveness
each with different sources, patterns of distribution,
                                                            of mitigation measures. Monitoring can also inform
chemical reactions and health impacts. A number
                                                            land use and transportation policies, development
of our most common air pollutants (also known as
                                                            applications, and the siting of sensitive facilities,
criteria air pollutants) collectively represent a serious
                                                            such as child or senior care facilities.
threat to the health of our communities. They include
ground-level ozone (O3), fine particulate matter
                                                            In Ontario, ambient concentrations of most common
(PM2.5), sulphur dioxide (SO2), nitrogen dioxide
                                                            air pollutants have declined over the past decade.
(NO2) and carbon monoxide (CO). While everyone
                                                            Between 2005 and 2014, PM2.5 concentrations
is adversely affected by exposure to air pollution,
                                                            decreased by 31%, NO2 by 42%, SO2 by 49% and
children, the elderly and those with pre-existing health
                                                            CO by 40%.6 These decreases are due primarily to
conditions (such as heart disease, asthma and other
                                                            improvements in vehicular performance, industrial
respiratory illnesses) are particularly vulnerable.
                                                            downturns, and the impact of provincial air quality
The Canadian Medical Association estimates that
                                                            initiatives such as the phase out of coal-fired power
the morbidity and mortality associated with poor air
                                                            and federal vehicle emission standards. Over the same
quality over the period 2008 through 2031 will cost
                                                            time frame, ozone concentrations increased by 3% on
in excess of $117 billion (in current dollars).5
                                                            average, although summer concentrations decreased
                                                            by 8%.7 As a result, the number of smog alerts and
Air pollution must be monitored over space and time
                                                            smog days reported each year have dropped.
in order to evaluate the quality of the air we breathe,
to compare it to targets we have set based on health
evidence, and to gauge historical improvements.
Understanding the severity of the issue is imperative
16 The Living City® Report Card 2016
Number of Smog Advisories 16 Smog Advisories 60
14 Smog Days
50
12
Number of Smog Days
40
10
8 30
6
20
4
10
2
0 0
2005 2006 2007 2008 2009 2010 2011 2012 2013 2014
Trend based on three MOECC sites in Toronto, Halton-Peel, and York-Durham.8
These improvements have occurred over large areas Recent studies have demonstrated that variations
and over long time frames, and it should be noted in air quality within a community can be as great
that the figures are based on annual averages. as the variation between communities, suggesting
Local concentrations of these pollutants can still that land use, urban design and proximity to roads
exceed ambient air quality criteria over shorter can impact local exposures.9 Traditional monitors
time frames. are too large and expensive to reveal local variations
in air pollution. However, recent technological
‘Traditional’ monitoring networks – comprising an advances in monitoring technology, coupled with the
assortment of meticulously calibrated and maintained rapid growth of social entrepreneurship and active
stationary, movable and mobile measuring instruments academic research communities mean we are at an
– have collectively informed our understanding exciting juncture in pollution monitoring. This has
of pollution trends and health effects in Ontario. resulted in the creation of ‘next generation’ monitors,
Generally owned and operated by provincial and including small research monitoring networks,
federal government agencies, these networks are portable monitors and wearable monitors.10 While
used for decision making by governments and for many next generation monitoring technologies are in
research purposes by academic and non-government their infancy, new products are making it to market
communities. Because they are government owned, at a rapid rate, allowing for cheaper, more extensive
the data generated is generally publicly accessible; local monitoring of air pollution. There has also been
however, the delay in releasing this data can be a proliferation of smartphone-based apps to assist in
lengthy, taking over a year in some cases. Moreover, disseminating health messaging in our communities.
network coverage is geographically sparse, and the As these technologies become more widely tested and
equipment is expensive to acquire, install, operate available, they may offer community organizations
and maintain. For these reasons, the data generated greater opportunity to conduct their own monitoring
may not reflect the spatial gradient of pollution in and to gather evidence in support of local health and
our local communities. environmental concerns.The Living City® Report Card 2016 17
WHAT NEEDS TO BE DONE • The Southern Ontario Centre for Atmospheric
Aerosol Research (SOCAAR) at the University of
• Improve local air quality monitoring.
Toronto is an interdisciplinary centre for the study
of air quality, with a focus on how aerosols impact
• Invest in and encourage the use of clean energy
human health and the environment. SOCAAR
technologies, such as solar, wind, geothermal,
brings together medical personnel, atmospheric
and bioenergy.
chemists, and environmental engineers, to
promote collaborative research through access
• Improve cycling and other active transport
to state-of-the-art facilities and partnerships
infrastructure to reduce reliance on private vehicles.
with government and industry.
• Improve public transportation, particularly on
• The innovative Scarborough Cycles project is
a regional scale.
extending the bike culture beyond the downtown
core out into the suburbs. Bike ‘hubs’ were
• When planning new communities, design streets
established in two communities to offer access
to make more space for pedestrians, cyclists,
to bicycles, tools, and repair clinics, while
and transit. Older communities need to consider
providing civic engagement opportunities for
redesigning streets and infrastructure to better
residents. The initiative was funded by the
accommodate pedestrians and cyclists.
Metcalf Foundation Cycle City program and
the Toronto Centre for Active Transportation,
• Foster greater collaboration between academia, NGOs,
in partnership with CultureLink Settlement and
public and private sectors to advance monitoring.
Community Services, the Toronto Cycling Think &
Do Tank, and Cycle Toronto.
• Build greater public and political awareness of the
health implications of poor air quality.
TARGETS
WHAT WE ARE DOING Long-term target: Sulphur dioxide (SO2) emissions
• CivicAction’s Race to Reduce is a program aimed of 7,000 tonnes; volatile organic compounds (VOCs)
at reducing total energy use in participating office emissions of 11,700 tonnes; particulate matter
buildings across the Toronto region. Reducing (PM2.5) emissions of 1,700 tonnes; and, nitrogen
energy use ensures less fossil fuel is burned and oxides (NOX) emissions of 22,000 tonnes.
AIR QUALITY
results in a reduction in air pollution.
• Clean Air Partnership’s 20/20 The Way to Clean
Air program is designed to help homeowners
reduce their energy consumption by 20% at
home and on the road, improving local air quality
and lessening the impact of smog and climate
change on the environment and health.
• Toronto Environmental Alliance’s INHALE Project
uses mobile air particulate monitoring equipment
attached to backpacks, bike handlebars, and baby
stroller handles, allowing volunteers to walk, run,
or ride through their neighbourhoods collecting
real-time air pollution data.
by Kevin Behan, Deputy Director with Clean Air Partnership
- full bio on page 96WASTE WASTE WASTE
The Living City® Report Card 2016                                    19

WHY DOES WASTE MATTER?
Almost everything we do creates waste. Waste is often stored in
landfills that produce carbon emissions, take up valuable land,
and represent a wasted use of valuable materials that could have
been reused, recycled, or resold. As our population continues to
grow, we will continue to create waste. Our current consumption
levels are unsustainable and will impact the kind of world we will
leave for future generations.
20 The Living City® Report Card 2016
The Living City® Report Card 2016                                                                              21

Waste (GTA)                                                                                      PROGRESS

Although there have been small gains in some municipalities, waste management for the GTA
as a whole has not improved over the past five years. Effective waste management minimizes
the amount of waste going to landfills and maximizes the use we get from materials, preserving
our environment and making our region more sustainable. We need to focus our attention
on making waste diversion a priority, particularly in multi-unit residential buildings (MuRBs).
This includes making waste diversion easier for residents and building tenants by increasing
opportunities for recycling, reduction, and reuse of materials.

THE CURRENT SITUATION                                        MuRBs continue to experience difficulty in achieving
One of the most widely used measures of the success          high diversion rates. In Toronto, for example, the
of a municipal waste management program is the               diversion rate for MuRBs in 2014 was 26% compared
percentage of waste generated by its residents that is       to 66% in single family dwellings.14 This is an
diverted from disposal in a landfill or from incineration.   improvement for MuRBs since 2009 when it was only
Since the last The Living City® Report Card in 2011,         16%. Much of that increase is due to the growing
the percentage of residential waste being diverted           number of MuRBs that are adopting organics diversion
from disposal in the GTA has remained fairly steady          programs but, at the same time, virtually all of the
at about 52%.11 The impressive growth in waste               diversion challenges for MuRBs noted in The Living
diversion between 2006 (39%) and 2009 (50%)                  City® Report Card 2011 remain.
seems to have stalled and the region is considerably
below the long-term target of 75% diversion                  On the positive side, the total amount of waste
established in The Living City® Report Card 2011.            generated per person annually in the GTA has declined
                                                             by almost 5% from 362 kg/capita in 2009 to 345 kg/
Low diversion rates mean that too much waste that            capita in 2014. Much of this decline is likely due to
is divertible is ending up in the garbage stream. For        the increasing prevalence of lightweight materials in
example, the most recent waste audits from the Region        the waste stream, such as plastics, that are replacing
of Peel show that about two-thirds of the waste that is      heavier materials used in packaging and products.
set out as garbage could be diverted – and that both         This change in waste generation may also reflect
single family and MuRBs have similar percentages             successful efforts by residents to reduce and reuse.
of divertible material in their garbage streams.12 The
findings are comparable in other jurisdictions such as
the City of Toronto, although MuRBs there have more
divertible materials in the garbage stream.13
22 The Living City® Report Card 2016
Since the last The Living City® Report Card, a major WHAT NEEDS BE DONE
policy development has been the Province of Ontario’s
Reduce the quantity of divertible materials in the
proposed Waste-Free Ontario Act and the creation
waste stream. Recycling needs to be simplified.
of a draft plan for moving forward on waste diversion
For example, the same types of packaging should
and reduction known as the ‘Strategy for a Waste Free
be recyclable in each of the GTA municipalities,
Ontario: Building the Circular Economy’.15 Together,
both at home and in the workplace. Municipalities
these two initiatives address many of the opportunities
should disallow the sale of packaging that combines
for action recommended in The Living City® Report
recyclable and non-recyclable materials, such as most
Card 2011. The Waste-Free Ontario Act imposes full
types of take-out coffee cups and lids. Although some
extended producer responsibility (EPR) on producers
municipalities have recently started to divert textiles,
of certain products and materials. This means that
textiles in the municipal residual waste stream remain
producers will have to pay the full costs of recovery
an issue. Textiles represent up to 10% of the material
of their end-of-life products. Not only will this transfer
destined for landfill.16 Another strategy to reduce the
financial responsibility away from municipalities and
quantity of divertible materials is increased education
taxpayers, but the hope is that the new system will
about what can and cannot be diverted.
encourage producers to make their products and
packaging more easily recyclable, reusable or durable.
Focus on increasing diversion rates in MuRBs. We are
Products and materials covered by EPR in Ontario
seeing the emergence of best practice MuRBs that are
currently are Blue Box materials, used tires, some
closing in on or even exceeding average diversion rates
household hazardous wastes, and waste electrical and
in single family households. For example, between
electronic equipment (WEEE), such as old computers
2014 and 2016, residents of a 282 unit condominium
and televisions. Unlike other EPR programs in Ontario,
in Toronto decreased the volume of garbage that they
which are full EPR already, producers currently split
set out by 86% and increased the volume of recycling
Blue Box costs with municipalities and they will now
by 48%.17 The building offers its residents a wide
have to pay all of the program’s costs. New products
range of diversion opportunities in addition to Blue Bin
suggested for possible inclusion in EPR include
and Green Bin diversion, including battery recycling,
fluorescent bulbs and tubes, carpets, bulky items
used clothing collections, cooking oil recovery,
(e.g. furniture), and WEEE not already designated
pharmaceuticals recovery, household hazardous waste
under EPR (e.g. household appliances).
recycling, WEEE recycling, a sharing-shelf for reuse of
household items, and space for exchanging used books
Two other proposals of note in the Strategy for a Waste
and furniture.
Free Ontario are landfill bans for certain products and
the development of an organics action plan. The first
Reuse and reduce. Most of the waste diversion
proposed set of landfill bans are for WEEE and compact
efforts to date in the GTA deal with recycling and
fluorescent light bulbs. The organics action plan will
organic waste. Reuse and reduction have been
address waste reduction and diversion across the
neglected parts of the waste management hierarchy
entire pre-consumer and post-consumer organic waste
but some municipalities are developing innovative
supply chain, meaning that both the food sector and
programs to increase both.
residents will be involved. All of these measures will
have potentially profound impacts on residential waste
Measure and monitor ICI waste. Better measurement
diversion and reduction in the GTA. Although ambitious
of ICI waste flows and diversion, as well as updating
and wide-ranging, the most disappointing aspect of the
existing ICI diversion regulations and enforcing them
Strategy for a Waste Free Ontario is that it is vague
are all necessary to significantly reduce waste.
about the options for reducing industrial, commercial,
and institutional (ICI) waste, except for food waste in
the ICI sector, as noted above.The Living City® Report Card 2016 23
WHAT WE ARE DOING • City of Mississauga and City of Vaughan participated
in Partners in Project Green's inaugural Recycling
• In 2016, the City of Markham launched an
Collection Drive in 2016 collecting and recycling
innovative and aggressive textile recycling program.
electronic and textile waste at municipal buildings
Markham has installed municipally managed textile
across the GTA. Overall, 16 municipal and
donation containers at city facilities, fire stations,
commercial organizations, representing 30
and community centres. Gently used items will be
locations across the GTA participated in the
sold for rewear or reuse by The Salvation Army and
event during Waste Reduction Week in Canada.
the remaining textiles will be recycled.
• Durham Region broke the Guinness World Record for
• The City of Toronto recently launched the Mayor’s
most batteries collected in a twenty-four hour period,
Towering Challenge, which offers resources,
collecting 5,102 kg of material. This has turned into
support and online recognition to help participating
a continuing program and now Durham also
MuRBs increase diversion.18 The City of Toronto has
provides used battery curbside collection services
also recently approved an updated Long Term Waste
to all residents making it easier to recycle.
Management Strategy.
• The Tree and Wood Recovery Centre, in partnership
• Region of Peel adopted the Waste Reduction and
with TRCA, was launched in 2016. Located in the
Resource Recovery Strategy in 2014. The strategy
City of Mississauga, the Centre helps to divert and
is built on the 4Rs (Reduce, Reuse, Recycle
repurpose ash wood affected by emerald ash boarer
and Recover) and has established a diversion target
into lumber, live-edge, and other innovative wood
of 75% by 2034, the highest proposed diversion
products. Over 4,500 tonnes of wood waste was
rate for the GTA.
repurposed in its first year of operations.
• York Region has a Reuse, Repair, Repurpose
Strategy. Since 2007, York Region has partnered
with Goodwill and Habitat for Humanity to operate TARGETS
several reuse transfer facilities. York Region also Long-term target: Residential and ICI waste diversion
has waste diversion strategies dedicated to MuRBs, rates greater than 80%.
organics, and ICI waste.19
• Partners in Project Green works with GTA
businesses to reduce their waste through programs
such as Material Exchange, which facilitates online
exchanges of materials between organizations,
and service providers to divert resources from
landfill and drive towards a circular economy.
Since conception in 2012, Material Exchange
has resulted in 146 exchanges and 9,237 tonnes
diverted from landfill.
WASTE
by Dr. Virginia Maclaren, University of Toronto
- full bio on page 9624 The Living City® Report Card 2016
WATERThe Living City® Report Card 2016 25 WHY DOES WATER MATTER? Water is one of the most important substances on earth. Directly or indirectly, water affects all facets of life. Clean water is necessary for commercial activities such as agriculture, fishing, and manufacturing. It is important for recreational activities such as swimming and boating. The biodiversity of our streams and lakes depends on clean water and so does our own health and well-being. Clean water is a precious and limited resource that should be valued and protected.
26 The Living City Report Card 2011
The Living City® Report Card 2016 27
2016
Water Quality (TRCA) PROGRESS TARGET MET
almost
Although conditions are similar to those reported in 2011, stream water quality remains a concern
in the Toronto region. In recent years, there were fewer exceedances of water quality objectives
but when the objectives were exceeded, concentrations were higher than they have been in
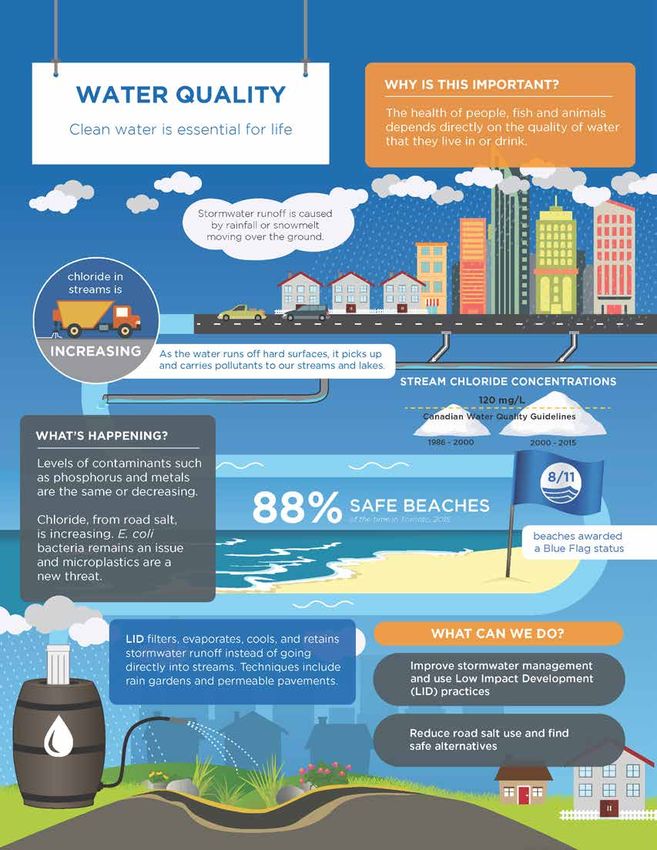
the past. Concerns include nutrients that contribute to growth of algae, chloride (mostly from
road salt) because of its negative impact on aquatic organisms, and Escherichia coli (E. coli)
which is a potentially unhealthy bacteria. Stream water quality reflects the input of pollutants
from surrounding land uses and can directly influence aquatic habitat and communities.
Improved stormwater management in both rural and urban areas, as well as continued efforts
by municipalities and individual homeowners to reduce the use of fertilizer and road salt is
needed to help improve the quality of water in the Toronto region.
THE CURRENT SITUATION There have also been some changes we did not want
to see. Stream chloride levels are increasing; at one
There’s been some good news; although the population
site chloride levels spiked to almost 2,500 milligrams
in the Toronto region continues to increase, the levels
per litre, about four times the short-term Canadian
of some pollutants in our rivers and streams have
water quality guideline. Combined sewer overflows
held steady and even dropped. There are a number of
continue to be an issue in the City of Toronto after
reasons for this. Various pesticides, organic compounds
large-scale rain events. During heavy rains, the city's
(e.g. PCBs) and mercury were banned in the 1980s.
infrastructure may be overwhelmed by the volume
The use of leaded gasoline was phased out by the
of water and untreated wastewater flows into the
early 1990s. More recently, the City of Toronto and
lake. Microplastics (small plastic beads, fibers,
(eventually) the Government of Ontario banned the
pellets) are now an issue in our streams and lakes.
cosmetic use of certain pesticides on lawns and
Microplastics come from raw materials used to make
gardens. Upstream of our urban areas, farmers
plastic products, plastic beads used in cosmetics
have improved their management of the agricultural
and cleaners, fibres that come from washing your
chemicals and fertilizers they use, while diverting
synthetic clothes, and larger pieces of plastic waste
animal wastes and other nutrients from watercourses.
breaking down into smaller pieces. Microplastics can
High counts of E. coli bacteria can shut down beach
absorb chemicals and transport pollutants, and are
areas but this issue is improving. In 2000, Toronto
easily are ingested by fish and wildlife which can
beaches were posted unsafe for almost 50% of the
cause a variety of health impacts.
summer; but in 2015, the beaches were posted safe
88% of the time.28 The Living City® Report Card 2016
WHAT NEEDS BE DONE • The Lake Ontario Lakewide Action and
Management Plan (LAMP) is a binational plan
• The stresses on our watersheds will increase
for restoring and protecting the Lake Ontario
as the population grows and more land in the
ecosystem. Led by the U.S. Environmental
Toronto region is urbanized and paved over,
Protection Agency and Environment and Climate
creating the potential for more stormwater runoff.
Change Canada (ECCC), LAMP continues
Sustainable stormwater management practices,
its efforts to address important lakewide stressors
such as the treatment train approach that
and work cooperatively to protect and restore
combines conventional stormwater controls with
water quality and ecosystem health.
Low Impact Development (LID), are needed to
manage the quality and quantity of stormwater flows.
• Computer modeling of rural watersheds by
ECCC has identified high priority areas in the
• Greater effort to reduce the use of salt, both on our
Duffins Creek and Rouge River watersheds where
roadways and on private property and parking lots,
tree planting will maximize watershed water
is urgently needed. Otherwise, chloride concentrations
quality benefits.
may continue to increase to toxic levels in our
rivers and lakes over the coming years.
• TRCA’s Environmental Monitoring and Data
Management group has been tracking the effects
• Compromised and/or combined sewage systems
of increasing levels of chloride on some of the
in older parts of the City of Toronto continue to be
sensitive, bottom-dwelling aquatic creatures that
sources of untreated sewage and contaminated
live in our rivers and streams.
runoff for our waterways and need to continue to
be upgraded.
• TRCA and other conservation authorities require
the use of erosion and sediment control measures
• Home owners and businesses must ensure that toxic
for development permits adjacent to watercourses
chemicals, paints and oils, cleansers, fertilizers, pet
and other natural areas. TRCA is working with
wastes and other contaminants are not intentionally
construction companies to prevent silt-laden runoff
dumped or washed inadvertently into stormsewers.
from work sites flowing directly into nearby streams.
Innovative silt fences, such as mesh tubes filled with
special compost, hug the ground tightly and can be
WHAT WE ARE DOING
left in place to decompose when the job is over.
• The Ontario government passed the Great
Lakes Protection Act in 2015, which established • TRCA is monitoring water quality in the rivers,
a framework for protecting the lakes. The Act will creeks, marshes and nearshore environment from
help to set targets for local and lakewide areas, Pickering to Ajax in partnership with the Regions
strengthen monitoring programs and reporting, of York and Durham.
and implement existing policy tools to protect
Ontario’s water. • The City of Toronto is working toward their
25-year Wet Weather Flow Master Plan to reduce
• The Toronto and Region Remedial Action Plan (RAP) pollutants associated with stormwater.
recently released the progress report Within Reach
which shows the actions needed by 2020 to help
de-list the Toronto waterfront Area of Concern.
Toronto’s RAP is aimed at restoring the health
of Toronto’s waters and habitats and has been
underway since 1987. Over this time, government
agencies, municipalities and non-govermental
organizations have worked together to improve the
environmental conditions in the Toronto RAP area.The Living City® Report Card 2016 29
• The Great Lakes and St. Lawrence Cities Initiative TARGETS
enlisted over 100 mayors to raise awareness
2016 Target: No further deterioration of the
about and take action to reduce microplastics
current water quality conditions at all monitoring
in our waters. The Canadian government listed
sites (Water Quality Index (WQI) score of 50 to 59).
microbeads as a toxic substance under the
Canadian Environmental Protection Act (CEPA)
Achieved? Almost. The grade for each watershed
which will allow for further regulation
stayed the same or improved since the last report
of microbeads.
card but not all monitoring stations achieved a WQI
score 50 or more.
• TRCA, with funding from ECCC and the Ontario
Ministry of the Environment and Climate Change,
Target for 2021: There should be no decline in the
along with in-kind contributions from the Regions
score for each watershed and maintain an overall
of York and Durham, set up a pilot stormwater
WQI score of 50 or better for all sites across the
treatment system in Pickering. TRCA transformed
jurisdiction.
an industrial stormsewer, which flows directly into
Lake Ontario, into a wetland-like natural treatment
Long-term target: Water quality for TRCA’s
system with small dams to slow and treat stormwater
jurisdiction reaches an average WQI score of 70 or
runoff. Preliminary results show decreases in
higher, with improvements seen in each watershed.
phosphorus, suspended sediments, and E. coli.
MEASURE
The Water Quality Index (WQI) included measurements
of eight different parameters: six potentially toxic
chemicals (chloride, ammonia, nitrate, copper and
zinc), the levels of two nutrients (phosphorus and
nitrogen) that cause eutrophication, and a group of
dangerous bacteria (E. coli). The WQI is based on the
number parameters that exceeded the water quality
objectives and guidelines set for them, and by how
much and how often they exceeded those standards.
WATER30 The Living City® Report Card 2016 WATER
The Living City® Report Card 2016                                                                         31

                                                                                               2016
Stormwater Management                                                        PROGRESS       TARGET MET

(TRCA)                                                                                            yes

Currently, less than 35% of the urbanized areas in the region have effective stormwater controls
which help to prevent flooding and manage water quality. Untreated runoff may flow directly
into a watercourse, or it may rush through local stormsewers before being discharged into a lake,
river or stream. The result is an increased risk of flooding, downstream erosion, water pollution
and the destruction of wildlife habitat. Stormwater management controls have been installed in
most newer developments but improvements can be made with the innovative use of Low Impact
Development (LID) techniques in future development and in retrofits of existing communities.
By installing LIDs such as permeable pavers in parking lots or directing runoff to grassy swales or
soakway pits, the water slowly seeps into the soil replenishing groundwater, removing pollutants,
and reducing the amount of runoff reaching the stream. Local and regional municipalities in
collaboration with the Government of Ontario and conservation authorities must continue to
advocate for and develop policy, guidelines, and standards requiring the use of LID.

THE CURRENT SITUATION                                   seeps into the ground to naturally recharge our
                                                        streams, wetlands and groundwater resources.
Currently, just 35% of the urbanized areas across
                                                        The result, especially after a major storm, is an
TRCA’s jurisdiction are served by stormwater controls
                                                        increased risk of flooding, downstream erosion,
that help to prevent flooding and manage water
                                                        water pollution and the destruction of wildlife
quality, erosion, and impacts to aquatic ecosystems.
                                                        habitat. Despite advances in LID technologies,
The increase in stormwater runoff is one of the most
                                                        they are not yet widely used in the Toronto region
serious environmental impacts of urban development.
                                                        and the quantity and quality of stormwater from both
Across the region, much of the rain that falls and
                                                        new and old communities is not being adequately
melting snow flows off rooftops, parking lots,
                                                        managed. Although a number of cities in Ontario
roadways and other paved or impermeable surfaces
                                                        have developed innovative revenue tools such as
of the city and ends up in our streams and rivers.
                                                        stormwater charges, many municipalities in the
Stormwater runoff – with its heavy load of dirt,
                                                        Toronto region struggle to maintain, replace, and
road salt, pesticides, oil and other pollutants that
                                                        upgrade stormwater infrastructure.
it picks up from these surfaces – may rush directly
into a watercourse, or it may flood through local
stormsewers before being discharged into a lake,
river, or stream. And that means much less water
32 The Living City® Report Card 2016
WHAT NEEDS TO BE DONE WHAT WE ARE DOING
LID techniques are needed to supplement traditional • TRCA and its municipal partners work to ensure
stormwater controls to better manage both the that all new developments provide modern
quantity and quality of the runoff that eventually stormwater controls and encourage redevelopment
reaches local rivers, streams and other waterbodies. to seek opportunities for retrofit of absent or
Planning and design for new communities and for outdated controls. Credit Valley Conservation and
the renewal and intensification of existing ones needs TRCA’s Low Impact Development Stormwater
to incorporate innovative stormwater management and Management Planning and Design Guide and
LID from the very beginning stages. Secure funding similar guideline documents encourage effective
is needed to support the maintenance, replacement, stormwater management.
upgrade and retrofit of stormwater infrastructure.
We need to move forward on: • Almost all of the municipalities across TRCA’s
jurisdiction have begun stormwater retrofit studies
• ensuring that stormwater management is that identify where conventional stormwater
incorporated into new communities and in treatment infrastructure such as detention ponds
community redevelopment and intensification can be retrofit within urbanized areas that
projects from the beginning of the planning process, currently do not have such controls in place.
through watershed planning and other studies
that establish the level of stormwater treatment • A Toronto bylaw requires homeowners to
that is required and set out how conventional and disconnect their home’s downspouts from the
LID stormwater management will be incorporated city’s sewer system, while a second bylaw requires
into all aspects of community design; new commercial, institutional, and high density
residential developments to install green roofs.
• retrofitting conventional stormwater
infrastructure into existing communities with • The Pioneer Park Stormwater Management Pond
absent or inadequate stormwater. We need to in Richmond Hill has been upgraded to replace
take advantage of opportunities such as road 30-year-old stormwater infrastructure and meet
reconstruction, park revitalization, water and modern standards of water quality treatment,
sewer projects to install this infrastructure; erosion and flood control.
• encouraging residents to help manage stormwater • TRCA is working with its municipal and community
runoff on their properties by installing cisterns, partners on Sustainable Neighbourhood Retrofit
rain barrels and rain gardens to collect and use Action Plans (SNAPs) to make sustainable
rainwater or by using permeable pavers for patios environmental improvements at the neighbourhood
and driveways; scale. Rain harvesting, eco-landscaping and green
home projects are helping to divert, store and
• developing revenue tools and dedicated funding reuse runoff following rainstorms.
streams to ensure that municipalities can maintain
existing stormwater infrastructure, and retrofit new • The City of Toronto’s Wet Weather Flow Master
infrastructure and LID where needed; and Plan adopted by Toronto City Council in 2003,
is a 25-year plan that identifies 170 projects to
• sharing the monitoring results and lessons better manage stormwater, improve water quality
learned from stormwater LID projects to help and protect infrastructure from flooding and erosion.
address concerns about new stormwater Major projects currently underway include the Don
infrastructure and inspire further implementation River and Central Waterfront Project to improve
of innovative practices and approaches to sewer capacity and eliminate combined sewer
stormwater management. overflows, and the second phase of the Earl Bales
Park Stormwater management Pond Project.You can also read