HOUSTON FACTS - Discover the Houston Region The facts speak for themselves - Greater Houston Partnership
←
→
Page content transcription
If your browser does not render page correctly, please read the page content below

H O U STO N FACTS
                                                2 019             GREATER HOUSTON PARTNERSHIP

Discover the                                                The facts speak for themselves.
Houston Region
Austin | Brazoria | Chambers | Fort Bend | Galveston | Harris | Liberty | Montgomery | San Jacinto | Walker | Waller
H O U STO N FACTS
About the Greater Houston Partnership
The mission of the Greater Houston Partnership is to make Houston one of the world’s best places to live, work and
build a business. The Partnership works to make Houston greater by promoting economic development, foreign trade
and investment, and by advocating for efficient and effective government that supports, rather than impedes, business
growth. The Partnership also convenes key stakeholders to solve the region’s most pressing issues.

The Partnership was formed in 1989 in a merger of the Greater Houston Chamber of Commerce, the Houston Economic
Development Council and the Houston World Trade Association. Today, the Partnership serves the 11-county greater
Houston region and represents a member roster of more than 1,000 businesses and institutions. Members of the
Partnership account for one-fifth of all jobs in Houston. They engage in various initiatives, committees and task forces
to work toward our goal of making Houston greater.

                  GREATER HOUSTON PARTNERSHIP | 701 AVENIDA DE LAS AMERICAS, SUITE 900 | HOUSTON, TX 77010
                                                               713-844-3600 | HOUSTON.ORG

                                                                 © 2019 Greater Houston Partnership
                                             Data in Houston Facts 2019 are current as of June ’19 unless otherwise noted.
                                              Houston Facts is a registered trademark of the Greater Houston Partnership.
    Houston Facts 2019 was compiled by the research team of the Greater Houston Partnership, including Elizabeth Balderrama, Patrick Jankowski, Roel Gabe Martinez,
                       Josh Pherigo, Nadia Valliani and Melissa Verhoef. This publication was designed by Marc Keosayian and Suzanne Morgan.

                                                                   Cover photo courtesy of Levy Park

                                                                                                 The Greater Houston Partnership
                                                                                                 thanks S&P Global Market Intelligence
                                                                                                 for their contribution to Houston Facts.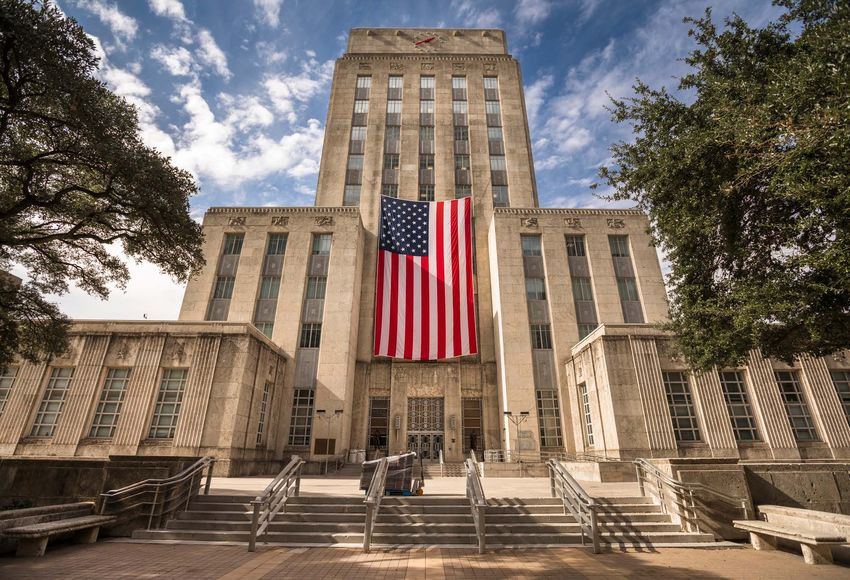
TA B L E O F C O N T E N T S

INTRODUCTION................................... 2                                                Council of Governments . . . . . . . . . . . . . . . . . . . . . . . . . . 25
The Houston Region: The Facts Speak for Themselves . . . 2                                       Taxation. . . . . . . . . . . . . . . . . . . . . . . . . . . . . . . . . . . . . . . . 25
                                                                                                 Public Safety. . . . . . . . . . . . . . . . . . . . . . . . . . . . . . . . . . . . 26
GEOGR APHY........................................ 3                                             Libraries. . . . . . . . . . . . . . . . . . . . . . . . . . . . . . . . . . . . . . . . 26
REGION IN PERSPECTIVE . . ..................... 4                                                EDUCATION....................................... 27
Area . . . . . . . . . . . . . . . . . . . . . . . . . . . . . . . . . . . . . . . . . . . . 4
                                                                                                 Schools. . . . . . . . . . . . . . . . . . . . . . . . . . . . . . . . . . . . . . . . . 27
Population. . . . . . . . . . . . . . . . . . . . . . . . . . . . . . . . . . . . . . . 4
                                                                                                 Higher Education . . . . . . . . . . . . . . . . . . . . . . . . . . . . . . . . 28
Economy. . . . . . . . . . . . . . . . . . . . . . . . . . . . . . . . . . . . . . . . . 4
                                                                                                 INFR ASTRUCTURE.............................. 29
DEMOGR APHICS.................................. 5                                                Utilities . . . . . . . . . . . . . . . . . . . . . . . . . . . . . . . . . . . . . . . . 29
Population and People. . . . . . . . . . . . . . . . . . . . . . . . . . . . . 5
                                                                                                 Land Transportation. . . . . . . . . . . . . . . . . . . . . . . . . . . . . .  31
Refugees . . . . . . . . . . . . . . . . . . . . . . . . . . . . . . . . . . . . . . . . 7
                                                                                                 Ports. . . . . . . . . . . . . . . . . . . . . . . . . . . . . . . . . . . . . . . . . . . 32
Income. . . . . . . . . . . . . . . . . . . . . . . . . . . . . . . . . . . . . . . . . . 7
                                                                                                 Air Transportation. . . . . . . . . . . . . . . . . . . . . . . . . . . . . . . . 33
Wages. . . . . . . . . . . . . . . . . . . . . . . . . . . . . . . . . . . . . . . . . . . 8
Commuting to Work. . . . . . . . . . . . . . . . . . . . . . . . . . . . . . . 8                 COMMUNICATIONS AND MEDIA........... 35
Metro Houston Occupations. . . . . . . . . . . . . . . . . . . . . . . . 8                       Broadcast. . . . . . . . . . . . . . . . . . . . . . . . . . . . . . . . . . . . . . . 35
                                                                                                 Digital and Print. . . . . . . . . . . . . . . . . . . . . . . . . . . . . . . . . . 35
HOUSTON ECONOMY............................ 9
Corporate Economy. . . . . . . . . . . . . . . . . . . . . . . . . . . . . . 10                  LIFE IN HOUSTON. . ............................. 36
International Business . . . . . . . . . . . . . . . . . . . . . . . . . . . . . 11              Cost of Living. . . . . . . . . . . . . . . . . . . . . . . . . . . . . . . . . . . . 36
                                                                                                 Weather. . . . . . . . . . . . . . . . . . . . . . . . . . . . . . . . . . . . . . . . 37
TOP INDUSTRIES AND SECTORS.......... 13                                                          Lodging . . . . . . . . . . . . . . . . . . . . . . . . . . . . . . . . . . . . . . . . 38
Construction and
                                                                                                 Dining. . . . . . . . . . . . . . . . . . . . . . . . . . . . . . . . . . . . . . . . . . 38
Real Estate. . . . . . . . . . . . . . . . . . . . . . . . . . . . . . . . . . . . . .  13
                                                                                                 Arts and Culture . . . . . . . . . . . . . . . . . . . . . . . . . . . . . . . . . 38
Health Care and
Social Assistance . . . . . . . . . . . . . . . . . . . . . . . . . . . . . . . . 15             Organizations . . . . . . . . . . . . . . . . . . . . . . . . . . . . . . . . . . . 40
Manufacturing. . . . . . . . . . . . . . . . . . . . . . . . . . . . . . . . . . . 16            Museums. . . . . . . . . . . . . . . . . . . . . . . . . . . . . . . . . . . . . . .  41
Professional and Technical Services . . . . . . . . . . . . . . . .  17                          Religious and Cultural Diversity . . . . . . . . . . . . . . . . . . . . 45
Wholesale and                                                                                    Convention and Sports Facilities . . . . . . . . . . . . . . . . . . . 46
Retail Trade. . . . . . . . . . . . . . . . . . . . . . . . . . . . . . . . . . . . . 18         Major Events and Conventions. . . . . . . . . . . . . . . . . . . . . 48
Energy . . . . . . . . . . . . . . . . . . . . . . . . . . . . . . . . . . . . . . . . . 19      Parks and Recreation. . . . . . . . . . . . . . . . . . . . . . . . . . . . . 48
NASA and Aerospace. . . . . . . . . . . . . . . . . . . . . . . . . . . . . 20
Innovation . . . . . . . . . . . . . . . . . . . . . . . . . . . . . . . . . . . . . . 21        HISTORY........................................... 52

GOVERNMENT . . .................................. 24
City of Houston. . . . . . . . . . . . . . . . . . . . . . . . . . . . . . . . . . 24
Counties. . . . . . . . . . . . . . . . . . . . . . . . . . . . . . . . . . . . . . . . 24
State Government. . . . . . . . . . . . . . . . . . . . . . . . . . . . . . . . 25
United States Congress. . . . . . . . . . . . . . . . . . . . . . . . . . . 25

                                                                                                                                                         Greater Houston Partnership             1
INTRODUCTION                                           T H E H O U S TO N R EG I O N : T H E
                                                           FA C T S S P E A K F O R T H E M S E LV E S

    H O U S TO N FAC T S .
    THE TITLE SAYS MUCH ABOUT THIS
    PUBLICATION. NO SPIN. NO FRILLS.
    NO HYPERBOLE. JUST PAGE AFTER
    PAGE OF STRAIGHTFORWARD
    INFORMATION FROM HUNDREDS OF
    SOURCES TO ANSWER QUESTIONS
    FREQUENTLY ASKED ABOUT THE
    HOUSTON REGION.

    Houston Facts has presented unvarnished information
    about the Houston region since 1959, and its
    predecessor publications—under different names,             You may find in these pages facts that
    but with the same objective—date to 1906. Over the          you never knew about the Houston
    decades, Houston Facts has grown well beyond its            region. For example:
    original four pages so that we could expand the range
    and depth of coverage, bringing you more information        •   More than 1.6 million Houstonians, or roughly
    about parks, museums, schools, living costs, the regional       one in four, were born outside the U.S.
    economy and a host of other topics. It has evolved into
    a concise almanac for the Houston region. Corporate         •   If Houston were a country, it would rank as the
    planners, market analysts, students, relocation and             26th largest economy in the world—exceeding
    site selection consultants, real estate professionals,          Thailand’s and Iran’s Gross Domestic Product.
    government agencies and myriad others turn to it for        •   Metro Houston has the third largest number of
    authoritative information on this region.                       Fortune 1000 companies in the nation.

    Of course, we believe the Houston region is one of the      •   More than 500 institutions are devoted to
    nation’s most attractive major metropolitan areas—an            the performing and visual arts, science and
    outstanding place to live, work and build a business. We        history in the Houston area.
    would like you to share that view. But we won’t try to
    persuade you. The facts need no embellishment. They
    speak for themselves.

2    Houston Facts | 2019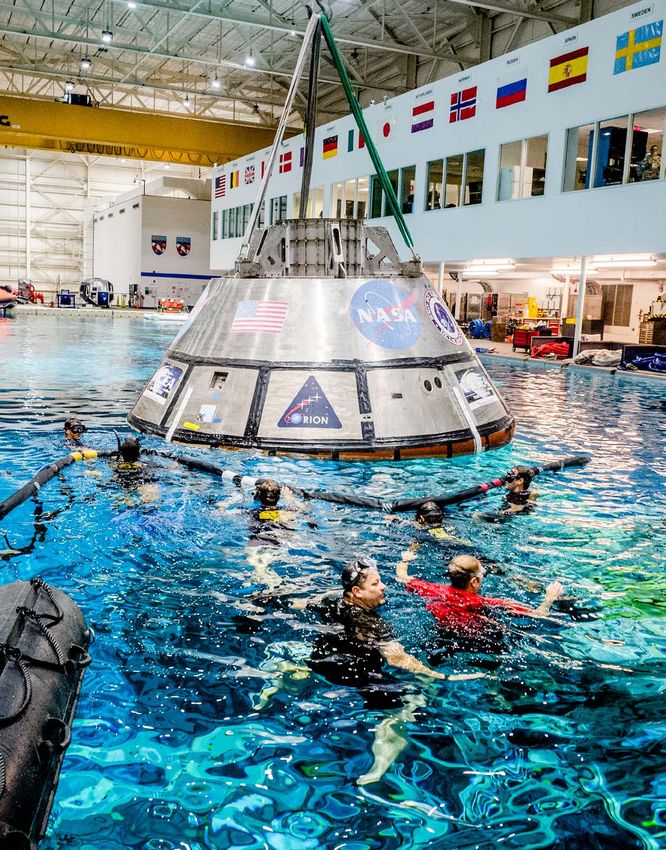
GEOGR APHY

                HOUSTON MSA
                9,444 square miles1

                HARRIS COUNT Y                                                              Montgomery
                1,778 square miles1
                                                                                                                          Liberty
                HOUSTON
                665 square miles1
                                                                                            Harris
                                                              Austin        Waller
                                                                                                   HOUSTON
                                                                                                                                Chambers

                                                                                       Fort Bend

                                                                                                                   Galveston

                                                                                                   Brazoria

The Houston-The Woodlands-Sugar Land Metropolitan                                        The county seat or administrative center of Harris
Statistical Area (MSA) contains nine Texas counties:                                     County is the City of Houston. Harris County contains
Austin, Brazoria, Chambers, Fort Bend, Galveston,                                        the bulk of the city in addition to all or part of 33
Harris, Liberty, Montgomery and Waller. 2 Within these                                   incorporated cities and 12 CDPs. Small portions
nine counties are 124 incorporated cities and 33 Census                                  of Houston spread into adjacent Montgomery and
Designated Places (CDP). 3                                                               Fort Bend counties.

1
 The longer title is shortened to “Houston MSA,” “metro Houston,” “Greater Houston,” “Houston area” or simply “Houston”
in Houston Facts. MSAs are geographic delineations defined by the Office of Management and Budget (OMB) for use by
federal statistical agencies in collecting, tabulating and publishing data.
2
    A Census Designated Place functions like a city or town but is not incorporated.
3
    Combined land and water area                                                                                                Greater Houston Partnership   3
REGION IN PERSPECTIVE
    AREA
    The nine-county Houston-The Woodlands-Sugar Land Metropolitan Statistical
    Area (MSA) covers 9,444 square miles, an area larger than five states: New
    Hampshire, New Jersey, Connecticut, Delaware and Rhode Island.

    Harris County covers 1,778 square miles, enough space to fit the cities of Austin,
    Boston, Chicago, Dallas, New York City and Seattle with room still to spare.

    At 665 square miles, the City of Houston is larger than the cities of Chicago,
    Dallas, Los Angeles, New York, Phoenix and San Diego.

    P O P U L AT I O N
    The nine-county Houston MSA had a population of 6,997,384 residents as of
    July 1, 2018, according to estimates by the U.S. Census Bureau. If metro Houston
    were a state, it would have the 15th largest population in the U.S., behind Arizona
    (7,171,646) and ahead of Massachusetts (6,902,149) and Tennessee (6,770,010).

    Harris County had a population of 4,698,619 residents as of July 1, 2018,
    according to estimates by the U.S. Census Bureau. If Harris County were a state,
    it would have the 25th largest population in the U.S., behind Alabama (4,887,871)
    and ahead of Louisiana (4,659,978) and Kentucky (4,468,402).

    The City of Houston had a population of 2,325,502 residents as of July 1, 2018,
    according to estimates by the U.S. Census Bureau. If the city were a state, it
    would rank 35th in population in the U.S., behind Kansas (2,911,505) and ahead
    of New Mexico (2,095,428) and Nebraska (1,929,268).

    ECO N O M Y
    The U.S. Bureau of Economic Analysis estimates the Houston MSA’s Gross Domestic Product (GDP) at $490.1 billion
    in ’17, making it the seventh largest U.S. metro economy. If Houston were a state, its GDP would rank 15th, behind
    Michigan ($508.9 billion) and ahead of Maryland ($399.5 billion) and Indiana ($352.3 billion).

    If the MSA were an independent nation, it would rank as the world’s 26th largest economy, behind Belgium ($495.8
    billion) and ahead of Thailand ($455.3 billion) and Iran ($430.7 billion), according to the International Monetary Fund.

      Selected Key Economic Indicators for ’18

      •   The Houston Association of Realtors Multiple           •   The Houston Airport System handled
          Listing Service recorded closings on 98,348                58,284,008 passengers, an average of 111
          properties (includes single-family homes,                  passengers per minute.
          townhomes, condos, high rises, etc.), an average       •   The City of Houston issued building permits for
          of one every 5.3 minutes.                                  construction valued at $6.1 billion, an average of
      •   Houston MSA automobile dealers sold 303,417                $11,587 per minute.
          new cars, trucks and SUVs, an average of one
          every 1.7 minutes.

4    Houston Facts | 2019
DEMOGR APHICS
DECENNIAL CENSUS AND INTERCENSAL                                      P O P U L AT I O N A N D P E O P L E
POPUL ATION
                                                                      The Houston-The Woodlands-Sugar Land MSA’s
Year     Metro Houston         Harris County        City of Houston   population of 6,997,384 residents on July 1, 2018
                                                                      ranks fifth among the nation’s metropolitan areas. The
2018          6,997,384             4,698,619           2,325,502
                                                                      Houston MSA had the third largest numeric increase
2010          5,920,487             4,092,459           2,099,451     (91,689) in population of any U.S. metro from July 1, 2017
                                                                      to July 1, 2018, reflecting 1.3 percent growth.
2000          4,693,161             3,400,578           1,953,631
1990          3,750,411             2,818,199           1,637,859     Harris County, population of 4,698,619 on July 1, 2018,
                                                                      is the third most populous county in the nation. Among
1980          3,135,806             2,409,544           1,594,086     all U.S. counties, Harris County had the third highest
1970          2,195,146             1,741,912           1,232,802     numeric population increase between July 1, 2016 and
                                                                      July 1, 2017, gaining 34,460 new residents. The county
1960          1,594,894             1,243,158             938,219     led the nation in population growth each year from ’11 to
1950          1,083,100               806,701             596,163     ’15, slipping in subsequent years.

1940             752,937              528,961             384,514     The City of Houston, the fourth most populous U.S. city,
                                                                      had a population of 2,325,502 on July 1, 2018. Houston
1930             545,547              359,328             292,352
                                                                      added 8,057 residents from July 1, 2017 to July 1, 2018,
1920             348,661              186,667             138,276     the equivalent of 0.3 percent. Slower growth for the
                                                                      city was expected, given the persistent weakness in the
1910             252,066              115,693              78,800
                                                                      local economy during that period.
1900             202,438                63,786             44,633
1890             137,800                37,249             27,557
1880             112,053                27,985             16,513
1870               80,866               17,375               9,382
1860               55,317                   9,070            4,845
1850               27,984                   4,668            2,396
Source: U.S. Census Bureau, Texas Almanac

                                                                                                        Greater Houston Partnership   5
COMPONENTS OF POPUL ATION CHANGE                                                                                           Metro Houston, 2010 – 2018
                                              Population                                                Population Change Since ’10

          Geography                                                                  Net Migration                     Natural Increase
                                                                                                                                                  Total Population
                                        ’10                  ’18
                                                                            International        Domestic            Births            Deaths         Change

    Houston MSA                    5,920,487            6,997,384                322,120          261,990          798,397             308,126         1,076,897
    Austin County                      28,412               29,989                   235                784            2,813              2,241                1,577
    Brazoria County                   313,123              370,200                 4,825           31,224            39,071              18,218            57,077
    Chambers County                    35,099               42,454                   627               4,765           4,128              2,209                7,355
    Fort Bend County                  584,690              787,858                39,279          111,760            74,264              23,657           203,168
    Galveston County                  291,307              337,890                 4,555           29,486            33,346              21,057            46,583
    Harris County                   4,093,188           4,698,619                259,047           -23,113          573,962             203,745           605,431
    Liberty County                     75,641               86,323                   561               7,502           8,944              6,320            10,682
    Montgomery County                 455,750              590,925                12,578           92,845            56,794              28,230           135,175
    Waller County                      43,277               53,126                   413               6,737           5,075              2,449                9,849
    Note: In some cases, the increase due to migration and the natural increase will not sum to the change in population due to rounding and the Bureau’s use of
    residual values in generating the estimates.
    Source: U.S. Census Bureau, 2018 Population Estimates

                                                                                        AGE DISTRIBUTION                                   Houston MSA, 2017

                                                                                             Under 5 years                             7.4%
    Nearly one in four Houstonians was born outside the
                                                                                              5 to 17 years                                                    19.3%
    U.S. Among the 1,629,242 foreign-born in the Houston
    metro area, 75.4 percent entered the U.S. before ’10.                                    18 to 24 years                               9.0%
                                                                                             25 to 34 years                                        15.0%
    Top regions of birth for the Houston MSA’s foreign-born                                  35 to 44 years                                       14.3%
    are: Latin America (63.1 percent), Asia (25.1 percent),                                  45 to 54 years                                     12.8%
    Africa (5.8 percent) and Europe (4.6 percent).                                           55 to 64 years                                   11.3%
                                                                                             65 to 84 years                               9.7%
                                                                                            85 years & over               1.1%

                                                                                        Note: Sums may not total due to rounding.
                                                                                        Source: U.S. Census Bureau, 2017 American Community Survey

    SELEC TED DEMOGR APHIC CHAR AC TERISTIC S                                                                                            Metro Houston, 2017
                                                                                                               Percent of Adults with
                                                                   Total                  Average                                          Foreign-Born Percent
             Geography                  Median Age                                                             Bachelor’s Degree or
                                                                Households             Household Size                                       of Total Population
                                                                                                                      Higher
    Houston MSA                                  34.4              2,324,758                     2.9                           32.4                    23.6
    Austin County                                40.9                  11,021                    2.6                           22.3                    10.6
    Brazoria County                              35.6                 117,088                    2.9                           29.7                    13.1
    Chambers County                              35.4                  13,320                    2.9                           20.5                      9.4
    Fort Bend County                             35.8                 222,331                    3.2                           45.7                    27.6
    Galveston County                             37.6                 117,455                    2.7                           29.5                      9.8
    Harris County                                33.1                1,562,813                   2.9                           30.5                      26
    Liberty County                               35.8                  25,974                    2.8                             9.3                     7.5
    Montgomery County                            36.7                 186,861                    2.9                           33.7                      13
    Waller County                                28.8                  14,698                    3.0                           19.2                    14.8

    Note: County data may not sum to Houston MSA total due to a difference in survey methods.
    Source: County data from U.S. Census Bureau, 2013-17 American Community Survey; MSA data from U.S. Census Bureau, 2017 American Community Survey

6    Houston Facts | 2019
REFUGEES                                                                         EDUCATIONAL AT TAINMENT
                                                                                 Houston MSA, 2017
Metro Houston accepted 523 refugees in ’18, nearly a
third of all refugees resettled in Texas that year and 2.3                           Highest Education                    Population Age 25
percent of those in the U.S. They came from 18 countries                               Level Attained                         or Older
with the top 10 comprising 92.9 percent of all newly-
resettled refugees in the region.                                                                                       Number            Percent
The number of refugees resettled in the Houston region                           No High School
in ’18 declined 38.2 percent from the 723 received the                                                                   729,054              16.4
                                                                                 Diploma
previous year. The number of refugees resettled in the U.S.
overall declined 45.9 percent during the same period.                            High School
                                                                                                                       3,696,786              83.5
                                                                                 Graduate or Higher

                                                                                  High School Diploma
                                                                                                                       1,025,879              23.2
                                                                                  or GED

 R ACE / ETHNIC COMPOSITION                                                       Some
                                                                                                                          917,211             20.7
 Houston MSA, 2017                                                                College, No Degree

                                                                                  Associate Degree                        320,624              7.2

                                                                                  Bachelor’s
                                                                                                                       1,433,072              32.4
                                                                                  Degree or Higher

                                                                                     Bachelor’s Degree                    518,407             20.7
         36.1%                                              37.3%

                                                                                     Graduate or
                                                                                                                          914,665             11.7
                                                                                     Professional Degree

                                                                                 Total population
                                                                                                                       4,425,840          100.0
                                                                                 age 25 or older
                                                                                 Note: Sums may not total due to rounding.
                                                                                 Source: U.S. Census Bureau, 2017 American Community Survey
                         7.8%              16.9%
          1.9%

                                                                                 INCOME
          White             Hispanic/Latino             Black/African
                                                        American                 Per Capita Personal Income
          Asian             Other
                                                                                 The nine-county Houston MSA pretax per capita
                                                                                 personal income (PCPI) in ’17 was $52,765, 2.2 percent
                                                                                 above the U.S. average of $51,640, according to the
 Note: Hispanic/Latino includes all races. Sums may not total due to rounding.
 Source: U.S. Census Bureau, 2017 American Community Survey
                                                                                 latest data available by the U.S. Bureau of Economic
                                                                                 Analysis (BEA). PCPI increased 3.0 percent in the
                                                                                 Houston MSA, compared to 3.6 percent nationwide
                                                                                 from ’16 to ’17.

                                                                                 Total Personal Income

                                                                                 Total personal income, defined as income received
                                                                                 from all sources, in the nine-county Houston MSA
                                                                                 in ’17 was $363.7 billion, up 4.4 percent from ’16,
                                                                                 according to BEA data.

                                                                                                                            Greater Houston Partnership   7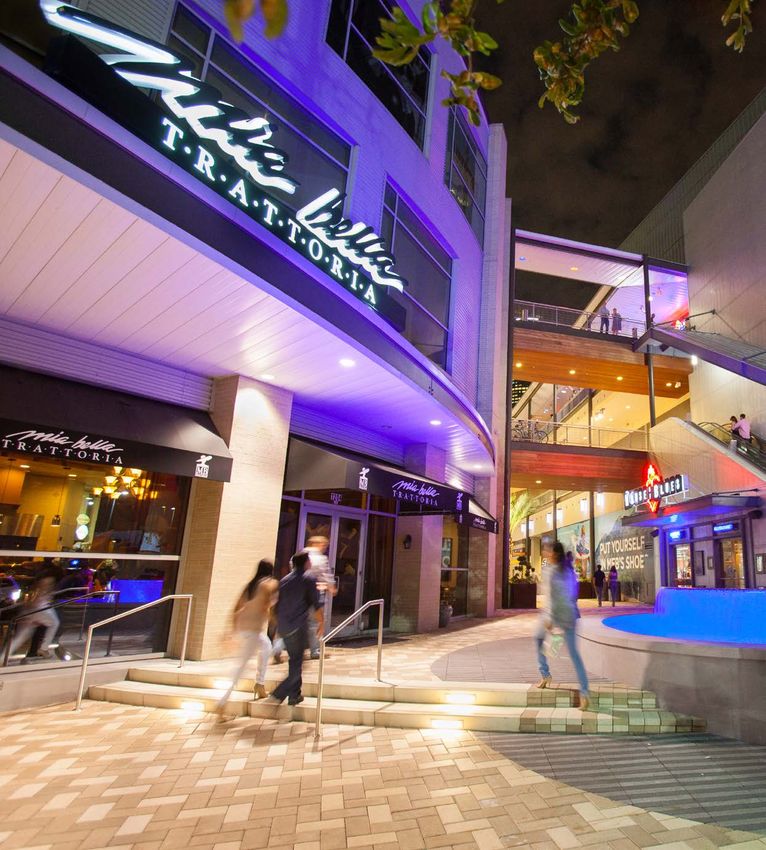
WAG E S                                                                                 CO M M U T I N G TO WO R K
    The average weekly wage in metro Houston was $1,277                                     Average travel time to work: 29.9 minutes in ’17.
    in the four quarters ending Q3/18, according to the
    Texas Workforce Commission. Total wages for the metro
                                                                                               COMMUTING TO WORK
    area were $195.5 billion for the same period.
                                                                                               Houston MSA, 2017

    TOTAL WAGES                                                                                  Average travel time to work          29.9 minutes
    Metro Houston, 2018*, ($ Millions)                                                           Method of Travel           Percent of Workers 16 and Older
    Houston MSA                                                         195,509.0                  Drove alone in
                                                                                                                                                        80.3%
                                                                                                  car, truck or van
    Austin County                                                             479.0
                                                                                                 Carpooled in car,
    Brazoria County                                                        6,563.1                                            10.0%
                                                                                                       truck or van
    Chambers County                                                           962.1
                                                                                                 Worked at Home             4.7%
    Fort Bend County                                                       9,636.6
    Galveston County                                                       5,366.4                          Public
                                                                                                                           2.1%
    Harris County                                                       160,671.9
                                                                                                    Transportation

    Liberty County                                                            818.3                        Walked         1.4%
    Montgomery County                                                     10,232.8
    Waller County                                                             778.8
                                                                                                            Bicycle      0.2%

    *Note: Four quarters ending Q3/18. Sums may not total due to rounding.
    Source: Texas Workforce Commission, Quarterly Census of                                           Other Means         1.3%
    Employment and Wages

                                                                                               Note: Sums may not total due to rounding.
                                                                                               Source: U.S. Census Bureau, 2017 American Community Survey

    M E T R O H O U S T O N O C C U PAT I O N S

     OCCUPATIONS
     Houston MSA, 2018

                                                        Total Occupation Employment 2,982,410
              Office and                         Sales and Related                   Food Preparation                 Transportation and               Construction and
              Administrative                                                         and Serving Related              Material Moving                  Extraction
              Support
                                                  305,590 10.2%
                                                                                     277,440 9.3%                     212,400 7.1%                     182,530 6.1%
              467,400 15.7%

              Education, Training,               Production                          Health Care                      Business and                     Installation,
              and Library                                                            Practitioners and                Financial Operations             Maintenance,
                                                 183,520 6.2%                                                                                          and Repair
              176,220 5.9%                                                           Technical                        153,730 5.2%
                                                                                     168,220 5.6%                                                      130,320 4.4%

              Management                         Architecture and                    Building and                     Computer and                     Personal Care
                                                 Engineering                         Grounds Cleaning                 Mathematical                     and Service
              146,730 4.9%
                                                 81,410 2.7%                         and Maintenance                  80,880 2.7%                      83,440 2.8%
                                                                                     84,500 2.8%

              Protective Service                 Health Care Support                 Arts, Design,                    Life, Physical,                  Community and
                                                 66,170 2.2%                         Entertainment,                   and Social Science               Social Services
              70,320 2.4%                                                            Sports, and Media                29,650 1.0%                      24,680 0.8%
                                                                                     30,350 1.0%

              Legal                              Farming, Fishing,
                                                 and Forestry
              22,710 0.8%                                                                                                            Employment           % of Total
                                                 4,200 0.1%

     Source: U.S. Department of Labor, Bureau of Labor Statistics, 2018 Occupation Employment Statistics

8    Houston Facts | 2019                                                                                                                  Greater Houston Partnership
H O U S TO N E C O N O M Y
Over the past decade, Houston has endured two 93,000 new residents in ’17 and 92,000 in ’18, the gains
economic downturns (the Great Recession and the coming solely from the net natural increase (births minus
Fracking Bust) and two major storms (Hurricanes Ike and deaths) and international migration.
Harvey), yet the region has demonstrated remarkable
growth and resiliency over that period. From ’08 to ’18, Job growth resumed mid-’17, aided by a healthy U.S.
Houston has gained 1.4 million residents, created more economy and strong ties to a growing global economy.
than 500,000 jobs and added $100 billion to its gross The Brookings Institution estimates that 17.3 percent of
domestic product (GDP). Houston’s GDP is now tied to exports, up from just 8.9
percent in ’03.
Houston lost 120,000 jobs in the Great Recession but
was among the first to recover, recouping all the jobs The current economic outlook remains bright for
lost in less than two years. Houston went on to lead the Houston. The region is on pace to add 71,000 jobs,
nation in job growth, averaging 100,000 per year during build more than 30,000 single-family homes and
the height of the fracking boom (’10 – ’14). Population handle more than $240 billion in foreign trade in ’19.
growth exceeded 170,000 new residents in some years. Population growth always lags job growth by one to two
years, so Houston probably won’t return to its long-
Oil prices fell from over $100 per barrel in June ’14 to term average of 125,000 new residents per year until
$26 per barrel in February ’16 and the energy industry ’20 or later. Though population gains have slowed,
proceeded to shed nearly 93,000 jobs. Construction, Houston consistently ranks among the top five metros
retail, health care, business and professional services for growth. The Perryman Group calls for the region’s
and hospitality grew, but not enough to offset the layoffs population to hit 8.4 million, payroll employment to
in oil in gas. Houston lost 4,900 jobs in the downturn, reach 4.0 million and GDP to top $1.0 trillion by the end
by any standards a relatively mild recession. Population of the next decade.
growth responded in a like manner, dropping to around
PAYROLL EMPLOYMENT
Metro Houston
3.2 150
3.1
100
Nonfarm Payroll Employment (Millions)
3.0
12-Month Change (Thousands)
50
2.9
2.8 0
2.7
-50
2.6
-100
2.5
2.4 -150
’09 ’10 ’11 ’12 ’13 ’14 ’15 ’16 ’17 ’18 ’19
Employment 12-Month Change
Source: Texas Workforce Commission, Employment Estimates
Greater Houston Partnership 9EMPLOYMENT BY INDUSTRY
Houston MSA, 2018 (Annual Average)
Industry Jobs (000) % of Total
GOODS PRODUCING 529,2 17.2
MINING AND LOGGING 79,1 2.6
Oil and Gas Extraction 36,7 1.2
Support Activities for Mining 41,2 1.3
CONSTRUCTION 221,1 7.2
MANUFACTURING 229,0 7.4
Durable Goods 145,0 4.7
Non-Durable Goods 83,9 2.7
TRADE, TRANSPORTATION
624,9 20.3
AND UTILITIES
Wholesale Trade 168,8 5.5
Retail Trade 307,7 10.0
Transportation, Warehousing
148,3 4.8
and Utilities
SERVICE PROVIDING 2,555,5 82.8
INFORMATION 31,6 1.0
FINANCIAL ACTIVITIES 164,1 5.3 C O R P O R AT E E C O N O M Y
Finance and Insurance 102,9 3.3
Metro Houston, a major corporate center, ranks fourth
Real Estate and Rental and Leasing 61,2 2.0
in the nation in Fortune 500 headquarters and third in
PROFESSIONAL AND Fortune 1000. Many other Fortune firms maintain U.S.
493,7 16.0
BUSINESS SERVICES offices in Houston.
Professional, Scientific, and
Technical Services
228,0 7.4 The region ranks sixth on the 2018 Fortune Global
500 list, and 53 of the 100 largest non-U.S.-based
Management of Companies
46,9 1.5 corporations have a presence in Houston.
and Enterprises
The Texas Workforce Commission reports that Metro
Admin and Support and
218,8 7.1 Houston is home to more than 157,000 establishments.
Waste Mgmt.
EDUCATIONAL AND
393,5 12.8
HEALTH SERVICES HOUSTON-HE ADQUARTERED COMPANIES
Educational Services 60,8 2.0 Number of Metro
Health Care and Companies Rank
332,7 10.8
Social Assistance 2018 Fortune 500 21 4
LEISURE AND HOSPITALITY 325.0 10.5 2018 Fortune 1000 44 3
Arts, Entertainment, and Recreation 35.3 1.1 2018 Fortune Global 500 6 6
Accommodation and Food Services 289.7 9.4 2018 Forbes Global 2000 23 5
OTHER SERVICES 111,7 3.6 2018 Inc. 5000 100 13
Source: Fortune, Forbes and Inc.
GOVERNMENT 411,1 13.3
TOTAL NONFARM 3,084,7 100.0
The three industries with the most establishments are
Note: The table above uses estimates from the Current Employment professional, scientific, and technical services; health
Statistics while the industry profiles on the following pages uses data from
the Quarterly Census of Employment and Wages. Figures will differ. Sums
care and social assistance; and retail trade. These
may not total due to rounding. three industries comprise 38.0 percent of the region’s
Source: Texas Workforce Commission, 2018 Current Employment Statistics business establishments. Over half of the metro’s
establishments employ between one and four workers.
10 Houston Facts | 2019 Greater Houston PartnershipESTABLISHMENTS BY EMPLOYMENT SIZE
I N T E R N AT I O N A L B U S I N E S S
Houston MSA, 2016
Houston is the base of operations for the international
Number of Percent of oil and gas exploration and production industry as
Employment Size
Establishments Establishments well as for many of the nation’s largest international
1 to 4 72,327 52.0 engineering and construction firms.
5 to 9 25,176 18.1 A key center for international finance, Houston leads the
Southwest U.S. with 19 foreign banks from 10 nations.
10 to 19 18,113 13.0
20 to 49 13,980 10.1 Houston’s economy is deeply tied to global trade and
foreign investment. The region has trading relationships
50 to 99 5,142 3.7 with more than 200 countries. The Houston/Galveston
100 to 249 3,012 2.2 Customs District handled 19.5 million metric tons in
exports valued at $140.5 billion in ’18, according to
250 to 499 836 0.6 WISERTrade. These exports accounted for 60.3 percent
500 to 999 274 0.2 of the value of total trade that passed through the region
in ’18—a 15-point increase from 44.9 percent in ’09.
1,000 or more 150 0.1
The Brookings Institution estimates that in ’17,
TOTAL 139,010 100.0 17.3 percent of Houston’s economy was tied to
Source: U.S. Census Bureau, 2016 County Business Patterns exports, and that exports supported 330,340 jobs
(indirect and direct).
ESTABLISHMENTS BY INDUSTRY
Houston MSA, 2018*
Industry Number Percent
Professional, Scientific, and Technical Services 21,764 13.9
Health Care and Social Assistance 19,954 12.7
Retail Trade 17,998 11.5
Other Services (except Public Administration) 15,041 9.6
Accommodation and Food Services 12,565 8.0
Construction 11,071 7.0
Wholesale Trade 10,931 7.0
Finance and Insurance 9,010 5.7
Administrative and Support and Waste Management and Remediation Services 8,584 5.5
Real Estate and Rental and Leasing 7,663 4.9
Manufacturing 6,388 4.1
Transportation and Warehousing 4,618 2.9
Educational Services 2,011 1.3
Mining, Quarrying, and Oil and Gas Extraction 1,917 1.2
Unclassified 1,781 1.1
Arts, Entertainment, and Recreation 1,651 1.1
Information 1,614 1.0
Management of Companies and Enterprises 789 0.5
Public Administration 708 0.5
Agriculture, Forestry, Fishing and Hunting 577 0.4
Utilities 504 0.3
Total 157,137 100.0
*Note: Four quarters ending Q3/18. Sums may not total due to rounding.
Source: Texas Workforce Commission, Quarterly Census of Employment and Wages
Houston Facts | 2017 Greater Houston Partnership 11HOUSTON ' S TOP EMPLOYERS
More Than 20,000 Employees 10,000 to 19,999 Employees
H-E-B UT MD Anderson Cancer Center ExxonMobil National Oilwell Varco Texas Children's Hospital
Houston Methodist Walmart HCA Schlumberger United Airlines
Memorial Hermann Health System Kroger Shell Oil Co. UT Medical Branch Health System
5,000 to 9,999 Employees
AT&T CHI St. Luke's Health Houston Community College S&B Engineers and Constructors
Baker Hughes, a GE Company Dow Chemical Co. JPMorgan Chase Target Corp.
Baylor College of Medicine Halliburton KBR University of Houston
BP America Harris Health System Lone Star College UT Health Science Center at Houston
CenterPoint Energy Hewlett Packard Enterprise Michael E. DeBakey VA Medical Walgreens
Chevron Home Depot Center
2,000 to 4,999 Employees
Academy Sports & Outdoors Daikin/Goodman Landry's Rice University
AIG Deloitte Lewis Food Town Sam's Club
Air Liquide USA Dril-Quip Lowe's Cos. Sodexo
American National Insurance Co Enterprise Products Luby's Southwest Airlines
Aon Equistar Chemicals LyondellBasell Sysco Corp.
Bank of America FedEx Macy's TechnipFMC
Bechtel Corporation Fiesta Mart Mariner Post-Acute Network Tenet Healthcare Corp.
Brinker International Fluor McDermott Texas Home Health
Brock Group Grocers Supply Company NASA - Johnson Space Center Union Pacific Railroad
Cameron, a Schlumberger Company Group 1 Automotive NRG Energy UnitedHealthcare
Chevron Phillips Chemical Co. Jacobs Occidental Petroleum Waste Management
Comcast Kelsey-Seybold Clinic O'Reilly Auto Parts Weatherford
ConocoPhillips Kinder Morgan Phillips 66 Wells Fargo
CVS Health Kindred Healthcare Randalls Food Markets, Inc. Wood Group
Note: The list excludes government employers (except hospitals, universities and research centers) and fast food chains.
Source: Greater Houston Partnership Research, March 2019
Ninety nations have consular representation in Houston has 18 sister-city relationships promoting
the city, ranking Houston’s consular corps third business opportunities across five continents: Asia (7),
largest in the nation. Europe (7), Americas (2), Africa (1), and Australia (1).
Houston’s oldest sister-city relationship was established
Fifteen foreign governments maintain trade and in 1961 with Taipei, Taiwan, and its most recent
commercial offices here, and the city has more relationship with Basrah, Iraq was established in ’15.
than 35 active foreign chambers of commerce and
trade associations. More than 150 Houston-based companies operate
subsidiary locations around the world. These
firms account for over 3,000 offices in more
than 110 countries.
More than 1,700 firms in Houston report foreign
ownership. In ’17, at least 40 foreign-owned firms
invested in office expansions, new plants and expanded
distribution facilities in Houston. More than $3.3 billion
in capital investments were made by foreign-owned
firms in Houston.
Nearly 5,000 Houston-area firms are engaged in
global commerce, including more than 2,300 local
manufacturers.
Eleven of Houston’s 32 skyscrapers (at least 150
meters tall) are owned, co-owned, or financed by
foreign investors.
12 Houston Facts | 2019TO P I N D U S T R I E S A N D S E C TO R S
CONSTRUCTION AND Building Permits
R E A L E S TAT E City of Houston building permits totaled $6.1 billion in
’18 with $2.3 billion for residential and $3.3 billion for
commercial building permits, according to city data.
Employment
The construction industry in Houston employed 218,580
Office
people in the four quarters ending Q3/18, according to At the close of ’18, CBRE reports that the Houston
the Texas Workforce Commission. Half of all construction area, the nation’s sixth largest office market, counted
employment occurred as specialty trade contractors (e.g., 1,276 general-purpose office buildings containing 213.5
electrical work, plumbing, site preparation, painting). million-square-feet (msf) of completed net rentable
Building construction accounted for 24.3 percent, and space (42.3 msf in the Central Business District, or CBD).
heavy and civil engineering construction accounted for
25.5 percent of construction employment. Annual wages Net absorption (net change in leased space in
in the industry averaged $74,386. completed buildings) for all general-purpose office
space was negative 1.2 msf in ’18. The vacancy rate
Establishments for the entire Houston market was 18.7 percent at
the end of ’18.
The Houston metro area was home to nearly 11,071
construction establishments in the four quarters ending Average asking rent for the entire Class A office market
Q3/18. Of that total, 61.1 percent were specialty trade was $37.12 per square foot ($44.65 for CBD Class A and
contractors, 29.2 percent were in building construction, $33.46 for suburban Class A).
and 9.6 percent were heavy and civil engineering
construction establishments. Industrial
Top Employers The industrial market in Houston had 521.3 msf of
net rentable area. It is ranked as the sixth largest
Bechtel, Bellows Construction, D.E. Harvey Builders, U.S. industrial market. CBRE reported year-end ’18
E.E. Reed Construction, Fluor, Gilbane Building, occupancy remained tight at 95.0 percent. During
Jacobs, Linbeck Group, McCarthy Building Companies, ’18, 16.3 msf of projects commenced construction, a
S & B Engineers and Constructors, SpawGlass record high. Net absorption for ’18 was strong with a
Construction, Summit Industrial, Tellepsen, Turner total of 10.6 msf. Across the market, average monthly
Construction, Turner Industries, Williams Brothers asking rates were $0.62 per square foot in the fourth
Construction and Zachary. quarter of ’18.
Greater Houston Partnership 13Retail
The Houston retail market recorded 677,082 square
feet of net absorption in ’18. The region is home to
8,053 retail centers with 303.6 msf of net rentable area.
Occupancy rates continued to rise throughout ’18, and
the year ended with a vacancy rate of 5.6 percent. The
average annual rental rate was $27.66 per square foot.
Single-Family
In ’18, single-family closings (largely resale homes) in
the Houston area totaled 82,177, and an additional 6,746
town homes, condos and high rises were sold, according
to the Houston Association of Realtors. The median
sales price for a resale single-family detached home was
$237,500. Single-family starts in ’18 numbered 30,146,
according to Metrostudy.
Multi-Family
Apartment Data Services reported that Houston area An additional 5,075 new units were added to the
multi-family occupancy was 89.6 percent in ’18, with market in ’18, a decline from the high level of apartment
an inventory of 647,941 units, and as of December ’18, construction in previous years. In ’18, 7,966 units were
inventory included 2,763 complexes. Prices averaged absorbed, a decrease from the record high absorption of
$1,022 per month. Rental rates ending December ’18, 17,108 units in ’17 due to demand by residents displaced by
averaged $1.16 per square foot per month. Hurricane Harvey. As of January ’19, 53 communities with
• Class A apartments recorded 87.2 percent occupancy 15,753 units are under construction, and 92 communities
at $1.57/sf/mo; with 27,313 units were proposed, according to Apartment
Data Services.
• Class B recorded 90.7 percent occupancy
at $1.14/sf/mo;
• Class C recorded 90.1 percent occupancy
at $0.93/sf/mo; and
• Class D recorded 88.3 percent occupancy
at $0.75/sf/mo.
SINGLE-FAMILY STARTS AND MULTI-FAMILY UNITS DELIVERED
Houston MSA
Single-family starts Multi-family units added
46,994 47,639 46,875
40,547 17,035 20,302 21,386 41,240
12,314 13,933 35,221
33,537
29,490 5,075
14,850
24,581 5,874 29,959 30,146
22,578 28,233 27,307
27,337
5,728 25,489
3,725 23,616
18,687 18,853 18,853
’09 ’10 ’11 ’12 ’13 ’14 ’15 ’16 ’17 ’18
Source: Metrostudy and Apartment Data Services
14 Houston Facts | 2019H E A LT H C A R E A N D Texas Medical Center
S O C I A L A S S I S TA N C E Houston’s Texas Medical Center is the world’s largest
medical complex by multiple measures: number of
hospitals, number of physicians, square footage and
Employment patient volume. The Texas Medical Center’s 61 member
institutions are consistently recognized by U.S. News
Health care and social assistance employed an average
and World Report as some of the best hospitals and
of 366,582 people in the year ending in Q3/18, almost
universities in the nation.
one in eight Houston workers, according to the Texas
Workforce Commission. Ambulatory health care Some prominent members include:
accounts for 43.6 percent of the sector employment,
hospitals for 32.5 percent and social assistance, nursing Baylor College of Medicine, CHI St. Luke’s Health, Harris
and residential care for 23.9 percent. The average Health System, Houston Methodist Hospital, Memorial
annual wage for the industry was $54,337 in the year Hermann, Michael E. DeBakey Veterans Affairs Medical
ending in Q3/18. Center, Rice University, Texas A&M University Health
Science Center, Texas Children’s Hospital, Texas Heart
According to the Texas Medical Board, 18,529 Institute, The University of Texas Health Science Center,
physicians are licensed in the Houston region, The University of Texas MD Anderson Cancer Center,
80.0 percent of which are in Harris County. The UTMB Health and the University of Houston.
concentration of anesthesiologists, nurse anesthetists,
cardiovascular technologists and technicians, The Texas Medical Center is developing five institutes to
respiratory therapy technicians, and occupational health foster collaboration across all member institutions:
and safety specialists/technicians is well above the
• Clinical Research: To be the world leader in clinical
national average.
research by more efficiently translating discoveries
into breakthrough therapies and cures.
Establishments
• Genomics: To create the world’s premier clinical
Houston’s 19,954 health care and social assistance genomics program.
establishments included 13,085 ambulatory health care
providers, 6,003 social assistance establishments, 683 • Health Policy: To develop effective policy solutions
nursing and residential care facilities and 184 hospitals to improve the health of diverse populations in
for the year ending in Q3/18. Houston and Texas and will serve as models for
the world.
Top Employers • Innovation: To become the global leader in health
and life sciences innovation. The TMC Innovation
CHI St. Luke’s, HCA, Harris Health System, Houston Institute houses TMCx, an accelerator that advances
Methodist, MD Anderson Cancer Center, Memorial the development of health and medical technology
Hermann Healthcare System, Michael E. DeBakey companies, and TMCx+, an incubator for health
Veterans Affairs Medical Center, Texas Children’s startups.
Hospital and UTMB Health.
• Regenerative Medicine: To lead the world in
discovering, developing and delivering curative
regenerative therapies.
TMC BY THE NUMBERS
In April ’18, TMC announced the creation of TMC3, a
$3 Billion in 50 Million multi-institutional 30-acre research campus that brings
construction projects developed together the best institutions in clinical care, research
underway square feet
and industry. The campus is projected to be complete in
’22, create nearly 30,000 jobs and bring $5.2 billion to
10 Million 750,000 ER Texas’ economy.
patient visits visits per year
per year
180,000 + 13,600 + 106,000 +
Surgeries total heart Employees
surgeries
8th largest
business district in U.S. with 1,345
total acres and $25 billion in GDP
Greater Houston Partnership 15M A N U FA C T U R I N G
The 6,388 manufacturing establishments in the Houston
region employed 224,708, or about 1 in 13 Houston-
area workers in ’18, according to the Texas Workforce
Commission. Average annual wage was $89,352. The
value of goods manufactured in metro Houston topped
$82.6 billion in ’17 and accounted for 16.9 percent
of the region’s total GDP, according to the Bureau of
Economic Analysis.
MANUFAC TURING OVERVIEW
Houston MSA, 2018*
Manufacturing Industry Employment Establishments
Fabricated Metal
51,085 1,729
Products
Machinery 43,590 806
Chemical 38,900 570
Computer and Electronic
13,344 318
Products
Food 11,881 420
Petroleum and Coal
10,027 90
Products
Plastics and Rubber
9,988 220
Products
Nonmetallic Mineral
6,579 277
Products
Electrical Equipment and BASE CHEMICAL PRODUC TION CAPACIT Y
5,910 156 Houston MSA, 2019
Appliances
Transportation Equipment 5,059 136 Million Metric % of U.S.
Other Manufacturing 28,345 1,666 Tons per year Total
Total Manufacturing 224,708 6,388 Butadiene 1.2 48.7
* Four quarters ending Q3/18 Ethylene 17.2 48.1
Source: Texas Workforce Commission, Quarterly Census of
Employment and Wages
Propylene 14.8 47.0
Chemicals Benzene 3.3 39.1
The Houston region was home to 570 chemical plants Xylenes 4.0 33.2
employing 38,900, or 17.3 percent of Greater Houston’s
total manufacturing workforce in ’18, according to the Toluene 1.9 33.3
Texas Workforce Commission. The region has 44.2
Total 42.5 44.2
percent of the nation’s overall base petrochemicals
manufacturing capacity which includes 48.7 percent
Note: Sums may not total due to rounding.
of butadiene produced in the country, 48.1 percent Source: IHS Markit
of ethylene, 47.0 percent of propylene, 39.1 percent
of benzene, 33.2 percent of xylenes and 33.3
percent of toluene. The Houston MSA also dominates U.S. production
of three major resins, producing 47.8 percent of the
Base petrochemicals are the raw materials for producing country’s capacity of polypropylene, 44.2 percent of
some of the more important plastics and resins. polyethylene and 34.1 percent of polyvinyl chloride.
16 Houston Facts | 2019Petroleum Refining PROFESSIONAL AND
The Spaghetti Bowl is a complex of several thousand T EC H N I C A L S E R V I C E S
miles of product pipeline connecting hundreds of
chemical plants, refineries, salt domes and fractionation
plants along the Texas Gulf Coast. It gives the Houston Employment
area an economic advantage through convenient and
Metro Houston employed 214,797 professional, scientific
low-cost transfer of feedstocks, fuel and chemical
and technical service workers in the four quarters
products among plants, storage terminals and
ending Q3/18. Architectural and engineering services,
transportation facilities.
with 66,696 workers, represents nearly a third of the
In ’18, the Houston metro had a crude operating sector’s total employees. The second and third largest
capacity of 2.6 million barrels of refined petroleum industry subsectors include management and technical
products per calendar day, representing 13.8 percent consulting (37,324 employees) and computer systems
of overall U.S. capacity, according to the U.S. Energy design services (28,839 employees).
Information Administration. Oil refiners in the region
Houston has one of the highest concentrations of
employed 9,204 in ’18, equivalent to 4.1 percent of the
engineering talent in the nation. For every 100,000
Houston region’s total manufacturing workforce.
workers in the Houston MSA, there are 1,873 engineers.
In comparison, for every 100,000 workers in the U.S.,
there are 1,163 engineers.
Establishments
PETROLEUM REFINING CAPACIT Y
Metro Houston, 2018 The Houston MSA had 21,764 establishments in
professional, scientific and technical services in the
Barrels Per four quarters ending Q3/18. The sector includes 5,219
Company City
Calendar Day management and technical consulting establishments,
3,922 computer systems design companies and 3,806
Galveston
Marathon Petroleum Co 571,000 establishments that provide legal services. Forty of the
Bay
nation’s top engineering and design firms are located in
ExxonMobil Refining & metro Houston, according to Engineering News-Record.
560,500 Baytown
Supply Co
Deer Park Refining 275,000 Deer Park
Houston Refining 263,776 Houston
Phillips 66 Company 256,000 Sweeny
Valero Refining Co Texas 225,000 Texas City
Valero Refining Co Texas 199,000 Houston
Pasadena Refining
112,229 Pasadena
Systems
Kinder Morgan Crude &
84,000 Galena Park
Condensate
Petromax Refining Co 25,000 Houston
Total Metro Houston
2,571,505
Capacity
Percent of U.S. Capacity 13.8
Source: U.S. Energy Information Agency, Refinery Capacity Report January 1,
2018 (Release Date: June 25, 2018)
Greater Houston Partnership 17ENGINEERS
Houston MSA vs. U.S., 2018
Per Per
Engineering Engineers 100,000 100,000
Concentration in Houston Workers Workers
Houston U.S.
Aerospace 2,410 80.7 44.2
Biomedical 230 7.6 13.1
Chemical 4,400 147.5 22.1
Civil 9,420 315.8 211.4
Computer Hardware 590 19.8 42.0
Electrical 4,030 135.0 128.9
Electronics 2,680 89.7 92.7
Environmental 1,210 40.7 36.7
Health and Safety 1,360 45.6 18.1
Industrial 4,920 164.8 193.2
Marine Engineers and
540 18.0 7.8
Naval Architects
Materials 920 31.0 18.6
Mechanical 8,130 272.4 209.7
Mining and Geological 150 5.0 4.0 WHOLESALE AND
Petroleum 11,260 377.6 22.5 R E TA I L T R A D E
All Other Engineers 3,620 121.4 98.1
Employment
Total Engineers 55,870 1,873 1,163
Wholesale trade employed 157,315 in the Houston MSA,
Source: U.S. Bureau of Labor Statistics, Occupational Employment including 97,570 in durable goods, 47,340 in nondurable
Statistics, May 2018
goods and 12,403 in electronic markets in ’18. Retail
trade employed 303,753, including 66,274 in food and
beverage, 58,492 in general merchandise and 41,598 in
Finance motor vehicle and part dealers. Average annual wage in
’18 was $85,591 for wholesale workers and $33,187 for
Metro Houston’s 97 Federal Deposit Insurance
retail workers.
Corporation (FDIC)-insured institutions had 1,420 offices
and branches with $245.7 billion in local deposits, Establishments
according to June ’18 FDIC data. Houston ranked 12th
among U.S. metros in total deposits in ’18. Metro Houston contained 10,931 wholesale trade
establishments, including 6,514 durable goods
Houston’s 10 largest banks (ranked by local deposits) wholesalers and 2,458 nondurable goods wholesalers
include JPMorgan Chase Bank, Wells Fargo Bank, in ’18. There were 17,968 retail establishments, including
Bank of America, BBVA Compass Bank, Zions Bank, 2,575 food and beverage stores, 2,434 gas stations and
Prosperity Bank, Capital One, Frost Bank, Cadence Bank 2,316 clothing stores.
and Woodforest National Bank.
Top Employers
Five of the nation’s 10 largest FDIC-insured banks,
as measured by domestic deposits, operate full- Academy Sports & Outdoors, CVS Health, FedEx,
service branches or commercial loan offices in the Fiesta Mart, H-E-B, Home Depot, Kroger, Lewis Food
Houston region. These five include the three largest Town, Lowe’s, Macy’s, Sam’s Club, Sysco, Target,
banks in the nation. Walmart and Walgreens.
18 Houston Facts | 2019GROSS RETAIL SALES
Metro Houston, 2017-2018 ($ Millions)
% Change
Geography ’17 ’18
from ’17
Houston MSA Houston MSA 117,072.3 127,594.2 9.0%
Austin County 292.5 319.9 9.4%
Brazoria County 4,361.8 4,826.0 10.6%
Chambers County 374.8 437.0 16.6%
Fort Bend County 7,960.6 9,087.3 14.2%
Galveston County 4,074.3 4,331.7 6.3%
Harris County 90,852.3 98,720.7 8.7%
Liberty County 861.6 881.1 2.3%
Montgomery County 7,674.8 8,371.0 9.1%
Waller County 560.1 560.6 0.1%
Note: Data compiled from four quarters ending Q3.
Source: Texas Comptroller’s Office
EN ERGY operators have corporate or divisional headquarters
or ownership interests based in Houston. These
13 pipeline companies control 56,140 miles, or 33.4
Houston is the leading domestic and international center percent of all U.S. oil pipeline capacity. Fifteen of the
for virtually every segment of the energy industry— nation’s top 20 natural gas transmission companies
exploration and production, transmission, marketing, have corporate or divisional headquarters in Houston,
service, trading, supply, offshore drilling and technology. controlling 109,926 miles of U.S. pipeline, which is 56.8
percent of the total U.S. natural gas pipeline capacity.
More than 4,600 energy-related firms are located within
the Houston metro area, including over 650 exploration In ’17, the Houston MSA held 26.1 percent of the nation’s
and production firms, nearly 800 oilfield service jobs in oil and gas extraction (37,505 of 143,925), and
companies, more than 90 pipeline transportation firms, 11.7 percent of jobs in support activities for oil and gas
and hundreds of manufacturers and wholesalers of operations (26,614 of 227,703), according to the U.S.
energy-sector products. Bureau of Labor Statistics.
Houston is home to 44 of the nation’s 128 publicly Defining “Energy”
traded oil and gas exploration and production firms,
including 8 of the top 25; seven more among the top 25 Defining the “energy” sector and its related industries is
have subsidiaries, major divisions or other significant a challenging task. There are multiple approaches and
operations in Houston. the table which follows serves as one interpretation.
Given this definition, Houston’s energy sector in ’18
Two-thirds of the global-integrated oil companies (e.g., accounted for 8.3 percent of the region’s employment
ExxonMobil, Shell, Chevron) have operations here. More and 3.6 percent of its firms. The average job in an
than half of all oil field service firms based outside of energy-related industry paid approximately $142,077 per
North America (e.g., Weatherford, ENI, TechnipFMC) year, more than double the metro average of $66,378.
have offices in Houston, and around one-fifth of the
world’s national oil companies (e.g., Saudi Aramco, Top Energy Employers
PetroChina, Gazprom) have operations in Houston.
Anadarko Petroleum, Apaches, Baker Hughes (a GE
The 10 refineries in the Houston region process Company), BP, Chevron, ConocoPhillips, Enbridge,
nearly 2.6 million barrels of crude oil per calendar Enterprise Products, EOG Resources, ExxonMobil,
day—approximately 45.1 percent of the state’s total Halliburton, Hess, Key Energy Services, Kinder Morgan,
production and 13.8 percent of total U.S. capacity. Marathon, Nabors Industries, Nalco Champion, National
Oilwell Varco, NRG Energy, Occidental, Oceaneering,
The logistics for moving much of the nation’s petroleum Phillips 66, Schlumberger, Shell, Southwestern
and natural gas across the country are controlled from Energy, Superior Energy Services, TechnipFMC, Total,
Houston. Thirteen of the nation’s 20 largest oil pipeline Weatherford International and Wood.
Greater Houston Partnership 19ENERGY-REL ATED INDUSTRIES
Houston MSA, 2018*
Industry Employment Firms Avg. Annual Wage ($)
Engineering services 45,740 1,781 124,566
Chemical manufacturing 38,900 442 135,187
Oil and gas extraction 36,429 509 226,369
Oil and gas field machinery and equipment 27,879 245 116,064
Support activities for oil and gas operations 27,401 788 131,131
Oil and gas pipeline construction 21,628 201 92,144
Pipeline transportation 11,355 92 184,132
Drilling oil and gas wells 11,219 152 151,541
Petroleum refineries 9,204 40 163,839
Fabricated pipe and pipe fitting mfg. 5,433 90 67,847
Industrial valve manufacturing 3,688 67 88,114
Geophysical surveying and mapping services 3,393 147 136,344
Pump and compressor manufacturing 1,698 49 107,354
Total Energy-Related 243,967 4,601 142,077
Share of Metro Houston Total 8.3% 3.6%
Note: Due to the reach of the energy industry in Houston, portions of several other industries (e.g., utilities, accounting, real estate) could be added to this definition.
* Four quarters ending Q3/18
Source: Texas Workforce Commission, Quarterly Census of Employment and Wages
N A S A A N D A E R O S PA C E
As the home of NASA’s Johnson Space Center (JSC),
Houston is the epicenter of human space exploration.
Every manned U.S. space mission since 1961 has been
planned and executed from the Bayou City. Every
astronaut has lived and trained here, every manned
mission controlled here. The missions of tomorrow – to the
moon, to Mars and beyond – are being planned today by
scientists and engineers who call Houston home.
The thousands of NASA employees and civilian
contractors supporting JSC’s operations have created
a rich talent pool of aerospace expertise, positioning
Houston as a leader in the emerging commercial realm
of space flight.
JSC serves as NASA’s lead center for life sciences
research and application, astronaut selection and training
and mission control. JSC personnel direct industrial efforts
to design, develop, build and upgrade piloted space
craft and oversee many of the medical, scientific and
engineering experiments conducted in space.
JSC manages an annual budget of approximately $4.6
billion in contracts, grants, civil service payroll and
procurements. In ’18, NASA awarded $2.8 billion in
service contracts and grants to Houston and research
20 Houston Facts | 2019organizations in the Houston region. Space Center The largest recipient of funding in the last five years is the
Houston, the official visitor center of JSC, attracts over one residential solar company Sunnova, which received $1.3
million visitors and generates $73.0 million in economic billion. The software firm Onit received a $200 million
impact annually. venture capital investment in early ’19, the largest software
deal in Houston in recent years.
Houston is home to more than 250 companies involved
in aircraft or space vehicle manufacturing, research and Houston’s top recipients for venture funding in ’18 were
technology or other air transportation support activities. Of Sunnova Energy ($183 million), OncoResponse ($40
the 50 largest aerospace manufacturing companies in the million), Trisun Energy Services ($39 million), Arundo
U.S., 32 have a presence in the Houston region. Houston’s Analytics ($25 million), Procyrion ($16 million), QuVa
total trade in aircraft, spacecraft, and parts totaled $2.0 Pharma ($15 million), and NeoSensory ($12 million).
billion in ’18, and aircraft, spacecraft, and parts are
Houston’s 14th largest internationally traded commodity. Houston’s Startup Ecosystem
In ’15, the Federal Aviation Administration (FAA) Houston is home to more than 500 technology startups
designated Ellington Field as a spaceport, clearing the in the consumer and business service, health care,
way for commercial space flight in Houston. The Space data analytics, software development, biotech and
Commerce Conference and Expo (SPACECOM) annually clean energy sectors. A number of coworking spaces,
draws more than 2,000 attendees to Houston’s George R. incubators and accelerators have emerged to facilitate
Brown Convention Center. tech entrepreneurs in recent years. Station Houston,
which opened downtown in ’16, is one of a growing
number of coworking spaces providing affordable office
I N N O VAT I O N space, mentorship and a full range of support services
to early stage companies with high growth potential.
Other startup hubs and coworking spaces include The
As the home of NASA’s Johnson Space Center and Cannon in Spring Branch, The Headquarters in the
headquarters to the global energy industry, Houston has Second Ward, Level Office in Downtown, Techspace
long been a global hub of engineering talent. In recent Houston in Uptown, WeWork in downtown and west
years, those skills have given rise to a thriving ecosystem Houston, and Work Lodge in northwest Houston.
of digital technology companies. With more than 223,000
tech workers, Houston has the 12th largest tech sector University Programs
in the U.S., according to the Computing Technology
Industry Association. Nearly two-thirds of Houston’s The entrepreneurship programs at Rice University and
high-tech workers are employed in industries other than University of Houston are consistently ranked as two
computers and software. of the nation’s best, according to the Princeton Review.
Rice University’s entrepreneurship program at the
The region is home to over 8,200 tech-related firms, Jones Graduate School of Business supports student
including more than 500 tech startups. According to S&P innovation through the Rice Alliance for Technology
Capital IQ, Houston companies in clean energy, health and Entrepreneurship. The organization sponsors
innovation and digital technology have received $3.1 billion programs involving technology commercialization,
in venture capital and growth funding across 333 deals entrepreneurship education and the launch of student-
since ’14, averaging $576 million every year. In ’18, venture run technology companies. Rice’s Owlspark Accelerator
funding totaled $447.7 million, up 50.9 percent from ’17. has helped launch dozens of companies and the
HOUSTON INNOVATION FUNDING
Houston Metro, 2014-2018 ($ Millions)
% of
Industry ’14 ’15 ’16 ’17 ’18 Total
Total
Clean Energy 532.0 425.7 535.3 - 264.4 1,757.5 64.0
Digital tech 55.2 32.6 82.8 212.2 63.7 446.4 16.3
Health Innovation 172.6 122.2 42.4 84.4 119.6 541.3 19.7
Total 759.9 580.5 660.5 296.6 447.7 2,745.2 100.0
Note: Funding sources include venture capital, private equity and debt financing. Sums may not total due to rounding.
Source: S&P Capital IQ
Greater Houston Partnership 21You can also read