Page of 1 83 - Financial Crime News
←
→
Page content transcription
If your browser does not render page correctly, please read the page content below
Page 1 of 83

Contents

Introduction .......................................…........……….........................................................… 3
Opinion and Editorial .................................…........………...............................................…. 4
Highlights for Sub Saharan Africa .......…........……….......................................................… 5

Part 1 Criminal Markets in SSA………………..………..............………………………................. 8
1. Theft / Trafficking of Stolen Goods .......…………..……………….................................…………. 9
2. Illegal Logging .................................................………............…….................................………….10
3. Illegal Mining.....................................……………………………………………….....……………...11
4. Piracy of Goods ………......……………………………………………..............................................12
5. Modern Slavery ………...... ……………….….…………..……………….........................………….13
6. Drug Trafficking...………………………………………………………….…...........…………….......16
7. Illegal Fishing ...……….......……………….….…………..……………….........................………….18
8. Illegal Wildlife Trade .......................…………..………………..........................................…..……. 21
9. Smuggling and Other Crimes …………..........………….........................………...........……........ 24

Part 2 Regions & Countries in SSA……………………….……….................................……...... 29
1. Region & Country Highlights.................…………..........………....................…....................…..... 30
2. Country Risks Across Sub-Saharan Africa ....................…………………………….......……........ 31
3. Regional Report on Threats - FCN scores ..................................................................................... 32
4. Third Country Risks Outside of Sub Saharan Africa .............…...………….......……........…...... 33
5. Regional Report on Resilience & Responses .......…….........……………….......……........…...... 44
6. Regional Report on Resilience & Responses - FCN scores ........................................................ 46
7. Country Reports .............................................……………………………..............……........…...... 48

Part 3 Money Laundering Methods …................................................................................ 50
1. Cash Based Money Laundering .................................................................................................... 51
2. Trade & Trade Based Money Laundering ..................................................................................... 56
3. Virtual Currency Money Laundering ............................................................................................. 59
4. Securities Based Money Laundering ............................................................................................ 61
5. Transaction Based Money Laundering ......................................................................................... 62

Part 4 Criminal Groups …………….....……………….............................................................. 64
1. Organised Crime ............................................................................................................................. 65
2. Corrupt Officials ............................................................................................................................... 67
3. Fraudsters ..................................…………….............................……………….......…….......…...... 72
4. Cybercriminals or Hackers ............................................................................................................. 73
5. Proliferators and Traffickers ............................................................................................................ 75
6. Terrorist Groups …………………………………………….………………………………………... 77

Endnotes .........................……………...........................................................…..…………..... 80

 Page 2 of 83
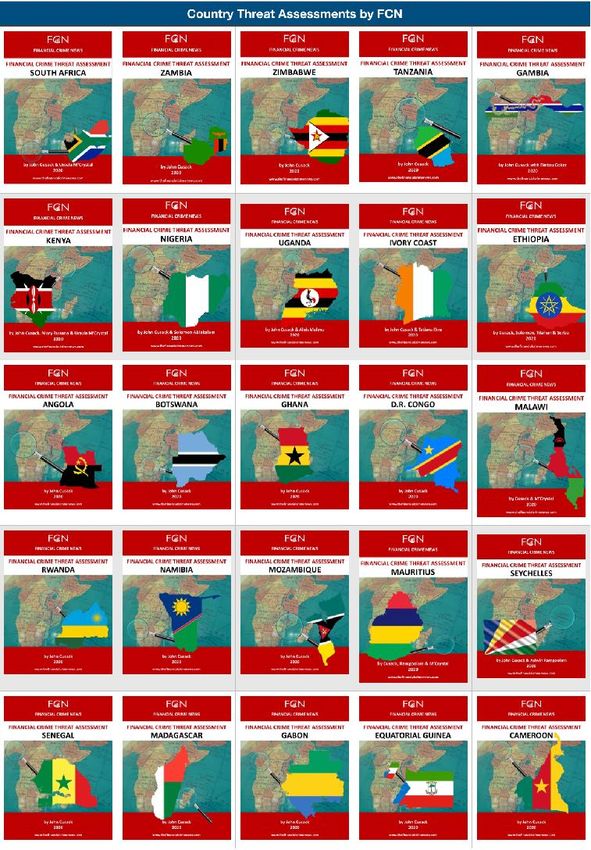
Is this reputation for high risk justified and
 Introduction
 does it apply everywhere, and to every
This report covers 40 countries1 in Sub- country across the region? Should it, more
Saharan Africa (SSA), representing US$1.62 appropriately, reflect the realities, of the
trillion in annual GDP or 1.88% of the worlds region’s more advanced markets, including
total. SSA has a population of around 1 billion developing and less developed ones? Yes, of
people, with UN predictions of between 1.5 course and that’s why this report is important.
and 2 billion by 2050. More than 40% of the
 In order to understand the risks across the
population in SSA countries are under 15
 region, it is necessary to look more closely, to
years old, are members of over 3,000 ethnic
 assess and analyse the available information,
groups, and speak more than 2,100 different
 and to evaluate any findings. This has been
languages. SSA is home to some one quarter
 done by looking in depth more closely across
of the world’s 4,700 mammal species, more
 40 countries. Reports are available for
than 2,000 species of birds – one fifth of the
 countries covering Angola, Botswana, DRC,
world’s total – and at least 2,000 species of
 the Gambia, Ghana, Ethiopia, the Ivory Coast,
fish, alongside 950 amphibian species. The
 Kenya, Malawi, Mauritius, Mozambique,
African mainland sustains between 40,000
 Namibia, Nigeria, Rwanda, Senegal,
and 60,000 plant species and about 100,000
 Seychelles, South Africa, Tanzania, Uganda,
known species of insects, spiders and other
 Zambia & Zimbabwe2.
arachnids. Eight of the world’s 34 biodiversity
hotspots are in SSA. With estimates established both top down
 and bottom up, we can begin to place
SSA, for the purposes of this study, excludes
 financial crime and money laundering risks in
North Africa, and excludes those African c
 perspective, at the region, and country level
that are part of the Arab world, and the Arab
 and to compare and contrast SSA countries
League, and excludes those in the Horn of
 with each other and with other regions
Africa.
 around the world. We can also better
The region has, though a reputation as being understand and be in a better position to
high risk, particularly when it comes to communicate the real risks that persist and to
financial crime and money laundering, and as focusing our attention on actions that can be
a result, access to capital remains more taken that are commensurate with these risks.
challenging and more expensive than
 It turns out SSA is risky, but not as risky as you
elsewhere, the region remains significantly
 probably imagine, and not as risky as most
under banked, remittances from and to the
 everywhere else. It also turns out that some
region are subjected to higher fees, and
 places are more risky than others, and to find
many local banks have faced real challenges
 out where and by how much, read this Sub-
when it comes to dealing with, and being
 Saharan Africa Threat Assessment.
supported by the international financial
system.

 Page 3 of 83
the worlds treasures, targeted for exploitation
 Opinion and Editorial
 by corrupt elites, and criminal gangs, based
Sub-Saharan Africa (SSA) is many things to in the region and overseas. Which criminal
many people, but is most important to the markets generate the most, in value, in which
billion people that call it home. The countries and for whose benefit are questions
perception from overseas is of a continent, posed and answered in this SSA Threat
trying to catch up with much of the world, Assessment.
whilst to its residents, it is a continent being
 Whilst this SSA Threat Assessment should
held back. The prevalence of crime in so
 cause concern, and allow for self reflection
many forms, continues to shape the region
 from those committed to combatting these
and to cast a shadow over its future.
 activities and determine if proposed actions
With over a billion people, representing over are sufficient, it also puts the threat from SSA
15% of the globe, SSA represents nearly 2% criminal activity into a broader context, and
of global GDP. The expansion of trade, both challenges, conventional wisdom that the
in the region & internationally has been the region is by default, “high risk.”
main driver for development & with it
 Purely in financial terms, the amounts
increasing living standards. It has also been
 generated are dwarfed by those from other
accompanied by significant levels of illicit
 regions of the world. In terms of harms, these
trade. Illicit trade from smuggling, piracy of
 are mostly inflicted in the region and the
goods, drug trafficking, and tax evasion, to
 impact elsewhere is more limited. Whilst
the illegal sale or possession of goods,
 responses are considered less mature, have
humans, wildlife, fisheries, minerals and
 significant weaknesses and are often not yet
timber, is a major domestic threat, illici trade
 effective, the same can be said of many other
crowds out legitimate economic activity,
 regions, if the relative threats are considered
depriving governments of revenues for
 in this calculation, SSA is in no worse a
investment in vital public services, dislocating
 position than many other regions.
millions of legitimate jobs, and causing
irreversible damage to ecosystems and The experience from everyday people, from
human lives. These illicit activities have been the studies and the research that has been
comprehensively documented for the first conducted, across the region, presents a
time in this Threat Assessment by Financial more complex picture, which underscores the
Crime News (FCN).. need to differentiate between countries and
 regions when considering any conclusions.
Headline estimates from the SSA Threat
 There are countries making progress, and
Assessment suggest an annual criminal
 there are conflicts that will continue. There
market value of about US$60 billion, (not
 are new leaders determined to make a
including fraud, corruption or tax evasion),
 difference and there are established leaders
targeting the natural riches of SSA, its people,
 looking to avoid change. I hope this research
its wildlife, its coastal waters and its minerals,
 will help the former and challenge the latter.
which make up an oversized contribution to

 Page 4 of 83
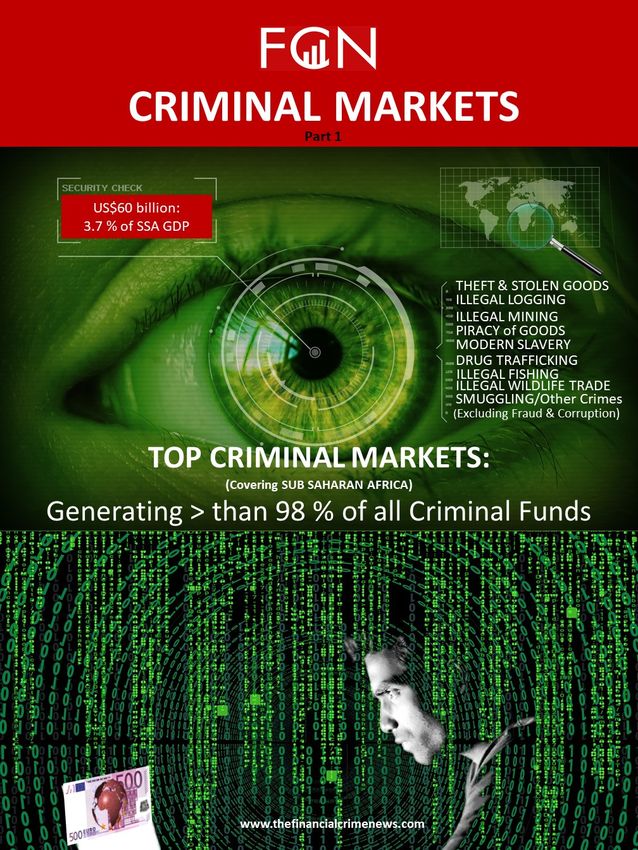
The most prevalent serious crimes, in terms
 Highlights for Sub-Saharan Africa
 of the numbers of countries that are seriously
This “Global Threat Assessment for Sub- impacted are corruption followed by illegal
Saharan Africa,” estimates criminal markets mining, illegal logging & from the illegal
generate (for 2018) up to US$60 billion3 in wildlife trade. Whilst the countries with the
criminal proceeds, which is approx 3.7% of highest financial crime threats, according
SSA GDP, (1% of FCN’s 2018 estimated FCN’s Country Risk Assessment Index, are
global proceeds of crime4 - or 1.9% DRC, Burundi, CAR, Kenya & Cameroon, in
excluding fraud), which estimated global absolute terms the largest economies in the
proceeds up to 6.7% of global 2018 GDP. region will nevertheless generate the most
 criminal proceeds.
Estimating proceeds, is very challenging as
it’s very hard to measure what is hidden. Data Cash based ML is the most significant ML
on criminal activity is made purposely difficult method with up to US$46 billion available
to trace. Nevertheless, it is possible to get a for laundering, through the formal banking
sense of the size and shape of these sectors, the mobile money sectors and the
amounts, despite obvious limitations. Whilst informal financial sectors targeted. As cash
any and all estimates provided must be read economies remain prevalent and borders are
with this firmly in mind, it has been possible long and porous, laundering may be carried
to come up with a reasonable basis for out also in many cases through cash
estimates, using extensive and the best smuggling and physical transfers. Trade is
available open source research, including also very vulnerable to money laundering
from international agencies, governments, (TBML), through trade mis invoicing as well as
non-governmental bodies, law enforcement, being the conduit for transit of illicit goods.
and other experts
 The largest beneficiaries from increasing illicit
The largest criminal markets generating funds are organised crime gangs, estimated
approx 50% of all criminal funds, are at US$27 billion.
environmental or “green” crimes at US$28
 Bribery and corruption is not per se a
billion, theft, of oil, cargo, vehicles and
 criminal market but facilitates and protects
electricity is estimated at US$15 billion
 criminal activity and is estimated at US$79 -
counterfeit goods estimated at US$9 billion,
 US$92 billion or 4.9% - 5.7% of SSA GDP,
with fake drugs valued at US$6.3 billion a
 with higher levels expected in countries with
year. Modern slavery valued at US$8.3
 higher levels of corruption.
billion, generated via an estimated 7 million
victims. Illicit funds leaving SSA are estimated at
 approx US$27.6 billion5 year, which can be
The illegal drugs market that generates US$3
 compared with FDI fl ows in 2018 of US$32
billion from the worlds second largest
 billion6, foreign aid in 2016 of US$42.5
regional market, from 32 million users.
 billion7 and foreign remittance flows in 2018
 of $46 billion8 to SSA

 Page 5 of 83
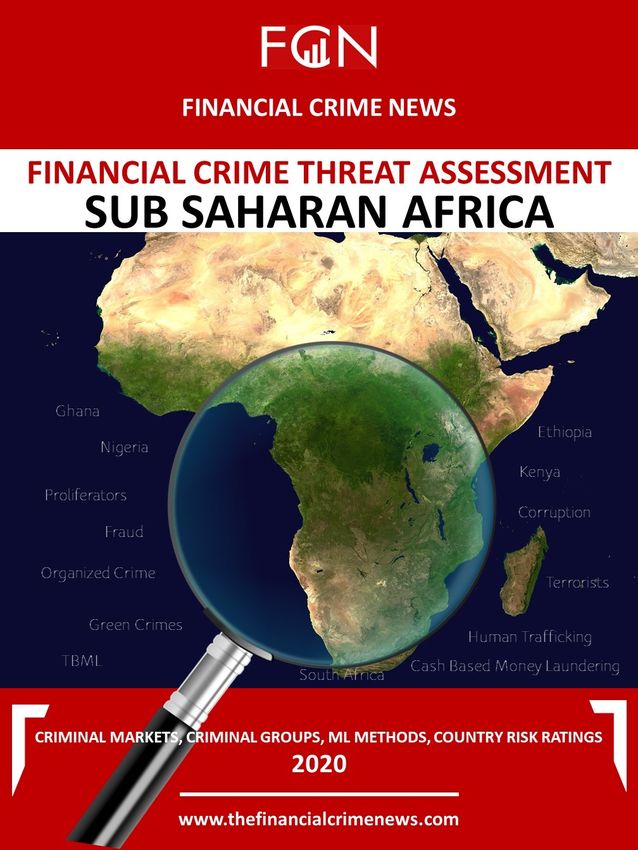
SUB SAHARAN AFRICA - OVERVIEW OF FINANCIAL CRIME RISKS

 Drug Trafficking- US$3 billion
 Human Trafficking - US$8.3 billion Africa is a destination for drugs en route to the EU and North America, (Cocaine from South America to W Africa, and Heroin from Green Crimes - US$28 billion
 An estimated 7 million men, women, Afghanistan/Pakistan/SE Asia to E & S Africa), but also a destination for drug usage: In E Africa mostly Heroin into Mauritius, See below for details
 and children living in modern slavery - Tanzania, Kenya & Uganda, in C Africa Cannabis in DRC and Synthetics in CAR. In S Africa, Eswatini and Malawi - Cannabis, in
 US$5.7 billion from sexual exploitation Seychelles Heroin; in South Africa - Heroin and Synthetics. In W Africa in Nigeria - Cannabis & Synthetics, Ghana - Synthetics and
 and US$2.4 billion from forced labour, Cannabis, Guinea - Cocaine, Sierra Leone - Cannabis, Benin - Synthetics, Burkina Faso - Synthetics, Togo - Cannabis, Liberia -
 with Burundi & the CAR, the countries Cannabis, The Gambia - Cocaine & Cannabis, Ivory Coast - Cannabis & Synthetics, & Cape Verde - Cocaine.
 with the highest prevalence of modern
 slavery, DRC and Nigeria

 Illegal Fishing - US$2.5 billion
 1 in 4 fish caught illegally, mostly W Africa,
 with vulnerable fishing off S Africa, Sierra
 Goods Piracy: US$9 billion (3.3% GDP) / Counterfeit Drugs - US$6.5 billion Leone, Nigeria, Liberia, Seychelles, Gabon,
 Guinea, Mauritius, Senegal, Tanzania &
 Togo

 Estimated by FCN at up to US$60 billion in Criminal Proceeds - 3.7% of SSA GDP / 1-1.9% Global
 Organised Crime: US$27 billion
 OC’s with embedded links to the State, Crime Proceeds & up to US$46 billion available for Laundering & US$79 - US$92 billion or 4.9% -
 topped OC types in SSA, with Countries most
 affected being; Angola, Zimbabwe, Nigeria,

 Illegal Logging - US$12.5 billion
 Country Risk Ratings by FCN Equatorial Guinea, CAR DRC, & Gabon
 for 40 Sub Saharan African Countries in Central Africa, Mozambique, South
 Sudan, Madagascar & Zambia, Ivory
 Coast, Cameroon, Angola, Benin, the
 Gambia, Liberia, Nigeria, Senegal, Uganda &
 Tanzania
 Arms Trafficking - US$14.4 - 28.8
 million
 mainly from DRC, Nigeria, South Sudan
 and South Africa, Burundi, CAR, Ivory
 Coast and Kenya

 Wildlife Trafficking - US$2 billion
 Elephants, Rhino’s Pangolin’s, Apes,
 Sub Saharan Africa -
 Chimpanzees, Birds and Reptiles, with the
 2017 Illicit Financial threat to wildlife high in South Africa,
 Outflows: US$27.6 Foreign Aid of Mozambique, Zimbabwe & Togo, but also in
 Tanzania, Congo, Gabon, & in South Sudan,
 billion - US$42.5 billion
 Uganda, Kenya, Ivory Coast, Senegal and Sierra
 in 2016 Leone and Zambia, DRC, CAR, Madagascar.
 Main transit countries Kenya & Nigeria.
 Foreign
 Remittance flows
 Proliferation of US$46 billion
 The largest proliferation threat is South
 in 2018
 Africa, as a Tier 1 Threat by PP index -
2019 / SSA Countries with lesser threats but Risk Ratings
 very weak controls and response are Foreign Direct
 2020
 Liberia, Madagascar & Uganda. Investment of Illegal Mining - US$10 billion
 US$32 billion Nigeria, CAR, DRC, Angola, S Africa, S Sudan,
 Zimbabwe, Ivory Coast, Madagascar,
 in 2018
 Cameroon, Burkina Faso, Liberia & Sierra Leone

 Third Countries presenting increased financial crime risks to SSA
 Countries on the rise / bouncing back
 Countries on the slide Angola, The Gambia, Ivory Coast,
 South Sudan, DRC, Mozambique Tanzania, South Africa, Nigeria,
 (Governance, Freedom & Corruption) Ethiopia, Zimbabwe & Rwanda
 (Governance, Freedom & Corruption)

 IUU
 Fishing

 Logging
 Arms
 Wildlife
 Smuggling
 Mining
 Tax Evasion
 Cannabis

 Corruption
 Cocaine
 Theft / Stolen
 Global Terrorism Goods Corruption
 Heroin
 Index - 2018 TI - CPI - 2020

 Sub Saharan Africa - Facts & Figures

 Over 1 billion people in Petroleum Products are Gold, mainly from South 90% of Africa’s imports and Major crop exports are China is SSA’s No1 SSA tax take or
 40 plus Countries the main export from Africa, Ghana, Tanzania exports of goods are cotton (Togo & Benin), trading partner (imports collection rate is on
 representing over 15% SSA at US$91 billion, & Burkina Faso is delivered by sea, (4% of the coffee (Ethiopia, and exports combined at average 16.2%
 of the worlds mainly from West exported worth US$15 worlds containers) using, Uganda & Madagascar, 15%) followed by India versus an OECD
 population but African Countries & billion, & Diamonds from Africa’s hundred plus ports, Rwanda & Burundi), (9%) South Africa (6%), US average of 34.3%
 representing nearly 2% Natural Gas (US$7.6 Namibia, DRC, CAR with the biggest in Durban in cocoa (Ivory Coast & (5%). DE (4), UK (3%), UAE
 of Global GDP at under billion) & Coal (US$6.2 valued at US$8 billion. South Africa, followed by Ghana), tea, (Kenya), (2%)
 billion). Other important metals Abidjan in Ivory Coast, grains (S Sudan), timber
 for export are Platinum Mombasa in Kenya & Lagos in (Senegal & Equatorial
 (Zimbabwe), Aluminium Nigeria. Largest Airport's are Guinea), Rubber Page 6 of 83
 (Mozambique) Copper in South Africa, Kenya & (Liberia), tobacco
 (Zambia) Nigeria. (Malawi), Peanuts
 (Gambia)
Page 7 of 83
• Piracy of goods is estimated at US$9
 Part 1 - Criminal Markets in SSA
 billion. The counterfeit drugs market is the
The major criminal markets in SSA generally largest piracy market in the region,
exploit the resources found in the region, estimated to be valued at US$6.3 billion.
including people, goods and the
 • Drugs trafficking is valued at US$3 billion.
environment. and are estimated to generate
 Africa is a destination for drugs en route to
at least US$60 billion, or approximately 3.7%
 other regions, (cocaine from South America
of SSA GDP, as follows:
 to West Africa, and heroin from South and
 East Asia to East & Southern Africa), and
• Theft of goods of al least US$15 billion,
 made up of oil theft, US$10 billion (with also increasingly, a destination for drug use

 Nigeria losing at least US$2.5 billion), in the region itself.

 cargo theft at US$3 billion, These criminal markets
 electricity theft at US$1.4 generate more than 95%
 Total Criminal Proceeds in Sub
 billion. Saharan Africa in US$ Billions FCN of all criminal funds in the
 2020
 region. As for the rest,
• Environmental or “green”
 crimes at US$28 billion, smuggling, including
 Mining
 including estimates from 10
 Fishing cigarettes, but also gold
 2.5
 Wildlife

 illegal logging (US$12.5 2 Goods Piracy and precious stones.
 9

 billion), illegal mining marine piracy, kidnap &
 Logging

 (US$10 billion), illegal
 12.5 ransom, arms trafficking &
 Modern Slavery

 fishing (US$2.5 billion),
 8.3
 counterfeit currency
 Drugs
 illegal wildlife (US$2 3 generate an estimated
 Theft

 billion) and illegal waste
 15
 US$500 million..

 dumping (US$200 Whilst fraud & corruption
 million). are not included in these
 figures, they are a significant generators of
• Modern slavery at US$8.3 billion. An
 estimated 7 million men, women, & funds. Fraud types include asset

 children are living in modern slavery in SSA, misappropriation, fraud by the customer,

 generating an estimated US$8.3 billion, procurement fraud, business misconduct and

 with approx US$5.7 billion from sexual cybercrime, although there are no credible

 exploitation and approximately US$2.4 estimates that exist across the region. Bribery

 billion from forced labour, with Burundi & Corruption is not per se a criminal market

 and the CAR, are the countries with the but facilitates and protects criminal activity

 highest prevalence of modern slavery, and is estimated at US$79 - US$92 billion,

 however, Nigeria and the DRC with the or 4.9% - 5.7% of SSA GDP, with higher levels

 highest absolute numbers and accounted expected in countries with higher levels of

 for 34% of all victims in the region. corruption. For more details see Part 4 below.

 Page 8 of 83
for cargo theft at 30%, with Kenya (8%) and
 1.1 Theft of Stolen Goods
 Nigeria (4%). Across the Middle East & Africa
SSA crime surveys9 suggest very different the average cargo theft was valued at
overall crime rates across the region, with the US$42,000, with cargo theft from trucks the
highest levels reported for South Africa, most popular (71%), followed by theft from
followed by Namibia, Angola, Nigeria and facilities (22%). Goods stolen were mainly;
Kenya. food and beverage (34%), alcohol and
 tobacco (10%), construction materials (9%),
Countries with high crime rates will suffer
 metals (8%) and electronics (7%).
from high levels of theft and trafficking of
stolen goods, with the largest markets, being Electricity Theft - South Africa is estimated
found relating to oil, metals and minerals, but to be losing approximately R20 billion13
also cargo, electricity and motor (US$1.4 billion) a year due to electricity
vehicles. Increasingly as more theft. Liberia reported
 Selected Countries Crime Levels -
Africans get connected online, Survey - 2020 - (40-60 Moderate; electricity theft of
 60-80 High)
losses from data and identity approximately US$50
theft will grow. For metals and million14 in 2018. A 2016
 Ghana
 South Africa
minerals see Section 1.3 on Ethiopia
 49
 77 World Bank, Report15
 49
Illegal Mining. Namibia
 identified that only 19
 Botswana 67
 53 counties (out of 39) in SSA
 The economic loss from Zimbabwe Angola that collected enough
 57 65
oil theft on the continent is revenue to sustain
 Nigeria
 US$15 billion Tanzania
 59
 64
 operational costs, in part
 Uganda Kenya
 ADB & ANRC - 2016 59 62
 due to thefts. In a region,

Oil Theft - Nigeria lost where it is estimated that

approximately US$2.5 billion only 1 out of 3 people

to oil theft in the fi rst half of 2019, according have access to electricity, or 633 million are

to Nigerian government offi cials, with at least without electricity, combatting electricity theft

22.6 million barrels of oil “stolen” between should be a priority.

January and July 2018. It has been reported Vehicle Theft - According to Interpol, vehicle
by the African Development Bank and African thefts in Africa, but also traffi cked vehicles
Natural Resources Centre (2016) that the from overseas into Africa are a signifi cant
economic loss from oil theft in Africa is generator of criminal funds and a main stay
US$15 billion10. of organised crime.

Cargo Theft - Freight losses are estimated Based on the research carried out by FCN,
globally at over US$50 billion11 annually theft/trafficking of stolen goods is likely to
(2014), and SSA estimates (based on GDP generate at least US$15 billion a year.
share) can be estimated therefore at US$3
billion. BSI and TT Club in 201812, identified Est Proceeds (2018) US$15 billion
South Africa as the country in SSA most at risk

 Page 9 of 83
from illegal sources. In some tropical forest
 1.2. Illegal Logging
 countries illicit production reaches levels of
Forests are home to about 80% of the world’s 50-90%, for example Chatham House
terrestrial biodiversity and are under threat, believes that illegal logging is endemic in
with rates of deforestation at unsustainable Cameroon approximately (65%), Ghana
levels. A significant contributor is due to (70%), Republic of Congo (75%) and DRC
illegal logging carried out by criminal (90%). The largest 3 countries importing
enterprises fuelled and facilitated by logging from Ghana (India, China, US) are
corruption. from Cameroon, (China, Vietnam, US), from
 Ghana (China, India, US), from Republic of
In Africa, 90% of wood consumed is used for
 Congo (Vietnam, France, China) & from DRC
wood fuel or charcoal, which generated
 (Vietnam, US, China). Whilst illegal logging
US$6.1–24.5 billion in
 rates are some of the highest
201316, and 90% is Timber Exports from SSA - World
 Bank - 2018
 in SSA, the region exports only
produced in tropical areas,
 about 3% of the worlds total
where illegal logging is at its
 South Africa exports. Nevertheless, with
highest17 For East, Central 11% Sweden Germany

 Portugal
 11% 4%
 25% of SSA covered by forests
and West Africa, the net 3%
 UK
 12% the Congo basin, the second
profits from dealing and
 largest tropical rainforest in
taxing unregulated, illicit or China
 11% the world, the threat is not
illegal charcoal combined is Others
 40%
 India simply to conservation, but
estimated at a range of
 5%

 US
 also crime and security too.
US$2.4–9 billion18, 4%

including by terrorists such Whilst most of the timber
as Al Shabaab who makes felled in SSA is for domestic or
between US$38 and US$56 million a year. regional consumption, the export trade is
 very lucrative. According to the World Bank21,
According to the Organised Crime Index19,
 timber exports from SSA in 2018 were valued
(OCI) countries most affected by Illegal at US$7 billion, with the largest importers
logging are Equatorial Guinea, CAR, DRC, & being the UK (13%), China (12%), South
Gabon in Central Africa, Mozambique in Africa (12%), India (5.5%), Germany (4%), (US
Southern Africa & Madagascar & Zambia in 4%), Portugal & Sweden (2.75%). In
Eastern Africa. aggregate, the African Development Bank
 and African Natural Resources Centre in 2016
Of all the so called “green” crimes, illegal
 reported the value of illegal logging at
logging is likely to generate the most in illicit
 US$13 billion22 for Africa.
proceeds. It is estimated20 (by Chatham
House), that around 30% of the worlds timber
production (from 9 main tropical forest
producer countries) is illicit and that nearly Proceeds (2018) US$13 billion

10% of imports into consumer countries are

 Page 10 of 83
mining is an important source of proceeds for
 1.3 Illegal Mining
 criminal gangs.
The African continent generates 5% of total
 According to the OCI28, highest scores for
global mineral production, but is home to an
 illegal mining are for Nigeria, DRC and CAR
estimated 30% of the worlds mineral
 (all rated 9/10), followed by Angola (8.5/10),
reserves23. The abundance of natural
 South Africa, South Sudan and Zimbabwe
resources include many economically
 (8/10), Ivory Coast, Madagascar & Cameroon
important minerals as well as many precious
 (7.5/10), and Benin, Burkina Faso, Liberia &
metals and rare earth minerals24. For
 Sierra Leone (7/10).
example, Africa has 55% of the worlds
diamonds led by Botswana and DRC, 22% of According to reporting from the African
the worlds gold, which Institute for Security Studies29,
makes up 60% of mining by 10,000 kgs of gold in 2014
value in Africa, led by South was mined by artisanal
Africa. miners and smuggled out
 of South Africa, valued at
Although only 5% of world
 approximately US$470
production comes from
 million a year.
Africa, many SSA countries
are particularly reliant on According to a 2017 report
mining, which makes up by the Minerals Council
much of the value of their South Africa30, it estimates
national economies. For R7 billion (US$480 million)
example mining contributes in illegal commercial mining
 Higher Risk Countries
approximately 45% of government for illegal mining
 and illicit dealings in precious
revenues in Botswana, 26% in DRC, metals and diamonds annually in
23% in Guinea, 14% in Zambia, 11% in South Africa, whilst the cost to the
Liberia, 7% in Ghana, 6% in Mozambique, 4% South African economy of R21 billion
in Sierra Leone, 3% in Tanzania and 2% in (US$1.44 billion) has been estimated each
South Africa.25 year.31

The 3 largest producers26 in terms of value It has been reported by the African
from production in Africa for 2016 is South Development Bank and African Natural
Africa at US$40.4 billion, DRC at US$6.8 Resources Centre (2016) that the economic
billion and Ghana at US$5.9 billion. The total loss from illegal mining of minerals on the
value of production across the region is continent is US$15 billion32 for all of Africa.
approximately US$75 billion.27 Based on this estimate the figure for SSA
 could be at least US$10 billion.
With so much wealth underground and
dispersed, its not surprising that illegal Est Proceeds (2018) US$10 billion

 Page 11 of 83
bogus goods, accounting for 62% of seizures
 1.4 Piracy of Goods
 over 2011-1336.
Counterfeit goods can endanger lives –
 With SSA imports estimated at US$273 billion
vehicle parts that fail, pharmaceuticals that
 in 2018, and South Africa & Nigeria importing
make people sick, or fail to protect, toys that
 the most37, 3.3% of the regions imports
harm children, baby formula that provides no
 would amount to US$9 billion. Imports
nourishment and medical instruments that
 largely came from China (16.5%), but also
deliver false readings.
 India (5.7%), both leading exporters of fake
According to Interpol, in its Organised Crime goods, but also from the US (4.8%), Germany
Study of Africa (2019)33 counterfeit goods (4.7%) and from South Africa (7%). Consumer
was identified as one of the most significant goods make up the largest segment of
criminal markets, & one that is expected to imports at US$104 billion.
grow, both globally and in SSA, with
 A variety of products are affected by
organised criminal groups playing, “a central
 counterfeiting and piracy on the African
role in the trade of counterfeit and pirated
 continent, however, counterfeit
goods” and that they “generate important
 pharmaceuticals are the largest trafficked
revenues from such illicit markets.”
 products in most parts of Africa.
The OECD/EUIPO estimated in 2016 that
 According to the World Health Organisation
international trade in counterfeit and pirated
 (WHO), every year, around 100 000 Africans
products (in 2013) accounted for as much as
 die as a result of fake pharmaceuticals38.
2.5% of the value of all international trade, or
 These fake drugs account for up to 30% of
US$461 billion.34 This has since been
 the total market of pharmaceuticals on the
updated, based on data for 2016, which
 continent39.
estimates that in that year, the volume of
international trade in counterfeit and pirated With the SSA pharmaceuticals market
products could amount to as much as estimated by McKinsey at US$14 billion40,
US$509 billion.35 This represents up to 3.3% criminal proceeds are estimated at between
of world trade, and does not include US$4.2 - US$8.4 billion a year.
domestically produced and consumed
 Whilst fake drugs are probably the largest
counterfeit and pirated products, or pirated
 counterfeit goods market across the
digital products being distributed via the
 continent, there is a highly visible influx of
internet.
 other fake goods from designer clothing and
In many cases, the proceeds of counterfeit accessories, electronics and media, computer
trade go towards organised crime. Most fake software and more dangerously, fake or
goods originate in middle income or fraudulent foods, in addition to other
emerging countries, with China the top commodities such as tobacco.
producer, but also from India and Vietnam.
 Est Proceeds (2018) US9 billion
Postal parcels are the top method of shipping

 Page 12 of 83
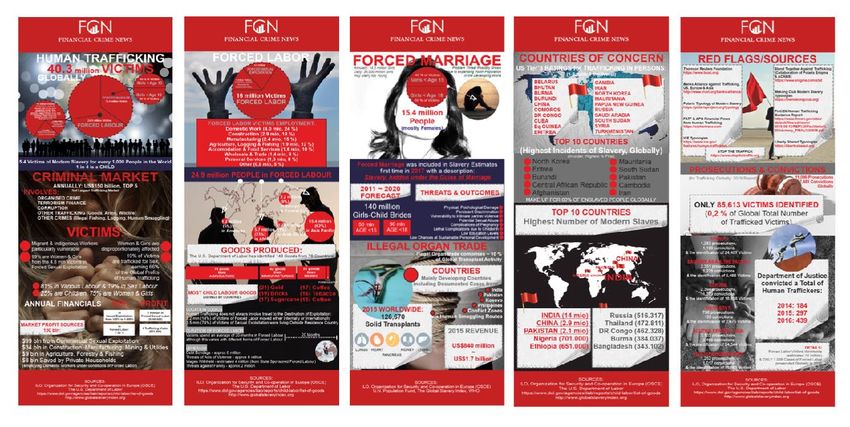
sponsored forced labour in a number of
 1.5 Modern Slavery .
 countries.
According to the Global Slavery Index41,
 1.3.1 Regional Assessment: In Central
there are estimated to be approximately 7 Africa, Burundi has 408,000 victims,
million, men, women and children living in amounting to 40 out of every thousand
conditions of modern slavery in SSA, with 2.5 people, being the highest ratio in all of SSA.
million in forced labour (400,000 in sexual In the CAR, 101,000 victims represent 22 out
exploitation) and 4.5 million in forced of every thousand, in DRC its 13.7 out of a
marriages. These estimates do not include 1,000, and in the Republic of Congo it is 8 out
child brides, child soldiers or of a 1,000.
 Modern Slavery in Sub
trafficking for the purposes of Saharan Africa - GSI 2018 In East Africa, the highest ratios
organ removal.
 are in South Sudan, which has
While nearly 70% of African 243,000 victims representing
countries have criminalised Sex Exploitation 20 out of every thousand
 Forced Marriage 6%
human trafficking, only 58% 64% people. Other large ratios exist
recognise forced labour as a in Rwanda at 11.5 out of a
criminal offence, and only 9 Forced Labour
 30%
 thousand, and in Uganda at
countries have criminalised the 7.6 out of a thousand people.
use of children by state and
 In Southern Africa, the highest
non-state armed groups.
 Modern Slavery in Sub Saharan incidence is in Eswatini at 8.8
 Africa - GSI 2018 - Numbers of
Only 7 countries (Benin, out of a thousand people.
 Victims in 1,000’s
Burkina Faso, DRC, Ghana,
 In West Africa, Guinea is the
Madagascar, Rwanda, and
 Kenya highest with 7.8 out of a
South Africa) have criminalised Tanzania 328 Burundi
 408
 thousand, followed by Nigeria
 336

forced marriage. State Ethiopia
 614 at 7.7 out of a thousand.
imposed forced labour
practices are most prevalent in Nigeria
 1,400
 In absolute numbers however,
Burundi, Madagascar,, DRC Nigeria is by far the largest
 1,000

Rwanda, and Eswatini. with an estimated 1.4 million
 victims, and the DRC with 1
There are a number of
 million, together accounting for
noticeable factors that help explain the
 over a third (20% and 14% respectively) of all
prevalence of modern slavery in SSA. The first
 victims in SSA. Other large victim
is the significant number of countries that
 populations are found in Ethiopia - 614,000,
have been affected by protracted conflicts or
 Burundi - 408,000, Tanzania - 336,000 &
civil wars, the second is the practice of forced
marriage, and the third the use of state Kenya - 328,000. In total these 6 Countries
 account for over 55% of the total in the
 region.
 Page 13 of 83
Countries identified by the US Trafficking in According to the ILO,44 there were 152
Persons Report 201942 as Tier 3 countries & million child labourers in 2016 (aged
seen as having increased threats and an between 5-17), of which 72 million were in
insufficient response were: Burundi, DRC, Africa, representing 19.6% of African
Equatorial Guinea, The Gambia and South children. Children aged 5 to 11 years form
Sudan. In the 2020 US TIP report Tier 3 the largest share of those in child labour and
countries were just Burundi and Lesotho. also form a substantial share of those in
 hazardous work. 48% of all those in child
Tier 2 Watchlist Countries are Cameroon,
 labour are in the 5–11 years age bracket, 28%
DRC, Eq Guinea, The Gambia, Guinea,
 are aged 12–14 years, & 25% are 15–17 years
Guinea Bissau, Nigeria, Senegal, Seychelles,
 old.
Tanzania, Uganda & Zambia. South Africa had
the lowest incidence at 2.8 Child labour in SSA,
per thousand people, with according to ILAB45, is
overall 155,000 victims. exploited and in some cases
According to the Africa children are forced to work in
Centre for Strategic for example, cotton in Benin,
Studies43, most African cotton and gold in Burkina
victims are trafficked into Faso, cocoa in Cameroon,
forced labor, often in fields diamonds in CAR, cobalt,
such as agriculture, domestic copper, diamonds, tungsten
service, and manufacturing. ore, tin ore, gold and
In West Africa 55% are Indices of Modern Slavery tantalum in DRC, cocoa and
 by GSI - 2018
trafficked for forced labour (FL) coffee in the Ivory Coast, cattle in
 Dark is highest incidence
and 40% for sexual exploitation Eswatini, Lesotho & Namibia, cattle,
(SE), in East Africa it’s 82% FL & gold and textiles in Ethiopia, cocoa,
18% SE & in Southern Africa 83% FL & 17% fish and gold in Ghana, cashews, cocoa,
SE. In West Africa 99% of victims detected are coffee, diamonds and gold in Guinea, coffee,
trafficked within their own country or region, fish, rice, sand, tea, sisal, sugarcane and
83% in North Africa, 90% in East Africa and tobacco in Kenya, sapphires, stones and
62% in Southern Africa. vanilla in Madagascar, tobacco in
 Mozambique, tea in Rwanda, gold in Senegal,
1.3.2 Global Comparisons: Nigeria is
 cocoa, coffee, diamonds, granite & palm oil in
globally 5th in terms of absolute numbers,
 Sierra Leone, cloves, coffee, gold, Nile perch,
behind India, China, Pakistan and North
 sisal, tanzanite, tea & tobacco in Tanzania,
Korea, with DRC at 8th behind, Iran and
 bricks, cattle, charcoal, coffee, fish, gold, rice,
Indonesia. In terms of prevalence of modern
 sands stones, sugarcane, tea, tobacco &
slavery, Burundi is 3rd behind North Korea
 vanilla in Uganda & cattle, cotton, gems,
and Eritrea with the CAR in 4th, and South
 stones & tobacco in Zambia.
Sudan in 7th.
 Page 14 of 83
1.3.2 Proceeds of Crime: In 201446 the ILO proceeds in SSA is US$8.3 billion47, with
estimated proceeds per year generated from approx US$5.7 billion from sexual
modern slavery, with profits of US$3,900 per exploitation, US$2.4 billion from forced
victim, with the highest profits generated labour (US$1.6 billion from non agriculture
from sexual exploitation (US$11,000), forced US$734 million from agriculture and US$222
labour, non agriculture (US$3,000), forced million from domestic servitude).
labour, agriculture (US$1,000) and from
domestic servitude (US$600). Based on these Est Proceeds (2018) US$8.3 billion

findings, the estimate for modern slavery

 Supplementary Material

 More on Human Trafficking by FCN

 For more See: Stop the For more See: stop the traffik For more See: the traffik
 Traffik at: https:// at: https:// analysis hub at: https://
 www.stopthetraffik.org thefinancialcrimenews.com www.traffikanalysis.org

 Page 15 of 83
via Pakistan heads to East and Southern
 1.6 Drug Trafficking
 Africa as a destination for African markets and
SSA is a transit destination with cocaine onwards into Europe and to a lesser extent
shipped into West Africa from South America North America. According to the ENACT
and heroin shipped into East and Southern project, the heroine trade is “best
Africa from Asia headed to markets in Europe understood as forming an integrated regional
and North America. It is also becoming a criminal economy based on the transit of
continent where, not only cannabis , which is heroin from Afghanistan to the West, and with
commonplace, is consumed, but where the a spin-off trade for local consumption. Along
production of synthetic drugs, made from this traffi cking route, much of the heroin is
imported precursor chemicals is on the rise. fi rst shipped to Africa on motorised, wooden
 seagoing dhows built in the
Drug trafficking affects many
 UAE designed for fi shing. The
countries, though different
 vessels are loaded with
illegal drugs are prevalent in
 between 100kg and 1,000kg
different regions and to a
 consignments of contraband
greater and lesser extent.
 off the Makran coast of
Countries with the largest
 southern Pakistan. The dhows
drugs markets are in Nigeria,
 anchor off the coast of Africa in
Tanzania, South Africa, Guinea,
 international waters, and
Uganda, Ghana, Sierra Leone,
 fl otillas of small boats collect
DRC, Benin & Mauritius. Higher Risk Countries the heroin and ferry it to various
 for Illegal Drugs
Enact Africa’s, Drug Demand and beaches, coves or islands, or
Use in Africa Report 201948 estimate offl oad it into small commercial
SSAs drug usage rate in 2018 at about 1.6%, harbours. Dozens of such sites are used for
but with a 5% increase projected / expected landing the consignments along the entire
up to 2050. As SSA’s population is set to eastern coastline – from north of Kismayo,
double by 2050, the number of drug users Somalia, to Angoche, Mozambique. This route
will increase by an estimated 150%, including is used all year round apart from during the
an additional 14 million Africans, on top of three-month monsoon period.” This dhow
the 14 million current drug users. Not only based supply line is also supplemented by
will the continent experience the most rapidly the use of containers at various deep-water
growing consumer market in the world, container ports along the coast. Several ports
certain regions, notably West and East Africa, have fallen under substantial criminal
are becoming more important to the infl uence and are used to transship a number
distribution of drugs around the world. of other illicit goods, such as elephant ivory
 and timber.
Heroin: In countries all along the eastern
seaboard of SSA, from Kenya to South Africa, With heroin drug usage increasing in SSA,
including Mauritius, Afghan heroin, transiting the rates of HIV among people who inject
 drugs are several times higher than among
 Page 16 of 83
the rest of the population, and there are high not least because, most of the trade transits
rates of hepatitis C in this group. Cities with the region, and is not consumed locally,
the biggest heroin consumer markets, like although this is changing. As SSA moves
Mombasa, Cape Town and the from its transit status to becoming an
Johannesburg–Pretoria metropolitan area, important destination for drug usage,
are also beset with violence associated with criminal proceeds will increase. For example,
the drug trade. the cocaine that transits West Africa for

Cannabis: Cannabis has been grown for Western Europe, generates an estimated
consumption and export across SSA for street value of US$2.1 billion, in European
decades, with the crop providing signifi cant cities, but this translates into only an
revenue to small-scale farmers, with little estimated 2% (US$40 million50), for those
alternative sustainable and acceptable involved in West Africa, from payments made
livelihoods. According to the OCI49, countries largely as protection and facilitation
with significant cannabis production are payments. Consequently, SSA generates little
Uganda, Eswatini, Malawi, CAR, DRC, Nigeria, from its transit role, but criminals fair much
Ghana, Sierra Leone, Togo, The Gambia & the better in terms of generating proceeds,
Ivory Coast. estimated at approximately US$3 billion

Cocaine: Cocaine from South America has from the world’s 2nd largest and fastest

long targeted smaller West African countries growing regional market.

as transit locations, where organised crime
 According to UNEP, reporting in 2014, the
and corruption manipulate safe passage
 street value of illegal drugs in East, Central
mostly into North Africa and into lucrative
 and West Africa was US$2.65 billion51. The
Western European markets. It has been
 regions with the highest illegal drug use,
estimated that approximately 40 million
 across Africa, was reported as 55% for West
tonnes of cocaine transits West Africa for
 Africa, 19% for East Africa, 12% for Southern
Western Europe each year, (representing
 Africa, 8%, for North Africa, and 6% for
about 20% of the total). countries that have
 Central Africa52. This suggests Southern
been particularly affected include Guinea
 Africa’s value for illegal drugs used locally
Bissau, once described as Africa’s fi rst “Narco
 would be US$336 million, amounting to
State” a decade or more ago, as well as
 approximately US$3 billion in total.
neighbours Guinea and The Gambia, as well
as Cape Verde. Although dated the UNODC reported in
 2011, that Africa generated US$1.5 billion in
Synthetics: Countries involved in producing
 proceeds for Cocaine, with 62% or US$1
and distributing signifi cant amounts of billion available for laundering.
synthetic drugs include: CAR, South Africa,
Nigeria, Ghana, Benin, Burkina Faso and the
Ivory Coast. Estimating the value of the
 Est Proceeds (2018) US$3 billion
illegal drug trade across SSA is challenging,

 Page 17 of 83
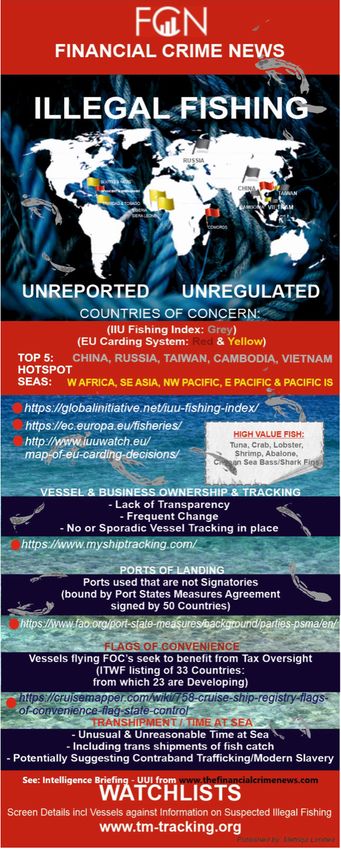
The fisheries sector offers employment
 1.7 Illegal Fishing
 opportunities with over 12.3 million people
Illegal fishing is a major environmental or employed as fishers or processors.
“green” crime, which not only involves
 1.7.1 Regional Assessment: Illegal fi shing is
organised criminal gangs but also other
 a problem not only for coastal states but also
serious crimes, such as drugs, arms and
 for inland countries that border the “Great
human trafficking, through forced labour. It is
 Lakes” and through which great rivers fl ow.
also the target of a UN Global Sustainable
 Most of the illegal fi shing is off West Africa
Development Goal, with targets 14.4 & 14.6
 and is carried out by foreign fl eets, exploiting
aiming to “end overfishing, illegal,
 the lack of monitoring and oversight.
unregulated and unreported fishing” and “to
eliminate state subsidies that contribute to According to the OCI56 highest scores for
these practices.” It is a global problem, countries with illegal fishing are Madagascar
however it is concentrated in developing (8/10) & South Africa (7.5/10).
countries which are
 According to the Illegal
responsible for 83% of
 Unregulated and
international trade in fishery
 Unreported Fishing Index57,
commodities. Illegal fishing
 SSA Countries rated highest
regularly target developing
 for the prevalence of illegal
countries53.
 fishing are: Sierra Leone,
With a coastline that covers followed by Nigeria, Liberia,
over 26,000 miles inclusive Seychelles, South Africa,
of its islands, and with
 Gabon, Guinea, Mauritius,
waters among the most
 Senegal, Tanzania,
fertile in the world, African
 Higher Risk Countries Madagascar and Togo.
countries, (according to the African for Illegal fishing
Union) account for only about 1.2% The EU introduced a carding
of world shipping and about 0.9% by system58 which has 2 SSA Countries currently
tonnage54, whereas fleets from Asia represent yellow carded, namely Liberia & Sierra Leone.
75% of the global fleet, with 3.5 million
vessels. West Africa: As a result of decades of illegal
 fi shing, the situation off the coast of West
According to the FAO, the total contribution Africa is perilous, in particular the region of
by the fisheries and aquaculture sector in
 northwest Africa (Senegal, The Gambia,
Africa is estimated at US$24 billion (FAO
 Guinea Bissau, Guinea and Sierra Leone).
2013), and accounts for 1.25% of total GDP.
 Almost 7 million people depend directly on
Seafood provides an important food source
 fi shing as a source of income, but this access
for over 400 million people in Africa,
 is increasingly hindered by industrial foreign
providing over 22% of the protein intake in
 fl eets which, often illegally, target areas that
SSA55.

 Page 18 of 83
are otherwise reserved for small-scale fi shers The illicit trade is controlled by Chinese
and their communities. It has been estimated criminals, who source their product from local
that over 300,000 jobs were lost to illegal gangs, for example from the notorious “Cape
fi shing in the region. Studies have found that Flats”, often in exchange for drugs such as
poverty is increasingly affecting fi shing methamphetamine, known as tik in South
communities59. Africa. Abalone is dried in South Africa before
 being sent to HK usually via neighbouring
According to the African Union Inter-African
 African countries with laxer border controls.
Bureau for Animal resources (AU-IBAR), it is
 Trucks routinely cross into Namibia,
estimated that Africa loses between US$2-
 Zimbabwe, or Mozambique with abalone
US$5 billion annually due to the
 hidden in false compartments or hidden, for
mismanagement in the fisheries sector. For
 example among boxes of dried fruits.
West Africa alone, on a conventional
estimate, fish catches as a result of illegal Mozambique is losing an estimated US$60
fishing activities is estimated at 40% higher million64 a year due to illegal fi shing.
than reported catches costing about US$1.3
 East Africa: The combined marine and
billion a year60.
 inland fi sheries in East Africa is responsible
In Ghana, about 2 million people rely on fish for 1/3 of all catches in Africa, with Tanzania
for their food and income. According to a and Uganda representing just over half of this
report from the Environmental Justice catch & DRC, Kenya and Madagascar jointly
Foundation61, trawlers, run almost exclusively another third. Kenya loses approximately
by Chinese operators using Ghanaian front US$100 million65 annually to illegal fishing,
companies, are illegally targeting the local whereas in Tanzania, it was estimated that
catch and selling it back to local communities illegal fishing cost the country approximately
at a profit. In Nigeria, where the fishing US$222 million a year in 2013.
industry employs approximately 790,000
 On Lake Victoria, which is the second largest
people, who earn just US$3 a day, an
 freshwater body in the world, bordered by
estimated US$70 million annually was being
 Kenya, Tanzania, and Uganda, around one
lost in 2018 to Chinese trawlers fishing
 million tons of fish are caught from the lake
illegally in its waters62, according to the
 each year, by around 200,000 workers from
Nigerian navy.
 locally-made boats. It is widely believed that
Southern Africa: South Africa reportedly lost there are high levels of illegal fishing activity
up to US$900 million63 from 2001-2018 on, and around the lake.
from the illegal trade in abalone (large sea
 Of particular concern is the Nile perch
snails). Whilst the trade is legal in South
 (highly prized for fish maw - otherwise known
Africa, only a third of the abalone caught is
 as swim bladder, and a delicacy in Chinese
done so legally (i.e. in line with quotas and
 cuisine), where stocks have fallen, to
other regulations).

 Page 19 of 83
dangerous levels, with illegal fishing From the total catch in SSA, the amount
targeting this fish for sale into Asia. caught considered as Illegal varies, for
 example in West Africa Illegal fishing is
1.7.2 Proceeds of Crime: Estimates for
 estimated at approximately 37% of the total,
losses from illegal fi shing across Africa66 is
 in East Africa at approximately 18% and in
between US$2-US$5 billion annually. Total
 Southern Africa at approximately 6% of the
economic losses due to illegal fishing in
 total68, resulting in an estimate of US$2.5
Africa is thought to be much higher at
 billion.
between US$10 billion and US$13 billion.
According to the African Union, most of this By ceding much of their waters to foreign
loss comes from West Africa (57%), followed fleets, and with little, or no effective oversight
by Northern Africa (30%) and then small it’s unsurprising that 1 in 4 fish caught in
amounts from Central (7%), Eastern (4%) and African waters is illegally fished, (compared
Southern Africa (2%)67. The loss to SSA can be to 1 in 5 globally).
estimated therefore at US$8 billion.
 Est Proceeds (2018) US$2.5 billion

 Supplementary Materials

 More on Illegal Fishing by FCN

 To learn more about the Illegal
 Fishing, read the detailed
 Intelligence Briefing on Illegal
 Fishing by ordering your copy
 with supporting Training &
 Awareness Materials by
 contacting FCN directly.

 Page 20 of 83
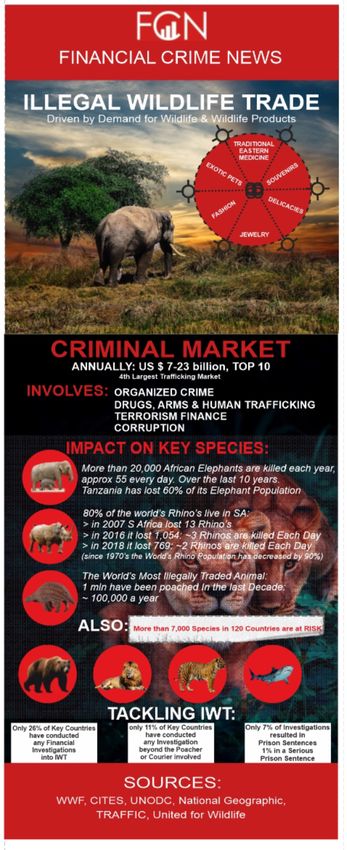
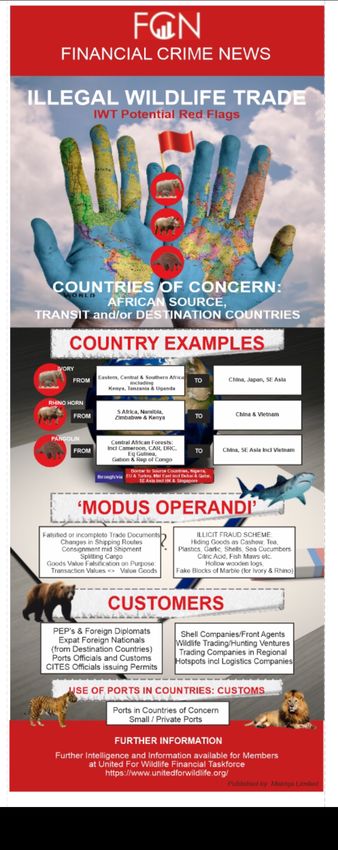
1.4.1 Regional Assessment:
 1.8 Illegal Wildlife Trade
 West Africa: In West Africa, Nigeria is a major
The illegal wildlife trade endangers many
 hub for wildlife traffi cking, particularly for
species, including iconic African mammals,
 wildlife poached in West and Central Africa,
such as the elephant and the rhino, but also
 and is a transit country, especially for ivory
the pangolin, which is the most trafficked
 and pangolin scales destined for Asia,
mammal of all, gorillas, big cats, reptiles,
 (including China and Vietnam). Shipments
birds and wildlife from all over the region.
 overseas are smuggled through the port of
Illegal trade and poaching of plants and Lagos, and in Abidjan in the Ivory Coast, but
other wildlife has been estimated to be worth also through other smaller West African ports.
between US$7 - 23 billion globally though In the Ivory Coast, the illicit trade is, as its
these sources likely overstate the amounts name suggests, in ivory, but also in pangolins.
involved. Research by FCN suggest the In Sierra Leone, the trade is dominated by
global amount is more likely around US$8.3 traffi cking in pangolins, but also poaching of
billion annually, or 25-30% of the legal white-necked picathartes, pygmy hippos,
trade69. forest elephants and monkeys. In Liberia,
 pangolin traffi cking is rife, being one of the
Wildlife traffickers in the region, are also
 primary origin countries for this animal.
involved in other crimes such as illegal
 Bushmeat traders target Liberia’s primates
logging, but also trafficking drugs, arms and
 which are now endangered.
people.
 Central Africa: The poaching of elephants
Countries where poaching and trafficking
 continues to be of considerable concern, for
pose particular threats to wildlife, according
 example in the DRC, with the country playing
to the OCI, include the DRC, CAR, Nigeria
 a major role in the international supply chain
and Madagascar. Elsewhere the threat to
 of illegal ivory. Species such as bonobos,
wildlife remains high including in South
 chimpanzees and gorillas are also vulnerable,
Africa, Mozambique, Zimbabwe, Togo,
 due to illegal bushmeat hunting. The DRC is
Tanzania, Congo, Gabon, and in South Sudan,
 also involved in the traffi cking of african grey
Uganda, Kenya, Ivory Coast, Senegal and
 parrots. In the CAR, armed groups and
Sierra Leone.
 poachers from Chad and Sudan, engage in

According to the US in its END Wildlife transnational traffi cking of a wide array of

Trafficking Report 201970, “Countries of wildlife, but most notably bushmeat, ivory

Concern” in SSA are the DRC and and animal skins, entering the country via

Madagascar, and “Focus Countries” are South Sudan. The Republic of the Congo, is a

Cameroon, Gabon, Kenya, Mozambique, source country for a number of protected

Nigeria, Republic of the Congo, South Africa, species, including ivory, pangolins and

Tanzania, Togo, Uganda & Zimbabwe. parrots, with poaching for bushmeat also a
 concern.

 Page 21 of 83
You can also read


