AeroCom phase III multi-model evaluation of the aerosol life cycle and optical properties using ground- and space-based remote sensing as well as ...
←
→
Page content transcription
If your browser does not render page correctly, please read the page content below
Atmos. Chem. Phys., 21, 87–128, 2021
https://doi.org/10.5194/acp-21-87-2021
© Author(s) 2021. This work is distributed under
the Creative Commons Attribution 4.0 License.

AeroCom phase III multi-model evaluation of the aerosol life cycle
and optical properties using ground- and space-based remote
sensing as well as surface in situ observations
Jonas Gliß1 , Augustin Mortier1 , Michael Schulz1 , Elisabeth Andrews2 , Yves Balkanski3 , Susanne E. Bauer4,5 ,
Anna M. K. Benedictow1 , Huisheng Bian6,7 , Ramiro Checa-Garcia3 , Mian Chin7 , Paul Ginoux8 , Jan J. Griesfeller1 ,
Andreas Heckel9 , Zak Kipling10 , Alf Kirkevåg1 , Harri Kokkola11 , Paolo Laj12,13 , Philippe Le Sager14 ,
Marianne Tronstad Lund15 , Cathrine Lund Myhre16 , Hitoshi Matsui17 , Gunnar Myhre15 , David Neubauer18 ,
Twan van Noije14 , Peter North9 , Dirk J. L. Olivié1 , Samuel Rémy19 , Larisa Sogacheva20 , Toshihiko Takemura21 ,
Kostas Tsigaridis5,4 , and Svetlana G. Tsyro1
1 Norwegian    Meteorological Institute, Oslo, Norway
2 Cooperative   Institute for Research in Environmental Sciences, University of Colorado, Boulder, CO, USA
3 Laboratoire des Sciences du Climat et de l’Environnement, LSCE/IPSL, CEA-CNRS-UVSQ, UPSaclay,

Gif-sur-Yvette, France
4 NASA Goddard Institute for Space Studies, New York City, NY, USA
5 Center for Climate Systems Research, Columbia University, New York City, NY, USA
6 University of Maryland, Baltimore County (UMBC), Baltimore, MD, USA
7 NASA Goddard Space Flight Center, Greenbelt, MD, USA
8 NOAA, Geophysical Fluid Dynamics Laboratory, Princeton, NJ, USA
9 Dept. of Geography, Swansea University, Swansea, UK
10 European Centre for Medium-Range Weather Forecasts, Reading, UK
11 Atmospheric Research Centre of Eastern Finland, Finnish Meteorological Institute, Kuopio, Finland
12 Université Grenoble Alpes, CNRS, IRD, Grenoble INP, Institute for Geosciences and Environmental Research (IGE),

Grenoble, France
13 Institute for Atmospheric and Earth System Research, University of Helsinki, Helsinki, Finland
14 Royal Netherlands Meteorological Institute, De Bilt, the Netherlands
15 CICERO Center for International Climate Research, Oslo, Norway
16 NILU – Norwegian Institute for Air Research, Kjeller, Norway
17 Graduate School of Environmental Studies, Nagoya University, Nagoya, Japan
18 Institute for Atmospheric and Climate Science, ETH Zurich, Zurich, Switzerland
19 HYGEOS, Lille, France
20 Finnish Meteorological Institute, Climate Research Program, Helsinki, Finland
21 Research Institute for Applied Mechanics, Kyushu University, 6-1 Kasuga-koen, Kasuga, Fukuoka, Japan

Correspondence: Jonas Gliß (jonasg@met.no)

Received: 30 December 2019 – Discussion started: 18 March 2020
Revised: 15 September 2020 – Accepted: 13 November 2020 – Published: 6 January 2021

Published by Copernicus Publications on behalf of the European Geosciences Union.
88                                                                J. Gliß et al.: AeroCom phase 3 optical properties’ evaluation

Abstract. Within the framework of the AeroCom (Aerosol                This must have implications for lifetime, water uptake, scat-
Comparisons between Observations and Models) initiative,              tering enhancement, and the aerosol radiative effect, which
the state-of-the-art modelling of aerosol optical properties is       we can not quantify at this moment.
assessed from 14 global models participating in the phase                Comparison against Global Atmosphere Watch (GAW) in
III control experiment (AP3). The models are similar to               situ data results in mean bias and inter-model variations of
CMIP6/AerChemMIP Earth System Models (ESMs) and                       −35 % ± 25 % and −20 % ± 18 % for SCdry and ACdry , re-
provide a robust multi-model ensemble. Inter-model spread             spectively. The larger underestimate of SCdry than ACdry sug-
of aerosol species lifetimes and emissions appears to be simi-        gests the models will simulate an aerosol single scattering
lar to that of mass extinction coefficients (MECs), suggesting        albedo that is too low. The larger underestimate of SCdry than
that aerosol optical depth (AOD) uncertainties are associated         ambient air AOD is consistent with recent findings that mod-
with a broad spectrum of parameterised aerosol processes.             els overestimate scattering enhancement due to hygroscopic
   Total AOD is approximately the same as in AeroCom                  growth. The broadly consistent negative bias in AOD and sur-
phase I (AP1) simulations. However, we find a 50 % decrease           face scattering suggests an underestimate of aerosol radiative
in the optical depth (OD) of black carbon (BC), attributable          effects in current global aerosol models.
to a combination of decreased emissions and lifetimes. Rel-              Considerable inter-model diversity in the simulated optical
ative contributions from sea salt (SS) and dust (DU) have             properties is often found in regions that are, unfortunately,
shifted from being approximately equal in AP1 to SS con-              not or only sparsely covered by ground-based observations.
tributing about 2/3 of the natural AOD in AP3. This shift is          This includes, for instance, the Sahara, Amazonia, central
linked with a decrease in DU mass burden, a lower DU MEC,             Australia, and the South Pacific. This highlights the need for
and a slight decrease in DU lifetime, suggesting coarser DU           a better site coverage in the observations, which would en-
particle sizes in AP3 compared to AP1.                                able us to better assess the models, but also the performance
   Relative to observations, the AP3 ensemble median and              of satellite products in these regions.
most of the participating models underestimate all aerosol               Using fine-mode AOD as a proxy for present-day aerosol
optical properties investigated, that is, total AOD as well           forcing estimates, our results suggest that models underesti-
as fine and coarse AOD (AODf , AODc ), Ångström expo-                 mate aerosol forcing by ca. −15 %, however, with a consid-
nent (AE), dry surface scattering (SCdry ), and absorption            erably large interquartile range, suggesting a spread between
(ACdry ) coefficients. Compared to AERONET, the models                −35 % and +10 %.
underestimate total AOD by ca. 21 % ± 20 % (as inferred
from the ensemble median and interquartile range). Against
satellite data, the ensemble AOD biases range from −37 %
(MODIS-Terra) to −16 % (MERGED-FMI, a multi-satellite                 1   Introduction
AOD product), which we explain by differences between
individual satellites and AERONET measurements them-                  The global aerosol remains one of the largest uncertainties
selves. Correlation coefficients (R) between model and ob-            for the projection of future Earth’s climate, in particular be-
servation AOD records are generally high (R > 0.75), sug-             cause of its impact on the radiation balance of the atmo-
gesting that the models are capable of capturing spatio-              sphere (IPCC, 2014). Aerosol particles interact with radi-
temporal variations in AOD. We find a much larger un-                 ation through scattering and absorption, thus directly alter-
derestimate in coarse AODc (∼ −45 % ± 25 %) than in fine              ing the atmosphere’s radiation budget (aerosol–radiation in-
AODf (∼ −15 % ± 25 %) with slightly increased inter-model             teractions, or ARI). Moreover, they serve as cloud conden-
spread compared to total AOD. These results indicate prob-            sation nuclei (CCN) and can thus influence further climate-
lems in the modelling of DU and SS. The AODc bias is likely           relevant components such as clouds and their optical proper-
due to missing DU over continental land masses (particularly          ties (e.g. cloud droplet number concentrations, cloud optical
over the United States, SE Asia, and S. America), while ma-           depth) and lifetime as well as cloud coverage and precipi-
rine AERONET sites and the AATSR SU satellite data sug-               tation patterns (aerosol–cloud interactions, or ACI) (IPCC,
gest more moderate oceanic biases in AODc .                           2014). Since 2002, the “Aerosol Comparisons between Ob-
   Column AEs are underestimated by about 10 % ± 16 %.                servation and Models” (AeroCom) project has attempted to
For situations in which measurements show AE > 2, mod-                federate global aerosol modelling groups to provide state-of-
els underestimate AERONET AE by ca. 35 %. In con-                     the art multi-model evaluation and, thus, to provide updated
trast, all models (but one) exhibit large overestimates in AE         understanding of aerosol forcing uncertainties and best esti-
when coarse aerosol dominates (bias ca. +140 % if observed            mates. Multi-model ensemble results have often been shown
AE < 0.5). Simulated AE does not span the observed AE                 to be more robust than individual model simulations, outper-
variability. These results indicate that models overestimate          forming them when compared with observations. This paper
particle size (or underestimate the fine-mode fraction) for           attempts to provide a new reference, including multi-model
fine-dominated aerosol and underestimate size (or overesti-           ensemble median fields to inform further model development
mate the fine-mode fraction) for coarse-dominated aerosol.            phases.

Atmos. Chem. Phys., 21, 87–128, 2021                                                      https://doi.org/10.5194/acp-21-87-2021
J. Gliß et al.: AeroCom phase 3 optical properties’ evaluation                                                                 89

   Aerosol optical properties such as the aerosol scattering          AOD is the vertically integrated light extinction (absorp-
and absorption coefficients, the aerosol optical depth (AOD),      tion + scattering) due to an atmospheric column of aerosol.
and the Ångström exponent (AE) are important compo-                AAOD (the absorption aerosol optical depth) is the corre-
nents of aerosol direct forcing calculations, as they determine    sponding equivalent for the absorptive power of an aerosol
how aerosols interact with incoming and outgoing long- and         column and tends to be small relative to AOD (ca. 5 %–
shortwave radiation. A special case is aerosol absorption be-      10 % of AOD). Both AOD (dominated by scattering) and
cause it is capable of changing the sign of aerosol forcing.       AAOD (absorption) are of particular relevance for aerosol
Improved insight about aerosol optical properties, including       forcing assessments (e.g. Bond et al., 2013). Remote sens-
their spatial and temporal distributions, would be very help-      ing of these parameters by sun photometers, for instance,
ful to better constrain the aerosol–radiation interactions. The    within the Aerosol Robotic Network (AERONET; Holben
evaluation of these parameters is thus the focus of this paper.    et al., 1998), or via satellite-borne instruments has provided
   A challenging part of modelling the global aerosol is           an enormous observational database to compare with model
its comparatively high variability in space and time (e.g.         simulations.
Boucher et al., 2013), as compared to well-mixed greenhouse           The AE describes the wavelength dependence of the light
gases such as carbon dioxide and methane. The radiative im-        extinction due to aerosol and can be measured via remote
pact aerosols exert depends on the amount and the properties       sensing using AOD estimates at different wavelengths. AE
of the aerosol. Emissions, secondary formation of aerosol,         depends on the aerosol species (and state of mixing), due to
and lifetime combined lead to different amounts of aerosol in      differences in the refractive indices and size domains (e.g.
transport models. In addition, atmospheric aerosol particles       Seinfeld and Pandis, 2016). It is a qualitative indicator of
undergo continuous alteration (e.g. growth, mixing) due to         aerosol size since it is inversely related to the aerosol size
microphysical processes that occur on lengths and timescales       (i.e. smaller AE suggests larger particles). However, for mid-
that cannot be resolved by global models, such as nucleation,      visible wavelengths (e.g. around 0.5 µm, as used in this pa-
coagulation, gas-to-particle conversion, or cloud processing.      per), the spectral variability of light extinction flattens for
   Natural aerosols constitute a large part of the atmospheric     particle sizes exceeding the incident wavelength. This can
aerosol. They are dominated by sea salt (SS) and dust (DU),        create considerable noise in the AE versus size relationship,
which make up more than 80 % of the total aerosol mass.            especially for multi-modal aerosol size distributions, as dis-
Natural aerosol precursors include volcanic and biogenic sul-      cussed in detail by Schuster et al. (2006). Global AE val-
fur (SO4 ) and volatile organic compounds (BVOCs), as well         ues, which combine data from regions dominated by differ-
as BC and organic aerosol (OA) from wildfires. Sea salt            ent aerosol types, have the potential to further complicate
and dust emissions are strongly dependent on local meteo-          the interpretation of model-simulated AE in comparison with
rology and surface properties and, thus, require parameteri-       observations. Nonetheless, the comparison of modelled AE
sations in global models with comparatively coarse resolu-         with observations can still provide qualitative insights into
tion. These parameterisations are sensitive to simulated near-     the modelled size distributions.
surface winds, soil properties (in the case of dust), and model       Model and observational estimates of fine- and coarse-
resolution (e.g. Guelle et al., 2001; Laurent et al., 2008). Ma-   mode AOD can provide another view of the light extinction
jor sources of natural SO4 aerosol are marine emissions of         in both size regimes. This is because these parameters also
dimethyl sulfide (DMS) and volcanic SO2 emissions (e.g.            depend on the actual amount (mass) of aerosol available in
Seinfeld and Pandis, 2016). Uncertainties in natural aerosol       each mode. The coarse mode is dominated by the natural
emissions constitute a major source of uncertainty for es-         aerosols (sea salt and dust). Hence, individual assessment of
timates of the radiative impact of aerosols on the climate         extinction due to fine and coarse particle regimes can provide
system (e.g. Carslaw et al., 2013), mainly because of non-         insights into differences between natural and anthropogenic
linearities in the aerosol–cloud interactions and in the resul-    aerosols. It should be noted that the split between fine and
tant cloud albedo effect (Twomey, 1977).                           coarse mode is not straightforward in models (for example,
   Major absorbing species are black carbon, followed by           some size bins may span the size cut) or for remote sensing
dust and, to a certain degree, organic aerosols (e.g. Samset       instruments which rely on complex retrieval algorithms.
et al., 2018, and references therein). Also anthropogenic dust        The comparison to surface in situ measurements of scat-
may exert forcing on the climate system (e.g. Sokolik and          tering and absorption coefficients offers a valuable perfor-
Toon, 1996). The absorptive properties of dust aerosol are         mance check of the models, independent of remote sensing.
dependent on the mineralogy and size of the dust particles,        One factor that impacts both remote sensing and in situ mea-
resulting in some dust types being more absorbing than oth-        surements is water uptake by hygroscopic aerosols. In gen-
ers (e.g. Lafon et al., 2006). This has direct implications for    eral, water uptake will enhance the light extinction efficiency
forcing estimates (e.g. Claquin et al., 1998). Several mea-        (e.g. Kiehl and Briegleb, 1993). This is mostly relevant for
sured parameters can be used to evaluate model simulations         scattering, since absorbing aerosols such as dust and black
of aerosol optical properties.                                     carbon typically become slightly hygroscopic as they age,
                                                                   due to mixing with soluble components (e.g. Cappa et al.,

https://doi.org/10.5194/acp-21-87-2021                                                  Atmos. Chem. Phys., 21, 87–128, 2021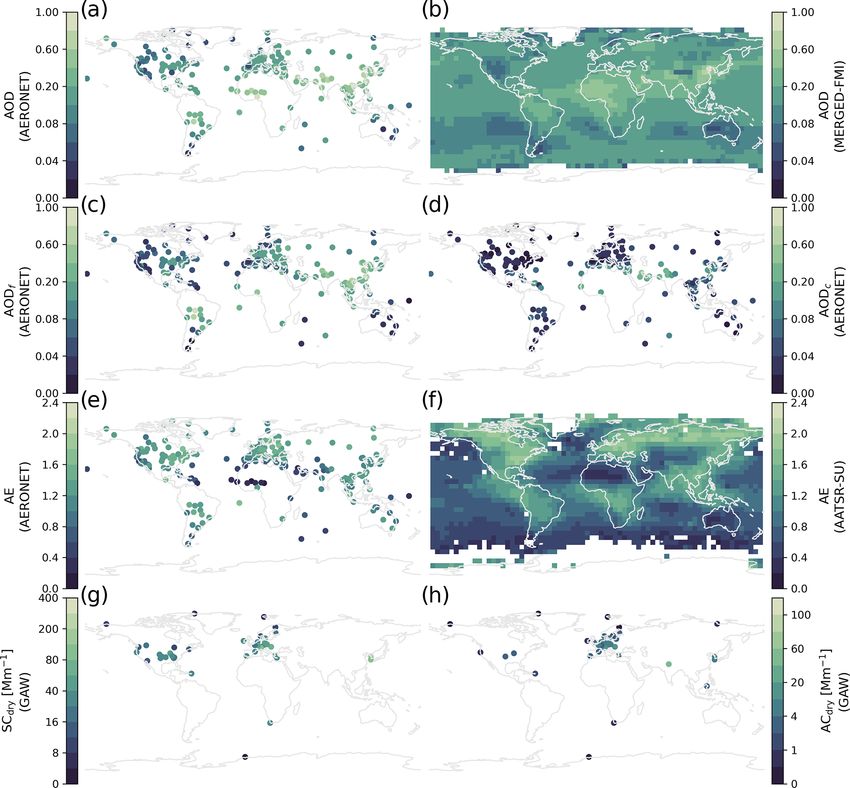
90                                                                   J. Gliß et al.: AeroCom phase 3 optical properties’ evaluation

2012). Even at low relative humidity (RH < 40 %, a range                 the first time, surface in situ measurements of scattering and
that is often considered “dry” for the purposes of Global At-            absorption coefficients, primarily from surface observatories
mosphere Watch (GAW) in situ measurements; GAW Report                    contributing to Global Atmospheric Watch (GAW), obtained
227, 2016) aerosol light scattering can be enhanced by up to             from the World Data Centre for Aerosols (GAW-WDCA)
20 % due to hygroscopic growth (e.g. Zieger et al., 2013).               archive.
Recent work showed that some models tend to overestimate                    This paper is structured as follows. Section 2 introduces
the scattering enhancement factor at low RH (and high RH)                the observation platforms, parameters, and models used,
and, hence, overestimate the light scattering coefficients at            followed by a discussion of the analysis details for the
relatively dry conditions (Latimer and Martin, 2019; Burgos              model evaluation (e.g. statistical metrics, re-gridding, and
et al., 2020).                                                           co-location). The results are split into two sections. Sec-
   Kinne et al. (2006) provided a first analysis of modelled             tion 3 provides an inter-model overview of the diversity in
column aerosol optical properties of 20 aerosol models par-              globally averaged emissions, lifetimes, and burdens, as well
ticipating in the initial AeroCom phase 1 (AP1) experiments.             as mass extinction and mass absorption coefficients (MECs,
They found that, on a global scale, AOD values from differ-              MACs) and optical depths (ODs) for each model and aerosol
ent models compared well to each other and generally well                species1 . This is followed by a discussion of the diversity
to global annual averages from AERONET (model biases of                  of simulated aerosol optical properties (AOD, AE, scatter-
the order of −20 % to +10 %). However, they also found                   ing and absorption coefficients) in the context of the species-
considerable diversity in the aerosol speciation among the               specific aerosol parameters (e.g. lifetime, burden) from each
models, mainly related to differences in transport and water             model. Section 4 presents and discusses the results from the
uptake. They concluded that this diversity in component con-             comparison of modelled optical properties with the different
tribution added (via differences in aerosol size and absorp-             observational data sets. The observational assessment section
tion) to uncertainties in associated aerosol direct radiative ef-        ends with a short discussion of the representativity of the re-
fects. Textor et al. (2006) used the same model data as Kinne            sults.
et al. (2006) and focused on the diversities in the modelling
of the global aerosol, by establishing differences between
modelled parameters related to the aerosol life cycle, such              2     Data and methods
as emissions, lifetime, and column mass burden of individ-
                                                                         In this section, we first describe the ground- and space-based
ual aerosol species. One important result from Textor et al.
                                                                         observation networks/platforms and variables that are used
(2006) is that the model variability of global aerosol emis-
                                                                         in this study (Sect. 2.1). Section 2.2 introduces the 14 global
sions is highest for dust and sea salt, which is attributed to the
                                                                         models used in this paper. Finally, Sect. 2.3 contains relevant
fact that these emissions were computed online in most mod-
                                                                         information related to the data analysis (e.g. computation of
els, while the agreement in the emissions of the other species
                                                                         model ensemble, co-location methods, and metrics used for
(OA, SO4 , BC) were due to the usage of similar emission
                                                                         the model assessment).
inventories. Since then, in the framework of AeroCom, sev-
eral studies have investigated different details and aspects of          2.1    Observations
the global aerosol modelling, focusing on individual aerosol
species and forcing uncertainty. However, it became clear                Several ground- and space-based observations have been
that a common base or control experiment was needed again                utilised in order to perform a comprehensive evaluation at
to compare the current aerosol models contributing to assess-            all scales (Table 1). These are introduced in the individual
ments such as the Coupled Model Intercomparison Project                  paragraphs below. Figure 1 shows maps of the annual mean
Phase 6 (CMIP6; Eyring et al., 2016) or the upcoming report              values of the variables considered (from some of the obser-
of the Intergovernmental Panel on Climate Change (IPCC),                 vation platforms used). It is discussed below in Sect. 2.1.7.
against updated measurements of aerosol optical properties               Note that the wavelengths in Table 1 reflect the wavelengths
and to assess aerosol life cycle differences. This study aims            used for comparison with the models; however, the original
to provide this basic assessment and will also facilitate inter-         measurement wavelengths may be different as noted below.
pretation of other recent AeroCom phase III experiments.
   This study thus investigates modelled aerosol optical prop-
erties simulated by the most recent models participating in
the AeroCom phase III 2019 control experiment (AeroCom
wiki, 2020, in the following denoted AP3-CTRL) on a global
scale. It makes use of the increasing amount of observa-
tional data which have become available during the past 2
decades. We extend the assessment by Kinne et al. (2006)                     1 Note that throughout this paper AOD denotes total aerosol op-
and use ground- and space-based observations of the colum-               tical depth, while OD denotes optical depth of individual species
nar variables of total, fine, and coarse AOD and AE and, for             (e.g. ODSO4 )

Atmos. Chem. Phys., 21, 87–128, 2021                                                          https://doi.org/10.5194/acp-21-87-2021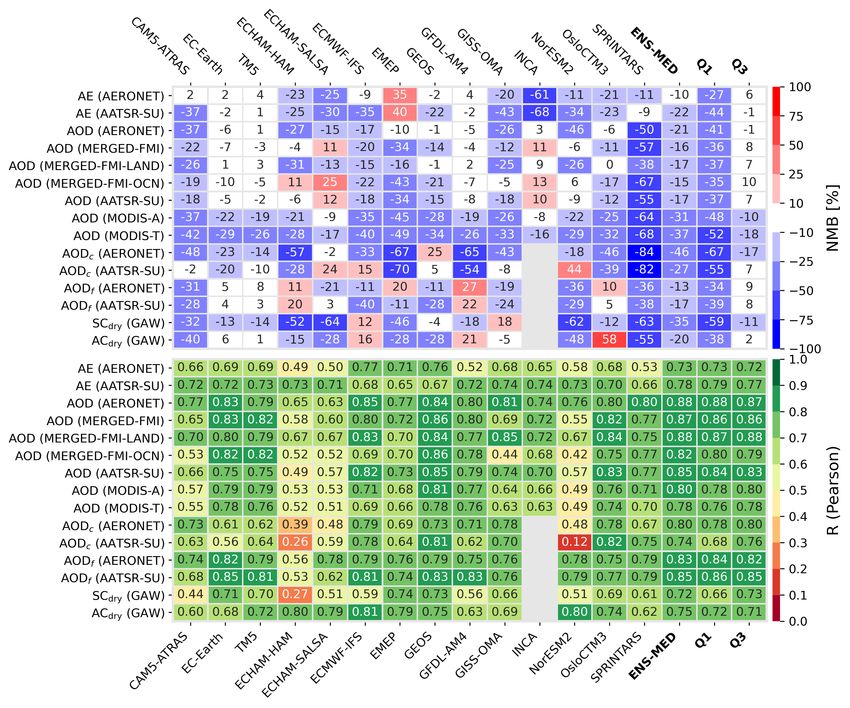
J. Gliß et al.: AeroCom phase 3 optical properties’ evaluation                                                                91

2.1.1   AERONET                                                   site shows a more or less pronounced seasonal cycle depend-
                                                                  ing on the latitude (e.g. only midday measurements at high
The Aerosol Robotic Network (AERONET; Holben et al.,              latitudes in winter) and the seasonal prevalence of clouds in
1998) is a well-established, ground-based remote sensing          some regions. This is a clear limitation when comparing with
network based on sun photometer measurements of colum-            24 h monthly means output from the models (as done in this
nar optical properties. The network comprises several hun-        study). However, these representativity issues were found to
dred measurement sites around the globe (see Fig. 1a,             have a minor impact on the model assessment methods used
c, d, e for the 2010 sites). In this paper, cloud-screened        in this study (details are discussed in Sect. 4.5).
and quality-assured daily aggregates of AERONET AODs,
AODf , AODc , and AE from the version 3 (Level 2) sun             2.1.2   Surface in situ data
and spectral deconvolution algorithm (SDA) products (e.g.
O’Neill et al., 2003; Giles et al., 2019) have been used. No      Surface in situ measurements of the aerosol light scattering
further quality control measures have been applied due to the     (SC) and absorption coefficients (AC) were accessed through
already high quality of the data. Only site locations below       the GAW-WDCA database EBAS (http://ebas.nilu.no/, last
1000 m altitude were considered in this analysis.                 access: 21 December 2020). As with AERONET, only sites
   The sun photometers measure AOD at multiple wave-              with elevations below 1000 m were considered. Annual mean
lengths. For comparison with the model output (which is pro-      values of scattering and absorption are shown in Fig. 1g,
vided at 550 nm), the measurements at 500 nm and 440 nm           h. The in situ site density is highest in Europe, followed
were used to derive the total AOD at 550 nm, using the            by North America, while other regions are poorly repre-
provided AE data to make the wavelength adjustment (the           sented. The EBAS database also includes various observa-
500 nm channel was preferred over the 440 nm channel).            tions of atmospheric chemical composition and physical pa-
Similarly, the AODf and AODc data provided at 500 nm              rameters, although those were not used here. For both scat-
via the AERONET spectral deconvolution algorithm (SDA)            tering and absorption variables, only level 2 data from the
product were shifted to 550 nm using the AE data. The SDA         EBAS database were used (i.e. quality-controlled, hourly av-
product (O’Neill et al., 2003) computes AODf and AODc in          eraged, reported at standard temperature and pressure (STP);
an optical sense, based on the spectral curvature of the re-      Tstd = 273.15 K, Pstd = 1013.25 hPa). All data in EBAS have
trieved AODs in several wavelength channels and assuming          version control, and a detailed description of the quality as-
bimodal aerosol size distributions. Thus, as pointed out by       surance and quality control procedures for GAW aerosol in
O’Neill et al. (2003), it does not correspond to a strict size    situ data is available in Laj et al. (2020). Additionally, for
cut at a certain radius, such as the R = 0.6 µm established in    this study, data were only considered if they were associated
the AERONET Inversion product (Dubovik and King, 2000).           with the EBAS categories aerosol or pm10. The aerosol cat-
Compared to the Inversion product, the SDA product used           egory indicates the aerosol was sampled using a whole air
here tends to overestimate the coarse contribution (O’Neill       inlet, while pm10 indicates the aerosol was sampled after a
et al., 2003), which suggests that, on average, the effective     10 µm aerodynamic diameter size cut.
cut applied in the SDA product is closer to the strict thresh-       Invalid measurements were removed based on values in
old of R = 0.5 µm required from the models within the AP3-        the flag columns provided in the data files. Furthermore,
CTRL experiment (see Sect. 2.2 for details). The implica-         outliers were identified and removed using value ranges of
tions of this difference are discussed in Sect. 4. It should      {−10, 1000} Mm−1 and {−1, 100} Mm−1 for scattering and
also be noted that the AE provided by AERONET is cal-             absorption coefficients, respectively. The outliers were re-
culated from a multi-wavelength fit to the four AERONET           moved in the original 1 h time resolution before averaging to
measurement wavelengths, rather than from selected wave-          monthly resolution for comparison with the monthly model
length pairs.                                                     data.
   Data from the short-term DRAGON campaigns (Holben                 For the in situ AC data used in this study, most of the mea-
et al., 2018) were excluded in order to avoid giving too much     surements are performed at wavelengths other than 550 nm
weight to the associated campaign regions (with high den-         (see Sect. S1 in Supplement 2). These were converted to
sity of measurement sites) in the computation of network-         550 nm assuming an absorption Ångström exponent (AAE)
averaged statistical parameters used in this study. No further    of 1 (i.e. a 1/λ dependence; e.g. Bond and Bergstrom, 2006).
site selection has been performed, since potential spatial rep-   This is a fairly typical assumption when the spectral absorp-
resentativity issues associated with some AERONET sites           tion is not measured. For about 50 % of the sites, absorp-
were found to be of minor relevance for this study (Sect. 4.5).   tion was measured at ∼ 530 nm, meaning that even if the true
   The sun photometer measurements only occur during day-         AAE had a value of 2, the wavelength-adjusted AC value
light and cloud-free conditions. Thus, the level 2 daily av-      would only be underestimated by ca. 4 %. For another 25 %
erages used here represent daytime averages rather than 24 h      of the sites, absorption was measured at ∼ 670 nm. For these
averages (as provided by the models). Because of the require-     sites, the impact of an incorrect AAE value is larger (ca.
ments for sunlight and no clouds, the diurnal coverage at each    26 % overestimation for an actual AAE of 2 and ca. 6 % for

https://doi.org/10.5194/acp-21-87-2021                                                 Atmos. Chem. Phys., 21, 87–128, 2021
92                                                                                   J. Gliß et al.: AeroCom phase 3 optical properties’ evaluation

Table 1. Observations used in this study, including relevant meta data information. ID: name of observation network. Source: data source or
subset. Var: variable name. NMB: Normalised mean bias of satellite product at AERONET sites (monthly statistics). λ: wavelength used for
analysis (may be different from measurement wavelength; for details, see text). Ver: data version. Lev: data level. Freq: original frequency of
data used to derive monthly means. Res: resolution of gridded data product. Clim: use of a multi-annual climatology or not. No. st: number of
stations/coordinates, with observations used. Date: retrieval date from respective database. See text in Sect. 2.1 for additional quality control
measures that have been applied to some of these data sets.

  ID                     Source               Var.        NMB (%)            λ (nm)       Ver.   Lev.   Freq.       Res.   Clim.   No. st.        Date
  GAW                    EBAS                 ACdry                            550                 2    hourly             Y           39    2020/04/01
  GAW                    EBAS                 SCdry                            550                 2    hourly             Y           39    2020/04/01
  AERONET                AOD                  AE                            4-λ fit∗         3     2    daily              N          245    2020/08/13
  AERONET                AOD                  AOD                              550           3     2    daily              N          235    2020/08/13
  AERONET                SDA                  AODf                             550           3     2    daily              N          222    2020/08/13
  AERONET                SDA                  AODc                             550           3     2    daily              N          222    2020/08/13
  MODIS-T                Terra DT/DB          AOD              +16.5           550         6.1     3    daily      1×1     N          246    2019/11/22
  MODIS-A                Aqua DT/DB           AOD               +8.9           550         6.1     3    daily      1×1     N          246    2019/11/25
  AATSR-SU               Swansea              AOD               −4.2           550         4.3     3    daily      1×1     N          246    2016/09/30
  AATSR-SU               Swansea              AE               +14.3       550–865         4.3     3    daily      1×1     N          257    2016/09/30
  AATSR-SU               Swansea              AODf              +1.6           550         4.3     3    daily      1×1     N          233    2016/09/30
  AATSR-SU               Swansea              AODc             −14.7           550         4.3     3    daily      1×1     N          233    2016/09/30
  MERGED-FMI             FMI                  AOD               −5.5           550                      daily      1×1     N          246    2019/10/21
∗ AERONET’s 4-λ fit is based on these four wavelengths: 440, 500, 675, and 870 nm.

AAE = 1.25). The remaining 25 % of sites typically utilised                              ble 1), many in situ sites began measurements after 2010, so
wavelengths between these two values. Schmeisser et al.                                  a slightly different approach was taken in order to maximise
(2017) suggest, across a spatially and environmentally di-                               the number of sites with monthly aggregated data. For any
verse set of sites measuring spectral in situ absorption (many                           given in situ site, all data available between 2005–2015 were
included here), that the AAE is typically between 1 and 1.5.                             used to compare with the 2010 model output. The climatol-
   The majority of in situ scattering sites used here included                           ogy for each in situ site was computed, requiring at least 30
a measurement at 550 nm (see Table S2 in Supplement 2), so                               valid daily values for each of the climatological months over
for these data no wavelength adjustment was necessary. The                               the 10-year period. Prior to that, daily values were computed
remaining few sites measuring around 520 nm were shifted to                              from the hourly data, applying a minimum 25 % coverage
550 nm, assuming a scattering AE (SAE) of 1 (we note that                                constraint (i.e. at least six valid hourly values per day). It
this is rather at the lower end of typically measured SAEs; see                          should be noted that the in situ data are collected contin-
Andrews et al., 2019). However, we assess the uncertainties                              uously day and night, regardless of cloud conditions, and,
similar to those discussed above for AC; indeed, the change                              thus, daily data will represent the full diurnal cycle in most
in model bias as compared to an assumed SAE = 1.5 was                                    cases. As can be seen in column “Cov” in Tables S1 and S2
found to be < 0.5 %. As mentioned previously, the in situ                                of the Supplement 2, for most of the in situ sites, the 25 %
measurements are, ideally, made at low RH (RH ≤ 40 %) but                                coverage constraint for the resampling from hourly to daily
are not absolutely dry (i.e. RH = 0 %). Control of sample rel-                           was typically met. Note that about half of all available hourly
ative humidity is not always perfect, so, depending on the                               SC measurements in the 2005–2015 period were not consid-
site and conditions, the measurement RH could exceed 40 %.                               ered here, either because the measured RH exceeded 40 % or
Because the model data with which the in situ scattering data                            because RH data were missing in the data files.
will be compared are reported at RH = 0 %, only measure-                                    A few urban in situ sites were removed from considera-
ments at RH ≤ 40 % were considered to minimise discrep-                                  tion for the model analysis, as these sites are likely not rep-
ancies due to potential scattering enhancement at higher RH                              resentative on spatial scales of a typical model grid. For scat-
values. While maintaining that the measurement RH < 40 %                                 tering coefficients the sites excluded are Granada, Phoenix,
is typically assumed to minimise the confounding effect of                               National Capitol – Central, and Washington D.C. and for ab-
water on aerosol properties (GAW Report 227, 2016), Zieger                               sorption coefficients Granada, Leipzig Mitte, and Ústí n.L.-
et al. (2013) suggest that there may be noticeable scattering                            mesto. After applying the RH constraint, removing urban
enhancement even at RH = 40 % for some types of aerosol                                  sites from consideration, and resampling to monthly clima-
(see their Fig. 5b).                                                                     tology, data from 39 sites with scattering data and from 39
   While observations from other platforms and networks re-                              sites with absorption data (not necessarily the same sites as
lied solely on 2010 data for the model assessment (see Ta-

Atmos. Chem. Phys., 21, 87–128, 2021                                                                            https://doi.org/10.5194/acp-21-87-2021
J. Gliß et al.: AeroCom phase 3 optical properties’ evaluation 93
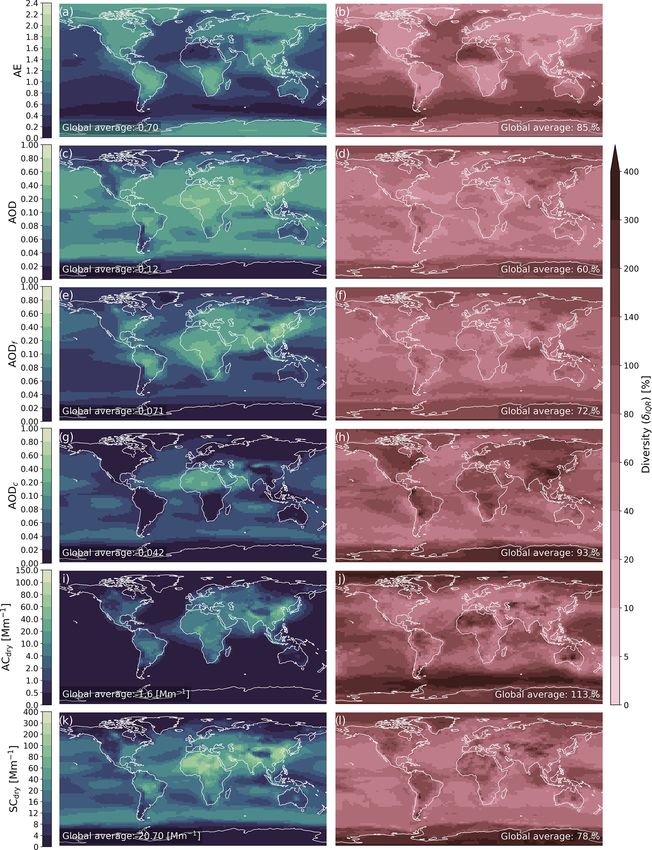
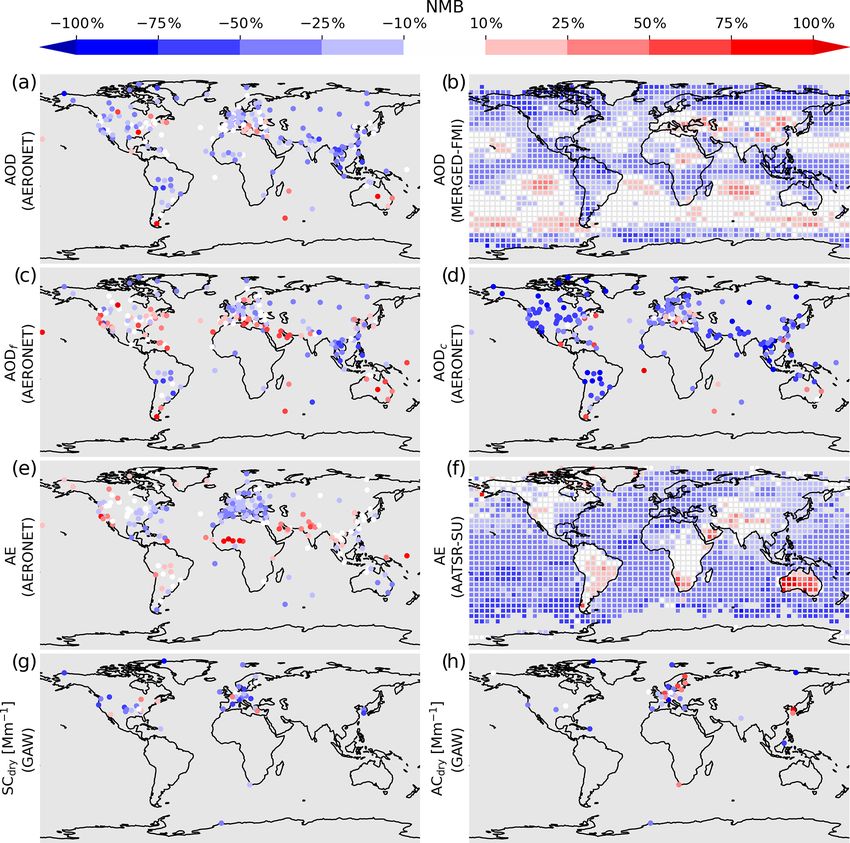
Figure 1. Overview of data used for model evaluation. Yearly averages of AODs from (a) AERONET, (b) merged satellite data set, (c) fine
and (d) coarse AOD from AERONET, (e) AE from AERONET, (f) AATSR, (g) dry scattering, and (h) dry absorption coefficients from
surface in situ observations.
for scattering) were available for model assessment (see Ta- evaluate optical properties from the AP3 models. The four
ble 1). satellite data sets are introduced below.
Tables S1 and S2 in the Supplement 2 provide detailed Even though the satellite observations usually come with
information about each of the absorption and scattering sites larger uncertainties and may exhibit potential biases against
used. This includes the original measurement wavelengths as ground-based column observations (e.g. Gupta et al., 2018),
well as temporal coverage for the computation of the clima- we believe that it is a valuable addition to not only evaluate
tology. models at ground sites but also incorporate satellite records
for an assessment of model performance. The main advan-
tage of satellite data is the spatial coverage relative to ground-
2.1.3 Satellite data sets – introduction based measurements. Satellites provide more coverage over
land masses than AERONET, and in addition, they are the
In addition to the ground-based observations, data from four primary observational tool for column optical properties over
different satellite data sets (MODIS Aqua & Terra, AATSR oceans.
SU v4.3 and a merged AOD satellite data set) were used to
https://doi.org/10.5194/acp-21-87-2021 Atmos. Chem. Phys., 21, 87–128, 2021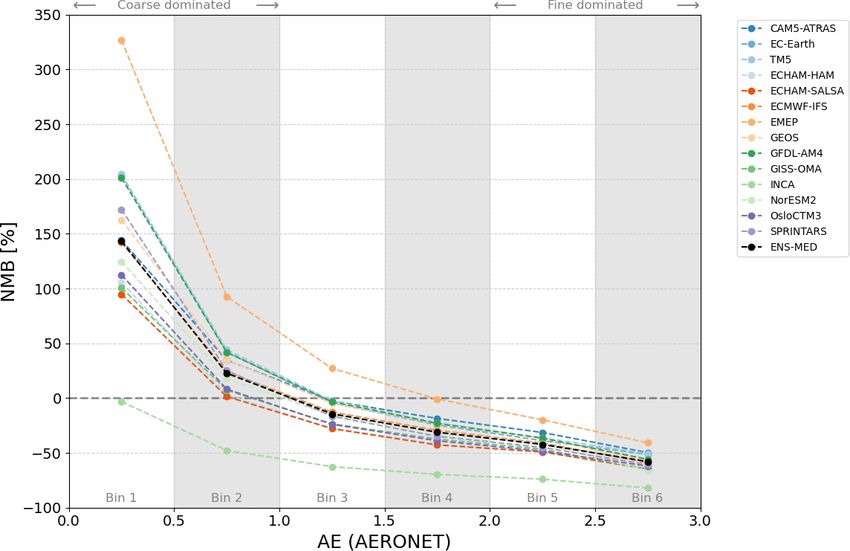
94                                                                 J. Gliß et al.: AeroCom phase 3 optical properties’ evaluation

   Because of AERONET’s reliability and data quality, it is               Over land, the algorithm uses the dual-view capability of
generally accepted as the gold standard for column AOD                 the instrument to allow estimation without a priori assump-
measurements. Therefore, all four satellites used in this paper        tions on surface spectral reflectance (North, 2002; Bevan
were evaluated against AERONET data, in order to establish             et al., 2012). Over ocean, the algorithm uses a simple model
relative biases and correlation coefficients. Details related to       of ocean surface reflectance including wind speed and pig-
this satellite assessment are discussed in Supplement 2 and            ment dependency at both nadir and along-track view angles.
are briefly mentioned in the introduction sections for each            The retrieval directly finds an optimal estimate of both the
individual satellite below. The results from this satellite as-        AOD at 550 nm, and size, parameterised as relative propor-
sessment are also available online (see Mortier et al., 2020a),        tions of fine- and coarse-mode aerosol. The local composi-
allowing for an interactive exploration of the data and re-            tion of fine and coarse mode is adopted from the MACv1
sults (down to the station level), and they include many eval-         aerosol climatology (Kinne et al., 2013). The local coarse
uation metrics (e.g. various biases, correlation coefficients,         composition is defined by fractions of non-spherical dust and
root mean square error (RMSE)). These comparisons of the               large spherical particles typical of sea salt aerosol, while fine
individual satellites against AERONET provide context for              mode is defined by relative fractions of weak and strong ab-
the differences in the model assessments discussed below in            sorbing aerosol. A full description of these component mod-
Sect. 4. It should be noted, however, that the retrieved biases        els is given in de Leeuw et al. (2015). Further aerosol prop-
for each satellite data set provide insights into the perfor-          erties including AE (calculated between 550 and 856 nm)
mance of each satellite product at AERONET sites, which                and absorption aerosol optical depth (AAOD; not used in
are land-dominated. Satellites often have different retrieval          this study) are determined from the retrieved AOD and com-
algorithms over land and ocean (e.g. Levy et al., 2013), and           position. Aerosol properties are retrieved over all snow-free
the aerosol retrieval tends to be more reliable over dark sur-         and cloud-free surfaces. The most recent version AATSR SU
faces, such as the oceans, than over bright surfaces, such as          V4.3 (North and Heckel, 2017) advances on previous ver-
deserts (e.g. Hsu et al., 2004).                                       sions by improved surface modelling and shows reduced pos-
                                                                       itive bias over bright surfaces. Retrieval uncertainty and com-
2.1.4   MODIS data                                                     parison with sun photometer observations show highest accu-
                                                                       racy retrieval over ocean and darker surfaces, with higher un-
Daily gridded level 3 AOD data from the Moder-                         certainty over bright surfaces (e.g. desert, snow) and for large
ate Resolution Imaging Spectroradiometer (MODIS)                       zenith angles (Popp et al., 2016). This study uses the level
have been used from both satellite platforms (Terra                    3 output, which is provided at daily and monthly 1◦ × 1◦
and Aqua) for evaluation of the models. The                            resolution, intended for climate model comparison. Specif-
merged land and ocean global product (named                            ically, AATSR SU values for AE and total, fine, and coarse
AOD_550_Dark_Target_Deep_Blue_Combined_Mean                            AODs are used. The AE calculation is only performed for
in the product files) of the recent collection 6.1 was used.           0.05 < AOD < 1.5 due to increased retrieval uncertainty of
This is an updated and improved version of collection 6 (e.g.          AE at low and high AODs.
Levy et al., 2013; Sayer et al., 2014). For changes between               In comparison with AERONET, the AATSR data exhibit
both data sets, see Hubanks (2017).                                    an AOD bias of ∼ −4 %, suggesting a slight underestima-
   Details about the MODIS data sets used are provided in              tion of AOD at AERONET sites, in contrast to the two
Table 1. Compared to AERONET, both Aqua and Terra ex-                  MODIS products used (see Table 1). To our knowledge, this
hibit positive AOD biases, suggesting an overestimation of             AATSR product (SU V4.3) has not been evaluated against
ca. +9 % and +17 %, respectively, at AERONET sites and                 AERONET in the literature. Thus, these results comprise an
for the year 2010 (for details, see Supplement 2). The larger          important finding of this study. Biases of AODf , AODc , and
overestimate for Terra is in agreement with the findings from          AE against AERONET were found to be +1.6 %, −14.7 %,
Hsu et al. (2004).                                                     and +14.3 %, respectively (see web visualisation; Mortier
                                                                       et al., 2020a).
2.1.5   AATSR SU v4.3 data                                                Initial comparisons within the CCI Aerosol project sug-
                                                                       gest that the fine-mode fraction of total AOD may be overes-
The AATSR SU v4.3 data set provides gridded AOD and as-                timated over the ocean, with consequently some high bias in
sociated parameters from the Advanced Along Track Scan-                AE. The AE provided by AATSR is estimated for the range
ning Radiometer (AATSR) instrument series, developed by                550–870 nm, and some difference may also be expected with
Swansea University (SU) under the ESA Aerosol Climate                  AERONET-derived AE using a different wavelength range
Change Initiative (CCI). The AATSR instrument on EN-                   (e.g. Schuster et al., 2006).
VISAT covers the period 2002–2012, and in this study, data
from 2010 are used. The instrument’s conical scan provides
two near-simultaneous views of the surface, at solar reflec-
tive wavelengths from 555 nm to 1.6 µm.

Atmos. Chem. Phys., 21, 87–128, 2021                                                       https://doi.org/10.5194/acp-21-87-2021
J. Gliß et al.: AeroCom phase 3 optical properties’ evaluation 95
2.1.6 Merged satellite AOD data sea salt) which cannot be obtained from the land-dominated,
ground-based observation networks. The AE from AATSR-
The MERGED-FMI data set, developed by the Finnish Me- SU shows a latitudinal southwards decreasing gradient in re-
teorological Institute, includes gridded level 3 monthly AOD mote ocean regions, indicating dominance of coarse(r) parti-
products merged from 12 available satellite products (So- cle size distributions, which is likely due to cleaner and, thus,
gacheva et al., 2020). It should be noted that MODIS and more sea-salt-dominated regions. Transatlantic dust transport
AATSR products are considered inside this MERGED-FMI results in an increased particle size west of the Sahara (e.g.
data set. It is available for the period 1995–2017; however, Kim et al., 2014) as is captured by AATSR-SU. Finally, it
here only 2010 data are used. is difficult to observe global patterns in the in situ scatter-
Compared to AERONET measurements from 2010, this ing and absorption data due to the limited spatial coverage
merged satellite product has shown excellent performance of the measurements, as can be seen in the lowermost panels
with the highest correlation (R = 0.89) among the four satel- (Fig. 1g, h). The differences in the spatial coverage for each
lites used and only a slight underestimation of AOD (bias of observation data set will be important to keep in mind when
−5.4 %) at AERONET sites (see Supplement 2 and Mortier interpreting the results presented in Sect. 4.
et al., 2020a). The merging method is based on the re-
sults of the evaluation of the individual satellite AOD prod- 2.2 Models
ucts against AERONET. These results were utilised to in-
fer a regional ranking, which was then used to calculate a This study uses output from 14 models that are participating
weighted AOD mean. Because it is combined from the in- in the AeroCom AP3-CTRL experiment. Details on the Ae-
dividual products of different spatial and temporal resolu- roCom phase III experiments can be found on the AeroCom
tion, the AOD merged product is characterised by the best wiki page (AeroCom wiki, 2020). The wiki also includes in-
possible coverage, compared with other individual satellite formation on how to access the model data from the differ-
products. The AOD merged product is at least as capable ent AeroCom phases and experiments, which are stored in
of representing monthly means as the individual products the AeroCom database. Note that the database location and
(Sogacheva et al., 2020). Standard pixel-level uncertainties information about it might change in the future; the inten-
for the merged AOD product were estimated as the root tion is however to keep updated information available via
mean squared sum of the deviations between that product the website: https://aerocom.met.no (last access: 14 Septem-
and eight other merged AOD products calculated with dif- ber 2020). Table 2 provides an overview of the models used
ferent merging approaches applied for different aerosol types in this paper. For the AP3-CTRL experiment, modellers were
(Sogacheva et al., 2020). asked to submit simulations of at least the years 2010 and
1850, with 2010 meteorology and prescribed (observed) sea
2.1.7 Global distribution of optical properties surface temperature and sea ice concentrations, and using
investigated emission inventories from CMIP6 (Eyring et al., 2016), when
possible. Details concerning the anthropogenic and biomass
The previous sections introduced the individual ground- and burning emissions are given in the Community Emissions
space-based observation records and optical properties vari- Data System (CEDS; Hoesly et al., 2018) and in biomass
ables that will be used in this paper for the model assess- burning emissions for CMIP6 (BB4CMIP; van Marle et al.,
ment. Figure 1 provides an overview of the global distribu- 2017). In this paper, only the 2010 model output is used. The
tion of these optical properties. The global maps displayed year 2010 was chosen as a reference year by the AeroCom
show annual mean values of all variables considered, both consortium and is used throughout many phase II and III
for the ground-based networks and for a selection of the experiments for the inter-comparability of different experi-
satellite observations. Figure 1a, c, and d show yearly av- ments and model generations. The AeroCom phase I simula-
erage mean values of the observed AERONET AODs (total, tions (e.g. Dentener et al., 2006; Kinne et al., 2006; Schulz
coarse, and fine, respectively). Column Ångström exponents et al., 2006; Textor et al., 2006) used the year 2000 as a ref-
from AERONET are shown in Fig. 1e. Dust-dominated re- erence year. One of the main reasons to update the reference
gions such as northern Africa and south-west Asia are clearly year from 2000 to 2010 was that many more observations
visible both in the coarse AOD and the AE but also in the became available between 2000 and 2010 and also to ac-
total AOD, indicating the importance of dust for the global count for changes in the present-day climate, for instance,
AOD signal. The satellite observations of AOD (MERGED- due to changing emissions and composition (e.g. Klimont
FMI) and AE (ATSR-SU) (Fig. 1b, f) are particularly use- et al., 2013; Aas et al., 2019; Mortier et al., 2020b).
ful in remote regions and over the oceans, where ground- Detailed information about the models on emissions, hu-
based measurements are less common. Thus, they add sub- midity growth, and particularly their treatment of aerosol op-
stantially to the global picture when assessing models. For tics has been collected from the modelling groups through a
example, satellites capture the nearly constant AOD back- questionnaire. The tabulated responses are provided in Sup-
ground of around 0.1 over the ocean (mostly arising from plement 1. The first table (spreadsheet “Table: General ques-
https://doi.org/10.5194/acp-21-87-2021 Atmos. Chem. Phys., 21, 87–128, 202196 J. Gliß et al.: AeroCom phase 3 optical properties’ evaluation
Table 2. Models used in this study including relevant additional information. Kinne et al. (2006): name of model in Kinne et al. (2006) (see
Table 2 therein, where applicable). Lat./long.: horizontal grid resolution. Levs.: number of vertical levels. Type: type of atmospheric model.
Aerosol module: name of aerosol module. Scheme: type of aerosol scheme. Meteorology: meteorological data set used for the simulated
year 2010. CS: clear-sky optics available (Y/N). AC: availability of dry surface absorption coefficient fields for comparison with GAW
observations. References: key references. More details about the models can be found in Supplement 1 and 2.
Model name
This study Kinne et al. (2006) Lat./long. Levs. Type Aerosol Scheme Meteorology CS AC References
module
CAM5-ATRAS NA 1.9 × 2.5 30 GCM ATRAS Sectional MERRA2 Y Dry Matsui (2017), Matsui
(nudged, above and Mahowald (2017)
800 hPa)
EC-Earth3-AerChem NA 2.0 × 3.0 34 GCM TM5-M7 Modal ECMWF-IFS Y Dry van Noije et al. (2014),
(online) van Noije et al. (2020)
TM5 TM5 2.0 × 3.0 34 CTM TM5-M7 Modal ERA-Interim Y Dry van Noije et al. (2014),
(driven) van Noije et al. (2020)
ECHAM-HAM MPI-HAM 1.9 × 1.9 47 GCM HAM-M7 Modal ERA-Interim Y Dry Tegen et al. (2019)
(nudged)
ECHAM-SALSA NA 1.9 × 1.9 47 GCM SALSA Sectional ERA-Interim Y Dry Bergman et al. (2012),
(nudged) Kokkola et al. (2018)
ECMWF-IFS NA 0.4 × 0.4 137 GCM AER Bulk/sectional ECMWF-IFS N Dry Rémy et al. (2019)
EMEP NA 0.5 × 0.5 20 CTM NA NA ECMWF-IFS N Dry Simpson et al. (2012),
(driven) Schulz et al. (2012)
GEOS GOCART 1.0 × 1.0 72 ESM GOCART Bulk MERRA2 N Dry Colarco et al. (2010),
(nudged)
GFDL-AM4 NA 1.0 × 1.2 33 GCM GOCART Bulk NCEP-NCAR N Amb. Zhao et al. (2018)
re-analysis
(nudged)
GISS-OMA GISS 2.0 × 2.5 40 ESM OMA Mass-based, NCEP-NCAR Y Dry Koch et al.
sectional for (2006, 2007), Tsi-
SS & DU garidis et al. (2013)
INCA LSCE 1.3 × 2.5 79 GCM INCA Modal ERA-Interim Y NA Balkanski et al. (2004),
(nudged) Schulz et al. (2009)
NorESM2 (CAM6-Nor) UIO_GCM 0.9 × 1.2 32 GCM OsloAero Production- ERA-Interim Y Dry Kirkevåg et al. (2018),
tagged (size- (nudged) Olivié et al. (2020), Se-
resolving land et al. (2020)
through offline
look-up tables)
OsloCTM3 UIO_CTM 2.2 × 2.2 60 CTM OsloCTM3 Bulk/sectional ECMWF-IFS N Dry Lund et al. (2018),
(driven) Myhre et al. (2009)
MIROC-SPRINTARS KYU 0.6 × 0.6 56 GCM SPRINTARS Modal ERA-Interim Y Amb. Takemura et al. (2005)
(nudged)
NA: not available
tions”) contains general information that applies to the total study. These are needed for the comparison with the GAW
aerosol, such as mixing assumptions, treatment of clear-sky surface in situ observations (Sect. 2.1.2). Note that in a few
optics, and water uptake parameterisations. The second ta- cases, some diagnostic fields used in this study could not be
ble (spreadsheet “Table: Species-specific”) contains aerosol provided by some of the modelling groups.
species-specific information such as the complex refractive To obtain model values that were comparable with obser-
index at 550 nm, humidity growth factors, and particle den- vations, additional processing was required for some vari-
sity, as well as details regarding the emission data sets used. ables. The AODc fields were not directly submitted but were
Further information related to OA emissions and secondary computed as the difference: AOD – AODf . The AE fields
formation is provided for most models in a third spreadsheet were computed from the provided AOD at 440 and 870 nm2
(“Table: OA details”). In addition, Sect. S4 of Supplement 2 via AE = − ln(AOD440 /AOD870 )/ ln(440/870). Dry scatter-
provides further information on each of the models, mostly ing coefficients (SCdry ), for the comparison with the sur-
complementary to Table 2. face in situ data, were computed via SCdry = ECdry − ACdry .
Some of the models that provided these data submit-
2.2.1 Model diagnostics ted dry EC but ambient AC (indicated in Table 2). For
these models, dry scattering was derived in the same way,
Requested diagnostics fields for AP3-CTRL are available SCdry = ECdry − ACamb , consistent with the idea that absorb-
online (see AeroCom diagnostics sheet, 2020). In addition, ing aerosol tends to be hydrophobic. The latter may be vio-
variables for dry (at RH = 0 %) extinction (ECdry ) and ab-
sorption (ACdry ) coefficients were requested (at model sur- 2 For GISS-OMA, 550 and 870 nm AODs were used for AE cal-
face level) from the modelling groups participating in this culation as 440 nm AOD data were missing.
Atmos. Chem. Phys., 21, 87–128, 2021 https://doi.org/10.5194/acp-21-87-2021J. Gliß et al.: AeroCom phase 3 optical properties’ evaluation 97
lated to some degree for models that include internally mixed 2.3 Data processing and statistics
BC modes with hydrophilic species, such as SO4 . However,
an investigation of differences between dry and ambient ab-
sorption coefficients revealed that the overall impact on the Most of the analysis in this study was per-
results is minor, both for models with internally mixed BC formed with the software pyaerocom (Zenodo:
modes and for models with externally mixed modes. https://doi.org/10.5281/zenodo.4362479, Gliß et al.,
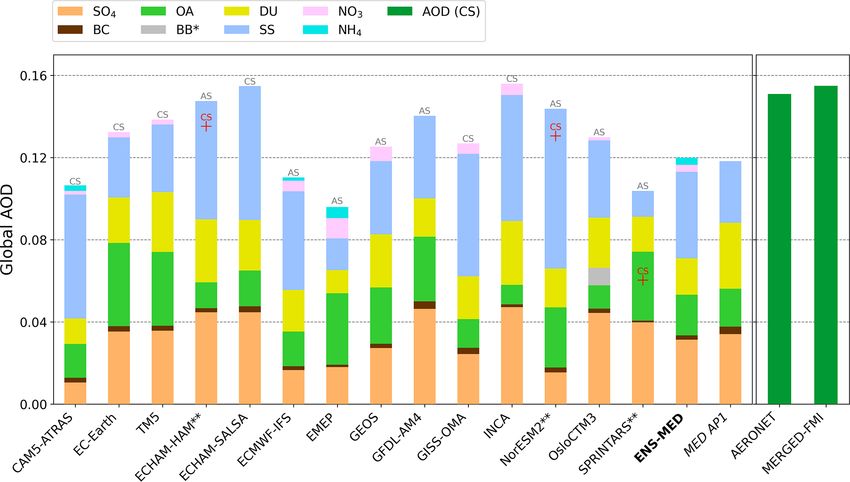
Some of the models reported the columnar optical prop- 2020). pyaerocom is an open-source Python software project
erties based on clear-sky (CS) assumptions, while others that is being developed and maintained for the AeroCom
assumed all-sky (AS) conditions to compute hygroscopic initiative, at the Norwegian Meteorological Institute. It
growth and extinction efficiencies. These choices are indi- provides tools for the harmonisation and co-location of
cated in Table 2, and details related to the computation of CS model and observation data and dedicated algorithms for the
optics can be found in Supplement 1. assessment of model performance at all scales. Evaluation
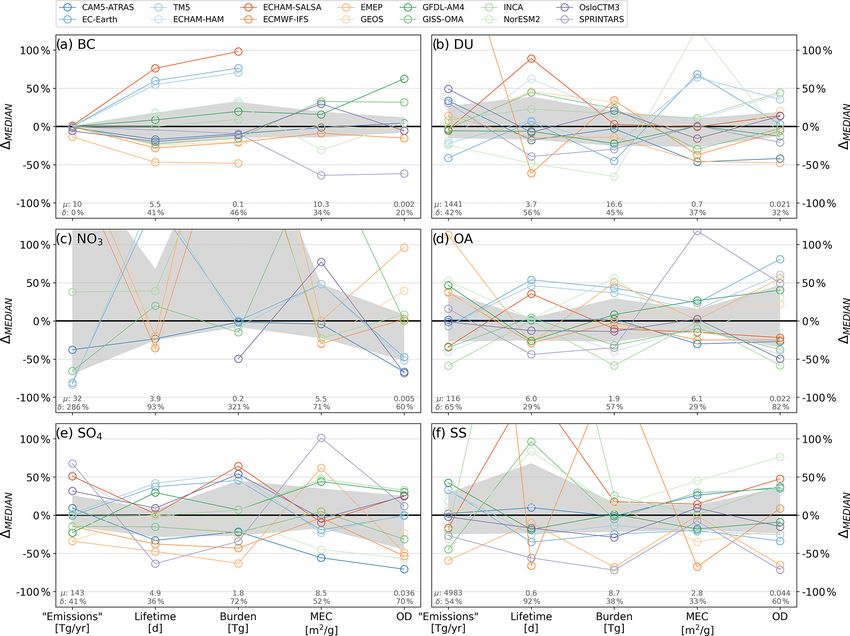
The following modelled global average values have been results from different AeroCom experiments are uploaded
retrieved of species-specific model parameters to be com- to a dedicated website that allows exploration of the model
pared in Sect. 3 in order to assess life cycle aspects of model and observation data and evaluation metrics. The website
diversity: includes interactive visualisations of performance charts
(e.g. biases, correlation coefficients), scatter plots, bias
1. Emissions and formation of aerosol species were re-
maps, and individual station and regional time series data,
trieved (in units of Tg/year). The secondary aerosol for-
for all models and observation variables, as well as bar charts
mation of SO4 , NO3 , and OA by chemical reactions in
summarising regional statistics. All results from the optical
the atmosphere is difficult to diagnose. Thus, it is diag-
properties’ evaluation discussed in this paper are available
nosed here from total deposition output.
via a web interface (see Mortier et al., 2020c).
2. Lifetimes of major aerosol species (in units of days) The ground- and space-based observations are co-located
were computed from column burden and provided with the model simulations by matching them with the clos-
wet+dry deposition rates. The lifetimes can give in- est model grid point in the model resolution originally pro-
sights into the efficiency of removal processes in the vided.
models. In the case of ground-based observations (AERONET and
GAW in situ), the model grid point closest to each mea-
3. Global mass burdens were provided (in units of Tg) for surement site is used. For the satellite observations, both the
each species. These values enable comparisons amongst model data and the (gridded) satellite product are re-gridded
the models in terms of aerosol amount present on aver- to a resolution of 5◦ × 5◦ , and the closest model grid point to
age. each satellite pixel is used. The choice of this rather coarse
4. Modelled speciated optical depths (ODs) at 550 nm resolution is a compromise, mostly serving the purpose of in-
were provided. This unitless quantity provides another creasing the temporal representativity (i.e. more data points
way of looking at contributions from different species to per grid cell) in order to meet the time resampling constraints
total AOD based on their optical properties rather than (defined below). For the comparison of satellite AODs with
their burden. models, a minimum AOD of 0.01 was required, due to the
increased uncertainties related to satellite AOD retrievals at
5. Modelled mass extinction coefficients (MECs, in units low column burdens. The low AODs were filtered in the orig-
of m2 /g) at 550 nm were calculated for each species by inal resolution of the level 3 gridded satellite products, prior
dividing the species optical depth by the corresponding to the co-location with the models.
species mass burden (e.g. ODDU /LOADDU ). The MEC Since many model fields were only available in monthly
determines the conversion of aerosol mass to light ex- resolution, the co-location of the data with the observations
tinction and can provide insights into the variability of (and the computation of the statistical parameters used to
modelled size distributions or hygroscopicity. compare the models) was performed in monthly resolution.
Any model data provided in higher temporal resolution were
6. Additionally, modelled mass absorption coefficients
averaged to obtain monthly mean values, prior to the analy-
(MACs) at 550 nm for light-absorbing species (BC,
sis. For the higher resolution observations (see Table 1), the
DU, organic carbon (OC)) were calculated by di-
computation of monthly means was done using a hierarchi-
viding the species absorption optical depth (AAOD)
cal resampling scheme, requiring at least ∼ 25 % coverage.
by the corresponding species mass burden (e.g.
Practically, this means that the daily AERONET data were
AAODBC /LOADBC ).
resampled to a monthly scale, requiring at least seven daily
We note again that detailed introductions for each model values in each month. For the hourly in situ data, first a daily
are provided in Supplement 1 and in Sect. S4 of Supplement mean was computed (requiring at least six valid hourly val-
2, in addition to the summary in Table 2. ues), and from these daily means, monthly means were com-
https://doi.org/10.5194/acp-21-87-2021 Atmos. Chem. Phys., 21, 87–128, 202198 J. Gliß et al.: AeroCom phase 3 optical properties’ evaluation
puted, requiring at least seven daily values. Data that did not puted as follows: δstd = σ/ (ensemble mean), where σ is the
match these coverage constraints were invalidated. standard deviation.
Throughout this paper, the discussion of the results will Note that the ensemble AE fields were computed from the
use two statistical parameters to assess the model perfor- individual models’ AE fields. In the case of the ensemble
mance: the normalised mean bias (NMB) is defined as median, this will give slightly different results compared to a
P N
i (mi −oi ) computation of a median based on median 440 and 870 AOD
NMB = PN , where mi and oi are the model and ob-
i oi fields. This is because the median computation is done in AE
servational mean, respectively, and the Pearson correlation space and not in AOD space.
coefficient (R). More evaluation metrics, such as normalised Please also note that the ensemble total AOD includes re-
RMSE or fractional gross error, are available online in the sults from INCA which are not included in AODf and AODc .
web visualisation (Mortier et al., 2020c) but are not further This results in a slightly smaller total AOD in the ensemble
considered within this paper. when inferred from AODf + AODc (which does not include
Section 4.5 presents several sensitivity studies that were INCA) compared to the computed AOD field (which includes
performed in order to investigate the spatio-temporal rep- INCA).
resentativity of this analysis strategy, which is based on
network-averaged, monthly aggregates. This was done be- 2.3.2 Model STP correction for comparison with GAW
cause representativity (or lack thereof) comprises a major in situ data
source of uncertainty (e.g. Schutgens et al., 2016, 2017;
Sayer and Knobelspiesse, 2019). The focus here was to as- Since the GAW in situ measurements are reported at STP
sess how such potential representation errors affect the biases conditions (Sect. 2.1.2), the 2010 monthly model data were
and correlation coefficients used in this paper to assess the converted to STP using the following formula:
model performance and comparison with other models.
Pstd
Tamb
XSTP = Xamb × · . (1)
Pamb Tstd
2.3.1 AeroCom ensemble mean and median
XSTP and Xamb are the model value of absorption (or scat-
tering) at STP and ambient conditions, respectively. Pamb and
For all variables investigated in this paper, the monthly Ae-
Tamb are the ambient air pressure and temperature at the cor-
roCom ensemble mean (ENS-MEAN) and median (ENS-
responding site location. The correction factor was estimated
MED) fields were computed and have been made available in
on a monthly basis, where Pamb was estimated based on the
the AeroCom database, for future reference. This was done
station altitude (using the barometric formula and assuming
in order to enable an assessment of the AP3 model ensem-
a standard atmosphere implemented in the python geonum
ble, which we consider to represent the most likely modelling
library; Gliß, 2017), and Tamb was estimated using monthly
output of the state-of-the-art aerosol model versions partici-
near-surface (2 m) temperature data from ERA5 (2019). This
pating in the AP3-CTRL exercise.
correction may introduce some statistic error, mostly due to
The ensemble fields were computed in a latitude–
natural fluctuations in the pressure and possible uncertainties
longitude resolution of 2◦ ×3◦ , which corresponds to the low-
in the ERA5 temperature data. However, we assess this addi-
est available model resolution (i.e. of models EC-Earth and
tional uncertainty to be small for the annual average statistics
TM5; see Table 2). Model fields were all re-gridded to this
discussed below.
resolution before the ensemble mean and median were com-
puted. In this paper, only the output from the median model
is used. Note that results from the mean model are not fur- 3 Results and discussion – model diversity of aerosol
ther discussed below but are available online (see Mortier life cycle and optical properties
et al., 2020c). In addition to the median (50th percentile), the
25th (Q1) and 75th (Q3) percentiles were also computed and The focus of this section is to establish a global picture and to
evaluated against the observations like any other model. This try to understand model diversity in relevant parameters re-
was done to enable an assessment of model diversity in the lated to the aerosol life cycle (i.e. global emissions, lifetimes,
retrieved biases and correlation coefficients. and burdens) as well as the simulated aerosol optical proper-
In addition, local diversity fields were computed for each ties (i.e. speciated MECs, MACs, and ODs). The goal is to
variable by dividing the interquartile range (IQR = Q1–Q3) develop an understanding of how, based on the models, pro-
by the ensemble median: δIQR = IQR/median, which corre- cesses and parameterisations link emissions to optical prop-
sponds to the central 50 % of the models as a measure of di- erties. A comparison of modelled optical properties with the
versity (this is different than Kinne et al., 2006, who use the various observation records is presented in Sect. 4.
central 2/3). Note that the IQR is not necessarily symmetrical Most of the discussion in this section focuses on the
with respect to the median. In order to enable a better com- model ensemble median and associated diversities (δIQR ).
parison with the AP1 results from Textor et al. (2006) and Section 3.1 focuses on diversity in the treatment of the differ-
Kinne et al. (2006), a second set of diversity fields was com- ent aerosol species in the models, starting with an overview
Atmos. Chem. Phys., 21, 87–128, 2021 https://doi.org/10.5194/acp-21-87-2021You can also read