Quantifying the range of the dust direct radiative effect due to source mineralogy uncertainty - Recent
←
→
Page content transcription
If your browser does not render page correctly, please read the page content below
Atmos. Chem. Phys., 21, 3973–4005, 2021
https://doi.org/10.5194/acp-21-3973-2021
© Author(s) 2021. This work is distributed under
the Creative Commons Attribution 4.0 License.

Quantifying the range of the dust direct radiative effect due to
source mineralogy uncertainty
Longlei Li1 , Natalie M. Mahowald1 , Ron L. Miller2 , Carlos Pérez García-Pando3,8 , Martina Klose3,9 ,
Douglas S. Hamilton1 , Maria Gonçalves Ageitos3,10 , Paul Ginoux4 , Yves Balkanski5 , Robert O. Green6 ,
Olga Kalashnikova6 , Jasper F. Kok7 , Vincenzo Obiso2,3 , David Paynter4 , and David R. Thompson6
1 Department   of Earth and Atmospheric Sciences, Cornell University, Ithaca, NY, United States
2 NASA    Goddard Institute for Space Studies, New York, NY, United States
3 Barcelona Supercomputing Center, Barcelona, Spain
4 Geophysical Fluid Dynamics Laboratory, Princeton, NJ, United States
5 Laboratoire des Sciences du Climat et de I’Environnement, UMR 8212 CEA-CNRS-UVSQ-UPSaclay,

Gif-sur-Yvette CEDEX, France
6 Jet Propulsion Laboratory, California Institute of Technology, Pasadena, CA, USA
7 Atmospheric and Oceanic Sciences, University of California, Los Angeles, CA, United States
8 ICREA, Catalan Institution for Research and Advances Studies, Barcelona, Spain
9 Institute of Meteorology and Climate Research (IMK-TRO), Department Troposphere Research, Karlsruhe Institute of

Technology (KIT), Karlsruhe, Germany
10 Department of Project and Construction Engineering, Technical University of Catalonia, Terrassa, Spain

Correspondence: Longlei Li (ll859@cornell.edu)

Received: 3 June 2020 – Discussion started: 15 September 2020
Revised: 10 January 2021 – Accepted: 11 January 2021 – Published: 17 March 2021

Abstract. The large uncertainty in the mineral dust direct     tion of iron oxides to the total dust composition. The global
radiative effect (DRE) hinders projections of future climate   net (shortwave plus longwave) TOA DRE is estimated to be
change due to anthropogenic activity. Resolving modeled        within −0.23 to +0.35 W m−2 . Approximately 97 % of this
dust mineral speciation allows for spatially and temporally    range relates to uncertainty in the soil abundance of iron ox-
varying refractive indices consistent with dust aerosol com-   ides. Representing iron oxide with solely hematite optical
position. Here, for the first time, we quantify the range in   properties leads to an overestimation of shortwave DRE by
dust DRE at the top of the atmosphere (TOA) due to cur-        +0.10 W m−2 at the TOA, as goethite is not as absorbing as
rent uncertainties in the surface soil mineralogical content   hematite in the shortwave spectrum range. Our study high-
using a dust mineral-resolving climate model. We propagate     lights the importance of iron oxides to the shortwave DRE:
observed uncertainties in soil mineral abundances from two     they have a disproportionally large impact on climate con-
soil mineralogy atlases along with the optical properties of   sidering their small atmospheric mineral mass fractional bur-
each mineral into the DRE and compare the resultant range      den (∼ 2 %). An improved description of iron oxides, such
with other sources of uncertainty across six climate models.   as those planned in the Earth Surface Mineral Dust Source
The shortwave DRE responds region-specifically to the dust     Investigation (EMIT), is thus essential for more accurate es-
burden depending on the mineral speciation and underlying      timates of the dust DRE.
shortwave surface albedo: positively when the regionally av-
eraged annual surface albedo is larger than 0.28 and nega-
tively otherwise. Among all minerals examined, the short-
wave TOA DRE and single scattering albedo at the 0.44–
0.63 µm band are most sensitive to the fractional contribu-

Published by Copernicus Publications on behalf of the European Geosciences Union.
3974                                                      L. Li et al.: Quantifying the range of the dust direct radiative effect

1   Introduction                                                    Kumar et al., 2014); (3) the liquid water uptake rate and
                                                                    ice nucleation ability of dust is determined by its hygro-
Mineral dust emitted from erodible land surfaces has myr-           scopicity, size, and shape and is thus related to the physio-
iad impacts on the Earth system and human society by per-           chemical properties of the minerals (e.g., feldspar) (Karydis
turbing the radiation budget (Tegen and Fung, 1994; Sokolik         et al., 2011; Atkinson et al., 2013); (4) after atmospheric pro-
and Toon, 1996), interacting with cloud processes (Rosen-           cessing, iron-bearing minerals (e.g., hematite, goethite, illite,
feld et al., 2001; DeMott et al., 2003; Mahowald and Kiehl,         and hydroxide) contained in dust aerosols contribute a large
2003; Atkinson et al., 2013), affecting ocean and land bio-         fraction of the atmospheric bioavailable iron flux to remote
geochemical cycles (Swap et al., 1992; Jickells et al., 2005;       ocean regions. This can cause dust–iron fertilization to oc-
Mahowald et al., 2017), causing respiratory and cardiovas-          cur and thus influences ocean marine primary productivity
cular disease (Meng and Lu, 2007), contributing to other            and biomass accumulation (Meskhidze et al., 2003; Jour-
ailments like meningitis (Pérez García-Pando et al., 2014),         net et al., 2008; Schroth et al., 2009); and (5) phosphorus-
and modifying atmospheric chemistry (Dentener et al., 1996;         bearing minerals are important for marine and terrestrial bio-
Martin et al., 2003). Dust aerosol (here defined as soil parti-     geochemistry effects, for example, the North Pacific Ocean
cles suspended in the atmosphere) perturbs the radiative en-        and Amazon rainforest (Swap et al., 1992; Okin et al., 2004;
ergy balance directly by scattering and absorbing shortwave         Letelier et al., 2019). Currently, the soil mineral composi-
and longwave radiation, known as the aerosol–radiation in-          tions required by dust-speciated models are provided by ei-
teraction (Boucher et al., 2013), and indirectly by changing        ther Claquin et al. (1999) (C1999 hereafter) – with additional
the cloud albedo and lifetime by acting as cloud condensation       extrapolation to other soil types (three new soil units and soil
nuclei (CCN) and ice nuclei (IN) (Nenes et al., 2014) and by        phosphorous) proposed by Nickovic et al. (2012) – or Journet
increasing diabatic heating in the atmosphere and evaporat-         et al. (2014) (J2014 hereafter). The mineral composition of
ing cloud (Hansen et al., 1997; Bollasina et al., 2008; Jacob-      clay- (between 0 and 2 µm diameter) and silt-sized (between
son, 2012), known as the aerosol–cloud interaction (Boucher         2 and 63 µm diameter) particles is assumed to be related to
et al., 2013). Through interactions with radiation and cloud,       the soil type in C1999 and the soil unit in J2014. Because of
dust can feed back upon meteorology in the planetary bound-         limited measurements, many of which are not located in ma-
ary layer, the large-scale circulation, and the energy, water,      jor dust emission regions, global atlases of soil mineral dis-
and carbon cycles (Miller and Tegen, 1999; Perlwitz et al.,         tribution are based on extensive extrapolation and thus have
2001; Pérez et al., 2006; Solmon et al., 2008; Lau et al., 2009;    a large uncertainty (Claquin et al., 1999; Journet et al., 2014;
Mahowald et al., 2011; Shao et al., 2011).                          Perlwitz et al., 2015a, b; Scanza et al., 2015).
   At the global scale, mineral dust is estimated to warm the          A technique to model dust aerosol optical properties, ac-
atmosphere and cool the Earth’s surface in the shortwave            counting for their physicochemical characteristics, was pro-
spectral range and induces opposite effects in the longwave         posed by Sokolik and Toon (1999). The authors demon-
spectral range (Sokolik and Toon, 1996; Kok et al., 2017).          strated, via offline radiative transfer calculations, that the
However, these estimates are currently highly uncertain. A          DRE by mineral dust was highly dependent on the repre-
recent review which synthesized data on dust abundance, op-         sentation of its mineral-specific absorption properties. They
tical properties, and size distribution estimated that at the top   suggested that internal mixing of iron oxides (hematite and
of the atmosphere (TOA) the shortwave, longwave, and net            goethite) with less absorptive minerals enhances the absorp-
direct radiative effects (DREs) of dust range between [−0.81,       tion of shortwave radiation and can reverse the sign from a
−0.15], [0.17, 0.48], and [−0.48, +0.20] W m−2 , respec-            negative (cooling) to positive (warming) DRE at the TOA.
tively (Kok et al., 2017). This degree of uncertainty in the        Later studies (Alfaro et al., 2004; Lafon et al., 2006; Balka-
net DRE of dust constitutes an important gap in our under-          nski et al., 2007; Formenti et al., 2014; Li and Sokolik,
standing of the role it plays in climate.                           2018) confirmed the importance of iron oxides to the short-
   Much of the DRE uncertainty can be attributed to un-             wave dust DRE, particularly near dust source areas, even
certainties in the dust aerosol composition and its evolu-          when they are mixed with particles that are also strongly ab-
tion during transport (Hand et al., 2004; Baker and Croot,          sorbing (e.g., black carbon) (Alfaro et al., 2004). Two main
2010; Shao et al., 2011). Most of the abovementioned im-            types of iron-oxide minerals are found in soils: hematite and
pacts of dust aerosols on climate are closely related to the        goethite (Journet et al., 2014). Iron in both minerals is gener-
composition of minerals in dust particles: (1) the dust DRE         ally to be found in a (III) oxidation state, but they have dis-
in some longwave bands depends on quartz or calcite, and            tinct optical properties in the shortwave spectrum: hematite
across many shortwave bands dust strongly depends on the            exhibits a more pronounced spectral absorption and has a
iron-oxide content and its mixing state with other minerals         comparatively stronger ability to absorb shortwave radiation
(Sokolik et al., 1998; Sokolik and Toon, 1999); (2) chemi-          than goethite. Consequently, the calculated estimates of the
cal reactions occurring on the dust particle surface depend         single scattering albedo (SSA) for hematite– and goethite–
on dust minerals (particularly, calcite) and chemical compo-        clay aggregates, with the same size distribution, are signif-
sition (Dentener et al., 1996; Hanisch and Crowley, 2003;           icantly different (Lafon et al., 2006). Iron oxides represent

Atmos. Chem. Phys., 21, 3973–4005, 2021                                               https://doi.org/10.5194/acp-21-3973-2021
L. Li et al.: Quantifying the range of the dust direct radiative effect                                                      3975

2.4 %–4.5 % of the total dust mass (Formenti et al., 2008),         certainty, including the mineral vertical and size distribu-
although a slightly larger range (0.7 %–5.8 %) of iron oxides       tions, cloud processes, surface albedo (Liao and Seinfeld,
in dust was reported in a more recent study (Di Biagio et al.,      1998; Li and Sokolik, 2018), and mixing and interaction
2019). Northern African samples exhibited a dominance of            of dust with pollution aerosols (Li and Shao, 2009; Huang
goethite over hematite (percentage mass content of iron ox-         et al., 2010; Tobo et al., 2010). In addition to C1999,
ides: 52 %–78 % versus 22 %–48 %, respectively) (Formenti           as used in previous studies (Scanza et al., 2015; Perlwitz
et al., 2014). The partitioning of these two iron oxides is thus    et al., 2015a), we incorporate results using the updated
necessary to accurately estimate the DRE, because of the dif-       J2014 soil mineralogical atlas, which separates iron ox-
ference in their optical properties and a strong regional vari-     ides into hematite and goethite. We focus on the sensitiv-
ation in their soil content (Lafon et al., 2006; Formenti et al.,   ity studies within only one model (CAM5) and then com-
2014; Di Biagio et al., 2019).                                      pare results to four other models, CAM6, GISS ModelE2,
   Because of the importance of physio-chemical character-          the Multiscale Online Non-hydrostatic AtmospheRe CHem-
istics of different dust minerals to estimating the dust DRE at     istry model (MONARCH; previously known as the Non-
shortwave bands, one focus for dust model development is on         hydrostatic multiscale model (NMMB) / Barcelona Super-
improving the representation of dust minerals (Scanza et al.,       computing Center (BSC) – chemical transport model (CTM),
2015; Perlwitz et al., 2015a) and their coupling with radia-        and Geophysical Fluid Dynamics Laboratory (GFDL) (see
tive transfer processes using mineral-specific optical prop-        Sect. 2.2 for model descriptions), to examine both paramet-
erties (Sokolik and Toon, 1999). Scanza et al. (2015) in-           ric and structural uncertainty sources.
troduced eight minerals (illite, kaolinite, smectite, hematite,
quartz, calcite, gypsum and feldspar) identified as climati-
cally important by C1999 into the Community Atmosphere              2     Methods
Model of version 4 (CAM4) and five minerals (illite, kaoli-
                                                                    2.1    Descriptions of soil mineralogy data
nite, smectite, hematite, and a bulk remainder mineral) into
version 5 (CAM5) based on C1999 (both CAM4 and CAM5                 Two datasets currently exist that can be used to describe the
are embedded within the Community Earth System Model:               size-resolved mineralogical composition for potential dust
CESM). Similarly, the eight minerals within CAM4 were               sources around the globe. For both datasets, the soil min-
included in the NASA Goddard Institute for Space Stud-              eralogical composition was inferred based on the hypothesis
ies (GISS) Earth System ModelE2 (Perlwitz et al., 2015a).           that the surface mineralogy depends on the size distribution
These previous studies exhibited the models’ limited ability        and physio-chemical properties (e.g., appearance color) of
to match the available observations of mineral fractions and        the soil.
ratios. This mismatch can be primarily attributed to the in-            The first dataset was originally created by Claquin et
herent limitations and uncertainties in the surface soil min-       al. (1999), who compiled measurements linking soil type
eralogy mapping (Perlwitz et al., 2015b; Scanza et al., 2015;       and mineral composition from the available literature. This
Y. Zhang et al., 2015) along with uncertainties in the models’      dataset contains information regarding an average relative
emission, transport, and deposition. Perlwitz et al. (2015a, b)     abundance of eight minerals (mean mineralogy table, MMT)
and Pérez García-Pando et al. (2016) show that despite these        in the clay-sized and silt-sized categories for 28 soil types
uncertainties, reconstructing the emitted mineral aggregates        that are considered wind erodible. Illite, kaolinite, and smec-
from the disturbed soil mineralogy atlases based upon brit-         tite (only present in the clay-sized category) frequently domi-
tle fragmentation theory (Kok, 2011) and additional empir-          nate over calcite and quartz among different soil types. In the
ical constraints better reproduces size-resolved mineralogy         silt-sized category, the dominant minerals are quartz and/or
and elemental composition observations. Scanza et al. (2015)        feldspar instead of hematite, gypsum, and calcite, except for
show that CAM underestimates the observed DRE efficiency            salt flats where calcite is dominant. Also included in C1999 is
near northern Africa. This underestimate could be attributed        the standard deviation of the mean mineral content for the 28
to difficulty of DRE retrieval along with the large uncer-          soil types. This study extends hematite to the clay-sized cat-
tainty in hematite in the C1999 soil mineralogy atlas, which        egory by assigning the same mass fraction as it is in the silt-
includes a range of iron-oxide abundance (0.0 %–7.0 % by            sized category and subtracting the same mass fraction from
weight).                                                            illite, consistent with recent studies (Balkanski et al., 2007;
   Here, for the first time, we undertake a detailed and sys-       Nickovic et al., 2012; Scanza et al., 2015; Perlwitz et al.,
tematic study of the sensitivity of the dust DRE resulting          2015a). The global atlas of arid surface mineralogy is created
from current uncertainties in soil mineral composition. We          following Claquin et al. (1999) and Scanza et al. (2015) via
compare the sensitivity of DRE to uncertainties in soil min-        the FAO/UNESCO WGB84 at 5 × 5 arcmin with soil legend
eral composition to those from other sources, such as the           from FAO/UNESCO Soil Map of the World in 1976 (Batjes,
range in measured complex refractive indices for dust min-          1997) using the MMT.
erals and dust burdens. In this study we focus on com-
position of dust and do not examine other sources of un-

https://doi.org/10.5194/acp-21-3973-2021                                             Atmos. Chem. Phys., 21, 3973–4005, 2021
3976                                                     L. Li et al.: Quantifying the range of the dust direct radiative effect

   The other soil mineral dataset presented in Journet et          is still under development, we apply a statistical relation-
al. (2014) (J2014) is an extension of C1999. It includes four      ship between simulated minerals and shortwave dust DRE
additional minerals, one (vermiculite) in the clay-sized soil      in CAM5 to predict the shortwave DRE (Sect. 2.3.4) based
category, two (mica and goethite) in the silt-sized category,      on simulated minerals in GISS ModelE2. The MONARCH
and one (chlorite) in both categories. The mean mineralog-         (Sect. 2.2.3) and GFDL models (Sect. 2.2.4) do not include
ical content was assigned to different soil units, as classi-      dust mineral speciation, so we use the DRE related to aerosol
fied by FAO (FAO-UNESCO, 1974: 135 soil units; FAO,                optical depth (AOD) for bulk dust (DOD) (Sect. 2.3.4).
1990: 193 soil units). The standard deviation is also pro-
vided, but only for a limited number of soil units. Com-           2.2.1   Community Earth System Model
pared to C1999, this more recent compilation is not con-
fined to the soil units that are located in arid and semi-         Dust mineral speciation (illite, kaolinite, montmorillonite,
arid areas and benefits from a use of more extensive liter-        hematite, quartz, calcite, feldspar, and gypsum) was incor-
ature. Nevertheless, there is a number of soil units lacking       porated for CAM4 (Scanza et al., 2015) and CAM5 (Scanza
mineralogical information (the mean mineralogical content          et al., 2015; Hamilton et al., 2019) using C1999. Here we add
and in particular the associated standard deviation), espe-        a new mineral tracer for goethite to CAM5 to use J2014 and
cially for the silt-sized soil class where the information is      adopt the incorporated CAM5 mineral species when using
scarce. The mean mineralogical content for these missing           C1999. Recently, a new CAM6 model for CESM2 was re-
soil units was thus characterized through assumptions rather       leased which was updated to an improved two-moment prog-
than observation-derived data. For iron oxides, which are rel-     nostic cloud microphysics, MG2 (Gettelman and Morrison,
evant to the DRE of dust, data are present for only 23 %           2015), from MG (Morrison and Gettelman, 2008) used in
of the reported soil units (∼ 45). We fill soil units without      CAM5. For this study, we incorporate the mineral specia-
the mean mineralogy content, including iron oxides, with the       tion of CAM5, closely related to the Department of Energy
mineralogical composition of the major soil unit they belong       model, the Energy Exascale Earth System Model (E3SM)
to. Our mineralogy atlases created according to this dataset       (Liu et al., 2016; Lauritzen et al., 2018; Caldwell et al.,
rely on the dominant soil unit at 0.5◦ × 0.5◦ resolution, as       2019), into the CAM6 model. Each mineral was separately
derived from the Harmonized World Soil Database v1.21              emitted, transported, and deposited in the model. Aerosols
(FAO/IIASA/ISRIC/ISSCAS/JRC, 2012) map at 30 arcsec of             including dust in both CAM5 and CAM6 are subdivided
horizontal resolution. Mean mineralogy values are then geo-        into interstitial (within the clear air) and cloud-borne (within
graphically assigned according to the relevant soil units.         clouds) particles for a better representation of advection and
                                                                   deposition processes, as documented in Liu et al. (2012). In
2.2    Model descriptions                                          the atmosphere each mineral interacts with the shortwave and
                                                                   longwave radiation.
Model sensitivity analysis in this paper focuses on results           The dust emission, transport, and deposition are simulated
from CESM. To assess a spread in the sensitivity of DRE to         by the Dust Entrainment And Deposition model (DEAD,
representations of dust cycles, we compare CESM to three           Zender et al., 2003) which has been implemented in the land
other models (GISS ModelE2, MONARCH, and GFDL),                    and atmosphere components of the CESM and described in
as described in this section. We employ three versions of          detail previously (Zender et al., 2003; Mahowald et al., 2006;
CAM in CESM following Scanza et al. (2015): the Bulk               Albani et al., 2014). The emission of dust occurs within non-
Aerosol Model (BAM) in the CAM4 (Neale et al., 2013) and           vegetated, dry soil regions and is initiated once a friction
the Modal Aerosol Model (MAM) in CAM5 (Hurrell et al.,             velocity threshold has been exceeded. The friction velocity
2013) and CAM6 (Danabasoglu et al., 2020). In these CAM            threshold is parameterized as a function of the soil state (e.g.,
versions, the DRE is calculated by speciating dust into min-       soil moisture, snow cover, surface crust, vegetation cover)
erals (Sect. 2.2.1). We construct perturbation sensitivity anal-   and near-surface meteorology (e.g., air density, horizontal
yses with CAM5 only (Sect. 2.3.1), as the DRE in CAM4 is           wind speed). Vegetation tends to protect the soil from wind
insensitive to dust minerals (Sect. “Uncertainty due to dust       erosion by reducing the energy transfer of wind momentum
minerals, burden, and imaginary complex refractive index”)         to the soil surface. This effect of vegetation on dust emis-
and the high-resolution CAM6 model is computationally ex-          sions is represented via a linear dependence on the leaf area
pensive (a factor of 10 times more core hours is required          index (LAI) (Mahowald et al., 2006). No dust emission oc-
in CAM6 compared to CAM5, particularly considering the             curs within grid cells with the LAI exceeding 0.3 m2 m−2 .
large number of simulations needed.                                The friction velocity threshold for dust entrainment to the
   Mineral composition is also calculated using an updated         atmosphere increases with soil moisture following a semi-
version of the NASA ModelE2.1 (Schmidt et al., 2014)               empirical relation between the threshold and soil moisture
(ModelE2 hereafter; Sect. 2.2.2) as described in Perlwitz et       obtained by Fécan et al. (1999) with additional optimization
al. (2015a, b) and Pérez García-Pando et al. (2016). Since         from the traditional dependence of the square of clay mass
the relation of the DRE to simulated minerals in this model        fraction (Fécan et al., 1999; Zender et al., 2003).

Atmos. Chem. Phys., 21, 3973–4005, 2021                                              https://doi.org/10.5194/acp-21-3973-2021
L. Li et al.: Quantifying the range of the dust direct radiative effect                                                        3977

Table 1. MAM mode size parameters in CAM5 and CAM6 by de-           (Wiscombe, 1980) with a spherical shape assumption and
fault. We reverted the coarse mode parameters in CAM6 to those in   prescribed aerosol size distribution independent of locations.
CAM5 in our CAM6 simulation.                                           The radiative flux at each vertical model layer, at 19
                                                                    (band centre range: 0.22–4.36 µm) and 14 (band centre
           Modes               Geometric             Geometric
                                                                    range: 0.23–3.46 µm excluding the broad Band 14 centered
                        standard deviation   mean diameter (µm)
                                                                    at 8.02 µm) shortwave bands (for CAM4 and CAM5/CAM6,
 CAM6      1: Accum                   1.6                  0.11     respectively) and 16 longwave bands (band centre range:
           2: Aitken                  1.6                 0.026     3.46–514.29 µm), is computed by the rapid radiative trans-
           3: Coarse                  1.2                  0.90
                                                                    fer method (RRTMG) for general circulation model (Iacono
           4: Primary                 1.6                  0.05
                                                                    et al., 2008) each model hour (two time steps) with the
 CAM5      1: Accum                   1.6                  0.11     aerosol optical properties determined from their composi-
           2: Aitken                  1.6                 0.026     tion, size, mass, etc. Specifically, in MAM, the aerosol op-
           3: Coarse                  1.8                    2.0
                                                                    tical properties (e.g., the specific scattering, specific absorp-
           4: Primary                 1.6                 0.020
                                                                    tion, and asymmetric parameter) of an internal mixture of
                                                                    aerosol components are expressed in terms of the wet sur-
                                                                    face mode radius and the wet refractive index of each com-
   The default dust model utilizes a prescribed soil erodibil-      ponent in each mode. Wet size and volume of aerosol are pre-
ity source function (Ginoux et al., 2001) which associates          dicted by assuming the hygroscopic growth following the κ-
dust emissions with topographical depressions where abun-           Köhler theory (Ghan and Zaveri, 2007) according to the dry
dant erodible sediment accumulates (Ginoux et al., 2001;            radius, density, and hygroscopicity of a particle and the am-
Zender et al., 2003; Mahowald et al., 2006). In this study,         bient relative humidity and temperature. The wet refractive
we use an updated physical dust emission scheme developed           index is calculated from the composition of the wet aerosol
by Kok et al. (2014a), based on the brittle fragmentation the-      and the refractive index of each component using the volume
ory (Kok, 2011) which has been shown to improve model–              mixing method. Aerosol optical properties are then param-
observation comparisons without the source function (Kok et         eterized via the Chebyshev polynomial, given the wet sur-
al., 2014b). The emitted size distribution of either bulk dust      face mode radius and wet refractive index of each compo-
(sum of all minerals or non-speciated dust) or minerals is as-      nent (Ghan and Zaveri, 2007). The refractive index of each
sumed to be independent of the soil properties of the source        mineral for each band implemented in CAM is derived from
location and wind speeds (Albani et al., 2014; Perlwitz et          Scanza et al. (2015) and shown in Fig. 1 for CAM5/6. It is
al., 2015a; Scanza et al., 2015) and currently only considers       worth noting here that the volume-averaging method applied
the likely climatologically most relevant diameter range from       to minerals to compute the bulk aerosol optical properties
0.01 to 10 µm. Each mode in CAM5 or CAM6 represents the             may lead to an artificially strong absorption relative to scat-
aerosol size distribution by a lognormal function with vary-        tering and thus a low SSA for bulk dust aerosol (X. L. Zhang
ing mode dry or wet particle radii. For CAM6, the default           et al., 2015; Li and Sokolik, 2018). We prescribe the density
size distribution uses a narrow coarse-mode width (geometric        of each mineral from Scanza et al. (2015) with the excep-
standard deviation: 1.2 compared to 1.8 in CAM5; Table 1)           tion of goethite, which was not included in that study; the
which does not adequately simulate size distribution of the         density of goethite is prescribed at 3800 kg m−3 . The same
dust aerosol mass. Thus, in the CAM6 simulations, we re-            hygroscopicity (0.068) is assumed for all minerals due to the
tain the mode size distribution of CAM5, which also enables         smaller influence of hygroscopicity on shortwave and long-
the use of the same fractional contributions of the clay- and       wave radiation compared to other optical properties (e.g., the
silt-sized soil to the dust aerosol mass for the accumulation       complex refractive index, dust mineralogy, and the size dis-
and coarse modes in CAM6 as in Scanza et al. (2015). The            tribution), also following Scanza et al. (2015). Due to lack of
emission of each mineral into the Aitken mode in CAM5 and           information about the optical properties of chlorite, vermi-
CAM6 is refined following that into the accumulation mode.          culite, and mica, we add the mass of chlorite and vermiculite
   Dust mineral species carried within each mode in CAM5            to kaolinite in the clay-sized category and merge chlorite,
and CAM6 are internally mixed with each other and with              vermiculite, and mica into one in the silt-sized category. We
other non-dust species (e.g., sea salt, sulfate, black carbon,      assume that the merged mineral has the same optical prop-
primary and/or secondary organic matter) in the same mode           erties as kaolinite. Such a treatment of these minerals for
under the homogenous assumption (the same proportions               which the optical properties are missing would not introduce
of each components in any individual aerosol particle) but          large errors in estimating the dust DRE uncertainty because
externally mixed between the different modes (Liu et al.,           (1) they are known to be much less absorbing at the short-
2012, 2016). In comparison, all aerosol species are exter-          wave bands than iron oxides; (2) the DOD is insensitive to
nally mixed in CAM4, but the optical properties for dust            the perturbed contents of these minerals within the uncer-
species (SSA, the extinction coefficient, and the asymme-           tainty range in soil, since the differences of the mass extinc-
try factor) are calculated offline using the MIEV0 software         tion efficiency of these minerals are not that big to make a

https://doi.org/10.5194/acp-21-3973-2021                                             Atmos. Chem. Phys., 21, 3973–4005, 2021
3978                                                     L. Li et al.: Quantifying the range of the dust direct radiative effect

considerable difference to the simulated global DOD. Thus,         by Miller et al. (2006) with an updated description of aerosol
no retuning procedure is required to retain DOD in all cases       wet deposition in Perlwitz et al. (2015a).
except the ones where we perturb DOD (see Sect. 2.3.1);               Prognostic calculation of dust mineral emissions (Perlwitz
and (3) our results (Sect. “Uncertainty due to dust minerals,      et al., 2015a, b; Pérez García-Pando et al., 2016) is done
burden, and imaginary complex refractive index”) will also         based upon the fractional mass abundance of eight miner-
show that the shortwave DRE is insensitive to minerals other       als within the soil, as derived from measurements of wet-
than iron oxides and that the longwave DRE is insensitive          sieved soils by C1999. For particle diameters < 10 µm, the
to all minerals we considered here. The optical properties of      emitted size distribution of each mineral (except quartz) fol-
goethite, which is known to strongly absorb shortwave radi-        lows a semi-empirical fit to measurements (Kok, 2011) that
ation, differ from those of hematite in terms of both intensity    account for the modification of the original soil size distri-
and spectral dependence (Sokolik and Toon, 1999; Lafon et          bution by wet sieving. For larger particle diameters (up to
al., 2006). Given no reliable set of spectral optical proper-      50 µm), the size distribution is constrained from in situ mea-
ties for goethite at bands of our interests, in the base studies   surements of mineral concentration (Kandler et al., 2009;
using J2014, we assume that goethite is highly absorptive          Carlos Pérez García-Pando, personal communication, 2019).
(only second to hematite with the imaginary refractive index          Each mineral is transported separately within five size bins
of goethite half of hematite), which is generally consistent       ranging from clay to silt diameters (0.10–2.0, 2.0–4.0, 4.0–
with previous calculations (Formenti et al., 2014), and has a      8.0, and 16–32 µm). Goethite and hematite are removed pref-
hygroscopicity identical to all other minerals.                    erentially due to their higher density (about 2-fold) compared
   CAM6 and CAM5(4) are configured with default hori-              to the remaining minerals. Hematite is also transported as a
zontal resolutions (longitude by latitude: 1.25◦ × 0.9◦ and        trace constituent as part of an internal mixture with the re-
2.5◦ × 1.9◦ , respectively). All CAM models use 56 verti-          maining minerals, allowing hematite to travel farther than
cal layers up to 2 hPa. Meteorology (horizontal wind, air          in its externally mixed (pure) form. Only mineralogy is pre-
temperature T , and relative humidity) is nudged toward            dicted in the model, so the DRE is estimated a posteriori us-
Modern-Era Retrospective analysis for Research and Appli-          ing the CAM results, as described later.
cations (MERRA) dynamics version 2 (CAM6) and version 1
(CAM4 and CAM5), for 2006–2011 with the simulated first            2.2.3   Model Multiscale Online Non-hydrostatic
year discarded as a model spin-up period. The nudging is up-               AtmospheRe CHemistry model
dated with a 6 h relaxation timescale. We use anthropogenic
emissions from AeroCom in CAM4, the Climate Model In-              The MONARCH model developed at the BSC (e.g., Pérez
tercomparison Program (CMIP5) inventory (Lamarque et al.,          et al., 2011; Badia et al., 2017) contains advanced chem-
2010) in CAM5, and CMIP6 in CAM6 for the year 2000 in              istry and aerosol packages and is coupled online with the
all simulations.                                                   NMMB, which allows for running either global or high-
   The TOA dust DRE under all-sky conditions, unless oth-          resolution (convection-permitting) regional simulations (Jan-
erwise stated, is calculated following Eq. (1) as the instan-      jic et al., 2001; Janjic and Gall, 2012). The dust module
taneous difference of net fluxes (1Fdust ) at the TOA (Ghan        of MONARCH (Haustein et al., 2012; Klose et al., 2021;
and Zaveri, 2007), diagnosed at each model time step with all      Pérez et al., 2011) includes different parameterizations of
aerosol species on the climate diagnostic list (F1 ) and values    dust emission, including those from Marticorena and Berga-
with all aerosol species except for dust minerals (F2 ):           metti (1995), Ginoux et al. (2001), Shao (2001, 2004), Shao
                                                                   et al. (2011), Kok et al. (2014a), and Klose et al. (2014). The
1Fdust = F1 − F2 .                                          (1)
                                                                   model simulations performed for this study utilize the dust
2.2.2   NASA Goddard Institute for Space Studies                   emission scheme from Ginoux et al. (2001) with some modi-
        ModelE2                                                    fications described in Klose et al. (2021). The model includes
                                                                   eight dust size transport bins ranging up to 20 µm in diam-
NASA GISS ModelE2 has a horizontal resolution of 2.5◦              eter. The emitted size distribution is based on Kok (2011).
longitude by 2◦ latitude with 40 vertical layers extending         The inclusion of mineral speciation is under development,
to 0.1 hPa. In ModelE2, dust enters the atmosphere as a re-        and therefore it is not included in this study.
sult of winds exceeding a prescribed threshold value that             The radiation scheme is RRTMG (Iacono et al., 2001,
increases with soil moisture content. Emitted dust mass is         2008). In the longwave, we assume refractive indices from
largest within basins where erodible particles have accumu-        the Optical Properties of Aerosols and Clouds (OPAC)
lated and there is limited vegetation to protect the soil sur-     dataset (Hess et al., 1998) and spherical particle shape. In
face. These regions of preferential emission are identified        the shortwave, we assume tri-axial ellipsoids as described
by Ginoux et al. (2001). Emission depends upon the surface         by Kok et al. (2017), who used the dust single-scattering
model wind speed and parameterized wind gusts that repre-          database of Meng et al. (2010) and size-dependent refrac-
sent the effects of sub-grid fluctuations (Cakmur et al., 2004).   tive indices based on a globally averaged mineralogical com-
A full model description of emission and transport is given        position. The radiation flux is diagnosed twice, one with all

Atmos. Chem. Phys., 21, 3973–4005, 2021                                             https://doi.org/10.5194/acp-21-3973-2021
L. Li et al.: Quantifying the range of the dust direct radiative effect                                                                  3979

Figure 1. Real (a) and imaginary (b) complex refractive index (CRI) of each mineral for shortwave (blue shading) and longwave (green
shading) bands (band centres shown as x-axis labels) implemented in CAM5/6. CRI values were derived for each band with original data
taken from Scanza et al. (2015). The imaginary CRI of goethite was assumed to be half of hematite with the same spectral shape, while the
real part of goethite is assumed to be identical to that of hematite. Vertical dash lines indicate the shortwave Band 10 centered at 0.53 µm at
which DOD and SSA for CAM5/6 were calculated. Note that the band centered at 8.02 µm (leftmost) is broad, with low and high boundaries
of 3.84 and 12.20 µm, respectively. This broad band has been included in the model as shortwave bands by model developers. For mineral
names, see text in Sect. 2.2.1.

aerosol species and the other one solely without dust aerosol             2.3     Quantifying dust aerosol radiative effect
to determine the DRE for bulk dust. While MONARCH does                            uncertainty
not calculate mineral speciation of dust, we include its DOD
as a measure of uncertainty in comparison to DREs related                 2.3.1    Sensitivity studies with mineralogy in the
to uncertainty in the soil mineral composition.                                    Community Atmospheric Model of version 5
   The model is run from 2007 to 2011 at a horizontal resolu-
tion of 1.0◦ × 1.4◦ , with 48 vertical layers. The meteorolog-            A set of sensitivity studies, based primarily on CAM5, is con-
ical fields are re-initialized daily using ERA-Interim reanal-            ducted to characterize the range in DRE due to uncertainties
ysis data (Berrisford et al., 2011), while dust fields and soil           in the soil mineralogical composition. To determine the un-
moisture are recycled between the daily runs.                             certainty in soil mineralogy, we use two different approaches
                                                                          to estimate the mineral content of soils: the first is based on
2.2.4   Geophysical Fluid Dynamics Laboratory model                       C1999 and the second is based on J2014. We consider the
                                                                          set of climatically important minerals identified in the soil
The latest GFDL global climate model includes the fourth
                                                                          compilations of C1999 and J2014, although other minerals
version of the coupled Climate Model (CM4) and Earth Sys-
                                                                          may be important, especially in specific regions. However,
tem Model (ESM4), with detailed descriptions provided by
                                                                          optical analyses of aerosolized soil samples show that short-
Held et al. (2019) and Dunne et al. (2020), respectively. In
                                                                          wave absorption varies most strongly with iron oxides like
CM4 dust emission depends only on wind speeds with pre-
                                                                          hematite and goethite (Moosmüller et al., 2012; Di Biagio et
scribed dust sources (Ginoux et al., 2001), while in ESM4 it
                                                                          al., 2019), suggesting that other radiatively active minerals
depends also on soil water and ice, snow cover, leaf and stem
                                                                          are mainly present in small concentrations.
area indices, and land use type, which are all dynamically
                                                                             We select simulations with soil mineralogy derived from
calculated, except for land use (Evans et al., 2016). The dust
                                                                          the MMT of C1999 as the baseline (see Sect. 3.1 for the re-
size distribution at emission follows the brittle fragmentation
                                                                          sultant hematite aerosol mass percentage). In addition to the
theory of Kok (2011). The simulations are performed from
                                                                          mean, the MMT provides uncertainty ranges for each mineral
2010 to 2015 with observed sea surface temperature and sea
                                                                          and for each soil type, for which we calculate the 95 % confi-
ice (i.e., AMIP simulation; Taylor et al., 2000). Dust DRE
                                                                          dence interval of the mineral fraction (Fig. 2). Hematite mass
is not calculated within this model, but the modeled DOD is
                                                                          abundance is low, but in general, it has the largest relative un-
used to assess the effect of cross-model differences.
                                                                          certainty. Atlases containing the high- and low-bound miner-
                                                                          als (high-bound mineral: upper limit of the 95% confidence
                                                                          interval of the abundance of a mineral in the corresponding
                                                                          category and soil type; the low-bound mineral is similarly
                                                                          defined) such as hematite, illite, and smectite are similarly

https://doi.org/10.5194/acp-21-3973-2021                                                    Atmos. Chem. Phys., 21, 3973–4005, 2021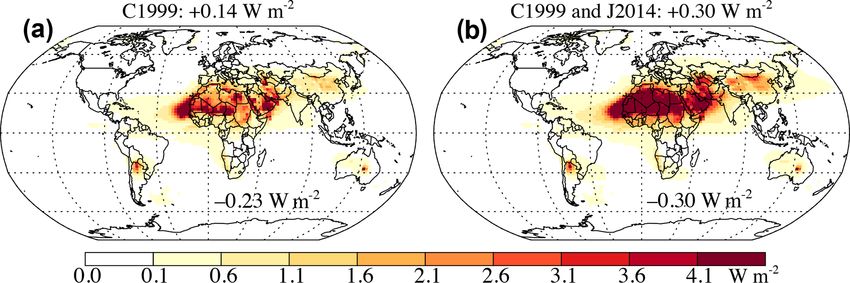
3980 L. Li et al.: Quantifying the range of the dust direct radiative effect
the minerals are reduced (or increased) proportionally. Com-
pared to clay, there is much less information available for
silt-sized minerals, and the existing data are obtained mainly
based on a number of assumptions rather than observations.
Therefore, soil units which do not have an estimate of the un-
certainty in the iron oxides are prescribed to have the max-
imum uncertainty range that is present in iron oxides across
the dataset (Fig. 2). We follow the same procedure as in
Sect. 2.1 to create the global mineralogy atlas. Mineral frac-
tions are normalized to sum to unity.
Table 2 summarizes the experiments undertaken in this
study. In the simulations with unperturbed mineralogy
(C1999 or J2014), emissions are tuned following Albani et
al. (2014) to yield a global mean DOD of ∼ 0.03 (simu-
lated AOD and DOD by CAM and MONARCH are at the
0.44–0.63 µm band and by GFDL are at the 0.50–0.60 µm
band here and after, unless otherwise stated) according to
the observational estimate based upon satellite retrievals with
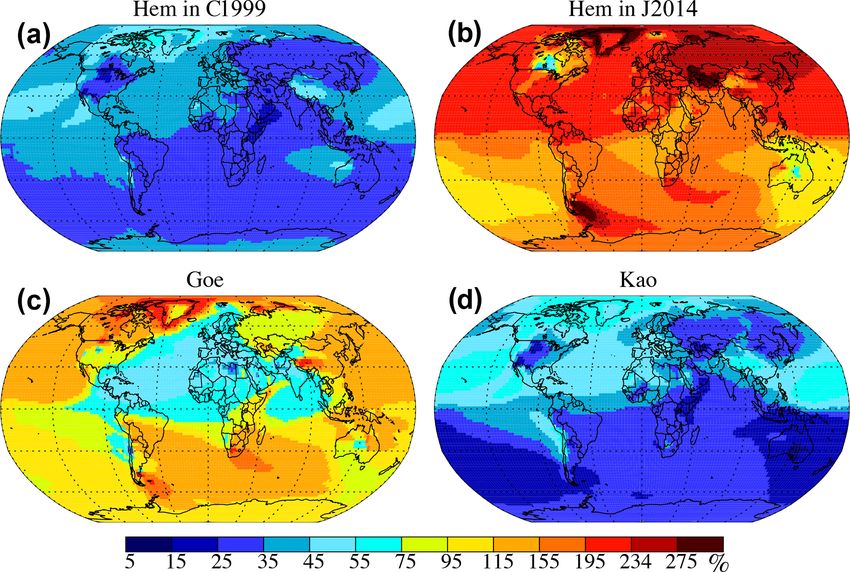
Figure 2. Mean mineral percentage (C1999: colored filled dots; bias-corrected observations from AErosol RObotic NET-
J2014: colored triangle) and associated uncertainty (error bars) in
work (AERONET) and multiple global models (Ridley et al.,
the clay- (a) and silt-sized (b) categories based on C1999 and J2014
for each soil type. x-axis labels from 1 to 21 corresponds to the first
2016). The baseline model fairly well reproduced the mag-
column of Table 2 of Claquin et al. (1999) from top to bottom. Soil nitude of dust concentration and deposition at the bottom
units used for comparison to C1999 data are listed in Table 3 of model layer compared to station-based measurements (see
Journet et al. (2014) and are reordered here according to x-axis la- Albani et al., 2014, for detailed descriptions) (Fig. 3; corre-
bels used for C1999 soil types. lation in the log space: R 2 = 0.88 and 0.83 for the surface
dust concentration and deposition flux, respectively, which
are statistically significant at the 95 % confidence level). Par-
created following C1999 using soil type to prescribe mineral ticularly over regions near the dust source, such as north-
fractions. When perturbing the amount of one mineral, we ern Africa, the model fairly well agrees with observations,
conserve emitted dust mass through an identical and opposite despite a more smoothing spatial distribution of those dust
change in soil abundance of the dominant mineral (referred to proxies in the simulation. Comparing with the seasonal DOD
as the offsetting mineral) within the same clay- or silt-sized averaged over 15 regions obtained by Ridley et al. (2016), the
category. Another criterion to select the offsetting mineral is baseline simulation appears to show an overestimate in gen-
that it should have a minimized impact on the simulated in- eral near dust source regions and fairly well reproduced the
stantaneous TOA fluxes. For example, illite and kaolinite oc- seasonal cycle (Fig. 4) from the climatological side. Periods
cupy the same clay-sized soil category (mass fraction: 0.39) for the simulation (2007–2011) and DOD constraint (2004–
in the calcaric soil type. In this case, we choose kaolinite 2008) do not coincide well. Despite the inconsistency in pe-
as the offsetting mineral, because the DRE is less sensitive riod, this overestimate of DOD close to the source is proba-
(measured by the relative change in the DRE over the rela- bly not totally an artifact, considering that to match DOD of
tive change in the high-bound kaolinite aerosol content with ∼ 0.03 the global tuning of the model tends to emit more dust
respect to the base value) to this mineral than to illite in test to compensate unduly strong deposition during transport. For
simulations. Similarly to Scanza et al. (2015), we employ a the other cases, the simulated dust cycle is similarly compa-
nearest-neighbor algorithm to estimate mineral fractions of rable with observations and thus is not shown. The similarity
land mass not specified by the MMT of C1999 in avoid of of the simulated dust cycle among the different cases except
“zero” dust emissions in these regions. The spatial distribu- where we perturb DOD is primarily because DOD is insen-
tion of uncertainties in the soil mineral abundance based on sitive to the variation of the mineral content at least within
which we estimate the propagated error in the DRE calcula- the mineral’s uncertainty range, which is generally a small
tion is discussed in Sect. 2.3.2. perturbation to the total dust amount. Therefore, a retuning
In addition to C1999, we consider three scenarios based procedure for experiment cases except the ones where we
on J2014. One uses the mean mineral fraction from J2014. perturb DOD is unnecessary, and the simulated dust concen-
The other two use low and high bounds on iron oxides. tration and deposition, thus, remain almost unchanged.
We consider these bounds to be the average hematite and Dust optical properties are based upon Mie theory which
goethite mass fractions ± 2σ , representing 95 % of the vari- idealizes particles as spheres. In contrast, AOD retrieved
ability, where σ denotes the standard deviation of hematite from sun photometers accounts for dust asphericity (Dubovik
and goethite from J2014. The mineral fractions for the rest of et al., 2002). To match modeled dust mass extinction ef-
Atmos. Chem. Phys., 21, 3973–4005, 2021 https://doi.org/10.5194/acp-21-3973-2021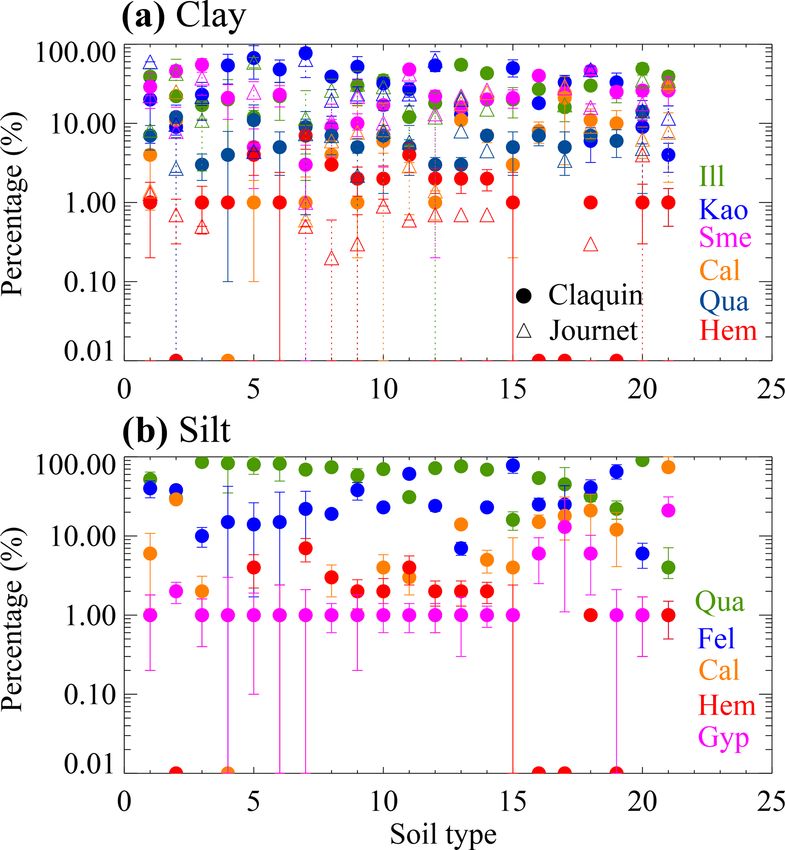
L. Li et al.: Quantifying the range of the dust direct radiative effect                                                                                 3981

Table 2. List of experiments for the sensitivity test using CAMs (CAM4, CAM5, and CAM6), ModelE2, MONARCH, and GFDL with
speciated (indicated by C1999 and J2014) and bulk dust. All the model results were processed onto 2.5◦ × 1.9◦ (longitude by latitude)
horizontal grids for further calculation. Note: Ima – imaginary; LW – longwave; SW – shortwave; OPAC – Optical Properties of Aerosols
and Clouds.

                    Models              Configuration            Descriptions                 Soil atlases       Optics
                    CAM4                FSDBAM                   Baseline                     C1999              Scanza et al. (2015)
                    CAM5a,b             FC5                      Claquin baseline             C1999              Scanza et al. (2015)
                    CAM6b               F2000climo               Baseline                     C1999              Scanza et al. (2015)
                    CAM5b               FC5                      Journet baseline             J2014              Scanza et al. (2015)c
                    CAM5b               FC5                      Same hem and goe             J2014              Scanza et al. (2015)c
                    CAM5b               FC5                      High iron oxide              J2014              Scanza et al. (2015)c
                    CAM5b               FC5                      Low iron oxide               J2014              Scanza et al. (2015)c
                    CAM5a,d             FC5                      High ill clay                C1999              Scanza et al. (2015)
                    CAM5a,d             FC5                      Low ill clay                 C1999              Scanza et al. (2015)
                    CAM5a,d             FC5                      High sme clay                C1999              Scanza et al. (2015)
                    CAM5a,d             FC5                      Low sme clay                 C1999              Scanza et al. (2015)
                    CAM5a,d             FC5                      High qua silt                C1999              Scanza et al. (2015)
                    CAM5a,d             FC5                      Low qua silt                 C1999              Scanza et al. (2015)
                    CAM5a,d             FC5                      High qua clay                C1999              Scanza et al. (2015)
                    CAM5a,d             FC5                      Low qua clay                 C1999              Scanza et al. (2015)
                    CAM5a,d             FC5                      High cal clay                C1999              Scanza et al. (2015)
                    CAM5a,d             FC5                      High kao clay                C1999              Scanza et al. (2015)
                    CAM5a,d             FC5                      High gyp silt                C1999              Scanza et al. (2015)
                    CAM5a,d             FC5                      High fel silt                C1999              Scanza et al. (2015)
                    CAM5a               FC5                      Aitken hem removed           C1999              Scanza et al. (2015)
                    CAM4                FSDBAM                   High hem clay                C1999              Scanza et al. (2015)
                    CAM5a,b             FC5                      High hem clay                C1999              Scanza et al. (2015)
                    CAM5a,b             FC5                      Low hem clay                 C1999              Scanza et al. (2015)
                    CAM5a,b             FC5                      High hem silt                C1999              Scanza et al. (2015)
                    CAM5a,b             FC5                      Low hem silt                 C1999              Scanza et al. (2015)
                    CAM5a,b             FC5                      High DOD                     C1999              Scanza et al. (2015)
                    CAM5a,b             FC5                      Low DOD                      C1999              Scanza et al. (2015)
                    CAM5a,b             FC5                      High Ima                     C1999              Scanza et al. (2015)
                    CAM5a,b             FC5                      Low Ima                      C1999              Scanza et al. (2015)
                    ModelE2             n/a                      Baseline                     C1999              n/a
                    MONARCH             n/a                      Baseline                     n/a                LW: OPAC; SW: see texts
                    GFDL                n/a                      Baseline                     n/a                n/a
                  a,b Model simulations with and without the bug, respectively. c Assumed optical properties for goethite. d A scaling factor applied
                  to the calculated DRE. n/a – not applicable.

ficiency with observations, we augment DOD globally by                                     To compare the uncertainty in the DRE from mineralogy
∼ 16 % and ∼ 28 % for the accumulation plus Aitken and                                 to the other factors whose uncertainties have been well quan-
coarse modes, respectively, according to calculations of Kok                           tified, we perturb the DOD and the imaginary complex re-
et al. (2017), to account for dust asphericity for the first time                      fractive index of the mineral. We do not compare the re-
in CAM. We do not consider the increased gravitational set-                            sultant DRE uncertainty due to other error sources (see Ap-
ting lifetime due to dust asphericity (Huang et al., 2020) and                         pendix A), such as mixing and chemical reaction of dust with
leave the lifetime effect of dust asphericity on dust DRE as                           pollution aerosols (e.g., H2 SO4 , HNO3 , and HCL) (Li and
a future study. Because of the DOD augmentation, a global                              Shao, 2009; Huang et al., 2010; Tobo et al., 2010), which
DOD of ∼ 0.03 was achieved with a relatively lower dust                                we leave as a field for future study. The DOD is perturbed
emission compared to that without considering dust aspheric-                           via dust emission adjustment, to be ±0.005 (on the global
ity. For all other experiments, dust emission is set to be the                         average; high-bound DOD: 0.035; low-bound DOD: 0.025),
same magnitude as in the base except for those used to assess                          based upon the constraint by Ridley et al. (2016). This per-
uncertainty in DRE induced by changing the dust burden.                                turbation amplitude was also utilized by Loeb and Su (2010).
                                                                                       Considering the variation of dust absorptive properties in dif-

https://doi.org/10.5194/acp-21-3973-2021                                                                      Atmos. Chem. Phys., 21, 3973–4005, 2021
3982                                                         L. Li et al.: Quantifying the range of the dust direct radiative effect

Figure 3. Comparison of simulated (the baseline case; see text for details) dust surface concentration and deposition with observations.
Also shown is the correlation in the log space (R 2 ; both significant at the 95 % confidence level) between modeling and observations over
sub-domains as indicated by texts in color. The dash lines in (b) and (d) represent 10 : 1 (upper left) and 1 : 10 (bottom right) lines.

                                                                        ferent source regions, mainly due to variations in the iron-
                                                                        oxide fraction (Lafon et al., 2006), the imaginary complex
                                                                        refractive index for bulk dust can vary by up to a factor of 2
                                                                        for a given region, while the real part of the index changes
                                                                        less (Kim et al., 2011). Therefore, using a globally con-
                                                                        stant imaginary index may not capture a large fraction of the
                                                                        DRE caused by dust minerals. Measurements of the imag-
                                                                        inary complex refractive index also indicate notable differ-
                                                                        ences among different datasets (X. L. Zhang et al., 2015;
                                                                        Di Biagio et al., 2019). Here we perturb the imaginary com-
                                                                        plex refractive index, at the global scale, by ±16 % (relative
                                                                        percentage) for each mineral, following Kim et al. (2011),
                                                                        whose results are based on AERONET measurements at 14
                                                                        dust-dominated sites in and around the Saharan and Arabian
                                                                        deserts for the sampling period spanning from 1996 to 2009.
                                                                        The absolute uncertainty (∼ 32 %) we considered sits in be-
                                                                        tween the range of 13 %–75 % for dust aerosol obtained by
                                                                        Di Biagio et al. (2019).
                                                                           After undertaking the first set of sensitivity runs, it was
Figure 4. Comparison of seasonally resolved DOD from the base-
                                                                        found that the calibration of DOD inadvertently double
line simulation (blue) over 15 regions with that (brown) obtained
in Ridley et al. (2016), who bias-corrected satellite-based re-         counted the mineral mass, resulting in dust emissions that
trievals from the Moderate Resolution Imaging Spectroradiometer         were too low to obtain a DOD of ∼ 0.03 (emission rate of
(MODIS) and the Multi-angle Imaging Radiometer (MISR) using             ∼ 3300 Tg a−1 compared to ∼ 6600 Tg a−1 ). We reran the
AERONET measurements and a model ensemble (see Ridley et                model for a second time for those cases (e.g., iron oxides,
al., 2016, for details). The shading area shows an example that the     DOD, and imaginary index) where the perturbed parameter
model greatly overestimated DOD compared to observations over           was found to have an important impact on the DRE. The sec-
some of the subregions. Error bars represent the standard deviation.    ond set of simulations (dust emission rate: ∼ 4300 Tg a−1 )
For definition of the 15 regions see Fig. 1 of Ridley et al. (2016).    introduced the effect of dust asphericity on the mass ex-
                                                                        tinction efficiency, resulting in a global emission increase
                                                                        of 30 % compared to the first set of simulations (dust emis-
                                                                        sion rate: ∼ 3300 Tg a−1 ) with incorrect mass specification

Atmos. Chem. Phys., 21, 3973–4005, 2021                                                    https://doi.org/10.5194/acp-21-3973-2021
L. Li et al.: Quantifying the range of the dust direct radiative effect 3983
for calculating DOD. The comparison of the calculated DRE
between the two sets of simulation on the same perturbed
parameter suggests a small difference (global average ≤
0.05 W m−2 ) (Fig. S1 in the Supplement) after applying a
“normalization” factor of 1.3. This factor was determined as
the DRE ratio of the second to first set of simulations. It ap-
proximates the percentage change in dust emissions between
the two sets of simulations (4300 Tg a−1 /3300 Tg a−1 ) and is
comparable with the enhancement of the mass extinction ef-
ficiency for particles in the coarse mode to account for dust
asphericity. Therefore, we did not repeat those simulations
where varying the minerals did not change the dust DRE. In-
stead, we use the “normalization” factor to convert the first
set of CAM5 simulations (which did not include the shape ef-
fect) to the second set (which included the shape effect). We
refer to the simulations that were not repeated in the figures
and tables as “normalized” cases.
2.3.2 Soil mineralogy uncertainty in C1999
Here we discuss the sensitivity studies with CAM5 using
a range of surface mineralogical maps based on the uncer-
tainty in mineralogical composition by soil type (Fig. 2).
Following the methodology described in the previous sec-
tion and Scanza et al. (2015), multiple soil atlases are cre-
ated and remapped onto CAM5 and CAM6 longitude and
latitude grids based on C1999 and J2014 (shown in Fig. S2
for the distribution of minerals in J2014 and in Fig. S3 for Figure 5. Changes in soil concentration (fractional amount) of il-
the difference between J2014 and C1999) and corresponding lite (ill), smectite (sme), hematite (hem), and goethite (goe) in the
soil uncertainties (e.g., Fig. 5). By subtracting the base value clay category. In (a), (b), (c), and (d), values are derived by tak-
from the high-bound mass fraction for each mineral, we ob- ing the difference between high-bound mass fractions of the min-
tain the atlas of high-branch uncertainty for minerals such as erals and their base values constructed following the method of
illite, smectite, hematite, and goethite plus hematite in terms Scanza et al. (2015) according to the MMT in C1999 (a, b, c)
of absolute change (Fig. 5a, b, c, d; also shown is the relative and J2014 (d: hematite plus goethite) in CAM5. Similarly, (e),
(f), (g), and (h) show the relative change defined as (high bound-
change in Fig. 5e, f, g, h, respectively).
base) / (base) × 100. The mean soil distribution of these minerals
The amount of soil variability for other minerals tends to has been shown previously (Scanza et al., 2015; Perlwitz et al.,
be smaller than for iron-oxide and hydroxide elements in 2015a). Because of the limited information on mineral content in
terms of relative change (e.g., Fig. 5e, f compared to Fig. 5g, the silt-sized category, to create the global atlas for dust modeling
h). In addition, as shown later (e.g., Sect. 3.2.2), the iron- showing the high and low bounds of iron oxides, we applied to all
oxide and hydroxide minerals are more important for the soil units a constant standard deviation of goethite that is present for
DRE than the other minerals are, such that we focus our dis- two soil units for which we have information.
cussion here on iron-bearing minerals. Our calculation shows
that in C1999 hematite, illite, and smectite in clay range
between 0.27 %–0.86 %, 9.0 %–15 %, and 6.8 %–13 %, re- Iron oxides
spectively, by mass with base values of 0.56 %, 12 %, and
10 %. In comparison, the globally mean hematite in J2014 Hematite and goethite are the most common iron oxides
is smaller (∼ 0.34 %) with an uncertainty range of 0.017 %– present in soils. In-lab analysis shows goethite being less ab-
1.0 %. Goethite in clay and silt is estimated to be 1.3 % and sorptive than hematite (Formenti et al., 2014). Thus, parti-
0.43 %, with ranges of 0.36 %–2.6 % and 0.00 %–1.0 %, re- tioning these iron oxides at emission is relevant to accurately
spectively. We discuss next the spatial distribution of the un- represent the dust DRE in the shortwave spectrum. C1999,
certainty in iron oxides and clays in C1999 and compare it to however, only considers iron oxides to be in the form of
that in J2014. hematite, while J2014 distinguishes two different iron-oxide
species, hematite (present in the clay size) and goethite (both
in clay and silt size fractions), consistent with other measure-
ments (Lafon et al., 2006; Formenti et al., 2008, 2014). Both
https://doi.org/10.5194/acp-21-3973-2021 Atmos. Chem. Phys., 21, 3973–4005, 20213984 L. Li et al.: Quantifying the range of the dust direct radiative effect
datasets agree on the scarce mass abundance of iron oxides Sect. “Uncertainty due to dust minerals, burden, and imag-
in the clay- and silt-sized categories as compared to other inary complex refractive index”), we performed sensitivity
minerals (note our extension of hematite to the clay-sized tests only on iron oxides but not on illite and smectite when
category in C1999). The combined iron-oxide (hematite and using J2014.
goethite) abundance in J2014 represents a much larger soil
fraction than in C1999 (Fig. 5), particularly in the global 2.3.3 Spatially explicit uncertainty estimates
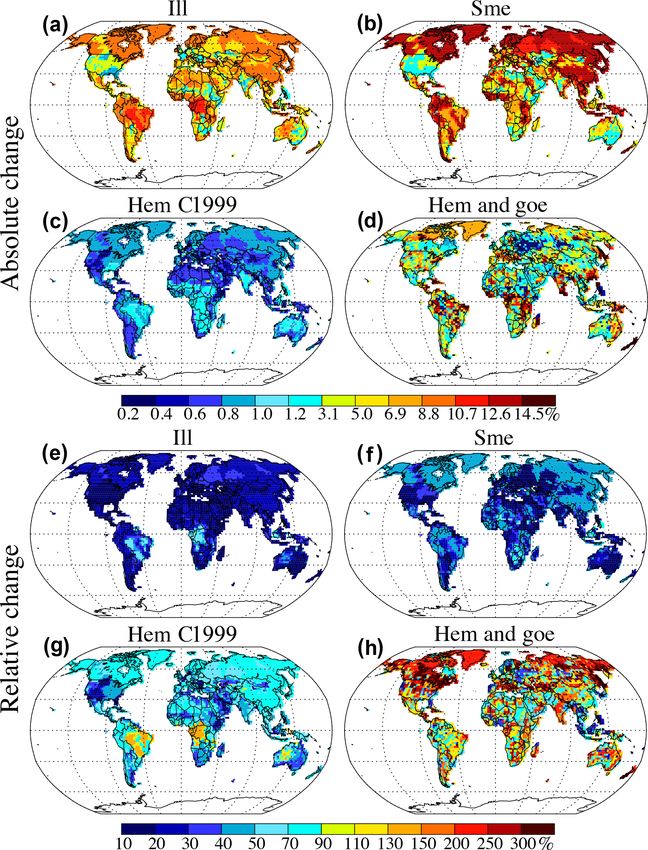
average. We found that J2014 shows the dominance of the
iron-oxide content by goethite over hematite, regardless of
Spatially, we quantify the contribution of each uncertain pa-
source region. Hematite in J2014 presents strong regional
rameter described in Sect. 2.3.1 to the total dust DRE uncer-
differences as in C1999 with mass fractions predominantly
tainty by accounting for the deviation in DRE from the per-
below 1.5 %, but in some arid regions, for instance northern
turbed case to the baseline case at target grid boxes. Specif-
Africa, reaching up to 5.0 % (Journet et al., 2014).
ically, the dust DRE due to uncertainties in soil mineralogy
C1999 exhibits a large uncertainty in the soil abundance of
(e.g., hematite) is obtained following Eq. (2):
hematite in the soils of Australia, central and southern Africa,
western India, the south-eastern part of North America, and
eastern Brazil (Fig. 5c). Particularly for areas considered to 1Fdust,unc = 1Fdust,peturb − 1Fdust,base
be sand dunes within the Sahel, the high-bound hematite in
= (F3 − F4 ) − (F1 − F2 ) , (2)
the clay-sized category is ∼ 80 % higher (Fig. 5g) than the
base. The high iron-oxide content in soils from central Mau-
ritania to central Mali (Lafon et al., 2006; Formenti et al., where Fdust,peturb is the DRE in an experiment; Fdust,base is
2008; Klaver et al., 2011) is represented by a narrow uncer- the DRE in the baseline simulation; F1 is diagnosed radiative
tainty range. There is also high confidence in the low iron- flux at the TOA in the baseline with dust and F2 without dust;
oxide fraction attributed to the Bodélé depression (Lafon et F3 is diagnosed radiative flux at the TOA in the perturbed
al., 2006; Formenti et al., 2008), which has been character- experiment with dust, and, similarly, F4 without dust.
ized by satellite-based sensor as an active dust source (Gi- Loeb and Su (2010) applied the root-mean sum of the
noux et al., 2012). In J2014, soil abundance of iron oxides squares of the uncertainties associated with each perturbing
is more uncertain than in C1999 over North America, south- experiment (e.g., DOD), to get the total DRE uncertainty in
ern Africa, India, Russia, western China, and some regions in the global average. This method was also used by Yoshioka et
Europe and Australia. Over most dust source regions, high- al. (2007) to estimate the errors for differences between two
bound goethite is approximately 1.3 times the base. In con- groups of data. Here, we utilize a similar method and apply
trast, hematite is overall much less uncertain than goethite, it to the grid-cell level to get the total DRE uncertainty (Eq. 3
and only at some hotspots can high-bound hematite be 1.6 for C1999 and Eqs. 4 and 5 to account for difference between
times the base. the two soil datasets) due to parameters we considered (min-
erals, dust burden, and imaginary complex refractive index
Clays for each mineral):
Illite dominates the clay-sized category. Most regions in qP
C1999 show over 25 % illite by mass in the clay-sized soils 1F 2 n−3 2
= i=1 (1Fi − 1Fbase ) ,
hig
and both atlases report up to 50 % clay-sized illite over some
1Fi ≥ 1Fbase
Sahara sand dunes. The region-to-region variation for illite qP (3)
is less pronounced than for low-abundance minerals (e.g., 1Flow = − 2 n−3
2
i=1 (1Fi − 1Fbase ) ,
feldspars, hematite, and calcite). In comparison to hematite, 1Fi < 1Fbase ,
the soil content uncertainty in illite in terms of the relative qP
2 n−3 2 2 ,
change is small (∼ 20 %) over dust source areas (Fig. 5e).
1F hig = i=1 1FC,i − 1FC, base + bhig
1Fi ≥ 1Fbase
Large uncertainties primarily exist over regions that tend to q (4)
2
have low emissions, such as in southern Africa outside of 1Flow = − 2 n−3
P 2
i=1 1FC,i − 1FC, base + blow ,
the Kalahari Desert and the western part of South Amer-
1Fi < 1Fbase ,
ica outside of the Atacama Desert (Ginoux et al., 2012).
Similarly, smectite abundances are also more certain than
hematite, in particular over dust-active areas, with a relative where 1Fhig and 1Flow represents uncertainty in abso-
change in its soil content less than 10 %. Absolute changes lute terms; subscript “hig” and “low” show high and low
in these two minerals, however, are much larger compared branches; “n” is the total case number; “i” indicates different
to those of hematite in the clay- and silt-sized categories, cases; “base” refers to the baseline simulation (CAM5 with
even in dust source regions. Because of the small influence of C1999); “C” denotes C1999; “n − 3” means that we exclude
these minerals on the shortwave DRE (apparent in C1999 and three cases associated with J2014 (see Sect. 2.3.1); term “b”
Atmos. Chem. Phys., 21, 3973–4005, 2021 https://doi.org/10.5194/acp-21-3973-2021You can also read