An aggregated sparse matrix factorisation model for market trading
←
→
Page content transcription
If your browser does not render page correctly, please read the page content below

ME NG I NDIVIDUAL P ROJECT

                    D EPARTMENT         OF   C OMPUTING
    I MPERIAL C OLLEGE OF S CIENCE , T ECHNOLOGY AND M EDICINE

  An aggregated sparse matrix factorisation
         model for market trading

      Author:                                              Supervisor:
      Harry Brown                                 Dr. Thomas Lancaster

                                                       Second Marker:
                                             Dr. Konstantinos Gkoutzis

                                June 15, 2020

Submitted in partial fulfillment of the requirements for the Masters of Engineering
                         degree of Imperial College London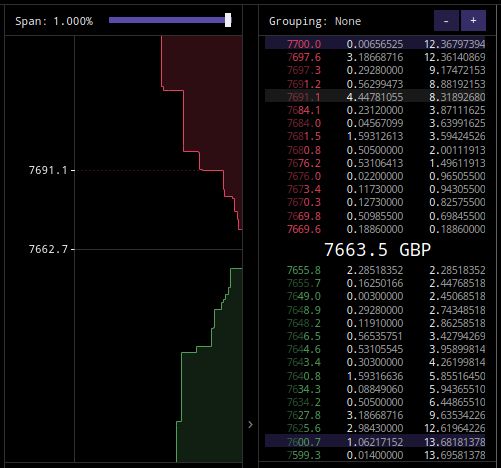
Abstract

Thanks to the rise of social media, particularly Twitter, individual conversations
around the globe are now taking place in earshot of any and all, accessible simply via
a key word search. Armed with a variety of natural language techniques, this report
presents a pipeline to combine these tête-à-têtes with content from news articles, and
interpret their relevance to the stock market via a sparse matrix factoriser, a relatively
new mathematical procedure for extracting meaningful features and patterns from
data vectors. By building a separate evaluator for a variety of stocks, constantly
monitoring their operations and allocating funds to the top performers, an aggregated
trading model can be constructed.

Compared against the only two previous papers to have employed sparse matrix
factorisation in a trading context, this model achieves a simulated annualised return
of 40.6% and Sharpe ratio of 1.73 (pre-coronavirus). This is a marked improvement
upon the 18% and 38.5% average returns, and Sharpe ratio of 1.35, reported in the
two prior papers, and even more so when contrasted with a number of mainstream
index funds. Furthermore, it separately demonstrates unprecedented resilience in
periods of market uncertainty.
ii
Acknowledgments

First and foremost I am immensely grateful for the invaluable support, guidance
and encouragement from Thomas, my project supervisor and personal tutor, without
whom the project and year as a whole would have been considerably less enjoyable.

Secondly, I am also indebted to Iain, Katie and Anthea, my Computer Science teachers
at Saffron Walden County High School, whose fantastic teaching and unsurpassed
enthusiasm for the subject drove me to study here in the first place.

Finally, a thank you to my parents, for forever putting my education first and providing
me a platform to follow my dreams; to Josh, Jacob and Henry, for years of laughs,
tears and entertainment; and to my friends, too many to mention, who have enriched
my time at university no end.

iii
Contents

1 Introduction                                                                       1

  1.1 Social media as a window to the world . . . . . . . . . . . . . . . . .         1

  1.2 Applications in financial technology . . . . . . . . . . . . . . . . . . .      2

  1.3 Project goal . . . . . . . . . . . . . . . . . . . . . . . . . . . . . . . .    3

  1.4 Ethical considerations . . . . . . . . . . . . . . . . . . . . . . . . . .      4

  1.5 Report structure . . . . . . . . . . . . . . . . . . . . . . . . . . . . . .    5

2 Technical Background                                                               6

  2.1 Overview . . . . . . . . . . . . . . . . . . . . . . . . . . . . . . . . .      6

  2.2 Natural language processing . . . . . . . . . . . . . . . . . . . . . . .       6

       2.2.1 Part-of-speech tagging . . . . . . . . . . . . . . . . . . . . . .       7

       2.2.2 Lemmatisation . . . . . . . . . . . . . . . . . . . . . . . . . .        7

       2.2.3 Term frequency - inverse document frequency (TF-IDF) . . . .             8

       2.2.4 Sentiment analysis . . . . . . . . . . . . . . . . . . . . . . . .       9

       2.2.5 Aspect-based sentiment analysis . . . . . . . . . . . . . . . . .       10

       2.2.6 Considerations for using natural language processing for price
             prediction . . . . . . . . . . . . . . . . . . . . . . . . . . . . .    11

  2.3 Latent Dirichlet allocation (LDA) . . . . . . . . . . . . . . . . . . . .      11

       2.3.1 (Collapsed) Gibbs sampling . . . . . . . . . . . . . . . . . . .        12

       2.3.2 The LDA algorithm . . . . . . . . . . . . . . . . . . . . . . . .       12

                                          v
CONTENTS Table of Contents
2.3.3 Topic sentiment LDA (TSLDA) . . . . . . . . . . . . . . . . . . 13
2.3.4 Joint sentiment/topic (JST) model . . . . . . . . . . . . . . . 14
2.3.5 Considerations for using (TS)LDA for price prediction . . . . 15
2.4 Sparse matrix factorisation (SMF) . . . . . . . . . . . . . . . . . . . . 15
2.4.1 Lagrangian method of multipliers . . . . . . . . . . . . . . . . 16
2.4.2 Augmented Lagrangian method . . . . . . . . . . . . . . . . . 16
2.4.3 Alternating direction method of multipliers (ADMM) . . . . . 17
2.4.4 Bartels-Stewart algorithm . . . . . . . . . . . . . . . . . . . . 18
2.4.5 Considerations for using SMF for price prediction . . . . . . . 18
2.5 Trading . . . . . . . . . . . . . . . . . . . . . . . . . . . . . . . . . . 19
2.5.1 Longing vs shorting . . . . . . . . . . . . . . . . . . . . . . . 19
2.5.2 Trading fees . . . . . . . . . . . . . . . . . . . . . . . . . . . . 19
2.5.3 Efficient market hypothesis . . . . . . . . . . . . . . . . . . . 20
2.5.4 Sharpe ratio . . . . . . . . . . . . . . . . . . . . . . . . . . . . 21
2.5.5 VaR and CVaR . . . . . . . . . . . . . . . . . . . . . . . . . . 21
2.6 Summary . . . . . . . . . . . . . . . . . . . . . . . . . . . . . . . . . 22
3 Literature Review 23
3.1 Overview . . . . . . . . . . . . . . . . . . . . . . . . . . . . . . . . . 23
3.2 Aspect-based sentiment analysis . . . . . . . . . . . . . . . . . . . . . 23
3.3 TF-IDF as a feature weighting mechanism . . . . . . . . . . . . . . . 24
3.4 LDA and TSLDA . . . . . . . . . . . . . . . . . . . . . . . . . . . . . . 25
3.5 Joint sentiment / topic . . . . . . . . . . . . . . . . . . . . . . . . . . 25
3.6 Sparse matrix factorisation . . . . . . . . . . . . . . . . . . . . . . . . 26
3.7 Summary . . . . . . . . . . . . . . . . . . . . . . . . . . . . . . . . . 27
viTable of Contents CONTENTS
4 Implementation 28
4.1 Overview . . . . . . . . . . . . . . . . . . . . . . . . . . . . . . . . . 28
4.2 Stage 1: Data retrieval . . . . . . . . . . . . . . . . . . . . . . . . . . 29
4.2.1 Twitter . . . . . . . . . . . . . . . . . . . . . . . . . . . . . . 30
4.2.2 Reuters . . . . . . . . . . . . . . . . . . . . . . . . . . . . . . 31
4.2.3 Historical prices . . . . . . . . . . . . . . . . . . . . . . . . . 31
4.2.4 Google Trends . . . . . . . . . . . . . . . . . . . . . . . . . . 31
4.3 Stage 2: Data processing . . . . . . . . . . . . . . . . . . . . . . . . . 32
4.3.1 Preprocessing . . . . . . . . . . . . . . . . . . . . . . . . . . . 34
4.3.2 Normalisation . . . . . . . . . . . . . . . . . . . . . . . . . . . 35
4.3.3 Standardisation . . . . . . . . . . . . . . . . . . . . . . . . . . 35
4.3.4 Simplified example . . . . . . . . . . . . . . . . . . . . . . . . 36
4.4 Stage 3: Minimisation . . . . . . . . . . . . . . . . . . . . . . . . . . 38
4.4.1 Introduction . . . . . . . . . . . . . . . . . . . . . . . . . . . 38
4.4.2 Reducing overfitting . . . . . . . . . . . . . . . . . . . . . . . 40
4.4.3 Solving for U and W with ADMM . . . . . . . . . . . . . . . . 41
4.5 Evaluation . . . . . . . . . . . . . . . . . . . . . . . . . . . . . . . . . 42
4.5.1 Stock selection . . . . . . . . . . . . . . . . . . . . . . . . . . 42
4.5.2 Simulating a prediction . . . . . . . . . . . . . . . . . . . . . 43
4.5.3 Performance evaluation: directional prediction accuracy . . . 44
4.5.4 Performance evaluation: simulated trading . . . . . . . . . . 46
4.5.5 Further indicators . . . . . . . . . . . . . . . . . . . . . . . . 47
4.6 Summary . . . . . . . . . . . . . . . . . . . . . . . . . . . . . . . . . 48
5 Results 49
5.1 Overview . . . . . . . . . . . . . . . . . . . . . . . . . . . . . . . . . 49
viiCONTENTS Table of Contents
5.2 Directional prediction accuracy . . . . . . . . . . . . . . . . . . . . . 49
5.3 Trading performance: literature methodology . . . . . . . . . . . . . 50
5.3.1 Analysis . . . . . . . . . . . . . . . . . . . . . . . . . . . . . . 50
5.4 Trading performance: an aggregated model . . . . . . . . . . . . . . 53
5.4.1 Hyperparameter grid search . . . . . . . . . . . . . . . . . . . 53
5.4.2 Results . . . . . . . . . . . . . . . . . . . . . . . . . . . . . . . 54
5.5 Sharpe ratio . . . . . . . . . . . . . . . . . . . . . . . . . . . . . . . . 55
5.6 VaR and CVaR . . . . . . . . . . . . . . . . . . . . . . . . . . . . . . . 56
5.7 Why it works: investigating the matrices . . . . . . . . . . . . . . . . 57
5.7.1 Stock performances . . . . . . . . . . . . . . . . . . . . . . . 57
5.7.2 Z-reduced word frequency heatmaps . . . . . . . . . . . . . . 59
5.7.3 W matrices . . . . . . . . . . . . . . . . . . . . . . . . . . . . 59
5.8 Hyperparameter results . . . . . . . . . . . . . . . . . . . . . . . . . 62
5.9 Issues and limitations . . . . . . . . . . . . . . . . . . . . . . . . . . 64
5.10 Summary . . . . . . . . . . . . . . . . . . . . . . . . . . . . . . . . . 65
6 Conclusions and future work 67
6.1 Summary . . . . . . . . . . . . . . . . . . . . . . . . . . . . . . . . . 67
6.2 Future work . . . . . . . . . . . . . . . . . . . . . . . . . . . . . . . . 68
6.2.1 Volatility monitoring with the VIX . . . . . . . . . . . . . . . . 68
6.2.2 Additional data sources . . . . . . . . . . . . . . . . . . . . . 69
6.2.3 From project to product . . . . . . . . . . . . . . . . . . . . . 69
6.3 Final thoughts . . . . . . . . . . . . . . . . . . . . . . . . . . . . . . . 69
Bibliography 71
A Solving for U and W 75
viiiTable of Contents CONTENTS
A.1 Updating A . . . . . . . . . . . . . . . . . . . . . . . . . . . . . . . . 76
A.2 Updating B . . . . . . . . . . . . . . . . . . . . . . . . . . . . . . . . 76
A.3 Updating U . . . . . . . . . . . . . . . . . . . . . . . . . . . . . . . . 76
A.4 Updating W . . . . . . . . . . . . . . . . . . . . . . . . . . . . . . . . 77
A.5 Return values . . . . . . . . . . . . . . . . . . . . . . . . . . . . . . . 77
ixChapter 1
Introduction
1.1 Social media as a window to the world
Social media, particularly Twitter, provides a real-time source of news and information
from across the globe. Breaking news stories are often first reported on social media
before making their way to more traditional news outlets, and any users who find
themselves at the scenes of stories can post reports, photos and videos, allowing
anybody to be a journalist. A recent example might be the 2019 Hong Kong protests,
where updates from residents on the ground provided round-the-clock coverage,
when more traditional news outlets may have been less able to get access due to
safety concerns or lack of transport [1]. Figure 1.1 shows a perfect example of this, a
video of military vehicles assembling across the border in China that was watched
globally over 6 million times; without Twitter, it is considerably less likely that such
footage would have made it to the public domain.
Another feature of social media is how it can be used to quickly ascertain the general
public mood relating to a specific topic. A search on Twitter of any current affairs
story, brand or public figure immediately serves up multifarious commentary from
all users who have mentioned this topic in any of their tweets. This provides an
ever-growing library of mass public sentiment, a zeitgeist, on virtually any topic that
can be fit into 280 characters or fewer, and can be considered one of the standout
examples of what we today refer to as big data. One of the earliest sectors to engage
with this wealth of information was in marketing and brand management, where by
taking these tweets and feeding them through a sentiment analysis tool, it becomes
possible to conduct a form of opinion mining [2][3], enabling companies to obtain
insights on how people are talking about their business.
1Chapter 1. Introduction
Figure 1.1: Example tweet from the 2019 Hong Kong protests
1.2 Applications in financial technology
With mass uptake of social media only really taking place in the last decade or so,
academic research into new and unheralded uses of its data remains a key topic
of interest. It has, among others, seen early signs of potential from the field of
financial technology (or fintech), where improvements in processing power available
to commercial users in the twenty-first century have allowed algorithmic trading to
gain real traction over manual, human-led trading. Indeed, in 2016, over 80% of forex
trades were carried out by computers, rather than people [4]. However, the majority
of trading algorithms until recently have focused on mathematical regression-based
methods; only in the last few years, coincidentally almost perfectly in sync with the
rise of social media, has machine learning emerged as a genuinely new approach
to trading. As such, the vast quantities of text data available through Twitter can
now serve as a basis for a new trading strategy, one that eschews price or technical
2Chapter 1. Introduction analysis altogether in favour of a text-based procedure, by aiming to spot patterns and correlations between the public voice and associated stock prices as its means of market prediction. Whilst numerous investigations into the potential uses of social media as a basis for making investment decisions have already been carried out, many of these have been conducted with slight caveats. Some [5][6] use finance-based forum boards as their data source, rather than tweets; while this approach simplifies much of the data collection and processing stage, it inherently limits the range of opinions and voices being taken into account. Considerably less research has looked at tapping into “the voice of the public” - everyday users of social media - rather than specifically the views of people with a strong existing interest in stocks and finance. Twitter is a much better place from which to draw such data. Others [7][8] are specifically targeted at news articles, which while containing much richer texts from which to derive content are not considered entirely real-time, although the results from a number of these, particularly in the work of Ming, Wong, Liu and Chiang [9], are highly encouraging. 1.3 Project goal The proposal for this project is therefore to combine the best of both worlds seen in the literature, taking in both tweets and news articles, analysing trends in the texts, and using these to form the basis for predicting the future movements of stocks. The public and free-to-access nature of social media means that, just as desired, it is now trivial to obtain the world’s opinion on a subject matter of choice, but the flipside to this is that content is generated by users with all manner of intentions. To build a more well-rounded model that is shielded against some of the issues caused by this, it makes sense to instead aggregate text content from multiple sources - not just Twitter, but also from reputable news outlets that, while providing much less content to work with than Twitter, carry considerably more weight than individual tweets. The trends analysed may be in the form of sentiment analysis, word-frequency analysis, tweet volumes or otherwise. These trends will form the basis of a model, which will then be used to predict future movements based on new data. The effectiveness of the method will be measured by taking the predictions of the model and laying these over the historical stock price movements, to produce a trading simulation. The individual stock performances in the model will be compared against both one another and against any similar models found in the literature. By then performing a more low-level analysis on the individual models, underlying trends between stocks may be obtained that aid future decision-making. It may well then transpire that these trends are not only detectable between stocks, but also among stock sectors. Of course, it is unlikely that such an approach would work for all stocks. Specifically, 3
Chapter 1. Introduction

the stocks being invested in must have a relatively unique name, such that any
searches for them do not throw up results for unrelated content; and they must be
embedded enough in the public consciousness to warrant regular discussions and
comments on social media.

1.4     Ethical considerations

The partially free nature of Twitter’s data makes the uses of its content an interesting
ethical debate. Its terms of service specifically state that users’ public posts will be
made available to third parties, and it is not possible to open an account on the plat-
form without agreeing to this. Nonetheless, data extracted from the website contains
personal information, meaning it is subject to relevant data protection legislation
such as the EU’s General Data Protection Regulation (GDPR). This typically would
require informed consent from users to allow researchers to use their data in their
work. Of course, on a project of the scale envisaged here, obtaning consent from every
single user whose tweets are collected is simply infeasible. [10] notes that, during a
previous project involving collecting Twitter data for infectious disease research, no
efforts were made to obtain informed consent from users on the assumption that it
would be overly labour-intensive and would likely garner few, if any, responses. They
remark that this “highlights the need for researchers to work alongside social media
companies, for instance, asking users at the sign up phase whether they are OK with
their content being used for research purposes”.

A 2014 report [11] investigated users’ attitudes to their own social media posts being
collected for scientific research. Users who believed that obtaining consent to collect
their social media data was unnecessary stated two main reasons why: firstly, the
responsibility falls ultimately upon the user to determine the privacy levels of their
post, and indeed whether to post at all; and secondly, if the platform used makes it
clear that posts will be public, obtaining consent to retrieve these becomes redundant.
Those of the opposing view stated variously that obtaining consent helps to promote
trust between the researcher and participants, ascertains whether or not the post was
intended to be posted publicly before using it, or allows users to evaluate the quality
and purpose of the research before allowing their data to be used.

In [12] it is stated that, in cases where it is not possible to obtain informed consent
from users, “a social researcher should establish the fair and lawful basis for collecting
personal information”. Thus: any tweets collected as part of this project will have
virtually all personally-identifying information, such as the username or geolocation,
removed from the tweet data as soon as possible. This takes place either directly at
the point of requesting the data, or once it has first been stored, whichever option is
feasible within the constraints of the API(s) to be used. This leaves solely the text
body of the tweet as the only data to be carried forward into the pipeline. As soon as
is then possible within the pipeline, after the tweet bodies have been transformed

                                                                                        4
Chapter 1. Introduction into whatever data format is required, the original tweets will be deleted altogether. At no point will individual users be identified in the data analysis, nor will any effort made to retrieve further information about the users. 1.5 Report structure In Chapter 2, the technical background to this project is presented. Various techniques are described in detail for text analysis and information extraction, with some discus- sion of how these can be applied in a price prediction context. A few trading concepts are also included, to provide some background for the later evaluation stages. In Chapter 3, various papers making use of these techniques are reviewed. The reported effectiveness of each strategy is taken into consideration, and thoughts are outlined about how these methods could then be applied to the goal of this project. Some focus is also given to shortcomings of these papers, looking for gaps in the methodologies that could be improved upon. After deciding upon a strategy based on the conclusions of Chapter 3, Chapter 4 presents a detailed look at the methodology to be employed in this report. Each individual component of the pipeline is thoroughly explained, as well as the evaluation procedures that will follow. Chapter 5 sees these evaluation procedures put into practice, both presenting the results and also offering an insight into why they come out the way they do. The results are tackled from a multitude of angles to give the best possible insight into the workings of the model. Comparisons are made against similar results obtained in some of the papers studied in Chapter 3. Finally, Chapter 6 reviews the overall project, looking at some of the key takeaways and deliberating where it can be taken next. 5
Chapter 2

Technical Background

2.1     Overview

The concept itself of using social media data to forecast stock movements is some-
thing that has been explored in a number of ways in the last couple of years. In
this section, an overview is presented of a variety of approaches tried and their
underlying technical bases. Considerations will be made as to how each method can
be applied specifically to obtain price predictions for stock movements. Not all of
these approaches will be desirable for this project; some will have methodologies ap-
plicable only in certain setups, while others will have been explored numerous times
already in literature and do not warrant further research. Accordingly, in Chapter 3,
a literature review follows up on these approaches by studying how well they have
performed in existing papers, and looking at potential flaws in the methodology that
could be improved upon.

2.2     Natural language processing

The most obvious starting point for text-based analysis is to look at natural language
processing (NLP) techniques. Broadly, natural language processing covers a range
of procedures for programmatically storing and analysing text-based information.
Early forms of NLP used handwritten grammars and rules to interpret inputs, but
technological breakthroughs now allow for statistical-based interpretations, usually
via machine learning. Today, natural language processing covers a number of different
tasks; ones relevant for the direction of this project will be introduced here.

                                          6
Chapter 2. Technical Background
2.2.1 Part-of-speech tagging
Perhaps the best place to start is with part-of-speech (POS) tagging. This is the
process of taking an input of text and marking each word with its part-of-speech, i.e.
whether it is a noun, verb, article, and so on. For a simple sentence such as this,
We played football with our friends.
it is trivial to match up each word to its part of speech; ‘we’ is a pronoun, ‘played’ is a
verb, ‘football’ is a noun, and so on. However, now consider this small change:
We played football at the park with our friends.
Everything remains fine until it comes to categorising the word ‘park’. As humans, we
can instinctively see that in this case, ‘park’ is a noun, but of course park also exists as
a verb. In this case, the presence of the determiner ‘the’ in front of ‘park’ gives away
that it is a noun, but things are rarely always this clear-cut.
The Duchess was entertaining last night.
Is ‘entertaining’ a verb or an adjective?
A naive approach to POS tagging actually turns out to be surprisingly successful.
By simply assigning each word its most frequent POS tag, and then assigning all
unknown words to “proper noun”, tagging models can achieve accuracies of over 90%
[13]. This works as many words are unambiguous, and out of those that aren’t, most
overwhelmingly take on one specific part-of-speech. Improving on this approach is a
form of probabilistic tagging, whereby one also considers prior words in order to come
to a conclusion, and then further so with hidden Markov models, eventually arriving
at an accuracy of around 97% [14]. Such functionality is now readily available to
anyone via POS tagging libraries such as SpaCy and NLTK.
2.2.2 Lemmatisation
Lemmatisation is the process of taking an inflected or conjugated form of a word, and
returning its base form, known as its lemma. This allows all forms of a word to be
analysed as a single unit.
For example, consider the sentence
7Chapter 2. Technical Background
Nobody saw the Prime Minister for three weeks.
Using the part-of-speech tagger introduced in the previous section, it is now trivial for
a model to parse each word and return its root form. The POS tagger, for example,
will identify that ‘saw’ is a verb, rather than a noun, and so with this information the
lemmatiser can correctly return the root form ‘see’.
2.2.3 Term frequency - inverse document frequency (TF-IDF)
How is it possible to measure how relevant a word is to a forum post, tweet or
document of some kind, in a larger overall collection of texts? One approach that
can be used is TF-IDF (term frequency - inverse document frequency). This is in
fact a product of two separate metrics, the term frequency - how many times a word
appears within a text - and the inverse document frequency, the rarity of the word
across the entire set of texts. The idea behind TF-IDF is that the number of times a
word appears in a text should correspond directly to its perceived importance in that
text, but is offset by the number of texts overall that contain that word. This has the
effect of giving a higher score to words with a high frequency in a small number of
texts, and a lower score to common words that have a high frequency across all texts
(for example, ‘a’, ‘the’, ‘as’, ...) [15].
The two components of TF-IDF can be expressed in a number of ways.
For term frequency T F (t, d), the simplest approach is to use number of occurrences
of the term t in the text d.
T F (t, d) = f req(t, d)
Slightly more advanced variations include using a logarithmic scale [16],
T F (t, d) = log(1 + f req(t, d))
The inverse document frequency IDF (t, D) of a term t in a collection of texts D is
given by
|D|
IDF (t, D) = log
1 + |{d ∈ D : t ∈ d}|
i.e. the logarithm of the size of the corpus divided by the number of texts where the
term t appears.
8Chapter 2. Technical Background
The TF-IDF is thus simply given by
T F IDF (t, d, D) = T F (t, d) × IDF (t, D)
2.2.4 Sentiment analysis
The general process of sentiment analysis essentially involves mining a piece of text
in order to obtain some sentiment score, a subjective indication of how the text views
its subject matter. The text document is firstly broken down into various smaller
parts, such as sentences, within which phrases carrying sentiment are identified.
This is done using some form of sentiment library or sentiment dictionary, a large
collection of words that have been manually scored by humans. One such example is
the extended ANEW dictionary [17], a database of nearly 14,000 words and phrases.
Usually, this sentiment score is a simple mark of ‘positivity’ falling between -1 and
+1, although more in-depth approaches to sentiment analysis can produce a matrix
of different feelings, such as ‘pleasant’ / ‘unpleasant’, ‘active’ / ‘subdued’, ‘relaxed’ /
’nervous’ and so on [18]. The scope of the sentiment analysis may vary.
• A document-level sentiment analysis would aggregate the sentiment scores
collected above across the entire input text to produce a single output score;
• sentence-level sentiment analysis would produce one result per sentence;
• and then also sub-sentence-level sentiment analysis might look to provide a
score for each clause of each sentence, say.
Regardless of the level of scope used, there are a number of issues that may be
encountered when trying to apply this basic level of sentiment analysis to a sentence.
For example, consider the final sentence here from Wired’s review of the Google Pixel
4 smartphone [19]:
... you can get a lot more features for your money if you go elsewhere – the
OnePlus 7T is just one example: more than £100 cheaper, has greater storage
as default and minimal Android bloat.
A basic sentence-level or even sub-sentence-level sentiment analysis as described
above might be able to detect the negative sentiment towards the Pixel 4, and the
positive sentiment in this sentence regarding the OnePlus 7T. However, what if one
were specifically in the market for a smartphone with a good camera, and don’t
particularly care much for the storage options? The sentiment analysis here is too
9Chapter 2. Technical Background
broad to provide any real insight into which phone might be best. These specific
features of the phone - known as aspects - would give a much greater depth of
information were we able to detect the individual sentiment towards each one, rather
than just the phone overall. This concept forms the basis of aspect-based sentiment
analysis.
2.2.5 Aspect-based sentiment analysis
Now that the basics of sentiment analysis have been explained, and some of its
limitations have been acknowledged, it is time to move on to look at aspect-based
sentiment analysis. In this context, an aspect is a property or feature of a named
entity. Named entities can be divided into two: a standard named entity is typically a
product, good, service, employee, etc that is made, sold, manufactured, employed
by, ..., a parent ‘higher-order’ named entity. For example, Apple would be considered
a higher-order named entity, and the iPhone would be one of its associated named
entities. But each of these named entities also have their own features and properties,
and these are what are defined as an aspect. The aforementioned iPhone will have
the aspects screen, battery, camera and so on. It is the calculation of the sentiment for
these individual elements to then propagate back to the higher-order named entity,
rather than on a more general sentence- or document-level basis, that distinguishes
aspect-based sentiment analysis [20].
With all of this in mind, it can be concluded that aspect-based sentiment analysis
is the process of deriving opinions of individual aspects within sentences, in order
to asses whether there is an overall positive, negative or neutral sentiment towards
them, and then use this information to better inform our sentiment calculations for
the higher-order named entities.
Next it is important to know how to relate aspects in a piece of text to a specific
named entity. This process is known as named entity-aspect aggregation. There
are various approaches for this but one is outlined here, involving an unsupervised
learning algorithm. A first pass through the text obtains a list of all named entities
and all potential aspects. Then, a relation likelihood map is created, a series of values
suggesting how likely it is that an aspect is related to any named entity. By default all
are initialised to zero.
Each aspect is then passed through, and has its likelihoods updated for each named
entity. This process follows a similar approach to Bayesian updating. Consider P (R),
the prior named entity-aspect relation likelihood, weighted by previous knowledge of
the named entity α(R); and P (RID), the likelihood of the relation being present in
the document, weighted by the salience of the named entity in the document β(R, D)
(see section 2.2.3).
10Chapter 2. Technical Background
α(R)P (R) + β(R, D)P (RID)
P (R|RID) = (2.1)
α(R) + β(R, D)
Now that the likelihoods of a relation between a named entity and an aspect have
been obtained, the true relations may be identified using thresholds. These thresholds
are largely at the discretion of the user, but one approach is to find all named entities
within a sliding sentence window and select the top named entity that meets a
minimum likelihood value for the given aspect.
After identifying the true relations, it is possible to calculate the sentiments of each of
the aspects. Then, the sentiment of all aspects is aggregated back to the named entity,
to give an overall sentiment of the entity in light of the knowledge of its aspects.
These aspect sentiments are combined with existing information about the named
entity, weighting both as necessary.
2.2.6 Considerations for using natural language processing for
price prediction
The most straightforward potential application of NLP for price prediction is likely to
revolve around making guesses based upon the sentiment scores for various entities
and their aspects. It is plausible that some correlation exists between rises and falls
in sentiment scores for a particular company and corresponding movements in this
company’s stock price.
However, sentiment analysis is by no means perfect, and this introduces an extra
layer of uncertainty for any prediction made by this method. In the literature review
in Chapter 3, the efficacy of sentiment analysis-based methods for price prediction
are considered.
2.3 Latent Dirichlet allocation (LDA)
Latent Dirichlet allocation (LDA), first introduced in [21], is a “generative probabilistic
model”, used in text mining to perform topic extraction. It is a way of representing
the composites (in this case, collections of texts) as mixtures of topics that contain
parts (words and / or phrases - a phrase of n words is referred to as an n-gram) with
certain probabilities.
11Chapter 2. Technical Background
2.3.1 (Collapsed) Gibbs sampling
Gibbs sampling is a method of sampling from a joint distribution, which otherwise
would be difficult to directly sample from. If a sample is desired from, say, a binomial
or multinomial distribution, random numbers may simply be generated from the
relevant range. What then for a multinomial distribution over more than one variable?
Sometimes the distribution can be factorised if the variables are independent, i.e.
P (X1 , X2 , ..., Xn ) = P (X1 )×P (X2 )×...×P (Xn ). However, this is not always possible,
in which case one may turn to Gibbs sampling. Here, samples are iteratively drawn
from the conditional distribution of each Xi , a large number of times (k). After long
enough, this leaves the group of tuples (X1 , ..., Xn )0 , (X1 , ..., Xn )1 , ..., (X1 , ..., Xn )k .
The samples approximate the joint distribution of all variables, and the expected
value can be estimated by averaging over all samples. In the context of LDA, the
sampler needs to compute the probability of a topic z being assigned to a word wi ,
given all other topic assignments to other words [22].
The process of Gibbs sampling over a large number of variables is particularly com-
putationally intensive. For some of these conditionals, it is possible to integrate out
one or more variables to simplify the algorithm. This process is known as collapsed
Gibbs sampling [23], and is useful as it accelerates the convergence to the target
distribution (although comes with its own caveats, such as having a slightly altered
target distribution). Collapsed Gibbs sampling forms the basis for LDA.
2.3.2 The LDA algorithm
Take a set of composites and a fixed number K of topics to extract, and do the
following:
1. Pass through each composite, and randomly assign each part to one of the
topics.
2. For each composite c,
(a) For each part w,
i. For each topic t, calculate the proportion of parts in c currently as-
signed to t, P (t|c), and the proportion of assignments to t over all
composites from w, P (w|t). Recalculate w’s topic by selecting a new
topic t with probability P (t|c) · P (w|t).
The trick with LDA comes with how it assumes the composites are formed. It is a
somewhat flawed set of assumptions, but provides a simplified model of how a piece
of text may be written:
12Chapter 2. Technical Background
1. Select a unique set of parts. In this case of dealing with text data, this would
mean effectively selecting a dictionary from which all words will come.
2. Select how many composites (items of text) to produce.
3. Select how many parts we want per composite (how many words per item
of text), N . This is typically sampled from a distribution rather than a fixed
number.
4. Select the number of topics to produce, k.
5. By
Qk sampling from the Dirichlet distribution over the set of k topics, X ≈
αi −1
i=1 xi with some positive value of α, generate the probabilities of each
part per topic (1), and then for each topic per composite (2).
6. For each composite, sample a topic based on the probabilities in (2), and then
sample a part for this topic based on the probabilities in (1). Repeat until N
parts are obtained.
The value of α used in (1) controls the distribution of parts per topic; a higher α
results in a greater variety of parts, and vice versa. The α used in (2) controls the
number of topics in a composite; the higher the value of α, the greater the mixture
of topics. Because individual tweets are likely to be written about a single subject
matter, a smaller number of topics per composite are desired, and of course not every
word features in a tweet, so both α would be set to a small value (below 1).
The LDA algorithm produces two matrices as output. The first describes the probability
of selecting a particular part when sampling a given topic, and the second describes
the probability of selecting a particular topic when sampling a given composite. A
simple example of the algorithm and the two output matrices is provided in table 2.1.
In this example [24], there are four documents, consisting of (0) four club symbols,
(1) four heart symbols, (2) four diamond symbols, and then (3) four of each of the
above. The two tables are the output of the LDA algorithm. On the right is the
probability of selecting a particular topic when sampling a given composite, and on
the left the probability of selecting a particular part when sampling this topic.
2.3.3 Topic sentiment LDA (TSLDA)
Latent Dirichlet allocation is a powerful tool, but is not able to calculate both senti-
ment and topic categorisation simultaneously. In Nguyen and Shirai’s Topic Modeling
based Sentiment Analysis on Social Media for Stock Market Prediction [6], a new topic
model, Topic Sentiment Latent Dirichlet Allocation (TSLDA) is proposed which can
capture both.
TSLDA starts with the assumption that one sentence expresses only one topic, and
one opinion on that topic. Topics are nouns, while opinion words are adjectives or
13Chapter 2. Technical Background
Topic 0 Topic 1 Topic 2 Topic 0 Topic 1 Topic 2
♣ 0.00 0.00 0.99 Document 0 0.03 0.03 0.93
♥ 0.99 0.00 0.00 Document 1 0.93 0.03 0.03
♦ 0.00 0.99 0.00 Document 2 0.03 0.93 0.03
Document 3 0.33 0.33 0.33
Document 0 ♣♣♣♣
Document 1 ♥♥♥♥
Document 2 ♦♦♦♦
Document 3 ♣♣♣♣♥♥♥♥♦♦♦♦
Table 2.1: A simple visualisation of the LDA algorithm
adverbs. Every word in the document is classified into one of three categories c: a
topic word (c = 1), an opinion word (c = 2), and then all others (c = 0). Every topic
has an associated word distribution, i.e. other words which tend to appear in the
context of this topic, and also an associated opinion word distribution, as the same
qualifier may have different meanings depending on context. A full mathematical
proof of the method is found in the paper [6], but to summarise, any nth word w in a
sentence m and in a document d is drawn from the distribution
b
M ultinomial(Φ )
if cd,m,n = 0
wd,m,n M ultinomial(Φt zt d,m ) if cd,m,n = 1 (2.2)
M ultinomial(Φt zt d,m ,zo d,m if cd,m,n = 2
where Φb , Φt and Φo are the distributions over background, topic and sentiment words
respectively, and z t d,m and z o d,m are the topic and sentiment assignments for sentence
m in document d.
2.3.4 Joint sentiment/topic (JST) model
Introduced in [25], the joint sentiment/topic model (JST) is an unsupervised proba-
bilistic modelling framework, based on LDA, that detects sentiment and topic simulta-
neously from text.
The predominant difference between LDA and JST is that JST associates a docu-
ment with multiple sentiment labels, each associated with its own topic distribution,
whereas LDA used only one document-specific topic distribution [6]. This feature
provides a way for the JST model to measure the sentiment of topics. Documents are
constructed by drawing a word from a distribution over words defined by the topic
and sentiment label, in contrast to LDA which draws only from the topic. Otherwise,
the two methods are largely similar.
14Chapter 2. Technical Background
Figure 2.1: Graphical representation of JST
2.3.5 Considerations for using (TS)LDA for price prediction
Using TSLDA, it is possible to capture topics and sentiments of a document simulta-
neously. Once the sentiments are obtained, the process from here onwards largely
follows that of one outlined in the sentiment analysis section. One potential limitation
of this method is that the number of topics to extract, K, must be specified before-
hand, rather than being determined during the process. Without actually reading
all of the news content in advance to see how varied the discourse is, how possibly
can the number of topics to divide the text into be known? A grid- or random-search
approach, considering a variety of values for K for each individual stock, will likely
be required.
2.4 Sparse matrix factorisation (SMF)
First introduced in a social media text analysis context in [9], the sparse matrix
factorisation (SMF) model is a price prediction technique based on a characterisation
of a stock (e.g. its sector) and the average investor mood on a given day. The price of
a stock on any day is a function of the latent features of the stock and the investor
mood at the time.
r̂it = uTi vt (2.3)
Each stock i is associated with a feature vector ui , and the text data on a trading
period t is associated with vector vt . The dot product of the two vectors r̂it captures
the interaction between stock i and day t [26].
15Chapter 2. Technical Background
By then introducing a word frequency text vector yt , vt is replaced with W yt , where
W is some mapping matrix to be learned. After dealing with overfitting, a prediction
can be made for tomorrow’s log return given today’s text data.
2.4.1 Lagrangian method of multipliers
Understanding the methodology behind the SMF approach first requires knowledge
of the Lagrangian method of multipliers.
The Lagrangian method of multipliers is a technique for finding the maximum or
minimum of a multivariable function f (x, y, ...), when there is some constraint on the
input variables, g(x, y, ...) = c.
Firstly, the Lagrangian of the function g is introduced with use of a new variable λ,
L(x, y, ..., λ) = f (x, y, ...) − λ(g(x, y, ...) − c) (2.4)
The variable λ is referred to as a Lagrangian multiplier.
Next, the gradient of L is set equal to 0, to find the turning points.
OL(x, y, ..., λ) = 0 (2.5)
For each solution i, with values (xi , yi , ..., λi ), calculate f (xi , yi , ...). Whichever gives
the largest (smallest) value gives the maximum (minimum) point.
2.4.2 Augmented Lagrangian method
The augmented Lagrangian method, or penalty multiplier method, is a technique to
solve an optimisation problem with multiple inequality constraints [27].
Consider the problem
minimise f (x) (2.6)
s.t. g(x) = 0
One way to look to solve this is via the introduction of a penalty parameter ρ.
16Chapter 2. Technical Background
ρ
minimise f (x) + kg(x)k22 (2.7)
2
In order for this to produce an appropriate result, ρ must be allowed to grow very
large, otherwise the constraint that g(x) = 0 will not be met. This is not always
computationally feasible. Instead, the constraint g(x) = 0 can be relaxed by some
value that allows much smaller values of ρ to be used [28]. The problem thus becomes
minimise f (x) (2.8)
λ
s.t. g(x) − =0
ρ
Substituting this new constraint into (2.7) gives
ρ λ 2
minimise f (x) + g(x) − (2.9)
2 ρ 2
ρ
= f (x) + kg(x)k22 − g(x)T λ (2.10)
2
(2.10) is known as the augmented Lagrangian, LA (x, λ, ρ). The method for solving
this problem then proceeds thus:
1. Pick some values for λ and ρ
2. Minimise LA (x, λ, ρ) as a function of x
3. Using the new value of x, derive new values for λ and ρ
4. Repeat until convergence or a maximum number of iterations is reached.
2.4.3 Alternating direction method of multipliers (ADMM)
The alternating direction method of multipliers, or ADMM, is a variant of the aug-
mented Lagrangian method. It can be used to solve the minimisation problem that
underlies the SMF approach.
Consider a problem of the form
minimise f (x) + g(x) (2.11)
17Chapter 2. Technical Background
By making a trivial adjustment to this problem,
minimise f (x) + g(y) (2.12)
s.t. x = y
a constraint has now been introduced that allows this problem to be solved via
methods of constrained optimisation, i.e. the augmented Lagrangian method. The
dual variables are updated one by one (i.e. solving for x with y fixed, and then solving
for y with x fixed) before repeating the process again.
2.4.4 Bartels-Stewart algorithm
When applying ADMM in the context of SMF, one of the variable update steps
involves a matrix equation that cannot immediately be rearranged for the right value
(see Appendix A.2). Instead, by rearranging the equation to become of the form
AX + XB = C, known as a Sylvester equation, it is possible to solve for X using the
Bartels-Stewart algorithm, introduced in 1972 [29].
An overview of the Bartels-Stewart algorithm is as follows (proof can be found in
[29] or [30]):
1. Compute the real Schur decompositions
R = U T AU (2.13)
S = V T BT V (2.14)
The Schur decomposition of a matrix A, T = QAQ−1 , produces the quasi-upper
triangular matrix T , a matrix whose diagonal consists of 1 × 1 or 2 × 2 blocks,
and whose eigenvalues are the diagonal values of A [31].
2. Solve U F = CV for F , i.e. F = U T CV
3. Solve RY + Y S T = F , where Y = U T XV , via forward substitution
4. Obtain X via X = U Y V T .
2.4.5 Considerations for using SMF for price prediction
Sparse matrix factorisation particularly distinguishes itself from the two previous
methods because its independence from sentiment analysis removes a layer of un-
certainty from the prediction-making. The more reliable the data underlying the
18Chapter 2. Technical Background prediction methodology, the more reliable the results are as well. As will be seen in the next chapter, its applicability to trading in this such context is also far less researched when compared to sentiment analysis, making it a particularly interesting candidate approach. 2.5 Trading As a bookend to this section, it may be useful to briefly adumbrate a few concepts within trading that will come up later in the project. 2.5.1 Longing vs shorting The most intuitive and well-known action in market trading is buying, or longing, a stock. The stock is purchased at a given price (known as its asking price) and in a given quantity, and then becomes part of the trader’s portfolio. As the value of the stock rises or falls over time, the value of the trader’s investment rises or falls with it. At some point, the trader may choose to sell their investment. For an immediate sale, they can sell it at the highest bidding price, or otherwise they can list their desired price on an exchange and wait for a buyer to take it up. The aim, of course, is for the trader to make money by pulling off a sale at a higher price than what they paid for it. Shorting, on the other hand, is the process of borrowing shares from a broker, selling them at the current bidding price, and then buying them back later - ideally at a lower price, allowing the trader to keep the difference as profit, but having to pay out extra if the shares are later bought back at a higher rate. Shorting is considered riskier than going long because while the greatest risk of the latter is simply to lose all initial capital (i.e. if the price should fall to zero), shorting can result in losing more money than is initially invested. If a trader has £10,000 and shorts that amount’s worth of stock, and the stock doubles in price, the trader is sitting on a £10,000 loss - but if the stock then rises any further, the loss naturally rises with it, outstripping the trader’s initial funds. 2.5.2 Trading fees Trading fees can broadly be divided into two forms: a fixed-rate per-trade fee, or an implicit fee introduced via an enlarged bid-ask spread. A fixed-rate fee is simply a small sum added to every transaction; examples of brokers charging such fees include Barclays (£6/trade) or IG (£3-8/trade depending on prior usage). The alternative, an enlarged bid-ask spread, is a way around charging fixed fees that still enables 19
Chapter 2. Technical Background

the broker to make money. The bid-ask spread is simply the difference between the
asking price and the bidding price for a stock - for example, at a given moment in time
a stock may be purchased at £400, but sold for only £398, giving a bid-ask spread
of £2. Some brokers, such as Plus500, fix this spread at a specific value, usually one
slightly larger than found elsewhere, and take their profits from this. Such brokers
tend to place “0% commission” as a central part of their advertising, reflecting the
lack of any overt fees per transaction, but the enlarged spread can sometimes incur
greater losses than an ordinary fee if the trader is not careful.

  Figure 2.2: An example bid-ask spread for Bitcoin/GBP on the Kraken trading exchange.

In addition to the trading fees, stamp duty is charged at 0.5% on any shares purchased
electronically in the United Kingdom.

2.5.3    Efficient market hypothesis

The efficient market hypothesis is a theory that states that a stock’s price represents
all public information about it, and that the only information that moves this price
is therefore new information. If a piece of particularly negative news comes out
about a company, its share price drops until this news has become “priced in”; it
is then no longer useful for trading. This means neither technical (price) analysis
nor fundamental analysis should, in the long run, produce any better returns than
a randomly-selected portfolio of stocks to buy and hold. Beating the market on a
risk-adjusted basis - i.e., formulating a trading algorithm based on news and tweets
with a prediction accuracy of over 50% - should not be possible.

                                                                                      20
Chapter 2. Technical Background
While the premise of the hypothesis is widely believed to hold true to this day, the
implications derived from it are often disputed. Many economists today believe
the markets are at least partially predictable. A considerable record of criticisms
and evidence against the efficient market hypothesis is presented by BG Malkiel
in [32], although interestingly after considering it all, he ultimately concludes that
the markets are far less predictable than is sometimes believed, and do not present
opportunities for particularly extraordinary rates of return.
2.5.4 Sharpe ratio
The Sharpe ratio [33] is a metric of risk-adjusted returns for a given fund. The higher
a fund’s Sharpe ratio, the better its returns have been relative to the risk.
E[Ra − Rb ]
Sa =
σa
where Ra is the asset return, Rb is the risk-free return, and σa is the standard deviation
of the asset return. The Sharpe ratio is calculated for all stocks and, as it is based
on standard deviation rather than straight values, can be used as a comparison tool
between stocks to judge performance and desirability.
2.5.5 VaR and CVaR
Value at risk (VaR) and conditional value at risk (CVaR) are, as their names suggest,
measures used to evaluate risk, with CVaR in particular being a useful approximation
of potential losses of a stock. VaR and CVaR are most commonly measured at three
different intervals - 95%, 99% and 99.9%.
VaR
If, say, VAR(95) = 2%, this means there is a 5% (100 - 95) chance of losing 2% or
more on a given day.
CVaR
If now CVAR(95) = 3%, this means that in the worst 5% of returns, the average loss
is 3%.
21Chapter 2. Technical Background
CVaR is usually preferred to VaR as it provides an average expected loss, rather than
a whole range of potential losses.
2.6 Summary
A whole range of methods are available to use, each with their own strengths and
weaknesses. Sentiment analysis seems the obvious place to start for such a project, but
has been covered countless times already, and the sentiment estimates themselves, let
alone the predictions they lead to, are not always accurate. Latent Dirichlet allocation
is perhaps able to obtain more deeply-rooted sentiment than from a standard text
classifier, but ultimately suffers the same drawbacks as the latter. It is the sparse matrix
factorisation approach that seems the most promising - a relatively new method and
one that avoids the uncertainty associated with sentiment-based techniques. In the
next chapter, examples in existing literature are presented of each of these methods
being used for stock market prediction, with the methodologies scrutinised and
opportunities for improvement discussed.
22Chapter 3
Literature Review
3.1 Overview
Each of the approaches for stock prediction reviewed in the previous section has
already seen varying degrees of interest in existing literature. In this chapter, a
round-up is offered of notable papers and the outcomes achieved in them.
The overarching theme of the papers collected in this section is their primary use of
text data to inform investment decisions. The data sources themselves vary somewhat
in style and quantity of data, so any papers using realtime social media are definitely
of greater relevance to the plans for this project, but it is specifically the abilities of the
models presented to predict stock movements that are of biggest interest at this stage.
Some of the techniques described in Chapter 2, such as sentiment analysis, have
been investigated in a considerable number of articles already, while only two known
papers (at the time of writing) have attempted to study sparse matrix factorisation
for text-based investment. At the end of the chapter, each method will be considered
in the context of the goal of this project, and a decision will be taken on which one to
bring forward to development.
3.2 Aspect-based sentiment analysis
Several attempts have been made to apply sentiment analysis to social media data
for making stock predictions, with varying degrees of success. Nguyen, Shirai and
Velcin’s work [5] implements a sentiment analysis-based approach on messages from
the Yahoo Finance message boards for 18 stocks, collected over a period of one
year. On this particular website, the messages are categorised explicitly by the stock
being discussed (e.g. AAPL), and it is possible for users to add a sentiment tag to
their messages (one of five options - Strong Buy, Buy, Hold, Sell, Strong Sell). The
23Chapter 3. Literature Review
existence of these sentiment tags and the fact that the messages are already clearly
categorised by stock initially gave this approach some verisimilitude, by providing
the authors with a fairly substantial advantage in that the need to use sentiment
analysis is theoretically almost entirely negated. However, only 15.6% of messages
were found to use the sentiment tag functionality, and so they did ultimately fall
back on an aspect-based sentiment analysis approach in order to make use of the
remaining messages. Issues with the accuracy of sentiment analysis have already
been discussed in Chapter 3.
Regardless, the end result was that, in terms of prediction accuracy (how many
price rises or falls the model guesses correctly), the aspect-based sentiment analysis
outperformed regular sentiment analysis, LDA and JST (see sections 2.3 and 2.3.4)
by 2.54%, 2.14% and 2.87% on average. The average prediction accuracy was a
reasonable 54.41%, although being an average, on a number of stocks it did in fact
perform worse than the aforementioned methods (and for a few stocks, actually
performed worse than simply guessing). While it was encouraging to see aspect-
based sentiment analysis used in this field, there are a number of potential issues
with regards this project with the approach taken by the authors. The focus in this
report to use Twitter as the primary data source stems from the desire to mine the
opinions of the general public, and not just specifically people with a specific interest
in investing. It is quite possible, even likely, that somebody posting on a stock’s
message board may well have a vested interest in the direction of the stock, and given
a more niche stock, a particularly well-regarded user could even attempt to influence
this direction themselves - perhaps less of a potential threat with traditional stocks
but very much an ongoing problem in the world of cryptocurrencies [34][35]. There
is no indication either as to how much better the model performed on text inputs that
made use of the sentiment tag functionality, calling into question the usefulness of
the Yahoo Finance message board as a data source.
3.3 TF-IDF as a feature weighting mechanism
In [5], TF-IDF is used in the process of classifying forum messages into one of five
sentiment categories. By representing each forum message as a bag of words made
up of the message title and body, and weighting each word by its TF-IDF score,
the authors were able to determine which of the words in the messages were most
relevant to estimating the messages’ sentiment. This is an interesting approach to
take and would translate well to the Twitter use case, where the messages would
be replaced by tweets and the corpus simply the entire volume of tweets collected.
However, other weighting mechanisms relating to the origin of the tweets collected
are likely to be required in addition to this. A couple of questions that will require
answering include:
24Chapter 3. Literature Review
• Should a higher weighting be assigned to tweets from accounts with greater
influence (e.g. followers, average tweet engagement etc.)? Such a weighting
would assume a positive correlation between influence and knowledge of the
market in some way. Does this correlation actually exist?
• How are spam / bot accounts detected and what weighting, if any, should be
assigned to their tweets?
3.4 LDA and TSLDA
An LDA-based method is also presented in [5], and is used as a price prediction
baseline. The contents of all messages on the Yahoo Finance boards are divided into
50 topics, with probabilities on each transaction date deriving from the frequency
of a given topic appearing alongside a price rise or fall. With 1,000 iterations and
the 50 hidden topics, the LDA-based model achieved an average price movement
prediction accuracy of 52.27%, slightly better than the JST-based model but worse
than that with aspect-based sentiment analysis. In this example however, the LDA
approach is perhaps critically flawed in that the number of topics to extract must be
specified beforehand. When collecting a forum of messages, it is entirely possible that
the entire thread would be a discussion of one single topic, meaning the decision to
extract 50 topics would lead to very arbitrary categorisation. This limitation makes
it very difficult to imagine a successful implementation of LDA for a Twitter-based
approach.
Meanwhile, in [6], TSLDA is introduced in the context of predicting the direction of
stock movements, rather than specifically the price. Five message boards from the
stocks of Exxon Mobil, Dell, eBay, IBM and Coca-Cola are scraped for messages over
a one-year period. Firstly, every word from every message is classified into one of
the aforementioned three categories. All nouns are extracted first; next, any word
that is not a noun but that appears in a list of opinion words in SentiWordNet [36] is
classified as an opinion word; and then the remaining words are left as others. Just as
with standard LDA, the TSLDA model is then trained using collapsed Gibbs sampling
with 1,000 iterations.
3.5 Joint sentiment / topic
Joint sentiment / topic was introduced [25] in a more general sentiment analysis
context, rather than specifically for social media analysis, but following papers have
indeed applied it to social media, giving a useful overview of its effectiveness. In
its introductory paper, the authors applied it to a dataset of film reviews, looking to
classify them as either positive or negative. Incorporating no prior information, JST
25You can also read