THE DIGITAL AGRICULTURAL REVOLUTION: A BIBLIOMETRIC ANALYSIS LITERATURE REVIEW
←
→
Page content transcription
If your browser does not render page correctly, please read the page content below
T HE D IGITAL AGRICULTURAL R EVOLUTION :
                                                            A B IBLIOMETRIC A NALYSIS L ITERATURE R EVIEW

                                                                                                   A P REPRINT

                                                                Riccardo Bertoglio∗, 1 , Chiara Corbo2 , Filippo M. Renga2 , and Matteo Matteucci1
arXiv:2103.12488v1 [cs.DL] 23 Mar 2021

                                                        1
                                                         Department of Electronics, Information and Bioengineering, Politecnico di Milano, Milan, Italy
                                                  2
                                                      Department of Management, Economics and Industrial Engineering, Politecnico di Milano, Milan, Italy
                                                       {riccardo.bertoglio, chiara.corbo, filippo.renga, matteo.matteucci}@polimi.it

                                                                                                  March 24, 2021

                                                                                                   A BSTRACT
                                                       The application of digital technologies in agriculture can improve traditional practices to adapt to
                                                       climate changes, reduce greenhouse gas emissions, and promote a sustainable intensification for
                                                       food security. The terms Smart Agriculture, Digital Agriculture, and Agriculture 4.0 are used in
                                                       the literature to describe the digitalization of agricultural practices. Some authors argued that we
                                                       are experiencing a Digital Agricultural Revolution (DAR) that will boost sustainable farming. Nev-
                                                       ertheless, there is no clear and commonly accepted definition of the DAR-related terms, and it is
                                                       not even evident which are the technological pillars supporting the DAR. To find evidence of the
                                                       DAR’s on-going process, we investigated the scientific literature with bibliometric analysis tools
                                                       to produce an objective and reproducible literature review. We retrieved 4995 articles by querying
                                                       the Web of Science database in the timespan 2012-2019, and we analyzed the obtained dataset to
                                                       answer three specific research questions: i) what is the spectrum of the DAR-related terminology?;
                                                       ii) what are the key articles and the most influential authors, journals, institutions, and countries?;
                                                       iii) what are the main research streams and the emerging topics? By grouping the authors’ keywords
                                                       reported on publications, we identified five main research streams: Climate-Smart Agriculture, Site-
                                                       Specific Management, Remote Sensing, Internet of Things, and Machine Learning. To provide a
                                                       broad overview of each of these topics, we analyzed relevant review articles, and we present here
                                                       the main achievements and the on-going challenges. Finally, we showed the trending topics of the
                                                       last three years (2017, 2018, 2019).

                                         Keywords precision agriculture · climate-smart agriculture · digital agriculture · agriculture 4.0 · bibliometrics ·
                                         literature review

                                            ∗
                                                Corresponding author
A PREPRINT - M ARCH 24, 2021
1 Introduction
A worldwide ever-growing population has to cope with the limited resources of our planet. The FAO stated that in
2050 we would be 9 billion people, and the food demand will grow by 70% [1]. However, arable land is limited, and
climate changes endanger crop yields. Reacting to these threats is of paramount importance. Indeed, the UN 2030
agenda within its 17 Sustainable Development Goals (SDGs) has planned, among other objectives, to reach sustainable
food production systems via agricultural practices that increase productivity and that adapt to climate change [2].
Reaching more productive and sustainable agriculture within a changing climate is a tough challenge; agricultural
practices need to be revolutionized to meet the SDGs by 2030. The on-going process of agricultural digitalization
seems promising to face the upcoming challenges. This revolutionary process is called Digital Agricultural Revolution
(DAR) and is bringing innovations to support the farmers by increasing crop yields while reducing the environmental
impact [3]. In 2019, the FAO stated that “market forecasts for the next decade suggest a “digital agricultural revolu-
tion” will be the newest shift which could help ensure agriculture meets the needs of the global population into the
future” [4].
The first paragraph of this introduction is a typical opening of most of the DAR-related articles. This framework
is called Climate-Smart Agriculture (CSA) and can be defined as “a strategy to address the challenges of climate
change and food security by sustainably increasing productivity, bolstering resilience, reducing GHG emissions, and
enhancing achievement of national security and development goals” [5]. Since the FAO and the World Bank have
formalized this concept in 2010, CSA has appeared in many forms. The advent of digital technologies in agriculture
has shaped the CSA concept giving birth to new terms like Smart Agriculture, Digital Agriculture, and Agriculture
4.0.
Digital technologies like Artificial Intelligence (AI), Robotics, and the Internet of Things are expected to be game-
changers to achieve the CSA objectives. Digital technologies allow for detailed real-time data analysis. Data are
collected by smart sensors, ground robots (Unmanned Ground Vehicles), aerial drones (Unmanned Aerial Vehicles),
or satellites [6]. This big amount of data is analyzed by Artificial Intelligence algorithms producing information. Thus,
farmers can make decisions supported by math instead of entirely relying on their personal beliefs. These technologies
allow increasing productivity while decreasing costs and being more environmentally friendly.
The DAR is a growing trend both in the research community and the private sector. However, there is no common
acceptance of when the digital revolution has started and what are its enabling technologies. In the scientific literature,
authors refer to the DAR in different ways. Many authors still use the term “Precision Agriculture” that is in use since
the ’90s [7, 8]. Others prefer the more modern terms of “Smart Agriculture” or “Digital Agriculture” [9, 10]. It is very
recent the use of Agriculture 4.0 [11, 12].
In this work, we relied on bibliometrics tools to give a complete description of the DAR research field’s boundaries
and dynamics. Bibliometrics is applying quantitative analysis and statistics to published articles to measure their
impact [13]. Traditionally, the two main methods for synthesizing past research findings have been the qualitative ap-
proach of a structured literature review and the quantitative approach of meta-analysis. While the qualitative approach
suffers from the subjective biases of the researchers involved in the process [14], bibliometrics is a method to perform
a systematic, objective, and reproducible analysis of the scientific activity. This is particularly useful in a fragmented
domain such as that of DAR [15].
Literature reviews are increasingly becoming important due to the fast-growing pace of scientific production. Syn-
thesizing the existing knowledge base is crucial for advancing the line of research. Bibliometric methods become
particularly useful to provide an objective analysis of an unstructured and large body of information. They can be used
to detect the emerging and trending topics, the most influential journals/authors/institutions, the principal research
streams, and to show the “big picture” of a research field.
According to our best knowledge, there are still no literature reviews that exploited bibliometric analysis for summa-
rizing the entire DAR research field. Existing bibliometric studies are based on incomplete queries that do not account
for word combinations or lack relevant terms. For instance, the authors of [16] made a bibliometric analysis review of
information and communication technologies (ICT) in agriculture. However, they limited their research to a subset of
the literature. Also, they did not perform a data preparation and cleaning phase, which is crucial for identifying rele-
vant groups of words (topics). Similarly, the authors of [7, 8], focused their query only on the “Precision Agriculture”
field. Other bibliometric analysis works are focused on more specific themes: in [17], the authors did a review about
Big Data in agriculture; in [18] the authors made a bibliometric analysis regarding the digital technologies for plant
phenotyping; in [19] they did a bibliometric literature review about the digital agricultural techniques in the coffee
sector; in [20] the authors focused on the use of Unmanned Aerial Vehicle in agriculture.
2A PREPRINT - M ARCH 24, 2021
This paper aims to a comprehensive analysis of the DAR research field with the tools of bibliometrics to answer three
specific research questions:
RQ1 - What is the spectrum of the DAR-related terminology?
RQ2 - What are the key articles and the most influential authors, journals, institutions, and countries?
RQ3 - What are the main research streams and the emerging topics?
By answering the above research question, this paper aims to provide researchers a comprehensive and objective
view of the DAR research field. It also supports the research process by identifying potential collaborations, the key
journals to publish on, and giving research directions by identifying the emerging topics. This paper is also helpful for
policy-makers to have a complete view of the possibilities, advantages, and challenges associated with the DAR.
The outline of the paper is as follows. In Section 2, we present an overview of the DAR related terminology. In
particular, we focused our analysis on the recently emerging “Agriculture 4.0” term. We summarized the different
authors’ opinions about its definition and birth. In Section 3, we present the methodology and the tools used for the
bibliometric analysis. We motivated the choice of the publication database and clarified the data preparation process.
In Section 4, we present the bibliometric analysis results along with our interpretation. We grouped the author’s
keywords to obtain the main research streams, and for each one, we selected and summarized some relevant review
articles. Finally, in Section 5, we provide research directions and draw some conclusions.
2 DAR Terminology and Boundaries
Figure 1: Yearly smoothed number of studies published in the WoS database from 1993 to 2019 containing the
corresponding term.
Precision Agriculture, Climate-Smart Agriculture, Smart Farming, Digital Agriculture, and Agriculture 4.0 are only
a few of the names used to refer to the DAR. To make some order, we analyzed the literature employing the Web of
Science (WoS) database. We aimed at figuring out how these terms’ popularity evolved over the years.
We retrieved from the WoS database the yearly number of studies in the time-span 1993-2019 (being 1993 the year
of the oldest publication in the database) that contained one or more of the following terms: “precision agriculture”,
“precision farming”,“climate-smart agriculture”, “smart agriculture”, “smart farming”, “intelligent agriculture”, “in-
telligent farming”, “digital agriculture”, “digital farming”, “agriculture 4.0”.
Figure 1 shows the year-wise smoothed distributions of the number of studies published between 1993-2019 that
contain each of the terms above. We smoothed the year-wise distributions by using the R loess() function that is based
3A PREPRINT - M ARCH 24, 2021
on Local regression, a kind of non-parametric regression model [21]. In the figure, note that the distribution of the
“Digital Farming” term overlaps that of “Agriculture 4.0”. Also, the terms “Intelligent Agriculture” and “Intelligent
Farming” have been excluded from the following analysis since they showed similar year-wise distributions (even if
of a smaller entity) to those of the terms “Smart Agriculture” and “Smart Farming”, respectively. Indeed, “intelligent”
and “smart” are synonyms, being the latter more used in the DAR research field.
From Figure 1 it is possible to see that the term “Precision Agriculture” is the most used in the literature. Precision
Agriculture (PA), “or information-based management of agricultural production systems, emerged in the mid-1980s as
a way to apply the right treatment in the right place at the right time” [22]. PA has been enabled by technologies such
as Global Navigation Satellite System (GNSS), Geographic Information System (GIS), and microcomputers. These
technologies led to innovations like Variable Rate Technology (VRT) or the auto-guidance systems.
VRT consists in spreading a variable quantity of resources (water, fertilizers, and pesticides) by considering the soil
and crop variability across the field. The auto-guidance systems exploit GNSS signal and fields’ maps to compute
smart routes for agricultural machines. Routes are computed to minimize multiple coverages of the same field area, a
well-known agricultural problem that causes waste of resources.
The first appearance of the term Precision Agriculture in the WoS database dates back to 1994. Thus, it seems inap-
propriate to describe the recent digital revolution, characterized by technologies like Big Data and Cloud Computing,
using the term Precision Agriculture (or its synonym Precision Farming).
In Figure 1 it is also possible to recognize a set of trending terms: “Climate-Smart Agriculture”, “Smart Agriculture”,
and “Smart Farming”. They all saw a rapid increase since 2012, two years after the formalization of the concept of
CSA from the FAO in 2010 [23]. CSA is one of the five main research streams that we identified in this study, and it
will be treated in depth in Section 4.4.1.
The temporal evolution of the terms “Climate-Smart Agriculture”, “Smart Agriculture”, and “Smart Farming” suggests
a connection between them since they show a similar year-wise distribution. Moreover, from an inspection of the
literature, it can be stated that “Smart Agriculture” studies share the same objectives of CSA while having a focus
on digital technologies. CSA it is a general framework for promoting sustainable agricultural practices that adapt to
climate change. However, CSA does not specify which are the means for reaching its objectives. Conversely, the
entirety of analyzed studies regarding “Smart Agriculture” are based on digital technologies [9–12, 24–27]. “Smart
Agriculture” (or “Smart Farming”) can be defined as the application of digital technologies for reaching the CSA
objectives.
The term “Digital Agriculture” appeared for the first time in the WoS database in 2002. Since then, it has only
gained relatively little attention in recent years. From an inspection of the literature, it can be stated that the terms
“Digital Agriculture” and “Digital Farming” are neither more than synonyms of “Smart Agriculture”. Again, “Digital
Agriculture” studies share the same objectives of CSA while showing a focus on digital technologies [12, 28–30].
Finally, the emerging term “Agriculture 4.0” has appeared for the first time in the WoS database in 2016. Even if
this term’s popularity is still in its infancy, the FAO formally adopted it for the first time in 2020 [31]. Thus, it is
foreseeable that “Agriculture 4.0” will gain more attention in future years, with a diffusion similar to that of CSA after
its formalization in 2010. Following this reasoning, we investigated the scientific literature to clarify the brand-new
“Agriculture 4.0” concept.
2.1 What is Agriculture 4.0?
In November 2020, the FAO published an article about Agriculture 4.0 [31] describing it as “agriculture that integrates
a series of innovations in order to produce agricultural products. These innovations englobe precision farming, IoT
and big data in order to achieve greater production efficiency”.
However, a commonly accepted definition of the term “Agriculture 4.0” still does not exist. To give the reader a
context and the boundaries of the emerging Agriculture 4.0 concept, we analyzed studies that used this term. We
found 45 studies by querying all the WoS database’s indices on the 26th of November 2020. We used “agriculture 4.0”
as the query “Topic” without any filter. Of these 45 studies, 13 did not explain the term “Agriculture 4.0”, 7 were not
accessible by us or were duplicates. Thus, we analyzed the remaining 25 studies, and we collected the explanations
the authors gave of Agriculture 4.0. By summarizing all these explanations, in the following, we report a description
of Agriculture 4.0.
Agriculture 4.0 is a neologism coming from the concept of Industry 4.0. It is associated with the Digital Agricul-
tural Revolution since its pillars are digital technologies such as Artificial Intelligence, Big Data, Cloud Computing,
Robotics, Internet of Things (IoT), Remote Sensing, and the Blockchain [26, 32]. The aim of Agriculture 4.0 is of
4A PREPRINT - M ARCH 24, 2021
optimizing agricultural tasks by reducing inputs (water, fertilizers, pesticides) [33] and increasing farms productivity
coping with climate change [26, 34]. Agriculture 4.0 allows to increase the profit margin for farmers and reduce
environmental contamination.
According to Agriculture 4.0, farmers are assisted by a Decision Support System that guides them in programming
the treatments [26, 35–38]. They will no longer have to apply water, fertilizers, and pesticides uniformly across entire
fields. On the contrary, farmers will use the minimum quantities of resources that the plants require. Variable Rate
Technology (VRT) [39] enables for precise and targeted spraying of substances with a centimeter accuracy [40, 41].
Data are collected in a multi-sensorial way by operating at different scales: spatial (where), temporal (when), and
spectral (what) [39]. Sensors are installed in the fields and on robotics platforms like Unmanned Ground Vehicles or
Unmanned Aerial Vehicles (aerial drones). Satellites data are also employed, and multiple-source data integration is
performed [35].
Agriculture 4.0 stands for the combined internal and external integration of farming operations [35, 42]. Prediction
models help to handle better external factors such as weather conditions, market behaviors, and current trends in
needs [43]. Moreover, information are collected along the entire supply for integration and traceability purposes [34,
44].
Agriculture 4.0 envisages the entire value chain, from the farmer to the distribution, connected via the internet to
achieve coordination and information sharing. The value chain’s actors are connected with a continuous and data-rich
communication thanks to the virtualization of the processes [42]. Physical and virtual objects can interconnect and
interact with autonomously [37].
Agriculture 4.0, thanks to wideband connection technology and cloud storage, allows a real-time view on the farm and
creates agro-ecosystems of connected farms and machinery [45, 46]. Agriculture 4.0 brings a new concept of whole-
farm management based on the cross-industry cooperation of stakeholders, infrastructures, and technologies [37].
Thus, all the involved actors can decide even on issues outside their expertise area [47].
Finally, some authors include in Agriculture 4.0 advances from other disciplines beyond those related to digital tech-
nologies. These advances are genetic engineering, 3D-printing-based food supply, meat culturing, vertical farming,
aquaponics, and circular agriculture [36, 47, 48].
2.2 Where does the term Agriculture 4.0 come from?
It is still not completely clear where the term Agriculture 4.0 comes from. It is explained by many authors as an analogy
to the Industry 4.0 revolution [19, 33, 35, 37, 42, 43, 45, 46, 48–50]. Indeed, the Industry 4.0 revolution has been
characterized by the automation of traditional industrial practices by the integration of advanced digital technologies
like the IoT and processes virtualization.
Other authors say that Agriculture 4.0 is a fourth of a sequence of agricultural revolutions and eras. However, there
are multiple schools of thought (SoT) about this historical view:
• SoT1 - The Agriculture 1.0 era was labor-intensive and characterized by animal forces. Simple tools were
used in agricultural activities. The Agriculture 2.0 era originated with the mechanization process brought by
the combustion engine. Farmworks significantly increased in productivity and efficiency. The Agriculture 3.0
era was that of Precision Agriculture, starting when military GPS-signals were made accessible for public use.
Precision Agriculture helped reduce chemicals through innovations like the Variable Rate Technology [26,
32, 42].
• SoT2 - The Agriculture 1.0 era was characterized by motorization. The Agriculture 2.0 era originated from
mechanization. The Agriculture 3.0 era was driven by humanism and electronics [50].
• SoT3 - The first agricultural revolution was characterized by mechanization (Agriculture 1.0), the second was
constituted by the Green Revolution and its genetic modifications (Agriculture 2.0), and the third agricultural
revolution was Precision Agriculture (Agriculture 3.0) [51].
• SoT4 - The first revolution is the transition from hunter-gathers to settled agriculture (Agriculture 1.0). The
second originated from the innovations of the British Agricultural Revolution (Agriculture 2.0), and the third
characterized by the Green Revolution (Agriculture 3.0) [11, 48].
SoT1 seems to be the most backed up by researchers. However, such plurality of hypotheses suggests that the term
“Agriculture 4.0” is more likely an analogy of Industry 4.0 than the fourth in a series of agricultural revolutions.
5A PREPRINT - M ARCH 24, 2021
2.3 How should the DAR be called?
The term “Precision Agriculture” first appeared in the literature in the 1990s. Thus it seems inadequate to describe
the 2010s DAR. Figure 1 shows a clear rising trend of three terms: Climate-Smart Agriculture, Smart Agriculture
and Smart Farming. From an inspection of the literature, it is possible to conclude that Smart Agriculture (and Smart
Farming) is applying digital technologies for reaching CSA objectives.
It can then be assumed that the DAR saw its birth in 2010 after the formalization of CSA concept from the FAO and
the World Bank [23]. An inspection of the literature suggests that Digital Agriculture (or Digital Farming) is used
interchangeably with Smart Agriculture without showing any relevant difference. Nevertheless, at the time of writing,
the term Smart Agriculture is the most popular.
The term “Agriculture 4.0” has been described by a FAO’s publication for the first time in 2020. However, more
contributions are needed to define its definition and boundaries clearly. The literature analysis presented in Section 2.1
shows that Agriculture 4.0 shares the same objective of CSA while specifying the framework and technologies to be
adopted. The Agriculture 4.0 concept underscores digital technologies like the Internet of Things, Big Data, sensing
technologies, robotics, automated equipment, and satellite image and positioning [31].
From the description we gave in Section 2.1, we can observe that some authors include in Agriculture 4.0 innovations
from other disciplines beyond those related to digital innovations. Genetic engineering, 3D-printing-based food supply,
meat culturing, vertical farming, aquaponics, and circular agriculture are all considered part of Agriculture 4.0. In this
perspective, Agriculture 4.0 contains but is not limited to the DAR. Thus, Agriculture 4.0 could describe a broader
revolution characterized by digital technologies and disruptive innovations in many fields.
In conclusion, the CSA framework gives a purpose to the DAR. The DAR is most commonly called Smart Agriculture,
and other synonyms are Smart Farming, Digital Agriculture, and Digital Farming. However, many authors still use
Precision Agriculture to refer to the DAR. Agriculture 4.0 is the most recently appeared term. More investigation is
needed to understand if it affirms a new technological and paradigm shift or it is just a marketing buzzword that reflects
a new fashion.
3 Materials and Methods
Despite naming conventions, it is undoubted that digital technologies are revolutionizing traditional agricultural prac-
tices in a process that we called Digital Agricultural Revolution. Researchers and companies are putting effort into
advancing the field. The number of contributions is fastly increasing over the years. In 2019, studies using the term
Precision Agriculture reached an impressive number of 784 publications. At such a publication pace, it is difficult
to keep track of the main advances in the field. Systematic literature reviews are limited by the human capability of
reading and analyzing studies.
In this framework, bibliometric analysis tools can help reconstruct the ”big picture” and highlight relevant publications.
Bibliometrics is the application of quantitive analysis and statistics to publications data. Bibliometrics help scientists
not to miss research streams that are outside their actual knowledge. Moreover, bibliometric reviews are not subject to
researchers’ biases since they are objective and reproducible. Other researchers can collect the same data to perform
a similar analysis. In the DAR research field, authors use many different terms to refer to the same concepts. The
bibliometric analysis becomes particularly useful in such a fragmented field.
Because of their objectivity, we adopted bibliometric tools for analyzing the DAR research field. We aimed to discover
the key articles, the most influential authors, sources (such as journals), institutions, and countries. We also aimed at
highlighting the main research streams and presenting the main achievements and on-going challenges. Finally, we
underscored the trending and emerging topics.
3.1 Materials
To perform the bibliometric analysis, we exploited the open-source bibliometrix R package (version 3.0.4) [15]. The
bibliometrix package allows researchers to import a publications dataset and convert it into R format. The package
contains algorithms for analyzing publications datasets with bibliometrics techniques. bibliometrix allows performing
co-citation, coupling, collaboration, co-word, and network analysis. The unit element of the dataset is a publication.
Each publication has associated a number of variables: authors, document title, document type, authors’ keywords,
source (publisher name), cited references, year, times cited, author address, and others.
6A PREPRINT - M ARCH 24, 2021
Figure 2: Selection policy intensity of the most common publications databases plotted on a line. The number of
publications of each database is used as a proxy for the intensity. CTWS Web of Science is a subset of all the citation
indices (SCIE, SSCI, AHCI, CPCI) to which CTWS research center had access (the plot has been adapted from [52]).
3.2 Methods
A typical bibliometric analysis workflow is composed of several steps [14]:
• Study design: research questions are settled down, and the proper time span is selected
• Data collection: the publications database is chosen, and a proper search query is formulated
• Data preparation: the dataset is cleaned and pre-processed for being analyzed
• Data analysis: the data selected are analyzed with bibliometric tools
• Data visualization: the proper visualization method is chosen
• Interpretation: the visualized results are interpreted
In the following, we enter in more detail about each of the steps to better understand the choices we have made in our
bibliometrics analysis.
3.2.1 Study design
We reported the research questions of this works in Section 1. The time span chosen is 2012-2019. We chose as the
beginning of the time span the year 2012 because we noted a clear rising of DAR related terms since 2012 (Figure 1).
These terms are Climate-Smart Agriculture, Smart Agriculture, and Smart Farming. In Figure 1 it is also possible to
recognize a faster-rising trend of the terms Precision Agriculture and Precision Farming around the year 2012. We
provide other reasons for the year 2012 as the beginning of the DAR in Section 4. The year 2019 was the last ended
year at the time of this work.
3.2.2 Data collection
There exist many sources of publication data: Web of Science (WoS), Scopus, Dimensions, Crossref, Microsoft Aca-
demic, and Google Scholar are the most common. Publications databases can be classified along a one-dimensional
line that indicates the intensity of selection policy applied by the database’s Content Selection Board. In one direction,
they lie databases more focused on selectivity, while in the opposite direction, they lie databases that are more focused
on comprehensiveness.
The authors of [52] made a large-scale comparison of the five most common publications databases, namely, Scopus,
Web of Science, Dimensions, Crossref, and Microsoft Academic. They did not include Google Scholar for difficulties
in retrieving large-scale data. Using the results reported in [52], we plotted the publications databases on a one-
dimensional line in Figure 2. We took a database’s total number of documents as a proxy of its selection policies’
intensity. Web Of Science showed to be the most selective while Microsoft Academic being the more comprehensive.
Scopus showed to be still focused on selectivity but with broader coverage than Web of Science.
7A PREPRINT - M ARCH 24, 2021
Web of Science and Scopus are the two most used publication databases. Indeed, in the past, there were no other
alternatives [53]. However, still today, they retain the best quality and completeness of the data along different dimen-
sions [52], and for this reason, they are the most used for bibliometric analysis. The choice between the two is not
neutral, and it conditions the final results [15]; differences between these databases are still not completely clear, and
they are contested [54].
Some authors showed that Scopus has a general broader coverage than WoS [52, 55]. In particular, Scopus showed
more extensive coverage in computer sciences and engineering [56, 57]. However, these latter studies had the limi-
tation of evaluating the bibliographic databases’ coverage by comparing them with national publications repositories.
Indeed, national repositories are of small dimensions and could lead to biased results if used to estimate international
bibliographic databases’ coverage. Scopus also showed broader coverage for conference proceedings representing a
consistent portion of the computer science literature [52, 57, 58]. Nevertheless, the author of [54] discussed some
difficulties of including conference proceedings publications in citation analysis.
Despite the broader coverage of Scopus, it presents some issues. Firstly, Scopus does not provide pre-processed
standardized reference lists as WoS does. Indeed, Scopus returns the complete references as written on the documents.
It is a significant problem since the same reference is usually written in different ways in different documents. Thus,
to use them for bibliographic analysis, they need a complex and error-prone matching procedure. Moreover, Scopus’s
higher coverage (relative to WoS) consists of low citation impact and more nationally oriented journals or conferences,
leading to an over-representation of geographically-specific or less-influential literature [54].
For the aforementioned reasons, we collected the data for this work on the Web of Science database with the following
query:
• Topic: ((precision OR smart OR digital OR intelligent) NEAR/1 (agriculture OR farming)) OR “agriculture
4.0”
• Timespan: 1985-2019
• (Refined by) Languages: English
• Indexes: SCI-EXPANDED, SSCI, A&HCI, CPCI-S, CPCI-SSH, BKCI-S, BKCI-SSH, ESCI, CCR-
EXPANDED, IC
In this way, we retrieved 7257 documents on the 15th of December 2020.
The first part of the query contains terms related to the digitalization process in agriculture. These terms are connected
with the NEAR/n operator to the second part of the query. Indeed, connecting them by the AND operator would have
resulted in several unrelated studies. Indeed, the AND operator allows terms to appear anywhere in the document, not
necessarily one after the other. Instead, the NEAR/n operator searches for terms that are separated by at most n words.
For example, with the operator NEAR/1, we retrieved results like “Precision Livestock Farming”. “Precision” must
be separated by “Farming” by no more than one word. The higher n is, the more unrelated studies are retrieved. After
few tests, we found that n=1 was a good compromise between the total number of studies retrieved and the number of
unrelated studies.
3.2.3 Data preparation
In general, it is not possible to directly use the data collected from the publications databases as they are. Most of the
time, raw data need a pre-processing phase before being ready for the analysis. Using data without any cleaning or
pre-processing phase could lead to worthless results. Indeed, the quality of the results depends on the quality of the
data [15].
The first operation we did was to remove rows containing a missing value in the variable “Publication Year”. The
publication year is crucial for many bibliometrics algorithms that analyze year-wise distributions. Only 2 elements
had a missing value in the “Publication Year” variable. Thus, we removed those 2 rows from the original 7257 rows,
ending up with 7255 elements.
Web of Science data is already pre-processed and standardized in many fields. However, the authors’ keywords needed
further processing before use. Authors’ keywords are useful information to understand which are the main research
streams and trending topics. However, different authors use different keywords to express the same concept. To solve
this problem, we performed first lemmatization; secondly, we matched the acronyms with their full forms; and lastly,
we matched the synonyms. Lemmatization is the process of reducing a word to its lemma, that is, its base form. For
example, plural forms are transformed into a singular, and verb tenses are transformed into their respective infinite
form. After lemmatization, we solved the acronyms problem. For example, the acronym NDVI has been substituted
by its extended form “Normalized Difference Vegetation Index” so to merge them together. Finally, we matched the
8A PREPRINT - M ARCH 24, 2021
terms that were synonyms. An example is that of the terms “Multispectral Imagery” and “Multispectral Imaging”. We
merged these two terms into a single one because they refer to the same concept.
Finally, we removed the terms used in the query such as “Precision Agriculture”, “Smart agriculture”, “Agriculture
4.0”, and all the others, since we wanted to map topics regardless of what terms the authors use to refer to the DAR.
3.2.4 Data analysis
Bibliometrics is an ensemble of many different methods: citation analysis, co-citation analysis, bibliographic coupling,
co-author analysis, co-word analysis. Each method has its pros and cons, the proper unit of analysis, and specific
objectives [14]. In this work, only some of the bibliometrics methods were exploited and they are briefly explained in
this section.
Some of the analyses are based on citation counts. Citations are a measure of a publication’s influence. This influence
can then be associated with the publication elements such as authors, source, authors’ institutions, authors’ countries.
In this way, it is possible to find the key articles and the most influential authors, sources, institutions, and coun-
tries. However, newer publications have less time to be cited. Therefore, citation counts are biased toward the older
publications.
When considering a subset of an entire publication database, citations can be calculated locally or globally. Local
Citations (LC) are computed by only considering citing articles of the local subset. Global Citations (GC) are computed
by considering the citing articles of the entire publications database (in our case, WoS). In bibliometric studies, LC
are usually preferred since they come from articles of the same research field. Thus, they are considered more relevant
than GC.
Other impact indicators are based on the number of publications. It is then possible to build rankings of the most
productive authors, sources, institutions, and countries. However, a higher number of publications does not necessarily
imply a higher contribution to the research field’s advancement. Thus, a commonly used citation impact indicator is
the average number of citations per publication of a research unit. If the research unit is a journal, the indicator is
called Impact Factor (IF).
In this study, we reported the Journal Citation Reports (JCR) IF computed by Clarivate Analytics. The JCR IF is a
ratio between citations and recent citable items published. Thus, it is calculated by dividing the number of current
year citations to the source items published in a journal during the previous two year by the number of publications
in those two years. For example, the 2019 JCR IF of journal X is calculated by dividing the total number of citations
from 2019 articles to 2017-2018 articles of journal X by the total number of publications in 2017-2018 of journal X.
Another standard citation impact indicator is the h-index. As for the average number of citations, the h-index can be
calculated for different research units. In this study, we computed the h-index for authors. The h-index attempts to
measure both the productivity and the citation impact of an author’s publications. A research unit has an h-index of h
if h of its publications each have at least h citations and the other publications each have no more than h citations [54].
In this study, we computed the h-index using the local citations (local h-index).
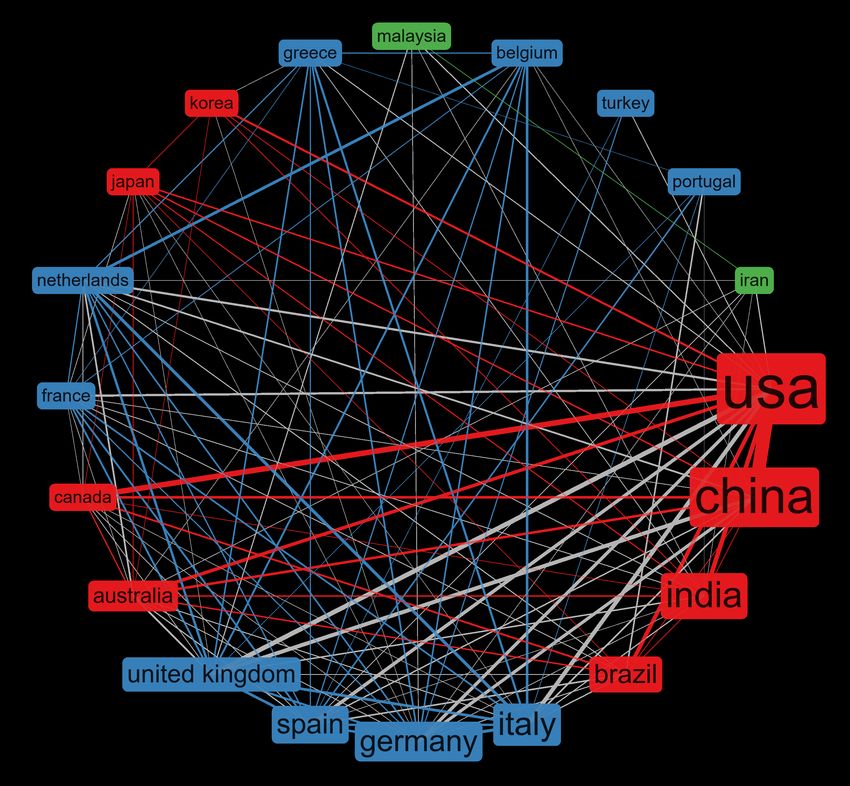
Beyond the basic impact indicator, we also performed a collaboration and co-word analysis. Collaboration analysis is
based on publications co-authorships. In our case, we aimed at mapping collaborations between countries. Thus, if a
couple of a publication’s authors belong to institutions in different countries, this is considered a collaboration between
those two countries. Co-word analysis, instead, is based on the co-occurrence of terms in the same publication.
Both collaboration and co-word analyses are based on co-occurrence network analysis. A co-occurrence network is
represented by a matrix:
B = AT A,
where B is the co-occurrence network matrix, and A is a matrix representing a bipartite network Documents x
Attribute. Attribute is equal to Author for a collaboration network and to Keyword for a co-word network.
In a collaboration network matrix, the element bij indicates the number of collaborations between author i and author
j. The diagonal element bii indicates the number of documents authored or co-authored by researcher i. In a co-word
network matrix, the element bij indicates the number of co-occurrences of keyword i and keyword j. The diagonal
element bii is the number of documents in which the keyword i appeared.
Once the network is built, it is clustered by Louvain algorithm [59]. Louvain clustering is a simple method to extract the
community structure of large networks. It consists of a greedy optimization of a value called modularity. Modularity
measures the density of links inside communities compared to links between communities.
Once we have clustered the collaboration network, we can plot it. For co-word analysis, we plotted the network
clusters on a thematic diagram [60]. Clusters are positioned on the diagram based on Callon’s centrality and density
9A PREPRINT - M ARCH 24, 2021
measures [61]. Callon’s centrality reads as the relative importance of a topic compared to the others. Callon’s density
reads as the development, in terms of numerousness of publications, of a topic. Each of the topics (or themes) is then
classified based on its positioning in one of the four quadrants composing the thematic diagram:
• Upper-right quadrant - Motor themes: themes that are well developed and important for structuring a research
field. They have a high density and centrality.
• Upper-left quadrant - Niche themes: themes that are well developed but are on the research field’s borders.
They present a high density but low centrality.
• Lower-left quadrant - Emerging or declining themes: themes that are characterized by low density and cen-
trality.
• Lower-right quadrant - Basic themes: transversal themes in the research field but less developed relative to
the others. Basic themes are characterized by low density but high centrality.
3.2.5 Data visualization and interpretation
Data visualization consists of graphically showing the results of the bibliometric analysis. Many kinds of visualization
can be used depending on the data: bar plots, line plots, networks, diagrams, and others. Once a proper visualization
format is chosen, the results are interpreted by the researchers.
Prior knowledge of the research field is necessary for interpreting the findings. Researchers with in-depth knowledge
have a clear advantage. However, they must not fit their preconceptions to the bibliometric analysis results, but the
opposite. They should use their prior knowledge to enhance the findings [14].
4 Data Analysis and Interpretation
In this section, we show the results of the bibliometric analysis. We made a preliminary analysis of the entire dataset
with the publications in the time span 1985-2019. Since we identified that DAR related studies began their diffusion in
2012, we then restricted the analysis to the time span 2012-2019. We first provide some general information about the
data. Afterward, we list the most influential sources, authors, and organizations according to citation impact indicators.
We also list the most cited articles and the most influential countries in terms of contributions and citation impact. To
further understand the geographical dynamics, we analyzed the countries collaboration network. Finally, we identified
five main research streams, and we give a broad overview of them by analyzing the key articles for each. We conclude
by presenting the trending topics of the last three years (2017, 2018, and 2019).
4.1 Preliminary analysis
Figure 3 shows the year-wise distribution of the number of publications in the period 1993-2019 (1993 is the year of
the first publication in the dataset). The annual growth rate was on average 30.5%. We can spot a turning point in
2014 when scientific production started to increase faster. It is likely that the application of digital technologies in
agriculture opened new research possibilities. In 2019, the DAR annual scientific production reached the number of
1324 documents. Such a large amount of studies requires the use of algorithmic bibliometric tools to be analyzed.
In Section 2 we stated that the DAR has its roots in the formalization of the CSA concept in 2010. However, it took
two years to see the first appearance of DAR related terms in the literature. It is only from 2012 that terms like
Climate-Smart Agriculture, Smart Agriculture, and Smart Farming began their diffusion in the scientific literature. To
restrict the analysis to a proper time span, we made a plot of the year-wise frequency of the ten most frequent authors’
keywords in Figure 4.
In the figure, it is possible to recognize three groups of terms. A group of terms began their diffusion in the ’90s;
it then reached a plateau, if not a decline: Spatial Variability, Geostatistic, Site-Specific Management, Variable Rate
Application, Global Positioning System, and Geographic Information System. These terms are related to the Precision
Agriculture concept.
Another group of terms began their diffusion around 2012: Internet of Things, Climate-Smart Agriculture, Machine
Learning, and Unmanned Aerial System (that began its diffusion in 2010). Since these terms are pillars of the DAR,
we decided to take the year 2012 as the beginning of our time span (2012-2019). Finally, a third group of terms began
its diffusion before 2010 and saw new popularity since 2012: Remote Sensing, Hyperspectral Imaging, Vegetation
Index, and Sensor. The renewed diffusion of these terms is likely due to the introduction of UAS in agriculture and
on-the-go proximal sensing systems.
10A PREPRINT - M ARCH 24, 2021
Figure 3: Digital Agricultural Revolution annual scientific production in the period 1993-2019.
Figure 4: Top ten authors’ keywords growth. The graph shows the smoothed annual occurrences of the ten most
frequent authors’ keywords used in the Digital Agricultural Revolution publications.
4.2 General information
In Table 1 we give some general information about the the data. The subset 2012-2019 contains 4995 documents from
2152 sources. The publications derive from 15139 authors, and the average number of authors per document is 3.03.
The average citations per document are 10.03, and the total number of unique authors’ keywords is 10333.
The percentage composition by document types is illustrated in Figure 5. The documents are for the most articles
(53.59%). It has to be noted the high percentage (36.38%) of proceedings papers that are characteristic of some
research area such as computer science. Reviews count for a 5.16% and book chapters for a 2.83%.
Figure 6 shows the percentage composition by research area. Of course, the principal research area is agriculture, with
a 27.7% on the total number of documents. The other main research areas are computer science (21.6%), engineering
11A PREPRINT - M ARCH 24, 2021
General information about the data
Timespan 2012:2019
Sources (Journals, Books, etc.) 2152
Documents 4995
Authors 15139
Authors per Document 3.03
Average citations per document 10.03
Average citations per year per doc 1.809
References 124277
Authors’ Keywords 10333
Table 1: General information about the dataset we used in our analysis.
Figure 5: Percentage composition by document types of Digital Agricultural Revolution related publications.
(19.4%), remote sensing (9.2%), and telecommunications (6.1%). It is possible to note a clear prevalence of research
areas related to digital technologies.
4.3 Most influential sources, authors, institutions, articles and countries
Table 2 shows the most influential sources (journals, conferences, books, etc.). We reported the most relevant sources
by the number of documents ranked according to the Standard Competition Ranking (SCR). In SCR, items that com-
pare equal receive the same ranking number, and then a gap is left in the ranking numbers. The first item that does not
compare equal to a sequence of two or more equally ranked items receives a rank equal to its ordinal position. We also
reported the 2019 Journal Citation Reports Impact Factor for journals listed in the same table.
The top three relevant sources by number of documents are “Computers and Electronics in Agriculture” (259 docu-
ments - 5.11%), “Precision Agriculture” (143 documents - 2.82%), and “Sensors” (132 documents - 2.61%). Among
the top twenty relevant sources, the top three 2019 JCR IF sources are “Geoderma” (4.848), “Remote Sensing” (4.509),
12A PREPRINT - M ARCH 24, 2021
Figure 6: Percentage composition by research area of Digital Agricultural Revolution related publications.
and “Precision Agriculture” (4.454). In Table 2 we also made a SCR of the most local cited journals. The top three
ranked journals are “Computers and Electronics in Agriculture” (6290), “Remote Sensing of Environment” (4318),
and “Precision Agriculture” (3739).
Table 3 shows the most influential authors. Authors have been ranked through the SCR according to their local h-
index. We also reported the Total Citations (TC), the Local Citations (LC), and the number of documents. The top
three authors by h-index are “Lopez-Granados Francisca” (16), “Torres-Sanchez Jorge” (15), and “Pena Jose M.”
(15). Among the 20 top h-index authors, the most productive author was “Berckmans Daniel” with 26 publications,
followed by “Lopez-Granados Francisca” and “Bareth Georg” with 23 publications each. In Table 3 we also made
a SCR by Dominance Factor (DF). DF is calculated as the ratio of first-authored publications relative to the total of
multi-authored publications. The DF assumes that a publication’s first author gave the largest practical or intellectual
contribution. The total number of an author’s publications is the sum of multi-authored and single-authored publica-
tions. “Huang Yanbo” ranked first with a DF of 0.583, followed by “Harun Ahmad Nizar” with a DF of 0.333, and
“Castrignano Annamaria” with a DF of 0.313. High DF authors are so because they “dominate” their research team in
terms of the number of first-authored publications.
Table 4 shows the most productive institutions. We made a SCR by ordering institutions according to the number of
published documents. The number of published documents per institution has been computed with the Organizations-
Enhanced WoS field. Indeed, institutions usually have many name variants. If these variations are not taken into
account, the total counts do not reflect an institution’s real productivity. The Organizations-Enhanced WoS data are
computed by merging the different variations of an institution’s name. The top five productive institutions are the
“United States Department of Agriculture USDA” (133 documents), the “CGIAR” (120 documents), the “Chinese
Academy of Sciences” (103 documents), the “Wageningen University Research” (93 documents), and the “Consejo
Superior de Investigaciones Cientificas CSIC” (88 documents). CGIAR is a global partnership of many international
organizations, like the FAO and the World Bank, engaged in food security research.
Table 5 shows the ten most local cited articles. The first ranked article is “David J. Mulla, 2013” [6] with 180 local
citations, followed by “Wolfert et al., 2017” [9] with 93 local citations and “Bendig et al., 2014” [62] with 58 local
citations. These three articles are also the most globally cited. We discuss in detail some of the articles listed in Table 5
in the remainder of this section.
The twenty most productive countries are shown in Figure 7. The country associated with each publication is the
institution’s country of the corresponding author. A country’s total number of publications is divided into Single
Country Publications (SCP) and Multiple Country Publications (MCP). Thus, if a publication’s authors are all of the
same nationality as the corresponding author, this publication shows as an SCP for that nation; viceversa, it shows
13SCR by 2019 SCR by
Relevant Sources N. of documents % Most Cited LC
N. of documents JCR IF LC
1 COMPUTERS AND ELECTRONICS IN AGRICULTURE 259 5.11% 3.858 1 COMPUTERS AND ELECTRONICS IN AGRICULTURE 6290
2 PRECISION AGRICULTURE 143 2.82% 4.454 2 REMOTE SENSING OF ENVIRONMENT 4318
3 SENSORS 132 2.61% 3.275 3 PRECISION AGRICULTURE 3739
4 REMOTE SENSING 122 2.41% 4.509 4 AGRONOMY JOURNAL 2339
5 PROCEEDINGS OF SPIE 113 2.23% NA 5 REMOTE SENSING 2119
6 BIOSYSTEMS ENGINEERING 60 1.18% 3.215 6 BIOSYSTEM ENGINEERING 1950
IEEE INTERNATIONAL SYMPOSIUM ON GEOSCIENCE AND
7 55 1.09% NA 7 SENSORS 1802
REMOTE SENSING IGARSS
8 INTERNATIONAL CONFERENCE ON AGRO GEOINFORMATICS 51 1.01% NA 8 GEODERMA 1664
9 GEODERMA 41 0.81% 4.848 9 TRANSACTIONS OF THE ASABE 1514
10 SUSTAINABILITY 40 0.79% 2.576 10 INTERNATIONAL JOURNAL OF REMOTE SENSING 1500
11 TRANSACTIONS OF THE ASABE 38 0.75% 1.156 11 SOIL SCIENCE SOCIETY OF AMERICA JOURNAL 1475
INTERNATIONAL ARCHIVES OF THE PHOTOGRAMMETRY
12 37 0.73% NA 12 FIELD CROPS RESEARCH 1377
14
REMOTE SENSING AND SPATIAL INFORMATION SCIENCES
13 ENGENHARIA AGRICOLA 36 0.71% 0.603 13 JOURNAL OF DAIRY SCIENCE 1164
14 APPLIED ENGINEERING IN AGRICULTURE 34 0.67% 0.973 14 AGRICULTURAL SYSTEMS 1121
14 IFAC PAPERSONLINE 34 0.67% NA 15 SOIL & TILLAGE RESEARCH 1052
INTERNATIONAL JOURNAL OF AGRICULTURAL AND
14 34 0.67% 1.731 16 AGRICULTURAL WATER MANAGEMENT 989
BIOLOGICAL ENGINEERING
IEEE TRANSACTIONS ON GEOSCIENCE AND
17 AGRICULTURAL SYSTEMS 33 0.65% 4.212 17 968
REMOTE SENSING
17 IEEE ACCESS 33 0.65% 3.745 18 AGRICULTURE, ECOSYSTEMS & ENVIRONMENT 888
19 AGRONOMY BASEL 31 0.61% 2.603 19 SCIENCE 877
19 LECTURE NOTES IN COMPUTER SCIENCE 31 0.61% NA 20 PLOS ONE 846
Table 2: Most relevant sources ordered according to the Standard Competition Ranking. Each relevant source has associated its 2019 Journal Citation Reports
(JCR) Impact Factor (IF). Sources for which a JCR IF was not available has been given the “NA” value. The most cited sources has been ordered by Local Citations
(LC).
A PREPRINT - M ARCH 24, 2021SCR by Local SCR by
Author TC LC N. of documents Author DF First-authored Multi-authored
local h-index h-index DF
1 Lopez-Granados, Francisca 16 1294 289 23 1 Huang, Yanbo 0.583 7 12
2 Torres-Sanchez, Jorge 15 1168 282 20 2 Harun, Ahmad Nizar 0.333 5 15
2 Pena, Jose M. 15 1040 240 19 3 Castrignano, Annamaria 0.313 5 16
4 Bareth, Georg 13 1069 229 23 4 Fountas, Spyros 0.308 4 13
5 Berckmans, Daniel 11 449 112 26 5 Torres-Sanchez, Jorge 0.300 6 20
5 De Castro, Ana, I 11 846 184 15 6 De Castro, Ana, I 0.200 3 15
7 Huang, Wenjiang 10 221 14 18 7 Norton, Tomas 0.188 3 16
7 Guarino, Marcella 10 310 74 17 8 Bazzi, Claudio Leones 0.167 3 18
7 Vranken, Erik 10 238 51 17 8 Huang, Wenjiang 0.167 3 18
7 Miao, Yuxin 10 483 103 16 10 Yang, Guijun 0.118 2 17
11 Yang, Guijun 8 315 35 17 11 Bareth, Georg 0.087 2 23
15
11 Castrignano, Annamaria 8 220 57 16 11 Lopez-Granados, Francisca 0.087 2 23
11 Norton, Tomas 8 156 37 16 13 He, Yang 0.067 1 15
14 He, Yang 7 188 22 15 13 Lee, Won Suk 0.067 1 15
14 Lee, Won Suk 7 201 21 15 15 Miao, Yuxin 0.063 1 16
16 Li, Minzan 6 88 12 21 16 Guarino, Marcella 0.059 1 17
16 Bazzi, Claudio Leones 6 116 47 18 16 Vranken, Erik 0.059 1 17
16 Graziano Magalhaes, Paulo S. 6 114 28 15 18 Pena, Jose M. 0.053 1 19
19 Harun, Ahmad Nizar 5 89 4 15 19 Li, Minzan 0.048 1 21
20 De Souza, Eduardo G. 4 52 13 15 20 Berckmans, Daniel 0.042 1 24
Table 3: Most influential authors by local h-index and Dominance Factor (DF). The local h-index is computed with citations received from articles in our dataset
(Local Citations (LC)). GC are those received from articled in the entire WoS database. The DF is the ratio of first-authored publications relative to the total of
multi-authored publications.
A PREPRINT - M ARCH 24, 2021SCR by SCR by
Organization N. of documents Organization N. of documents
N. documents N. of documents
1 UNITED STATES DEPARTMENT OF AGRICULTURE USDA 133 11 UNIVERSIDADE DE SAO PAULO 57
2 CGIAR 120 12 ALLIANCE 51
3 CHINESE ACADEMY OF SCIENCES 103 13 BEIJING ACADEMY OF AGRICULTURE FORESTRY 50
4 WAGENINGEN UNIVERSITY RESEARCH 93 14 UNIVERSITY OF BONN 49
CONSEJO SUPERIOR DE
5 88 15 INDIAN COUNCIL OF AGRICULTURAL RESEARCH ICAR 48
INVESTIGACIONES CIENTIFICAS CSIC
COMMONWEALTH SCIENTIFIC INDUSTRIAL
6 CHINA AGRICULTURAL UNIVERSITY 86 16 47
16
RESEARCH ORGANISATION CSIRO
7 STATE UNIVERSITY SYSTEM OF FLORIDA 73 16 INRAE 47
INTERNATIONAL CENTER FOR
8 CONSIGLIO NAZIONALE DELLE RICERCHE CNR 65 18 44
TROPICAL AGRICULTURE CIAT
EMPRESA BRASILEIRA DE PESQUISA
9 UNIVERSITY OF FLORIDA 60 19 43
AGROPECUARIA EMBRAPA
10 UNIVERSITY OF CALIFORNIA SYSTEM 58 19 UNIVERSITY OF NEBRASKA LINCOLN 43
Table 4: Most productive institutions in terms of number of publications.
A PREPRINT - M ARCH 24, 2021SCR by
Authors(s) Year Title LC GC
LC
Twenty five years of remote sensing in precision agriculture:
1 David J. Mulla 2013 180 553
Key advances and remaining knowledge gaps
2 Sjaak Wolfert, Lan Ge, Cor Verdouw, Marc-Jeroen Bogaardt 2017 Big Data in Smart Farming – A review 93 350
Estimating Biomass of Barley Using Crop Surface Models (CSMs)
3 Juliane Bendig, Andreas Bolten, Simon Bennertz, Janis Broscheit, Silas Eichfuss, Georg Bareth 2014 58 239
Derived from UAV-Based RGB Imaging
Eija Honkavaara, Heikki Saari, Jere Kaivosoja, Ilkka Pölönen, Processing and Assessment of Spectrometric, Stereoscopic
4 2013 55 224
Teemu Hakala, Paula Litkey, Jussi Mäkynen, Liisa Pesonen Imagery Collected Using a Lightweight UAV Spectral Camera for Precision Agriculture
José Manuel Peña, Jorge Torres-Sánchez, Ana Isabel de Castro, Weed Mapping in Early-Season Maize Fields Using
5 2013 52 163
Maggi Kelly, Francisca López-Granados Object-Based Analysis of Unmanned Aerial Vehicle (UAV) Images
Multi-temporal mapping of the vegetation fraction
17
6 Jorge Torres-Sánchez, José Manuel Peña, Ana Isabel de Castro, Francisca López-Granados 2014 50 173
in early-season wheat fields using images from UAV
Evaluating Multispectral Images and Vegetation Indices for
7 Sebastian Candiago, Fabio Remondino, Michaela De Giglio, Marco Dubbini, Mario Gattelli 2015 49 202
Precision Farming Applications from UAV Images
8 Mare Srbinovska, Cvetan Gavrovski, Vladimir Dimcev, Aleksandra Krkoleva, Vesna Borozan 2015 Environmental parameters monitoring in precision agriculture using wireless sensor networks 48 179
Plant Disease Detection by Imaging Sensors - Parallels and Specific Demands for
9 Anne-Katrin Mahlein 2016 47 238
Precision Agriculture and Plant Phenotyping
Combined Spectral and Spatial Modeling of Corn Yield Based on Aerial Images
10 Jakob Geipel, Johanna Link, Wilhelm Claupein 2014 43 119
and Crop Surface Models Acquired with an Unmanned Aircraft System
Table 5: Most cited articles according to Local Citations (LC) counts. Local Citations are those received from articles in our dataset. Global Citations (GC) are
those received from articles in the entire WoS database.
A PREPRINT - M ARCH 24, 2021You can also read