Potential and utilization of manure to generate biogas in seven countries - IEA Bioenergy: Task 37 June 2021
←
→
Page content transcription
If your browser does not render page correctly, please read the page content below
Potential and utilization of manure
to generate biogas in seven countries

                IEA Bioenergy: Task 37

                             June 2021

        Cattle Slurry Methane Resource (MWh)
              0.00 – 0.00
              500 – 1000
             1000 – 2000
             2000 – 3000
             3000 – 4000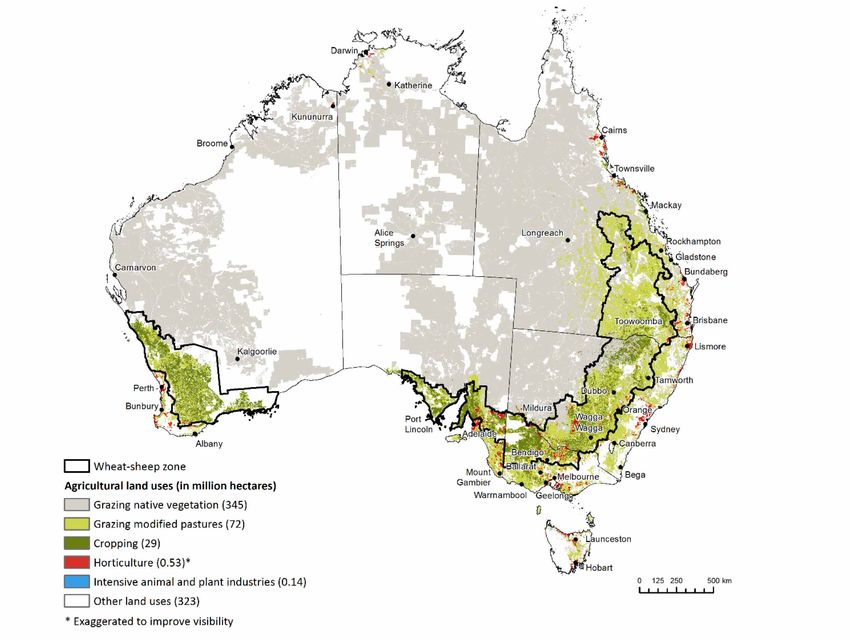
Potential and utilization of manure to generate biogas in
seven countries

Authors:
  Jan Liebetrau, Richard O’Shea, Maria Wellisch, Kari-Anne Lyng, Günther Bochmann, Bernadette K. McCabe,
  Peter W. Harris, Clare Lukehurst, Peter Kornatz, Jerry D. Murphy

Edited by
  Jerry D. Murphy

Citation
  Liebetrau, J., O’Shea, R., Wellisch, M., Lyng, K.A., Bochmann, G., McCabe, B.K., Harris, P.W., Lukehurst, C.,
  Kornatz, P., Murphy, J.D. (2021) Potential and utilization of manure to generate biogas in seven countries,
  Murphy, J.D. (Ed.) IEA Bioenergy Task 37, 2021:6.

  Copyright © 2021 IEA Bioenergy. All rights Reserved
  ISBN: 978-1-910154-88-5 (eBook electronic edition)

  Cover graphic: cattle slurry methane resource in the 3440 electoral divisions of Ireland;
  Richard O’ Shea, MaREI, Ireland

  Published by IEA Bioenergy
  The IEA Bioenergy Technology Collaboration Programme (IEA Bioenergy TCP) is organised under the auspices of
  the International Energy Agency (IEA) but is functionally and legally autonomous. Views, findings and publica-
  tions of the IEA Bioenergy TCP do not necessarily represent the views or policies of the IEA Secretariat or of its
  individual Member countries.

                                                     Potential and utilization of manure to generate biogas in seven countries   2
Executive Summary
     Production of biogas from manure at a farm level is the very epitome of a sustainable bioenergy system.
The system incorporates a circular economy decentralised production of organic biofertilizer and biogas for
use in heat, power or transport fuel, whilst simultaneously reducing fugitive methane emissions from open
slurry holding tanks, reducing smells and minimising pollution effects on rivers and wells. Why therefore is
the practice of producing biogas from manure not more widespread?
     The characteristics of manure depend on farm animal source and the method of husbandry, which in
turn leads to a wide range of levels of technically available manure resource and costs of biogas produced
from manure. To exemplify this, IEA Bioenergy published this report which examines the potential of ma-
nure for utilization in biogas facilities across seven countries: Germany; Australia; Austria; Norway; Canada,
Ireland and the UK. These countries have differing levels of biogas industry, very different farming practices
and a range of climates. It is hoped that the country selection should allow the lessons learned from these
seven countries to be applied to many countries across the planet.
     The major factors which define the suitability of manure for an economic anaerobic digestion process
include: the biogas potential of the manure; the water content of the manure; unwanted and inhibitory
materials in manure; the herd size where the manure is processed; and the resulting amount of manure
available to the biogas facility. These variables are interdependent as exemplified here. If the manure has a
very high-water content (such as from pigs) this impacts greatly on the heat demand for processing and cost
sustainability if transportation is necessary. Chicken manure on the other hand has a high solids content and
is already transported in Europe for disposal over large distances. Both pig and poultry tend to be associated
with more intensive farming, but the manures produced are not as amenable to digestion as cattle manure;
chicken manure is nitrogenous and requires innovation in biological digestion or co-digestion with other
substrates. Pig manure is dilute, with a low specific methane yield and as such is not ideal for long distance
transport or mono-digestion.
     Cattle manure is very amenable to digestion, with potentially the lowest cost of abatement; open stor-
age of cattle slurry leads to significant levels of fugitive methane emission, which can be abated by biogas
facilities. However, a very significant barrier to collection of cattle manure is an animal husbandry system
whereby cattle are pasture grazed for the majority of the year (as is the case for Ireland). This form of hus-
bandry may generate collectable manure only in the winter months when cattle are housed which leads to
complexity in a biogas system that includes for cattle manure. This would necessitate a centralised anaerobic
digestion model whereby cattle manure is a winter feedstock, and the model depends on other feedstocks
for the majority of the year.
     Viability of manure-based biogas facilities depend on economies of scale. A herd of 50 dairy cows (close
to average in many countries) housed in barns does not produce enough manure for an economic biogas
operation. Current trends in agriculture see pressure on small family farms, which is leading to an ongoing
consolidation resulting in a smaller number of larger farms. While this may not promote a vibrant rural soci-
ety, it does increase the potential for an anaerobic digestion industry based on manure. The seven countries
described in this report each have specific regions, where the farming of specific animals is concentrated and
the potential for a viable biogas industry is high.
     Manure might require co-substrates for a successful biological digestion process. Energy rich co-sub-
strates can also improve profitability. Waste materials (such as from food) are a sustainable addition but
might come with different regulations for their treatment and subsequent land application. The use of en-
ergy crops can have a negative impact in the case of regions with an already high animal density as they add
to the quantity of digestate and nutrient load requiring application to, and assimilation in, agricultural land
and as such increase the potential for eutrophication.
     Anaerobic digestion of manure requires incentives to be financially viable. Any measure or strategy for
incentivisation of manure digestion needs to consider the structures of existing farms and characteristics of
the produced manures to achieve a significant impact efficiently. Anaerobic digestion facilities using manure
as the main substrate typically have a small capacity and consequently high specific costs. Species of animals

                                                Potential and utilization of manure to generate biogas in seven countries   3
and type of husbandry have a significant impact on the costs of digestion and biogas yield. Support schemes
need to reflect these factors to be effective.
     To optimise the benefits of subsidies applied to biogas it is essential to maximise the potential impact on
emission reductions and minimise the cost of abatement. This would suggest that incentives should focus
on the manure types with high emission reduction potential and the lowest cost to treat; an example of this
is liquid cattle manure (or slurry). The biogas system should be designed to ensure the digester has sufficient
retention time to optimise the potential for collectable biogas production and minimise the biogas potential
in the digestate; the digester needs to be gastight to ensure minimisation of fugitive methane emissions
through leakage. Future support or state aid for animal husbandry should facilitate optimization and inte-
gration of anaerobic digestion into existing farming practices. The biogas facility should ensure easy collec-
tion of manure with minimal storage prior to the anaerobic digestion process to minimise fugitive emissions
and to utilise as much of the biomethane potential in renewable energy provision as possible.
     An additional aspect with increasing relevance is the role of biogas in organic farming. The increasing
share of organic farming requires increasing quantities of organic fertilizers. The potential to integrate the
biogas facility into the organic farm model to supply organic fertiliser should be reflected in future policy
and support developments. The biogas facility should be seen as an essential constituent in the circular
economy agricultural system. Its output must not be focused on energy yield alone but also, as a source
of valuable biofertilizer to be recycled back onto agricultural land which is the starting point for feed for
animals which produce the manure. Beside the provision of energy and the reduced greenhouse gas emis-
sions, AD facilities have difficult to monetarize co-benefits: reduction in eutrophication of water courses and
contamination of wells; recirculation of organic material back to agricultural land; sanitation of digestate;
substitution of fossil based mineral fertilisers; support of rural infrastructure and society.

   To synthesise, the strategies for manure utilization need to reflect:
   • Farming structure, in particular herd size and characteristics of animal husbandry to be targeted (say
       intensive dairy farms);
   • Long term perspective for animal husbandry in the region;
   • The particular target sector for biogas utilization (electricity, green gas, transport biofuel, district
       heating);
   • Cost structure for utilization of specific manure type with particular end use of biogas;
   • Potential co-substrates and the regional impact on the utilization of these co-substrates in
       AD facilities;
   • Support mechanisms which reflect long term operation of agricultural facilities which will have a
       lasting positive impact;
   • Development of animal husbandry (renovated or newly constructed dairy farms) which optimizes
       manure handling for usage in AD facilities;
   • Impact of the measures on greenhouse gas reduction.

                                                     Potential and utilization of manure to generate biogas in seven countries   4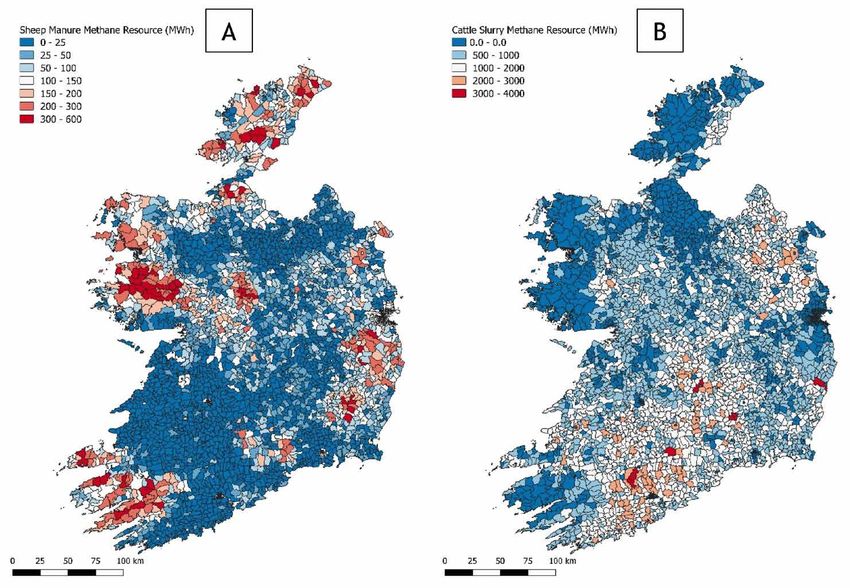
Table of Contents
1 Introduction                                                                                                      6
  1.1 MANURE BIOGAS: SUCCESSFULL APPLICATIONS OF A CIRCULAR ECONOMY SYSTEM                                          6
  1.2 METHANE POTENTIAL AND YIELD FROM MANURE TYPES                                                                 7
  1.3 REFERENCES                                                                                                    9
2 Country specific manure potential and utilization                                                                10
  2.1 GERMANY                                                                                                      10
     2.1.1   Overall potential                                                                                     10
     2.1.2   Structure of agriculture and spatial distribution of manure                                           10
     2.1.3   Spatial distribution                                                                                  11
     2.1.4   State of the art of manure utilization                                                                12
     2.1.5   Cost structure                                                                                        14
     2.1.6   Lessons learnt and perspectives of manure utilization                                                 15
     2.1.7   Conclusion                                                                                            17
     2.1.8   References Germany                                                                                    17
  2.2 AUSTRALIA                                                                                                    17
     2.2.1   Overall potential                                                                                     17
     2.2.2   Structure of agriculture and spatial distribution of manure                                           18
     2.2.3   State of the art manure utilization                                                                   19
     2.2.4   Lessons learnt and perspectives of manure utilization                                                 21
     2.2.5   References Australia                                                                                  21
  2.3 AUSTRIA                                                                                                      22
     2.3.1   Overall potential                                                                                     22
     2.3.2   Structure of agriculture and spatial distribution of manure                                           22
     2.3.3   State of the art of manure utilization                                                                24
     2.3.4   Lessons learnt and perspectives of manure utilization                                                 25
     2.3.5   References Austria                                                                                    25
  2.4 NORWAY                                                                                                       26
     2.4.1Overall potential                                                                                        26
     2.4.2 Structure of agriculture and spatial distribution of manure                                             26
     2.4.3 State of the art of manure utilization                                                                  27
     2.4.4 Lessons learnt and perspectives of manure utilization                                                   27
     2.4.5 References Norway                                                                                       28
  2.5 CANADA                                                                                                       29
     2.5.1   Overall potential                                                                                     29
     2.5.2   Structure of agriculture and spatial distribution of manure                                           32
     2.5.3   State of the art of manure utilization                                                                33
     2.5.4   Lessons learnt and perspectives of manure utilization                                                 34
     2.5.5   References Canada                                                                                     35
  2.6 IRELAND                                                                                                      35
     2.6.1   Overall Potential                                                                                     35
     2.6.2   Structure of agriculture and spatial distribution of manure                                           36
     2.6.3   State of the art of manure utilization                                                                40
     2.6.4   Lessons learnt and perspectives of manure utilization                                                 41
     2.6.5   Conclusion                                                                                            42
     2.6.6   References Ireland                                                                                    42
  2.7 UNITED KINGDOM                                                                                               43
     2.7.1 Livestock numbers in the UK                                                                             43
     2.7.2 Manure potential and utilisation.                                                                       44
           State of the art of manure utilization                                                                  46
     2.7.3 The way ahead                                                                                           48
     2.7.4 References UK                                                                                           49
3 Conclusion                                                                                                       50

                                        Potential and utilization of manure to generate biogas in seven countries    5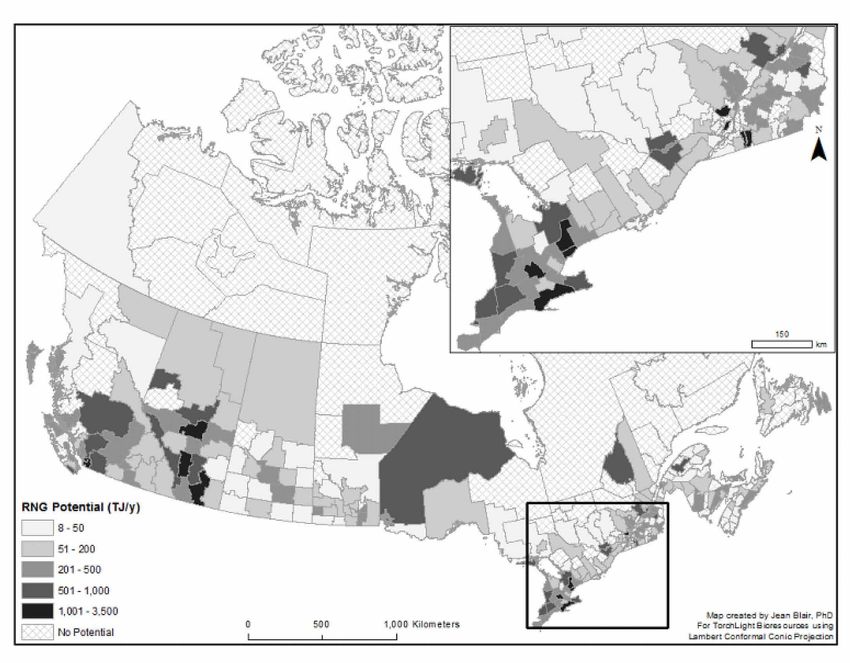
1         Introduction
1.1       MANURE BIOGAS: SUCCESSFULL APPLICATIONS OF A CIRCULAR
          ECONOMY SYSTEM
     Biogas production from manure is an exemplar of sustainable biomass and circular economy systems
(Fagerström et al., 2018). Manure management (in particular open storage) contributes significantly to
greenhouse gas emissions from agriculture, mostly in the form of methane and ammonia emissions. An-
aerobic digestion of manures and slurries reduces these emissions, while producing biogas to replace fossil
fuels as well as digestate which can be used as an organic biofertilizer to replace fossil fertilisers (Liebetrau
et al., 2017). Optimisation of the nutrient cycle and good soil health are essential for sustainable agricul-
ture (with organic fertilisers essential for organic farming); anaerobic digestion processes are ideally suited
to sustainable agriculture (McCabe et al., 2020).
     Publications on biomass available for utilization usually give overarching aggregated numbers on the
mass of biomass and energy contained in the biomass. Details on how these particulars have been calcu-
lated are many, are varied and quiet often are not given. In particular for manure, it is crucial to assess its
composition, its variability in composition over the year and its geographic specific availability, as these
factors define the technical and economical accessibility of the manure. Manure availability depends on
the structure and organisation of animal husbandry, which varies regionally. Biogas facilities also come
with specific technical characteristics and costs. For successful implementation of a manure biogas system,
it is essential to optimise the interrelationship between the manure and the biogas systems.
     This report aims to provide a short analysis of the situation in seven countries with respect to manure
availability and biogas utilization. The authors make no claim on the completeness of this analysis but
rather wish to highlight major characteristics of manure utilization and identify critical conditions which
may be barriers to an optimized manure biogas system.
     There is a long tradition of animal husbandry in most regions of the world. The amount, accessibil-
ity and characteristics of manure produced by livestock are dependent on the type of animals, method
of housing, feeding regime, purpose (whether it be for breeding or for meat/milk/egg production) and
last but not least the number of animals. The many factors affecting the manure quality differ, so manure
characteristics differ as well.
     Table 1 which is based on German data highlights the effect that the type of animal has on a potential
biogas application. Chickens are obviously housed, managed and fed in a different way than cattle and
this results in different masses, characteristics and composition of manures. The regional history and
development of animal husbandry drives regional agricultural structure. Some countries have small herd
sizes, other have large farms with thousands of livestock units. If cattle graze on pasture for the majority
of the year, then in this timeframe the manure cannot be accessed. Besides the general characteristics of
the manure, the amount of manure at a farm is also of interest. The distribution of nodes of manure pro-
duction (farms) is an essential element in deciding whether a biogas facility can be viable. Biogas facilities
benefit from economies of scale so specific costs reduce with increases in capacity of the biogas facility.
Increasing capacity of the facility benefits from concentration in manure production at individual farms or
a collection of farms that are well connected by transport infrastructure. Viability of the biogas facility also
requires a year-round supply of manure (and/or other feedstocks) and an end market for the produced
energy and the biofertilizer.
     Animal husbandry has traditionally consisting of small herds or flocks. However, with increasing de-
mand for food products from animal husbandry and lower transportation costs associated with chilled
cargo worldwide, competition is increasing and is leading to a worldwide trend towards larger and more
cost-efficient farms. The animal husbandry sector in many countries has experienced, or is experiencing,
pressure on small farmers and an associated decrease in the number of smaller herd sizes with a commen-
surate increase in the number of larger herds.
     In addition to herd size the number of animals per hectare of agricultural land can influence the
regional availability of manure. In some areas there can be multiple high-density herds which leads to
competition for land application of manure. There are areas in Europe, where manure has to be treated or

                                                      Potential and utilization of manure to generate biogas in seven countries   6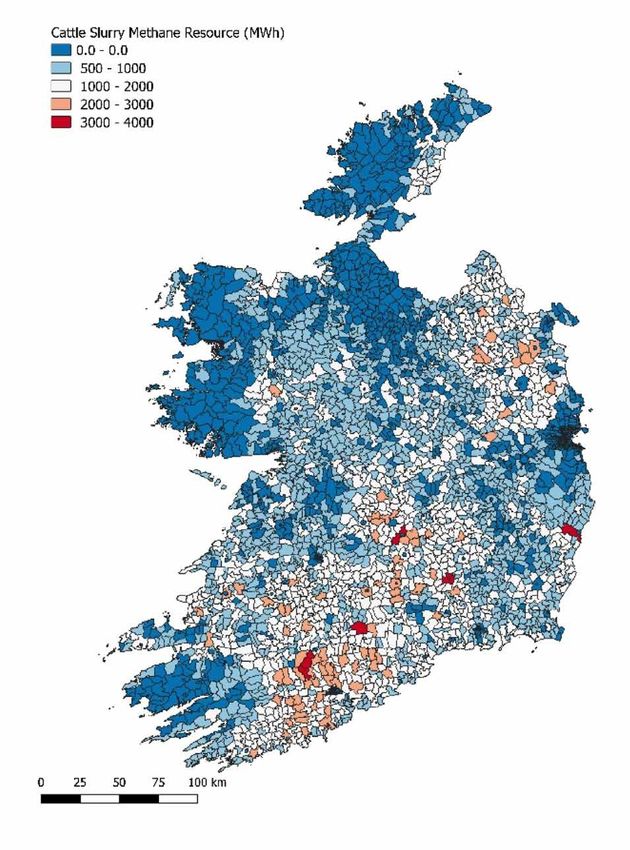
Table 1: Amount of manure per animal and relevant characteristics in a German context

                                             Total solids (TS)                           Number of animals
                     Amount of manure       and volatile solids       Biogas yield       necessary for 100
                                               (VS) content                              kWel (only manure)
                           t Fresh
                                                TS: % FM                m³*tVS-1
                        Matter (FM) *
                                                (VS: %TS)           (m3/animal*yr-1)
                         (animal*y)-1
                                                                           380
 Dairy                      17–20                 10 (75)                                         800
                                                                          (527)
 Fattening pig                                                            420
                             1.6                  7.5 (70)                                      11,000
                                                                          (35)
 Layer hens                                                                500
                            0.02                  50 (70)                                       120,000
                                                                          (3.5)

transported long distances to be applied to agricultural land. A high density of animals can be accompa-
nied by groundwater pollution, contamination of wells and eutrophication of waterways. In such regions
the fertilizing effect of the manure is problematic rather than a resource. Anaerobic digestion can help to
collect, safely store and condition manure. A nutrient management balance analysis as part of the larger
planning process for the biogas facility should include for good management practice for the biogas sys-
tem and the associated farms (times of application of digestate, matching of applications of NPK to land
capacity, cordons sanitaires, water quality management) to minimise potential for negative environmental
impact.
    The decisive question for a successful application of a biogas system is the availability of manure in
sufficient quantities to allow for profitable utilization. It may be that a single farm is large enough to pro-
vide a sufficient amount of manure, or the manure (or separated fractions of it) may need to be collected
from several farms or sites and transported to the biogas facility. Haulage is costly so the energy content
of the manure and the haulage distance have to be considered and compared to the cost reduction arising
from economies of scale. A higher density of farms in a locality can reduce transportation distances and
increase the potential for economic operation of biogas facilities.

1.2       METHANE POTENTIAL AND YIELD FROM MANURE TYPES
     It is difficult to find a common basis which allows for a comparison of the absolute results of manure
biogas (or methane) potentials and yields. Potential is defined here as the maximum theoretical amount
obtainable from a given substrate, yield is defined as the amount which is actually obtained in a technical
process (such as a full scale biogas facility).
     It is not recommended by the authors to take a generic value for biogas/biomethane production from
a particular feedstock from a book or single source of literature when designing a biogas facility. There
are methodical differences in these biogas potential figures that can lead to significant variation when
analysed; the potential depends on the animal species who produce the manure (see Table 1), the compo-
sition of the manure itself which is influenced by the bedding material used and the diet of the animals
and the storage time of the manure prior to anaerobic digestion. Manure is material that has already been
digested within the animal, so the potential is lower than the undigested plant materials that formed the
feed for the animal. Manure contains to a large extent, substances which are difficult to degrade; the easy
degradable fractions have been removed during digestion by the animal. In analysing manure, the kinetic
factors highlight slow degradation processes.
     Another important factor for the economics of biogas facilities is the addition of water to manure.
Many housing systems add water to transport manure within and out of barns which leads to total solid
contents less than 10 %. For anaerobic digestion systems this results in a relatively low specific methane
yield per unit volume of manure and a high heating energy demand to warm the manure to anaerobic
digestion temperature ranges. In particular pig manure tends to be highly diluted and energy rich co-
substrates are needed to allow a sufficient biogas production rate and capacity utilization.
     Other issues are associated with inert material present in manures. Poultry feed contains inert material
to improve feed digestion in birds, this results in a high content of inert materials in the resulting poultry

                                                Potential and utilization of manure to generate biogas in seven countries   7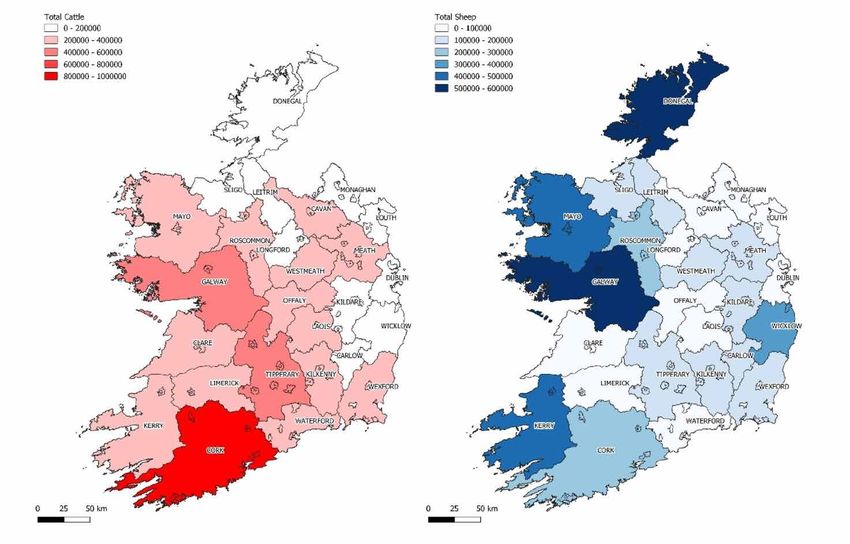
manure. Manure from feedlots without concrete floors can also contain a substantial quantity of inert
particles such as sand, gravel and stones which cause abrasion of moving parts, settle out in the digesters
occupying digestion volume and overtime leading to a reduction in effective volume of the digester.
    Last but not least manures require different technical digestion processes. Cattle manure is rich in
methanogens and easy to digest. Chicken manure on the other hand, contains inert material which poses
a mechanical challenge and a high nitrogen content which poses a biological challenge as the ammonia
produced in the digestion process can inhibit the growth of microorganisms. Pig manure is usually low in
total solids and requires co-substrates to be digested. In Table 2 default values of methane potential from
the IPCC (2019) for different animals are given.
    The fact that manure is a residue and that manure management emits a significant amount of green-
house gases is an advantage when considering the use of manure in anaerobic digestion systems. An-
aerobic digestion reduces the greenhouse gas emission potential of manures and consequently reduces
these fugitive greenhouse gas emissions considerably. Additionally, the energy produced from the biogas
can substitute fossil energy carriers and contribute to further greenhouse gas emission reductions. Since
methane is a highly potent greenhouse gas and fugitive emissions from manure management represent
a significant portion of emissions related to agriculture, anaerobic digestion is a crucial tool to reduce
emissions from manure management in particular and from agriculture in general (Liebetrau et al., 2017).
Greenhouse gas emissions are dependent on the biogas potential of the manure, the conditions of manure
storage (such as water content, crust/cover on the surface, duration of storage period) and particularly the
temperature of the stored substances. The IPCC provides standard values for the methane emitted from
manure storage systems. Depending on type of storage and temperature, the emissions can reach up to
80 % of the initial methane potential of the manure. Table 3 gives exemplary selected emissions factors for
animal manure in different manure management systems. The reader is referred to IPCC (2019) for more
details.

Table 2: Default values for methane potential from animal manure (adapted from IPCC, 2019)

                         Default values for methane potential (Bo) (m³CH4*kg-1VS)
                                                     Region
 Category of animal     North       Western         Eastern
                                                              Oceania                 Other regions
                       America      Europe          Europe
                                                                         High productivity   Low productivity
                                                                             systems             systems
 Dairy cattle                                0.24                              0.24                   0.13
 Non dairy cattle        0.19         0.18           0.17       0.17           0.18                   0.13
 Buffalo                                     0.10                              0.10                   0.10
 Swine                   0.48         0.45           0.45       0.45           0.45                   0.29
 Chicken layer                               0.39                              0.39                   0.24
 Chicken Broilers                            0.36                              0.36                   0.24
 Sheep                                       0.19                              0.19                   0.13
 Uncertainty values are ±15 %

    The addition of water plays a great role in the methanogenic activity. Lagoons and slurry storage
systems which are manure management systems for manure with a high water content have significantly
higher methane conversion factors than dry storage systems. This needs to be considered when aiming to
achieve emission reductions through anaerobic digestion; significant detail must be focused on systems
with liquid manure storage to achieve highest emission reductions. With regards to anaerobic digestion
systems, it is clear that the IPCC considers leakage the major issue for emissions and as such for carbon
sustainability. Proper technical implementation, leak detection and repair are crucial for a significant posi-
tive impact of manure digestion on GHG reduction.

                                                      Potential and utilization of manure to generate biogas in seven countries   8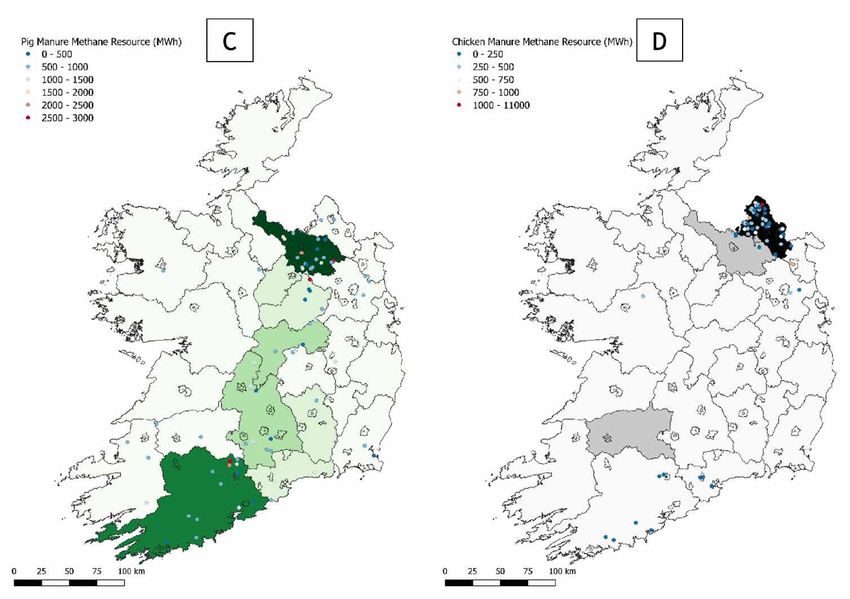
Table 3: IPCC values for emissions from manure management (selected from IPCC 2019)

                                 Methane conversion factors for manure management systems (data from IPCC)
                                                                      Methane Conversion Factors (MCFs) by climate zone
                                                            Cool                              Temperate                            Warm
System                                      Cool      Cool                                Warm      Warm
                                                                   Boreal      Boreal                       Tropical       Tropical   Tropical   Tropical
                                         temperate temperate                            temperate temperate
                                                                   moist        dry                         montane          wet       moist       dry
                                           moist      dry                                 moist      dry

Uncovered anaerobic lagoon                 60%        67%           50%         49%        73%            76%      76%       80%           80%     80%
Liquid/slurry and pit       1 month         6%         8%           4%           4%        13%            15%      25%       38%           36%     42%
storage below animal       3 months        12%        16%           8%           8%        24%            28%      43%       61%           57%     62%
confinement with sto-
rage duration of           4 months        15%        19%           9%           9%        29%            32%      50%       67%           64%     68%
                           6 months        21%        26%           14%         14%        37%            41%      59%       76%           73%     74%
                           12 months       31%        42%           21%         20%        55%            64%      73%       80%           80%     80%
Cattle and swine deep
bedding with storage       >1 month        21%        26%           14%         14%        37%            41%      59%       76%           73%     74%
duration of
Cattle and swine deep bedding
with storage duration of less than                       2.75%                                    6.5%                             18%
1 month
Solid storage– covered/compacted                         2.00 %                                   4.00%                            5.00%
Solid storage – bulking agent                            1.00%                                    2.00%                            2.50%
Dry lot                                                  1.00%                                    1.5%                             2.0%
Daily spread                                                0.1%                                  0.5%                             1.0%
Pasture/Range/Paddock                                                                            0.47%
Poultry manure with and without litter                                                           1.50%
Anaerobic Digester, Low leakage,
High quality gastight storage,                                                                   1.0%
best complete industrial technology
Anaerobic Digester, Low leakage,
High quality industrial technology,                      3.55%                                    4.38%                            4.59%
open storage
Anaerobic Digester High leakage,
low quality technology, high quality                                                             9.59%
gastight storage technology
Anaerobic Digester, High leakage,
                                                         12.14%                                  12.97%                          13.17%
low quality technology, open storage

                     1.3        REFERENCES
                     Fagerström, A., Al Seadi, T., Rasi, S., Briseid, T, (2018). The role of Anaerobic Digestion and Biogas in the
                         Circular Economy. Murphy, J.D. (Ed.) IEA Bioenergy Task 37, 2018: 8
                     IPCC (2019), 2019 refinement to the 2006 IPCC guidelines for national greenhouse gas inventories,
                         https://www.ipcc.ch/report/2019-refinement-to-the-2006-ipcc-guidelines-for-national-greenhouse-gas-
                         inventories/>.
                     Liebetrau, J., Reinelt, T., Agostini, A., Linke, B. (2017) Methane emissions from biogas plants Methods for
                         measurement, results and effect on greenhouse gas balance of electricity produced. Murphy, J.D. (Ed.) IEA
                         Bioenergy Task 37, 2017:12
                     McCabe, B., Kroebel, R., Pezzaglia, M., Lukehurst, C., Lalonde, C., Wellisch, M., Murphy, J.D. (2020). Integra-
                         tion of Anaerobic Digestion into Farming Systems in Australia, Canada, Italy, and the UK. Lalonde, L.,
                         Wellisch, M., Murphy, J.D (Ed.) IEA Bioenergy Task 37, 2020: 8

                                                                          Potential and utilization of manure to generate biogas in seven countries      9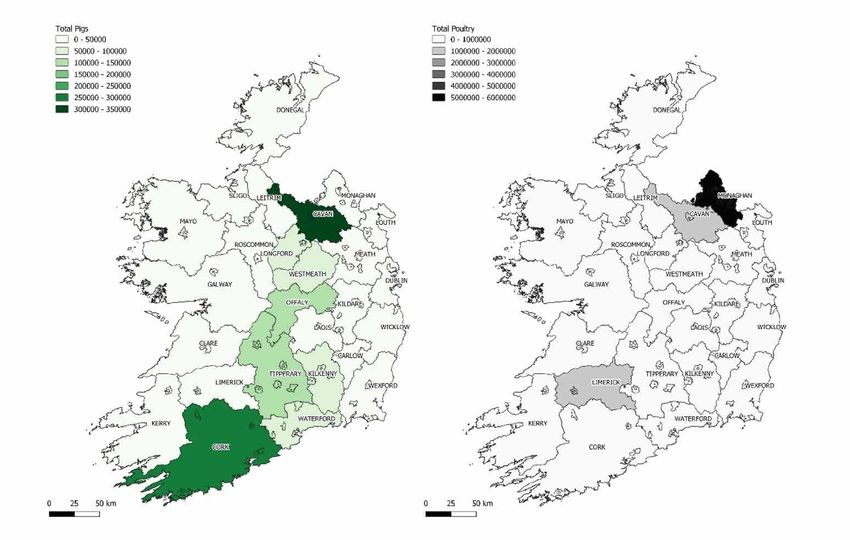
2 Country specific manure potential and utilization
   In the following section selected characteristics of animal husbandry, manure availability, utilisation
and potential for utilization in a biogas facility are presented for seven countries.

2.1      GERMANY
2.1.1 Overall potential
   The population of animals in Germany may be synthesised from a range of references over the last few
years as follows:
   •      11.4 million cattle;
   •      25.5 million pigs;
   •      1.6 million sheep;
   •      694,000 poultry livestock units.

     A more in depth understanding of the quantity of manure and its characteristics requires more analy-
sis based on assumptions and simplifications. This leads to uncertainty in estimating the precise resource
of manure that may be available for biogas. On top of this, there are many factors which influence the ac-
cessibility or availability of the manure.
     DBFZ (2019) undertook an assessment which quantified manure produced from cattle and pigs in
mass fresh matter (FM) as: 115 million t FM*yr-1 of cattle manure and 31 million t FM*yr-1 of pig manure.
Of these quantities an estimated 38 million t FM*yr-1 cattle manure (33 %) and 5 million t FM*yr-1 pig
manure (16 %) are already used in biogas facilities. Conversely 77 million t FM*yr-1 of cattle manure and
26 million t FM*yr-1 of pig manure are not utilized.

2.1.2 Structure of agriculture and spatial distribution of manure
    For biogas production relevant cattle farms have substantially varying average farm sizes from a few to
several thousand animals. The average farm sizes differ from region to region. In general, there is a long
lasting ongoing change in the agricultural structure with closing down of smaller farms and increasing
numbers of larger farms. When proposing a strategy for the implementation of an appropriate biogas con-
cept this poses the question as to which plant concepts (in particular size/capacity) shall be incentivized in
order to support biogas facilities which will utilize manure in the most cost efficient and sustainable way.
    The implementation of a biogas system requires knowledge of the technology and its environmental
and financial sustainability; accordingly for economic reasons there is a limit to application of certain
biogas technologies to farms or facilities with few animals and associated low levels of feedstock. In Table 1
a rough estimation of the electric equivalence based on the mono-digestion of manure (without any co-
substrates) is given according to herd size.
    Based on biogas yields which are commonly used as reference in Germany (KTBL, 2013) and the
average manure production of (all) cattle livestock systems in Germany it may be assessed (as below) that
1,666 cattle are required to fuel a 100 kWe co-gen set:
    •    9.32 t FM*yr-1r per cow * 10 % TS * 80 % VS * biogas yield of 380 l*kgVS-1 * 5.3 kWh*m3 *35 %
         electrical efficiency *(365days * 24hours)-1 = 0.06 kWe per cow

     Manure digestion at small scale has been supported with an incentive for a particular size of manure-
based facility (maximum 75 kWe average output with a minimum of 80 % of input manure). This tariff
scheme was successful only for optimal locations with available substrate potential to provide 75 kWe.
For smaller facilities with less animals the remuneration proved insufficient. Discussions are on-going
to increase this class to c.100 kWe ; this will not help to increase amounts of manure utilized for biogas.
     Nationwide it can be stated that farm sizes with more than 100 cattle per farm or 400 pigs contain suf-
ficient manure to be of interest for a biogas system. Since there are still many herds with smaller numbers
of animals (Figure 1), the overall manure potential available for biogas within a country is not necessarily
aligned to the number of animals in the country but must include the farm size and the readily accessible
resource typically associated with larger farms.

                                                    Potential and utilization of manure to generate biogas in seven countries   10
Figure 1: Distribution of pig and cattle manure by farm size in Germany (DBFZ 2019)
Table 4 outlines the average numbers of animals per farm as of November 2017 (Statistisches Bunde-
samt 2018). It can be clearly seen that agriculture in Germany is still dominated by small farm enterprises
(Table 4). This is important to know when it comes to the development of strategies to access the manure
and serves as an indication of the challenge in providing economically sustainable biogas facilities at in-
dividual farms.
Table 4: Average number of animals per farm (Germany 2017) (Statistisches Bundesamt 2018)
Dairy (as Breeding pigs
Laying
Germany Cattle fraction Pigs (as fraction Sheep Goat Broiler
hen
of cattle) of pigs)
Average -
86 64 1,175 229 160 14 1,160 28,166
animals per farm
In Germany most of husbandry comprises closed barns with manure removal systems. Cattle as well
as swine manure is very often diluted and pumped out of barns to lagoons or storage tanks. A total of
204 million m³ of liquid manure (including digestate from biogas facilities which accounts for 31 % of the
mass) was applied on agricultural land; 20 million tonnes of solid manure was applied on agricultural land
(Statistisches Bundesamt 2015).
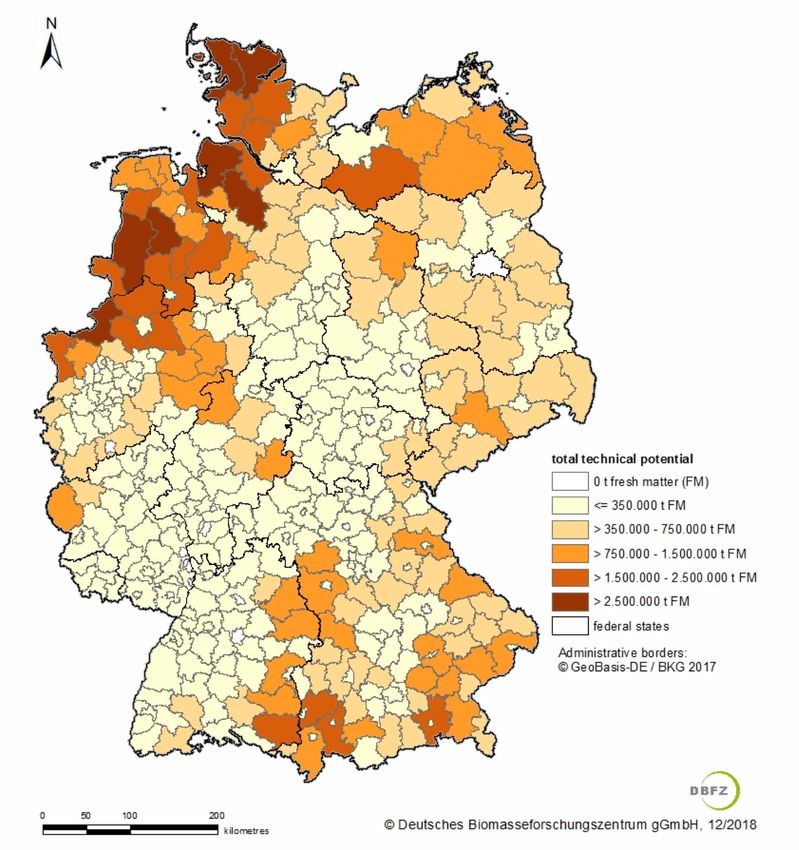
2.1.3 Spatial distribution
There are districts in Germany where the density of animals is very high (Figure 2). In these regions
land application of the produced manure has become more and more controversial due to nutrient over-
load leading to eutrophication and pollution of water resources. Manure and/or nutrient transportation
out of the region is an option for farmers to remove manure sourced pollution in these regions.
In the past the support schemes for biogas facilities led to construction of biogas facilities based on
manure and energy crops (primarily maize) as substrate. The negative effects included higher prices for
maize due to land competition since it is also the main fodder for cattle. It also led to pressure on land ap-
plication of digestate, since the masses of liquid digestate resulting from energy crop digestion increased
overall amounts of farm fertilizer to be applied on limited available land.
Although the described conflict was limited to a few rural districts, the debate had a large impact on
overall perception and acceptance of biogas in Germany. Suggestions to solve these issues were to limit
the numbers of animals per ha and biogas facilities, but this will not find the necessary agreement with
the decision makers. On the other hand there are other regions in Germany with mainly arable farming
practices which are in need of organic fertilizers. These regions would benefit from a more even distribu-
tion of animal husbandry.
Potential and utilization of manure to generate biogas in seven countries 112.1.4 State of the art of manure utilization
In 2016 an estimated amount of 53.3 million tonnes of manure were utilized in German biogas facili-
ties. This translates to approximately 4 TWh of electricity based on manure (Scholwin et. al. 2019).
In the beginning of the agricultural biogas sector industry in Germany, biogas was produced based on
manure and waste materials. With 1-2 million ha of unused land in the early 2000 years, the decision to
incentivise the use of energy crops in 2004 in biogas facilities changed the industry and the use of manure
experienced a drop. The 2009 amendment of the renewable energy sources act (EEG - the period with
overall most attractive tariffs), a bonus for manure utilization was introduced. However, since the eligibil-
ity to the bonus was bound to a minimum fraction of 30 % (by mass) of manure within the input materials,
many “tariff optimized facilities” with roughly 30 % of manure input were build and are operational up
to now. In 2012 a new class of facilities with a capacity of lower than 75 kW and a minimum of 80 % of
manure in the input was introduced in order to support manure utilization. This class survived all major
changes since then and has not been as heavily affected by the tariff reductions as other plant sizes.
Figure 2: Spatial distribution of manure potential, given as t per rural district.
Potential and utilization of manure to generate biogas in seven countries 12When examining herd size distribution (Figure 1) it is apparent that 75 kWe is hard to be reached for
most farms. However, when looking from the biogas plant perspective – a 75 kWe facility is a small biogas
plant with high specific costs – and even more costly when operated with water rich substrates such as
liquid manure. In 2012 within the EEG, a classification of substrate was introduced which allowed a higher
tariff to “sustainable” substrates such as manure. Unfortunately, this rather progressive instrument to steer
the used substrates to manure was abandoned in 2014; since then, economics have driven the develop-
ment with little regulation on the substrates. The specific tariff class for manure based small scale facilities
survived all changes beyond 2012. Despite the flaws of this 75 kWe category it represents the only class of
biogas facilities where currently new (but still few) installations are to be seen.
For many facilities the end of the 20-year funding period (guaranteed by the German renewable en-
ergy sources act (EEG)) is approaching. Since tariffs in the recent amendments of EEG are much lower a
substantial number of facilities are likely to phase out. This means that manure utilization in biogas facili-
ties might decline in the future. Manure utilization in biogas facilities in Germany can be characterised as
per Figure 3 and 4.
Figure 3: Mass and energy related fractions of manure and energy crops in Germany
(all biogas facilities).
Figure 4: Mass and energy related fractions of manure and energy crops in Germany (only for
small scale (75kWe) manure-based facilities (with a minimum of 80 % manure required in the
input feedstock)).
The difference in biogas potential within the substrate becomes obvious, when comparing the mass
and energy related shares. Small scale biogas facilities use very little energy crops, although they are al-
lowed to use up 20 % by mass in the input. The rationale for this is specification and cost related. Manure
is for free if available in sufficient quantities on site and facilities with 100 % manure input do not have a
requirement to have a retention time of 150 days in a gas tight system; this facilitates cost reduction in the
digester dimensions and construction.
The amounts of manure applied in German biogas facilities are not specific to certain plant capacities.
Looking only at cattle manure (Figure 5), 36 % of the facilities use 75 % of the overall utilized manure.
These 36 % use 5,500 t*yr-1 or more of cattle manure which equals approximately to an average of 39 kWe
Potential and utilization of manure to generate biogas in seven countries 13electrical capacity or higher. These facilities need to stay operational in the future if the amount of used
manure shall not decline significantly. Again, it becomes obvious that a significant number of facilities
utilize manure with an electrical equivalent below 75 kWe, meaning that a transition into currently avail-
able support systems for manure utilization is not a cost-effective option.
Figure 5: Plant capacities (kW) and manure mass per plant (in kWe).
Looking at the types of manure used (Figure 6) it becomes apparent that cattle manure is more often
used (with a share of 66 %) than pig manure. Pig manure is simply less available, and digestion is also tech-
nically more demanding than cattle manure. Pig manure is higher in water content and much more dif-
ficult to digest in mono-fermentation. When examining small-scale facilities (75 kWe) which are obliged
to use a minimum of 80 % manure, the share of cattle manure within these types of manures is 83 %.
Figure 6: Shares of manures used in the biogas sector in Germany
2.1.5 Cost structure
If available on site in sufficient masses manure is a cheap substrate; liquid manure is rather easy to
handle especially if some basic infrastructure such as tanks and pipes are in place. Digestion is easy to
implement within the farming system and existing structures and cattle manure in particular is also easy
to process. However, the large fraction of water in the manure and the low specific gas yields make the
addition of co-substrates desirable and in the case of pig manure even essential. High water content leads
to high retention times, which adds to the cost.
Potential and utilization of manure to generate biogas in seven countries 14The cost curve for cattle and pig manure (with associated economies of scale highlighted) can be seen
in Figure 7. The current assigned tariffs of roughly 22 (euro cent per kilowatt hour) € ct*kWh-1 are not
sufficient for a standard 75 kWe facility and consequently it cannot be sufficient for locations with smaller
herd sizes and consequently lower capacities. Furthermore, facilities which use pig manure are more costly
than facilities that use cattle manure as feedstock, because of the lower energy content of pig manure. Site
specific conditions differ in detail such as existing infrastructure like storage tanks. There are several op-
tions for cost reduction, but caution must be exercised in accepting costs from others; quite often facilities
are stated to have lower costs by assigning costs from the biogas facility to cattle production or by not
putting an economic value to their own labour during construction or maintenance. This may be a reason
these facilities are still built, even though a general cost estimate would suggest they are not favourable.
Transportation to concentrate mass of manure to achieve a capacity which allows a cost efficient op-
eration can be commendable if the gain in cost reduction by mass concentration and economy of scale
exceeds the transportation costs. For transportation of liquid manure, the water content again represents a
limiting factor, since transportation of water only produces costs. In case of the very specific situation with
the support scheme with an upper limit of 75 kWe installed capacity in Germany it can be stated, that since
the tariff is not sufficient for a location where all the manure is available on site, it cannot be sufficient with
additional costs of transportation.
Chicken manure disposal costs are very high and as such processing in a biogas facility may be a
cheaper option. As chicken manure is already transported across the country the avoidance of these dis-
posal costs may lead to economic biogas facilities.
Figure 7: Cost-capacity relation of manure-based biogas facilities in Germany
(60 d retention time, open digestate storage)
2.1.6 Lessons learnt and perspectives of manure utilization
In Germany the reduction of emissions from manure management was identified as one of the major
leverages to reduce agriculture emissions. Consequently, the target to increase manure utilization was
expressed by the Federal Ministry of Food and Agriculture (BMEL, 2019). However, the extent of the
present biogas industry suggests that the low hanging fruits are gone, meaning easily accessible manure
is already used in biogas facilities. For further increase in utilization, additional instruments are needed,
and these instruments need to reflect the distribution of farm sizes and numbers of farms in geographic
specific regions to be effective.
Potential and utilization of manure to generate biogas in seven countries 15In Figure 8 the mass of manure, the herd size distribution and the costs (retrieved from cost curve
given in Figure 7) for the respective biogas facilities to utilize the manure have been assessed to highlight
costs associated with increasing manure utilization and resulting GHG emissions reductions. The calcula-
tions for figure 8 are based on combined heat and power (CHP) production from biogas.
At the moment 43.5 million tonnes of manure is utilized in Germany in biogas facilities, which results
in utilization expenses of €0.82 billion per year and an annual GHG reduction of approximately 1.2 mil-
lion tonnes of CO2.
As shown in Figure 1 currently manure is utilized mainly at farms with large herds. In order to pursue
the target of further GHG reduction, it is necessary to expand manure utilization to the smaller farms.
Obviously, the resulting costs increase disproportionally with increasing utilization rates due to the in-
creasing specific costs associated with smaller farms.
A complete manure utilization would result in a cost of €3.97 billion per year which would save of the
order of 3.6 million tonnes of CO2. Biogas end use in Germany at the moment is dominated by electricity
production. The acceptance for expensive electricity from biomass is due to high overall electricity costs
in Germany. As an alternative the use of biogas as fuel is currently under discussion. German legislation
in the fuel sector, EU regulation and the GHG reduction credit for manure make manure a promising sub-
strate for biomethane production and use as a renewable fuel for transportation. However, biogas upgrad-
ing has even higher specific costs and requires larger plant capacities to reduce these costs. Depending on
the gas utilization option and scale of the plant, the GHG abatement costs show a range from 100 to about
900 €tCO2 equivalent; in specific cases it can be even higher (especially for very small plants). Economies
of scale has a particular effect here.
On the long term it has to be considered, that avoided emissions are calculated based on a given state
of the art or a standard technology. Given an emission free future, gas tight covers for manure storage will
be state of the art (including for destruction of methane or suppression of methane formation) and as such
future analysis may not include for the manure credit for avoided emissions. Any perspective for emission
reduction in manure management should consider alternatives to the production of a renewable energy
carrier (biogas) to reduce emissions. Biogas applications should be part of the overall strategy but may
not be the only measure to address emissions from manure management and specifically manure storage.
Concepts should be assessed on a whole life cycle basis and should include for the co-benefits (improved
water quality, reduced smells, improved fertilisation characteristics of digestate over manure) and indeed
the externalities of biogas systems.
Figure 8: Costs for increasing manure utilization in Germany (at the moment 43.5 million tonnes
are in use at a cost of €0.82 billion*yr-1, doubling this would result in 87 million t*yr-1 at a cost of
2 billion €*yr-1)
Potential and utilization of manure to generate biogas in seven countries 162.1.7 Conclusion
Although Germany has large amounts of manure used for biogas production, two thirds of the manure
is not in use. In the long term, the government has declared an ambition to reduce emissions from manure
management and biogas is seen as the primary first option to effect this. However, the support system for
biogas in Germany in the future is not certain and a strategy for a transition of existing facilities (and for
new constructions) to increase manure utilization is not evident. Consequently, there is a considerable
risk that with more and more biogas facilities going offline, that in the long-term manure utilization will
decrease rather than increase.
Experience with support instruments in the past show that manure utilization requires precise sup-
port schemes which reflect regional conditions, agricultural practise and farming structures. Small herd
sizes do not align with the aspiration for cost effective solutions. Additional instruments are required to
enhance the economic favourability of digestion of manure and to achieve emission reduction in manure
management at the large number of smaller farms with small herd sizes.
2.1.8 References Germany
Statistisches Bundesamt (2015). https://www.destatis.de/DE/Themen/Branchen-Unternehmen/Landwirtschaft-
Forstwirtschaft-Fischerei/Produktionsmethoden/aktuell-duengen.html download 7.10.2020
Statistisches Bundesamt (2018) Statistisches Bundesamt, Fachserie 3, Reihe 4, 2017; Land und Forstwirtschaft,
Fischerei; Viehbestand und tierische Erzeugung; Artikelnummer: 2030400177004
BMEL (2019) https://www.bmel.de/DE/themen/landwirtschaft/klimaschutz/klimamassnahmen-
klimaschutzprogramm2030.html download 7.10.2020
DBFZ (2019) Stefan Majer, Peter Kornatz, Jaqueline Daniel-Gromke, Nadja Rensberg, André Brosowski,
Katja Oehmichen, Jan Liebetrau Stand und Perspektiven der Biogaserzeugung aus Gülle
https://www.dbfz.de/fileadmin//user_upload/Referenzen/Broschueren/Broschuere_Peggue.pdf
KTBL (2013) Faustzahlen Biogas; Kuratorium für Technik und Bauwesen in der Landwirtschaft KTBL 2013
ISBN 978-3-941583-85-6
Scholwin et al. (2019) Aktuelle Entwicklung und Perspektiven der Biogasproduktion aus Bioabfall und Gülle
https://www.umweltbundesamt.de/sites/default/files/medien/1410/publikationen/2019-04-15_
texte_41-2019_biogasproduktion.pdf
2.2 AUSTRALIA
2.2.1 Overall potential
The largest and most relevant livestock sectors include cattle in both feedlots and dairies, pigs, and
poultry for both meat and eggs. While there are other large livestock industries in Australia, they are typi-
cally raised in environments not conducive to practical manure collection (such as cattle, sheep and goats
raised on pasture, range or paddock). Consequently, only intensive livestock agriculture will be considered
further in this report. Table 5 and Table 6 show the number of animals, mass of manure and methane po-
tential from Australian intensive agriculture industries and the amount of manure per animal and relevant
characteristics respectively.
Table 5: Number of animals, and manure masses and methane potential from Australian
intensive agriculture industries.
Fresh matter Dry matter Volatile B0
Animal/industry Number
t*yr-1 t*yr-1 solids t*yr-1 m3N CH4·t VS-1
Beef Feedlots Fresh & 12,279,168 1,426,368 1,215,514 218
3,040,000
(stockpiled) (643,416) (514,733) (303,878) (13)
Dairy cattle 1,411,000 9,820,512 1,178,461 1,013,477 200
Pigs (SPU)a 2,485,103 2,210,279 289,441 223,659 300
Chicken (meat) 651,000,000 1,119,720 895,776 772,607 390
Chicken (layers) 1,193,467 1,016,711 244,011 146,406 360
a 1 standard pig unit (SPU) = 90 kg VS·annum-1 (Tucker, 2018);
Potential and utilization of manure to generate biogas in seven countries 17Table 6: Amount of manure per animal and relevant characteristics
TS VS Gas yieldc No. of animals
Units t FM·head-1·yr-1
% FM % TS m³N CH4·t-1 VS Per 100 kWel*
Dairy 6.96 12 83 209 1,586a
Beef feedlotsb
4.04 11.6 85.2 218 2,732
(Fresh manure)
Beef feedlots
0.046 72.1 58 13d 249,226
(Stockpiled manure)
Pigs (SPU)b 0.889 13.10 77.3 300 8,820
Layer hens 0.039 24 60 390 33,408
Chicken (meat) 0.00172 80 86.25 360 512,780
a Assuming 40% of manure deposited on a surface is collectable;
b The standard pig unit (SPU) is based on 90 kg VS·annum-1. A single sow represents herself and the rest
of the pig herd onsite associated with her. Consequently 1 sow represents 10.7 SPU;
c Methane yields as cited in Tait, Harris and McCabe (2021);
d MLA (2017b);
* Number represents annual turnover of animals. Assumed CHP electrical conversion efficiency is 35%.
2.2.2 Structure of agriculture and spatial distribution of manure
One of the challenges with manure management in Australia is the large spatial distribution of animal
agriculture (Figure 9). Consequently, this report will focus on the manures which are practically collect-
ible; typically this refers to intensive farming. These animals include beef cattle on feedlots, dairy cows on
feedpads and in milking sheds, pigs in slatted floor sheds and deep litter sheds, and meat chickens and
layer hens (Table 7). While there are other farmed livestock in Australia, the low stocking densities result
in impractical manure collection, and these will not be considered further in this report.
Figure 9: Spatial distribution of agriculture in Australia; Wheat-sheep zone – Agricultural and
Grazing industries Survey, 2016, ABARES; Land use of Australia, 2010–11, ABARES, ABARES
(2019).
Potential and utilization of manure to generate biogas in seven countries 18Table 7: Relevant livestock numbers for manure collection in Australia, sorted by State.
Animals (,000) QLD NSW VIC TAS SA WA National
Cattle (beef feedlot)a 1,763 790 213 0 122 152 3,040
Cattle (Dairy)b 65 145 895 182 69 54 1,411
Pigs (Sows)c 64 59 68 2 46 37 232
Poultry (meat, head)d 135,408 207,669 127,596 180,327 651,000
Poultry (Layers & Pullets)e 7,151 9,440f 7,438 286 2,002g 2,288 28,606
a Meat and Livestock Australia (2020) ; b Dairy Australia (2020) ; c Acil Allen Consulting (2017) ; d Australian Chicken Meat
Federation (2020); e Australian eggs (2020b); f Value is for New South Wales and the Australian Capital Territory; g Value is
for South Australia and the Northern Territory.
Manure management varies both between and within each livestock sector, and consequently so do
the baseline emissions and methane potential. Tait, Harris and McCabe (2021) explored manure manage-
ment in Australia in more depth, however, the following subsections will aim to give a brief overview of
each industry.
Beef feedlots represent a good opportunity to capitalise on cattle manure as the spatial distribution of
manure is minimal, but facilities are not currently equipped to effectively capture manure which is most
suitable for methane production. Currently, cattle are contained in pens for an average of 136 days (Com-
monwealth of Australia 2020), though this time depends on the animal and the desired finish weight.
During this time, manure is deposited onto the pen surface and cleaning is conducted after this period
(Tucker et al., 2015). The infrequency of cleaning is due to labour and practicality considerations (Tucker
et al. 2015). Pens are either scraped clean down to the soil level, or a manure interface is left on the surface.
Scraping down to the soil has the benefit of recovering more manure but to the detriment of collecting
dirt and stones as contaminants (MLA, 2017b). Conversely, leaving a manure interface results in a lower
manure yield, but recovers a product with fewer contaminants (MLA, 2017b). Currently, manure is com-
monly composted and or stockpiled onsite and sold as fertiliser (Tucker et al., 2015). Both activities result
in significant greenhouse gas emissions, though, according to Bai et al. (2020) stockpiling can result in half
the emissions that composting produces.
Dairy farms are predominately pasture-based in Australia; however, intensive feeding systems are in-
creasingly more common in order to improve performance and climate resilience and as a result currently
represent approximately 26 % of total production (Watson & Watson, 2015; Dairy Australia, 2017; Christie
et al., 2018). Consequently, manure is only practically available for collection from these intensive systems
and pasture-based manure will not be considered further in this report.
Australia houses approximately 90 % of its pig herd indoors (Tucker, 2018). Housing is either in con-
ventional sheds with slatted flooring (70 % of herd), or in deep litter sheds (20 % of herd). Slatted flooring
allows excrement and spilt feed to pass through the slats to a concrete floor below. From here, waste is
flushed with water into an adjacent anaerobic lagoon for treatment before being recycled as flush water or
irrigation onto nearby agricultural land (Tucker, 2015). By contrast, deep litter sheds provide bedding in
the form of various straws, husks or saw dust, and this combines with manure, urine and spilt feed to form
litter (Tucker, 2015). While spent bedding has a good methane potential, spent bedding is currently spread
onto agricultural land as fertiliser (Tucker, 2015).
Manure production from layer hens varies between caged, barn-laid and free-range facilities. Caged
and barn-laid facilities represent 40 % and 10 % of egg production (Australian Eggs 2020a, 2020d). In these
facilities, hens are raised on flooring which allows for manure to pass through to collect on a conveyor belt.
Meat chickens are typically raised in barns with the flooring covered in bedding (such as straw, husks
or saw dust), though some barns use slatted floors (Federation, 2020).
2.2.3 State of the art manure utilization
Only pork manure is utilised for biogas production to any large extent in Australia due to the nature
of housing of livestock and the ability to collect fresh manure. The following summarises each industry’s
manure collection system and degree of biogas uptake.
Potential and utilization of manure to generate biogas in seven countries 19To the authors’ knowledge there are no feedlots currently operating biogas facilities in Australia. Due
to the dry, batch-wise production of feedlot manure, a dry digestion system such as a leach bed reactor
or plug-flow reactor may be more suitable for a feedlot to adopt. If feedlot throughput is reasonably stag-
gered, it may be possible to operate an anaerobic lagoon or continuous stirred-tank reactor, though these
would require significant water addition. If a slatted floor approach were adopted, recycled flush water
may be utilised to accommodate this process. The practical and economical collection of fresh manure
from beef feedlots would enable the best-case scenario for feedlot waste processing in both maximising
energy recovery and minimising water consumption. Industry-wide fresh feedlot manure production is
estimated (Table 5) at 12,279,168 t of fresh matter with a respective yield of 1,215,514 t of volatile solids
and a corresponding biochemical methane potential of 218 m3·t-1 of volatile solids (MLA, 2017a). By con-
trast, where feedlot manure is not readily collected but instead is allowed to age for over 100 days, the bi-
ogas potential of the collected manure is significantly reduced. During the aging process both the volatile
solids content and the biochemical methane potential deteriorate. The reduced theoretical national yield
of volatile solids was calculated at 303,878 t (Table 5) while the biochemical methane potential from aged
manure has been measured at 13 m3·t-1 VS (MLA, 2017a).
There are no commercial scale biogas facilities using dairy manure, however, there have been demon-
stration facilities in the past and there is renewed interest with new facilities under construction. While
dairy manure is sometimes a dry-scraped semi-solid, dairy manure is typically collected as a liquid efflu-
ent as a mixture of wash water, faeces, urine, cleaning chemicals, spilt feed and bedding if applicable; this
results in a dilute/low solids content, but may also be collected as a semi-solid from feed pads (Birchall,
Dillon & Wrigley, 2008). Australian dairy effluent is commonly treated in uncovered effluent ponds, and
the adoption of pond covers represents an incremental change from current practice (Batstone & Jensen,
2011). Treated effluent is typically irrigated back to agricultural land to recover nutrients (Dairy Australia,
2008). Australian dairy farms are transitioning toward feed pads in which the collection of dairy ma-
nure is more practical. Currently, only around 40 % of dairy manure is collectable, resulting in a yield of
9,820,512 t of fresh manure (Table 5) with a corresponding volatile solids component of 1,013,477 t.
Biogas uptake in the Australian pork industry as of 2018 was approximately 13.5 % of total Australian
pork production (Tait, 2018). There are approximately 20 systems which use covered anaerobic lagoons
to capture methane (IEA Bioenergy Task 37, 2018). While the Australian pork industry have been propo-
nents of biogas technology in Australia, there remains significant potential for the industry to capitalise
on. Assuming a collection potential of 90 %, corresponding to the pig herd housed indoors, the annual
collectable fresh matter (Table 5) is around 2,210,279 t with a volatile solids yield of 223,659 t.
Anaerobic digestion of layer hen manure is currently conducted in Australia, though the degree of
uptake within the industry is unknown. Manure from layer hens is collected from a conveyor belt that is
scraped and deposited onto another conveyor belt which transports the manure to a truck or storage unit
for subsequent removal from site. This manure is commonly applied to agricultural land as a fertiliser or
sold as fertiliser. Conversely, free-range farms represents 47 % of egg production (Australian Eggs, 2020c).
After egg laying, hens are allowed to roam freely. If hens are confined to a shed, straws, husks and saw dust
may be used as bedding in which manure and spilt feed accumulate to form litter. Spent bedding is typi-
cally spread on agricultural land. Layer hens in Australia produce an estimated 1,016,711 t of fresh manure
annually, with a volatile solids yield of 146,406 t (Table 5).
In terms of biogas production, spent bedding from meat chickens would be well suited for dry, batch-
wise digestion in a leach bed reactor or plug flow reactor. While the authors are unaware of any currently
active biogas facilities utilising meat chicken manure, there is active interest in this area (Energy Farmers
Australia 2019). Meat chickens are typically raised in barns with the flooring covered in bedding (straw,
husks or saw dust), though some barns use slatted floors (Federation, 2020). This bedding combines with
manure and spilt feed to form spent bedding. Spent bedding is commonly collected using a front-end
loader after every flock, though some farms may re-use partially composted old bedding mixed with new
bedding. In cases where bedding is re-used, litter is cleaned out after every second or third flock. Manure
collection is reduced in free-range farms where chickens also have access to land outside the barn. Spent
bedding is typically spread over agricultural land (Wiedemann, 2015).
Potential and utilization of manure to generate biogas in seven countries 20You can also read