Same data, different conclusions: Radical dispersion in empirical results when independent analysts operationalize and test the same hypothesis
←
→
Page content transcription
If your browser does not render page correctly, please read the page content below
Zurich Open Repository and
                                                                         Archive
                                                                         University of Zurich
                                                                         Main Library
                                                                         Strickhofstrasse 39
                                                                         CH-8057 Zurich
                                                                         www.zora.uzh.ch

 Year: 2021

   Same data, different conclusions: Radical dispersion in empirical results
   when independent analysts operationalize and test the same hypothesis

Schweinsberg, Martin ; Feldman, Michael ; Staub, Nicola ; et al ; Bernstein, Abraham ; Strobl, Barbara

Abstract: In this crowdsourced initiative, independent analysts used the same dataset to test two hy-
potheses regarding the effects of scientists’ gender and professional status on verbosity during group
meetings. Not only the analytic approach but also the operationalizations of key variables were left
unconstrained and up to individual analysts. For instance, analysts could choose to operationalize sta-
tus as job title, institutional ranking, citation counts, or some combination. To maximize transparency
regarding the process by which analytic choices are made, the analysts used a platform we developed
called DataExplained to justify both preferred and rejected analytic paths in real time. Analyses lacking
sufficient detail, reproducible code, or with statistical errors were excluded, resulting in 29 analyses in
the final sample. Researchers reported radically different analyses and dispersed empirical outcomes, in a
number of cases obtaining significant effects in opposite directions for the same research question. A Boba
multiverse analysis demonstrates that decisions about how to operationalize variables explain variability
in outcomes above and beyond statistical choices (e.g., covariates). Subjective researcher decisions play
a critical role in driving the reported empirical results, underscoring the need for open data, systematic
robustness checks, and transparency regarding both analytic paths taken and not taken. Implications for
organizations and leaders, whose decision making relies in part on scientific findings, consulting reports,
and internal analyses by data scientists, are discussed.

DOI: https://doi.org/10.1016/j.obhdp.2021.02.003

Posted at the Zurich Open Repository and Archive, University of Zurich
ZORA URL: https://doi.org/10.5167/uzh-204350
Journal Article
Published Version

The following work is licensed under a Creative Commons: Attribution 4.0 International (CC BY 4.0)
License.

Originally published at:
Schweinsberg, Martin; Feldman, Michael; Staub, Nicola; et al; Bernstein, Abraham; Strobl, Barbara
(2021). Same data, different conclusions: Radical dispersion in empirical results when independent
analysts operationalize and test the same hypothesis. Organizational Behavior and Human Decision
Processes, 165:228-249.
DOI: https://doi.org/10.1016/j.obhdp.2021.02.003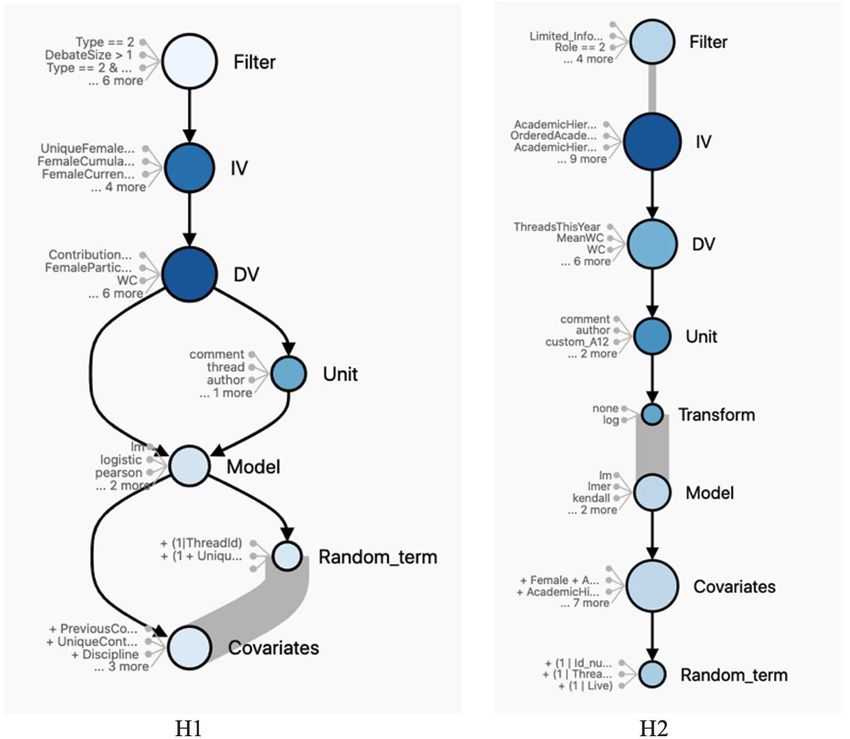
Organizational Behavior and Human Decision Processes xxx (xxxx) xxx

                                                           Contents lists available at ScienceDirect

                          Organizational Behavior and Human Decision Processes
                                                  journal homepage: www.elsevier.com/locate/obhdp

Same data, different conclusions: Radical dispersion in empirical results
when independent analysts operationalize and test the same hypothesis☆
Martin Schweinsberg a, 1, *, Michael Feldman b, 1, *, Nicola Staub b, 1, Olmo R. van den Akker c,
Robbie C.M. van Aert c, Marcel A.L.M. van Assen d, Yang Liu e, Tim Althoff e, Jeffrey Heer e,
Alex Kale e, Zainab Mohamed f, Hashem Amireh g, Vaishali Venkatesh Prasad a,
Abraham Bernstein b, *, Emily Robinson, Kaisa Snellman h, S. Amy Sommer i, Sarah M.G. Otner j,
David Robinson, Nikhil Madan k, Raphael Silberzahn l, Pavel Goldstein m, Warren Tierney n,
Toshio Murase o, Benjamin Mandl p, Domenico Viganola p, Carolin Strobl b, Catherine B.
C. Schaumans q, Stijn Kelchtermans r, Chan Naseeb s, S. Mason Garrison t, Tal Yarkoni u, C.
S. Richard Chan v, Prestone Adie w, Paulius Alaburda, Casper Albers x, Sara Alspaugh y,
Jeff Alstott z, Andrew A. Nelson aa, Eduardo Ariño de la Rubia ab, Adbi Arzi h, Štěpán Bahník ac,
Jason Baik, Laura Winther Balling ad, Sachin Banker ae, David AA Baranger af, Dale J. Barr ag,
Brenda Barros-Rivera ah, Matt Bauer ai, Enuh Blaise aj, Lisa Boelen ak, Katerina Bohle Carbonell al,
Robert A. Briers am, Oliver Burkhard, Miguel-Angel Canela an, Laura Castrillo, Timothy Catlett,
Olivia Chen, Michael Clark ao, Brent Cohn, Alex Coppock ap, Natàlia Cugueró-Escofet aq,
Paul G. Curran ar, Wilson Cyrus-Lai h, David Dai as, Giulio Valentino Dalla Riva at,
Henrik Danielsson au, Rosaria de F.S.M. Russo av, Niko de Silva a, Curdin Derungs aw,
Frank Dondelinger ax, Carolina Duarte de Souza ay, B. Tyson Dube, Marina Dubova az,
Ben Mark Dunn ag, Peter Adriaan Edelsbrunner ba, Sara Finley bb, Nick Fox bc, Timo Gnambs bd,
Yuanyuan Gong be, Erin Grand, Brandon Greenawalt bf, Dan Han, Paul H.P. Hanel bg,
Antony B. Hong h, David Hood, Justin Hsueh, Lilian Huang bh, Kent N. Hui bi,
Keith A. Hultman bj, Azka Javaid bk, Lily Ji Jiang bl, Jonathan Jong bm, Jash Kamdar,
David Kane bn, Gregor Kappler bo, Erikson Kaszubowski ay, Christopher M. Kavanagh,
Madian Khabsa, Bennett Kleinberg bp, Jens Kouros, Heather Krause bq,
Angelos-Miltiadis Krypotos br, Dejan Lavbič do, Rui Ling Lee bs, Timothy Leffel bh,
Wei Yang Lim bt, Silvia Liverani bu, Bianca Loh h, Dorte Lønsmann bv, Jia Wei Low bw, Alton Lu e,
Kyle MacDonald bx, Christopher R. Madan by, Lasse Hjorth Madsen bz, Christina Maimone al,
Alexandra Mangold, Adrienne Marshall ca, Helena Ester Matskewich e, Kimia Mavon bn,
Katherine L. McLain a, Amelia A. McNamara cc, Mhairi McNeill, Ulf Mertens cd, David Miller al,
Ben Moore ce, Andrew Moore, Eric Nantz cf, Ziauddin Nasrullah a, Valentina Nejkovic cg,
Colleen S Nell ch, Andrew Arthur Nelson aa, Gustav Nilsonne ci, Rory Nolan cj,
Christopher E. O’Brien, Patrick O’Neill ck, Kieran O’Shea ag, Toto Olita cl, Jahna Otterbacher cm,
Diana Palsetia al, Bianca Pereira, Ivan Pozdniakov cn, John Protzko co, Jean-Nicolas Reyt cp,
Travis Riddle cq, Amal (Akmal) Ridhwan Omar Ali cr, Ivan Ropovik cs, Joshua M. Rosenberg ct,
Stephane Rothen, Michael Schulte-Mecklenbeck cu, Nirek Sharma cv, Gordon Shotwell cw,
Martin Skarzynski, William Stedden, Victoria Stodden cx, Martin A. Stoffel cy, Scott Stoltzman cz,

 ☆
   This article is an invited submission. It is part of the special issue “Best Practices in Open Science,” Edited by Don Moore and Stefan Thau.
 * Corresponding authors.

https://doi.org/10.1016/j.obhdp.2021.02.003

0749-5978/© 2021 The Author(s). Published by Elsevier Inc. This is an open access article under the CC BY license (http://creativecommons.org/licenses/by/4.0/).

Please    cite   this   article   as:      Martin              Schweinsberg,        Organizational      Behavior      and     Human       Decision   Processes,
https://doi.org/10.1016/j.obhdp.2021.02.003
M. Schweinsberg et al.                                                                                                Organizational Behavior and Human Decision Processes xxx (xxxx) xxx

Subashini Subbaiah da, Rachael Tatman db, Paul H. Thibodeau dc, Sabina Tomkins dd,
Ana Valdivia de, Gerrieke B. Druijff-van de Woestijne df, Laura Viana dg, Florence Villesèche ad,
W. Duncan Wadsworth dh, Florian Wanders di, Krista Watts, Jason D Wells dj,
Christopher E. Whelpley dk, Andy Won, Lawrence Wu y, Arthur Yip, Casey Youngflesh dl,
Ju-Chi Yu dm, Arash Zandian dn, Leilei Zhang, Chava Zibman, Eric Luis Uhlmann n, 1, *
a
   ESMT Berlin, Germany
b
   University of Zurich, Switzerland
c
   Tilburg University, Netherlands
d
   Tilburg University and Utrecht University, Netherlands
e
   University of Washington, United States
f
  ESMT Berlin and Indiana University, Germany
g
   ESMT Berlin and Humboldt University Berlin, Germany
h
   INSEAD, France
i
  Marshall School of Business, University of Southern California, United States
j
  Imperial College Business School, United Kingdom
k
   Indian School of Business, India
l
  University of Sussex Business School, United Kingdom
m
    School of Public Health, University of Haifa, Israel
n
   INSEAD, Singapore
o
   Waseda University, Japan
p
   Stockholm School of Economics, Sweden
q
   Independent researcher
r
  KU Leuven, Belgium
s
  IBM, Germany
t
  Wake Forest University, United States
u
   University of Texas at Austin, United States
v
   Stony Brook University, United States
w
    University of Nairobi, Kenya
x
   University of Groningen, Netherlands
y
   University of California, Berkeley, United States
z
   Massachusetts Institute of Technology, United States
aa
     University of Kentucky, United States
ab
     California State University-Dominguez Hills, United States
ac
    The Prague College of Psychosocial Studies, Czech Republic
ad
     Copenhagen Business School, Denmark
ae
    University of Utah, United States
af
    University of Pittsburgh, United States
ag
     University of Glasgow, United Kingdom
ah
     Texas A&M University, United States
ai
    Illinois Institute of Technology, United States
aj
    Eskisehir Osmangazi University, Turkey
ak
     Imperial College London, United Kingdom
al
    Northwestern University, United States
am
      Edinburgh Napier University, United Kingdom
an
     University of Navarra, Spain
ao
     University of Michigan, United States
ap
     Yale University, United States
aq
     Universitat Oberta de Catalunya, Spain
ar
    Michigan State University, United States
as
    St. Michael’s Hospital, University of Toronto, Canada
at
    Department of Mathematics and Statistics, University of Canterbury, New Zealand
au
     Linköping University, Sweden
av
     Universidade Nove de Julho, Brazil
aw
      Lucerne University of Applied Sciences and Arts, Switzerland
ax
     Lancaster University, United Kingdom
ay
     Universidade Federal de Santa Catarina, Brazil
az
    Indiana University, United States
ba
     ETH Zurich, Switzerland
bb
     Pacific Lutheran University, United States
bc
     Rutgers University, United States
bd
     Leibniz Institute for Educational Trajectories, Germany, & Johannes Kepler University Linz, Austria
be
     Okayama University, Japan
bf
    University of Notre Dame, United States
bg
     University of Bath, University of Essex, United Kingdom
bh
     University of Chicago, United States
bi
    School of Management, Xiamen University, China
bj
    Elmhurst College, United States
bk
     Columbia University Medical Center, United States
bl
    University of Washington & Indiana University, United States
bm
      University of Oxford & Coventry University, United Kingdom
bn
     Harvard University, United States
bo
     University of Vienna, Austria
bp
     University College London, United Kingdom
bq
     York University, United Kingdom
br
    Department of Clinical Psychology, Utrecht University, the Netherlands, & Group of Health Psychology, KU Leuven, Belgium
bs
    Nanyang Technological University, Singapore
bt
    University of Colorado, Colorado Springs, United States

                                                                                             2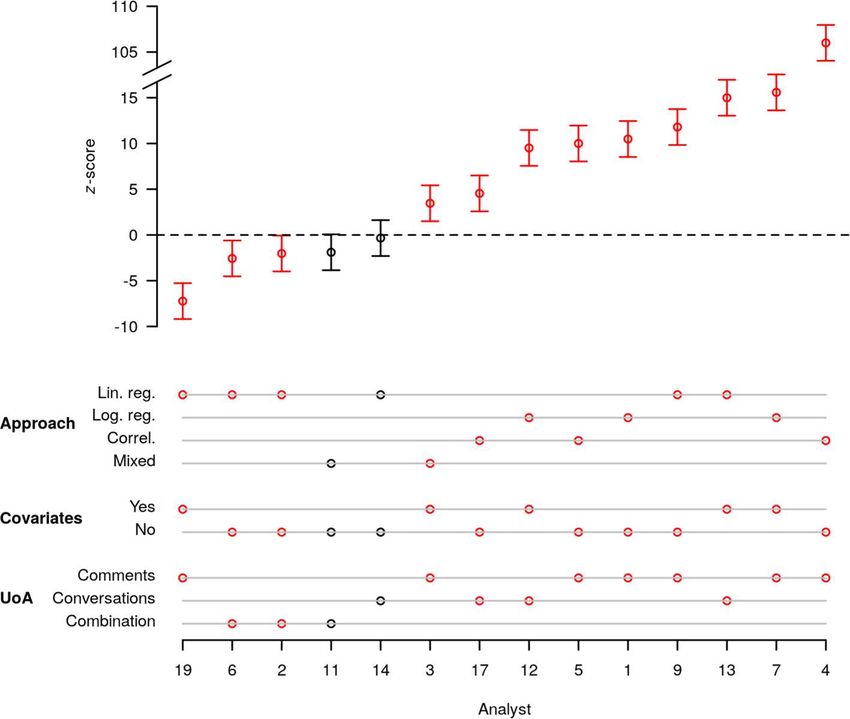
M. Schweinsberg et al.                                                                                                    Organizational Behavior and Human Decision Processes xxx (xxxx) xxx

bu
   Queen Mary University of London, United Kingdom
bv
   University of Copenhagen, Denmark
bw
    Singapore Management University, Singapore
bx
   McD Tech Labs, United States
by
   School of Psychology, University of Nottingham, United Kingdom
bz
   Novo Nordisk, Denmark
ca
   University of Idaho, United States
cc
   University of St Thomas, United States
cd
   Heidelberg University, Germany
ce
   University of Edinburgh, United Kingdom
cf
   Eli Lilly, United States
cg
   University of Nis, Faculty of Electronic Engineering, Serbia
ch
   George Washington University, United States
ci
   Karolinska Institutet and Stockholm University, Sweden
cj
   University of Oxford, United Kingdom
ck
   University of Maryland, Baltimore County, United States
cl
   The University of Western Australia
cm
    Open University of Cyprus, Cyprus
cn
   National Research University, Higher School of Economics, Russia
co
   University of California, Santa Barbara, United States
cp
   McGill University, Canada
cq
   National Institutes of Health/National Institute of Mental Health, United States
cr
   The University of Sheffield, United Kingdom
cs
   Charles University, Faculty of Education, Institute for Research and Development of Education, Czech Republic & University of Presov, Faculty of Education, Slovakia
ct
   University of Tennessee, Knoxville, United States
cu
   University of Bern, Switzerland & Max Planck Institute for Human Development, Germany
cv
   Washington University in St. Louis, United States
cw
    Dalhousie University, Canada
cx
   University of Illinois at Urbana-Champaign, United States
cy
   Institute of Evolutionary Biology, University of Edinburgh, United Kingdom
cz
   Colorado State University, United States
da
   CSU, United States
db
   Rasa Technologies, United States
dc
   Oberlin College, United States
dd
   Stanford University, United States
de
   University of Granada, Spain
df
   Radboud University Nijmegen, Netherlands
dg
   University of Hawaii, United States
dh
   Microsoft & Rice University, United States
di
   University of Amsterdam, Netherlands
dj
   Dartmouth College, United States
dk
   College of Charleston, United States
dl
   Department of Ecology and Evolutionary Biology, University of California, Los Angeles, United States
dm
    The University of Texas at Dallas, School of Behavioral and Brain Sciences, United States
dn
   Division of Affinity Proteomics, Department of Protein Science, KTH Royal Institute of Technology & SciLifeLab, Sweden
do
   University of Ljubljana, Slovenia

A R T I C L E I N F O                                        A B S T R A C T

Keywords:                                                    In this crowdsourced initiative, independent analysts used the same dataset to test two hypotheses regarding the
Crowdsourcing data analysis                                  effects of scientists’ gender and professional status on verbosity during group meetings. Not only the analytic
Scientific transparency
                                                             approach but also the operationalizations of key variables were left unconstrained and up to individual analysts.
Research reliability
Scientific robustness                                        For instance, analysts could choose to operationalize status as job title, institutional ranking, citation counts, or
Researcher degrees of freedom                                some combination. To maximize transparency regarding the process by which analytic choices are made, the
Analysis-contingent results                                  analysts used a platform we developed called DataExplained to justify both preferred and rejected analytic paths
                                                             in real time. Analyses lacking sufficient detail, reproducible code, or with statistical errors were excluded,
                                                             resulting in 29 analyses in the final sample. Researchers reported radically different analyses and dispersed
                                                             empirical outcomes, in a number of cases obtaining significant effects in opposite directions for the same research
                                                             question. A Boba multiverse analysis demonstrates that decisions about how to operationalize variables explain
                                                             variability in outcomes above and beyond statistical choices (e.g., covariates). Subjective researcher decisions
                                                             play a critical role in driving the reported empirical results, underscoring the need for open data, systematic
                                                             robustness checks, and transparency regarding both analytic paths taken and not taken. Implications for orga-
                                                             nizations and leaders, whose decision making relies in part on scientific findings, consulting reports, and internal
                                                             analyses by data scientists, are discussed.

  1
    Author contributions. The first three and last author contributed equally to this project. MS coordinated the overall project. MS, MF, NS, AB, and EU concep-
tualized the project. MF, NS, & AB created the DataExplained platform. OvdA, RvA, and MvA carried out the quantitative analyses of the results of the overall project.
YL, TA, JH and AK carried out the Boba multiverse analysis. ESR, KS, AS, SO, DR, NM, and RS constructed the dataset used in the project. ESR, KS, AS, and SO
coordinated the pilot study. PG, WT, TM, BM, DV, HA, VP, ZM and CS provided further statistical expertise. MF and NS carried out the qualitative analyses of
researcher justifications for their decisions. Authors 24 to 179 contributed hypotheses in the idea generation phase, analyzed data as part of the pilot, served as
crowdsourced analysts for the primary project, and/or helped with project logistics. MS, MF, NS, OvdA, RvA, MvA, AB, & EU drafted the manuscript. All authors
provided edits and feedback on the manuscript.

                                                                                                3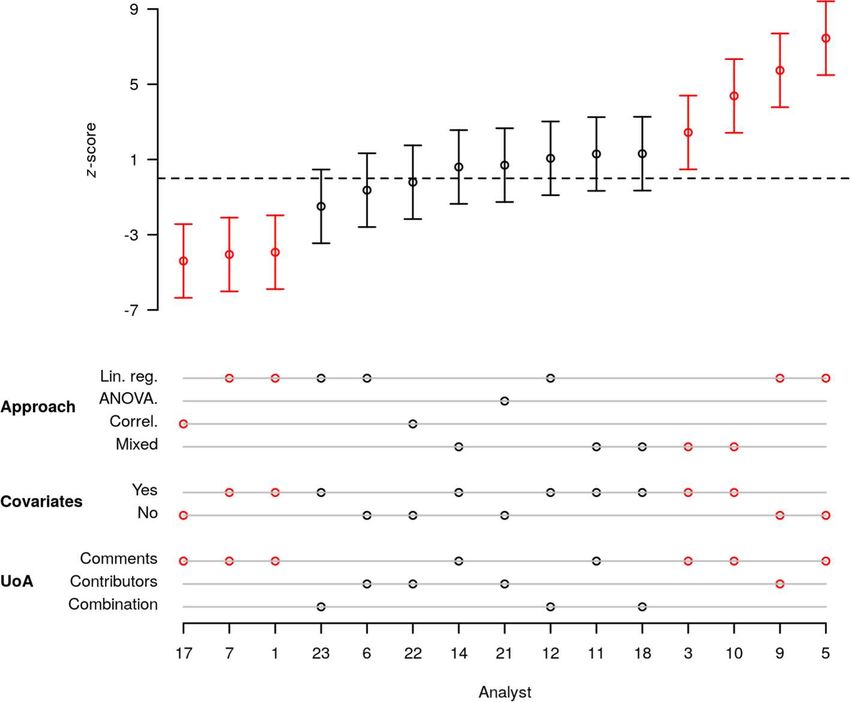
M. Schweinsberg et al.                                                                               Organizational Behavior and Human Decision Processes xxx (xxxx) xxx

1. Introduction                                                                    results across independent scientific teams (Bastiaansen, Kunkels, &
                                                                                   Blaauw, 2020; Botvinik-Nezer et al., 2020). Relying on fMRI data from
    In a typical scientific investigation, one researcher or a small team of       108 research participants who performed a version of a decision-making
researchers presents analytical results testing a particular set of research       task involving risk, Botvinik-Nezer et al. (2020) recruited 70 research
hypotheses. However, as many scholars have argued, there are often                 teams to test nine hypotheses (e.g., “Positive parametric effect of gains
numerous defensible analytic specifications that could be used on the              in the vmPFC”). Analysts were asked whether each hypothesis was
same data, raising the issue of whether variations in such specifications          supported overall (yes/no) in their analysis of the dataset. No two teams
might produce qualitatively different outcomes (Bamberger, 2019;                   used the same approach, and only 1 of 9 hypotheses received support (i.
Cortina, Green, Keeler, & Vandenberg, 2017; Gelman, 2015; Gelman &                 e., a “yes” response) across the large majority of teams (Hypothesis 5,
Loken, 2014; Leamer, 1985; Patel, Burford, & Ioannidis, & 2015; Saylors            with 84.3% support). Three hypotheses were associated with nearly-
& Trafimow, in press; Wicherts et al., 2016). This question generally              uniform null results across analysts (94.3% non-significant findings),
goes unanswered, as most datasets from published articles are not                  while for the remaining five hypotheses between 21.4% and 37.1% of
available to peers (Aguinis & Solarino, in press; Alsheikh-Ali, Qureshi,           teams reported statistically significant support. At the same time, meta-
Al-Mallah, & Ioannidis, 2011; Savage & Vickers, 2009; Vines et al.,                analysis revealed significant convergence across analysis teams in terms
2013; Wicherts, Borsboom, Kats, & Molenaar, 2006; Womack, 2015;                    of the activated brain regions they each identified. In another recent
Young & Horvath, 2015). However, simulations and case studies suggest              crowd project, Bastiaansen et al. (2020) recruited 12 analysis teams with
that the exploitation of researcher degrees of freedom could easily lead           expertise in event sampling methods to analyze individual time-series
to spurious findings (Simmons, Nelson, & Simonsohn, 2011), coding                  data from a single clinical patient for the purposes of identifying treat-
different research articles from the same topic area reveals as many               ment targets. A standard set of questionnaire items assessing depression
analytic approaches as there are publications (Carp, 2012a, 2012b), and            and anxiety (e.g., “I felt a loss of interest or pleasure”, 0 = not at all, 100
meta-scientific statistical techniques find evidence of publication bias, p-       = as much as possible) was administered repeatedly to the same single
hacking, and otherwise unreliable results across various scientific lit-           patient over time. Participating researchers were asked “What symptom
eratures (e.g., O’Boyle, Banks, & Gonzalez-Mulé, 2017; O’Boyle, Banks,            (s) would you advise the treating clinician to target subsequent treat-
Carter, Walter, & Yuan, 2019; Williams, O’Boyle, & Yu, 2020). Multi-               ment on, based on a person-centered (-specific) analysis of this partic-
verse analyses and specification curves, in which one analyst attempts             ular patient’s ESM data?” Analysts differed in their data preprocessing
many different approaches, suggest that some published conclusions                 steps, statistical techniques, and software packages. The nature of
only obtain empirical support in a small subset of specifications (Orben           identified target symptoms likewise varied widely (ranging between
& Przybylski, 2019; Simonsohn, Simmons, & Nelson, 2020; Smerdon,                   0 and 16 targets), and no two teams made similar recommendations
Hu, McLennan, von Hippel, & Albrecht, 2020; Steegen, Tuerlinckx,                   regarding symptoms to target for treatment.
Gelman, & Vanpaemel, 2016). Underscoring the pitfalls when published                   The analysis-contingent results revealed via crowdsourcing repre-
analyses of complex datasets focus on a single primary specification, two          sent a more fundamental challenge for scholarship across disciplines
papers were recently published in the same surgical journal, analyzing             than p-hacking (selecting an analytic approach to achieve statistical
the same large dataset and drawing opposite recommendations                        significance; Banks, Rogelberg, Woznyj, Landis, & Rupp, 2016; Bedeian,
regarding Laparoscopic appendectomy techniques (Childers & Maggard-                Taylor, & Miller, 2010; O’Boyle et al., 2017; O’Boyle et al., 2019;
Gibbons, 2020).                                                                    Simmons et al., 2011) and peeking at the data and then testing for what
    In the crowdsourced approach to data analysis, numerous scientists             look like significant relationships (Bosco, Aguinis, Field, Pierce, &
independently analyze the same dataset to test the same hypothesis                 Dalton, 2016; Gelman & Loken, 2014). The latter two threats to validity
(Silberzahn & Uhlmann, 2015). If similar results are obtained by many              can be addressed by pre-registering the analytic strategy (Aguinis,
analysts, scientists can speak with one voice on an issue. Alternatively,          Banks, Rogelberg, Cascio, in press; Banks et al., 2016, 2019; Van ’t Veer
the estimated effect may be highly contingent on analysis strategies. If           & Giner-Sorolla, 2016; Wagenmakers, Wetzels, Borsboom, van der
so, then subjectivity in applying statistical decisions and ambiguity in           Maas, & Kievit, 2012), or conducting a blinded analysis in which vari-
scientific results can be made transparent. The first crowdsourcing data           ables are temporarily changed (MacCoun & Perlmutter, 2015). In the
analysis initiative examined potential racial bias in organizational set-          latter approach variable labels might be switched (e.g., the Conscious-
tings, specifically whether soccer referees give more red cards to dark-           ness personality variable really refers to Agreeableness scores), or var-
skin toned players than to light-skin toned players (Silberzahn et al.,            iable scores could be recoded (e.g., political conservatism is reverse
2018). The project coordinators collected a dataset with 146,028                   coded such that high scores mean liberalism not conservatism). The key
referee-player dyads from four major soccer leagues and recruited 29               is that the reader does not know whether the observed relations among
teams of analysts to test the hypothesis using whatever approach they              variables are consistent with her theoretical hypothesis or not. Under
felt was most appropriate. The outcome was striking: although                      these circumstances, the researcher cannot consciously or unconsciously
approximately two-thirds of the teams obtained a significant effect in             choose an analytic approach that produces statistically significant re-
the expected direction, effect size estimates ranged from a nonsignifi-            sults in the hoped-for direction. In contrast, analysis-contingent results
cant tendency for light-skin toned players to receive more red cards to a          will still occur without perverse publication incentives because analysts,
strong tendency for dark-skin toned players to receive more red cards              even if they act transparently and in good faith, are likely to use
(0.89 to 2.93 in odds ratio units). Effect size estimates were similarly           divergent approaches to answer the research question. Pre-registration
dispersed for expert analysts, and for analyses independently rated as             or blinding data does not solve this because different investigators will
high in quality, indicating variability in analytic outcomes was not due           preregister different analyses, and choose different approaches even
to a few poorly specified analytic approaches. This suggests that                  with blinded data. Subjective choices and their consequences, often
defensible, but subjective, analytic choices can lead to highly variable           based on prior theoretical assumptions, may be an inextricable aspect of
quantitative effect size estimates. The disturbing implication is that if          the scientific process.
only one team had obtained the dataset and presented their preferred
analysis, the scientific conclusion drawn could have been anything from            2. The present research
major racial disparities in red cards to equal outcomes.
    Subsequent crowd initiatives have likewise revealed divergent                     There is good reason to believe that Silberzahn et al. (2018) in fact

                                                                               4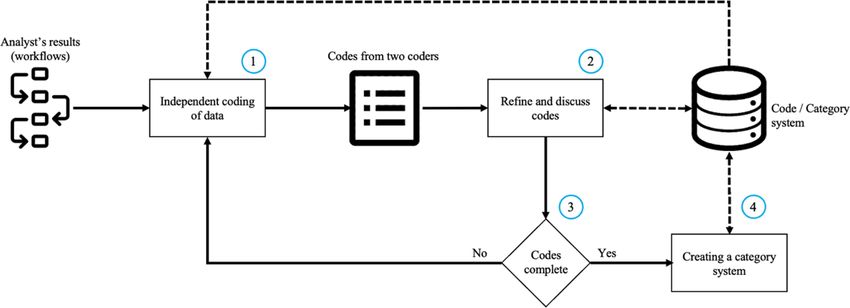
M. Schweinsberg et al.                                                                             Organizational Behavior and Human Decision Processes xxx (xxxx) xxx

underestimated the impact of researcher decisions on the results of a             (Thomas, 2006). DataExplained offers a novel form of scientific trans-
scientific investigation. Operationalizations of key theoretical variables        parency, in that it documents analytic paths being taken and not taken in
were artificially restricted to red card decisions based on skin tone. Yet        real time and provides this output in addition to the traditional research
the conceptual research question (“Are referees biased by a player’s              analytic outputs.
race?”) could have led to analyses involving yellow cards, stoppage                   Both of the research ideas selected for crowdsourced testing were
time, offside calls, membership in specific ethnic groups, or indices of          previously explored in the managerial and psychological literatures on
race and racial groups. Similarly, in Botvinik-Nezer et al.’s (2020)              gender, status, and group dynamics (Brescoll, 2011; Inzlicht & Ben-Zeev,
crowdsourced initiative using fMRI data, variability in results was due to        2000; Schmid Mast, 2001, 2002; Spencer, Logel, & Davies, 2016). Hy-
methodological factors such as regressors, software packages, pre-                pothesis 1 posits that “A woman’s tendency to participate actively in a
processing steps, and demarcation of anatomical regions – not concep-             conversation correlates positively with the number of females in the discus-
tualizations of the research question or theoretical constructs, which            sion.” Hypothesis 2 predicts that “Higher status participants are more
were narrowly defined. The experience sampling dataset used in Bas-               verbose than are lower status participants.” Our project examined whether
tiaansen et al. (2020) was based on a set of standardized questionnaire           independent analysts would arrive at similar analyses and statistical
items, with variability in results attributable to data preprocessing,            results using the same dataset to address these questions.
statistical techniques, and software packages. Although different ana-                In addition to recruiting a crowd of analysts to test Hypothesis 1 and
lysts clustered items differently, they did not employ fundamentally              2, we carried out a complementary multiverse analysis using the Boba
different approaches to conceptualizing and measuring variables like              approach (Liu et al., 2020). A multiverse analysis evaluates all reason-
depression and anxiety. In contrast, in the present initiative crowd-             able combinations between analytic choices (Simonsohn et al., 2020;
sourcing the analysis of a complex dataset on gender and professional             Steegen et al., 2016), which in this case includes and expands beyond
status in group meetings, conceptualization and operationalization of             the paths taken by the crowd analysts. The Boba multiverse allows us to
key variables (e.g., social status) was left unconstrained and up to in-          examine all “reasonable” paths implied by the juxtaposition of crowd
dividual researchers. This approach is arguably closer to the ambiguity           submissions, quantitatively identify which choice points played the
researchers typically confront when approaching a complicated dataset,            largest roles in effect size dispersion across analysts, and create visual-
and may lead to even greater heterogeneity of methods and results than            izations illustrating some of the key steps in this garden of forking paths
seen previously.                                                                  (Liu et al., 2020). To build the Boba multiverse, we took the key choice
    The dataset for this project included over three million words and            points faced by the analysts in the present project, and the major cate-
thousands of pieces of dialogue from an invitation-only online forum for          gories of approaches they used to dealing with them. Analysts had to
scientific debates (see Supplement 1 for a detailed overview and htt              choose the dataset variables they would use to capture the independent
ps://osf.io/u9zs7/ for the dataset). Consider the simple and straight-            and dependent variables (e.g., whether to measure status with academic
forward hypothesis that high status scientists tend to speak more during          citations or job rank), determine their unit of analysis (e.g., commen-
such group meetings. An analyst might choose to operationalize pro-               tators vs. conversations), decide what covariates to include, and which
fessional status using dataset variables such as citation counts, h-index,        type of regression or other measure of association to use. In the Boba
i10-index, job title, rankings of current university, rankings of doctoral        multiverse, we crossed as many choice as possible and was reasonable,
institution, years since PhD, or some combination of the above. She               and examined the implications for the final estimates for both Hypoth-
might also decide to focus on professional status within a field, subfield,       eses 1 and 2.
or among participants in an individual conversation, and use this to
predict how actively the person participated in the meeting. Likewise,            3. Methods
verbosity might be operationalized in different ways, among these
number of words contributed, or number of comments made.                          3.1. Dataset
    The overall project featured a pilot phase to generate and select
hypotheses, and also carry out initial analyses testing these hypotheses              The dataset included 3,856,202 words of text in 7,975 comments
(see Supplements 2 and 3 for detailed reports). To help generate and              from the online academic forum Edge (Lazer et al., 2009). As described
evaluate ideas, a crowd of scientists recruited online were provided with         by Edge’s founders, its purpose is: “To arrive at the edge of the world’s
an overview of the dataset (variables and data structure) and asked to            knowledge, seek out the most complex and sophisticated minds, put
propose research hypotheses that might be tested with it. The crowd               them in a room together, and have them ask each other the questions
then voted on which ideas should be selected for systematic testing               they are asking themselves” (http://edge.org). The group discussions
(Supplement 2). Subsequently, a small number of research teams (a                 spanned almost two decades (1996–2014) and included 728 contribu-
subset of this crowd) used the dataset to test the final set of eleven hy-        tors, 128 of them female. The dataset contained 150 variables related to
potheses. As reported in Supplement 3, the quantitative results of these          the conversation, its contributors, or the textual level of the transcript
pilot analyses proved remarkably dispersed across teams, with little              (Supplement 1). New attributes not provided on the website were
convergence in outcomes for any of the scientific predictions.                    manually collected by browsing CVs, university or personal web-pages,
    The primary study reported in the present manuscript reduced the              Google Scholar pages, and professional networking websites, and added
number of hypotheses from eleven to two characterized by positive                 to the dataset.
evaluations in the selection survey (Supplement 2) and divergent results              An anonymized version of the dataset for the project is available at:
in the pilot analyses (Supplement 3). We focused on two hypotheses                https://osf.io/u9zs7/. The dataset is structured as follows: each row in
from the pilot with especially dispersed outcomes across analysts in              the dataset presents one comment made by one contributor to one
order to pursue our goal of understanding the sources of such variability.        conversation. Each row contained variables for comment id, conversa-
To this end, we asked analysts to use an online platform we developed             tion id, and contributor id. Each comment contributed to only one
called DataExplained to articulate the reasoning underlying each of their         conversation. A comment consisted of at least one character, and most
analytic decisions as they made them (further details on how the plat-            comments consisted of several words and sentences. A new comment
form works are provided in the Methods section, in Feldman, 2018,                 was created when a contributor wrote at least one character that was
Staub, 2017, and in Supplement 9). The stated reasons were then sub-              submitted to the forum. A conversation started when a contributor wrote
jected to a qualitative analysis based on the General Inductive Approach          a new comment that did not respond to a previous comment.

                                                                              5
M. Schweinsberg et al. Organizational Behavior and Human Decision Processes xxx (xxxx) xxx
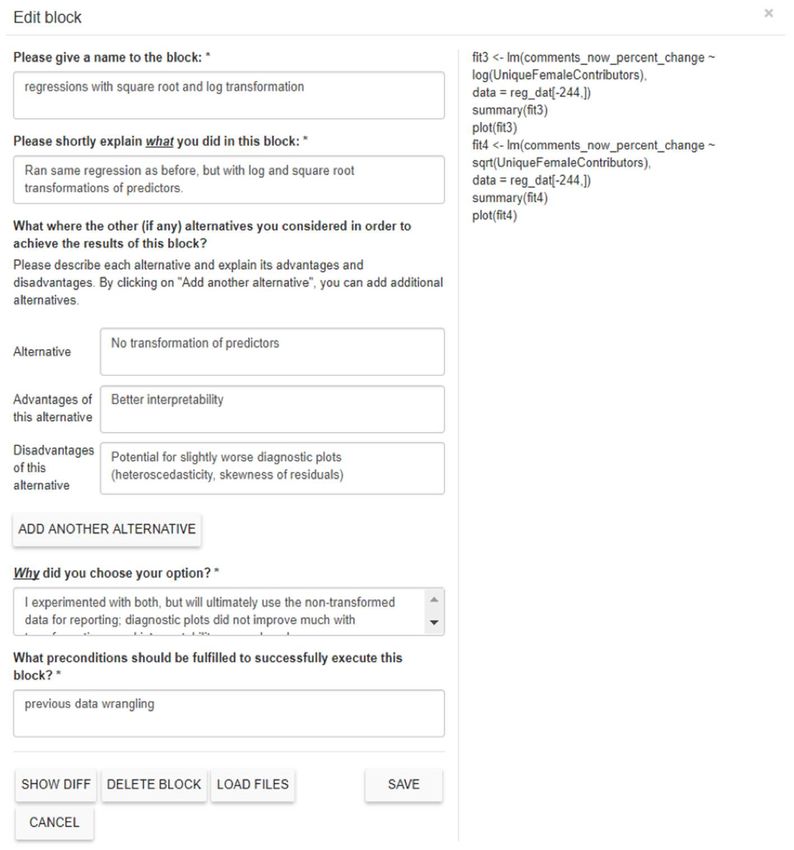
Fig. 1. Example block of logs with the explanations for the code.
Conversations consisted of two or more comments that were posted of 29 analyses, N = 14 for Hypothesis 1 and N = 15 for Hypothesis 2,
sequentially by at least one contributor. A contributor was one person which were conducted by 19 analysts, as the focus of this primary
who posted at least one comment to one or more conversations. Con- project report. The quantitative analyses below focus on these 29 results
tributors often contributed several comments to the same conversation. from 19 analysts.
Prior to receiving the dataset, analysts completed a pre-survey of
their disciplinary background and expertise, and a set of demographic
3.2. Recruitment and initial survey of analysts measures (see Supplement 5 for the complete pre-survey items and htt
ps://osf.io/y9fq4/ for the data). At the time of the project, partici-
Data analysts were recruited via open calls on social media platforms pating analysts were on average 31.2 years of age (SD = 7.2), and
including Twitter, Facebook, forums of psychology interest groups, and included 15 men and 4 women. Seven resided in the United States, five
R (R Core Team, 2018) mailing lists (see Supplement 4 for the project in European countries, and the rest in Australia, Brazil, New Zealand,
advertisements). In total, 49 scholars submitted analyses for this Pakistan, Russia, Singapore, and South Korea. Three were professors,
crowdsourcing initiative, of which 23 scholars completed 37 sufficiently one was a post-doctoral researcher, six were doctoral students, four held
detailed analysis reports (one report per hypothesis) and provided another academic position (e.g., data analyst), and five were not affili-
reproducible code suitable for inclusion. Notably, difficulties in repro- ated with an academic institution. The participating analysts self-
ducing analyses from the reported statistics (Bergh, Sharp, Aguinis, & Li, reported an average of 6.5 years of experience in data analysis (SD =
2017), as well as the original data and code are common (Chang & Li, in 5.5). A substantial minority indicated that they performed data analysis
press; Hardwicke et al., 2018; McCullough, McGeary, & Harrison, 2006; on a daily basis (7 analysts, 37%), while the rest performed data analysis
Stockemer, Koehler, & Lentz, 2018; Stodden, Seiler, & Ma, 2018), even a few times a week (3 analysts, 16%), once a week (4 analysts, 21%),
under the most favorable of circumstances as with pre-registered reports once every two weeks (1 analyst, 5%), or less (4 analysts, 21%).
(Obels, Lakens, Coles, Gottfried, & Green, in press).
Eight of the remaining analyses, from six analysts, were flagged by
sub-teams of research assistants and independent statisticians as con- 3.3. Analyses using the DataExplained platform
taining errors. See below and Supplement 7 and 8 for further details on
the error and reproducibility checks, and the results of the excluded We designed an online platform called DataExplained that supports
analyses. The overall rate of problems identified is not surprising since transparent data analysis reporting in real time. The platform records all
scientific errors are quite common (Bakker & Wicherts, 2011; Bergh executed source code and prompts analysts to comment on their code
et al., 2017; Rohrer et al., in press). The exclusions for errors left a total and analytical thinking steps. DataExplained is based on RStudio Server
6
M. Schweinsberg et al.                                                                                    Organizational Behavior and Human Decision Processes xxx (xxxx) xxx

                                                  Fig. 2. Snippet of workflow modeled by a participating analyst.

(https://www.rstudio.com/products/rstudio-server/), a data analysis                    analyst’s actions within a block. Analysts were able to navigate through
platform that allows users to conduct analyses remotely via a web                      their analysis history, by restoring the state of the RStudio workspace at
browser based on the familiar RStudio interface. In addition to the on-                any given point a block was created. These features helped the analysts
line RStudio environment, we implemented features that enabled us to                   to recall the considerations during their analysis, even if the corre-
track all executed commands along with the analysts’ detailed expla-                   sponding portion of code was no longer in the final script.
nations for every step of the executed analysis.                                          Finally, DataExplained provided analysts with an overview of all
    The procedure was as follows. First, the participants were provided                blocks that they created and asked them to graphically model the
access to the platform, where they executed their data analysis using the              workflow representing the evolution of the analysis. Initially, each an-
RStudio user web-interface. During their analysis, every executed                      alyst was presented with a straight chain of blocks, ordered by their
command (i.e., log) was recorded. Recording all executed commands                      execution. The analysts were then asked to restructure the workflow
(including commands executed but not necessarily found in the final                    such that it better reflected their actual process. For example, iterative
code) is useful, as such logs might reveal information that affected the               cycles of trying out different approaches for a sub-problem could be
analysts’ decisions but are not reflected in the final script. Whenever the            modeled as loops in the workflow. Figure 2 shows an example workflow
participants believed that a series of logs could be described as a self-              visualization from an analyst in the present crowdsourced project. The
explanatory block, or when a certain number of logs was produced,                      orange boxes displayed in Figure 2 allowed analysts to connect the
they were asked to describe their rationales and thoughts about the                    various steps of their analysis. Clicking on an orange box produced an
underlying code. The dataset was available in the environment of                       arrow, which could then be connected to any other of the analysts’ steps.
DataExplained only. Use of this platform essentially involves conducting               For example, an analyst who wanted to indicate that “Step A” led her to
analyses in R with added transparency features.                                        “Step B” would first click on the orange box of “Step A” and then drag the
    We included a number of elements to capture the workflow of ana-                   resulting arrow to “Step B.” A video demonstration of this process is
lysts. In particular, once the analysts reached a certain number of                    available at https://goo.gl/rnpgae, see in particular minute 04:30 for
executed commands, we prompted them to explain the goals and                           how steps are linked.
reasoning underlying the relevant code, as well as alternative ap-
proaches they rejected. As shown in Figure 1, this consisted of a few key
                                                                                       3.4. Post-survey
questions: 1) Please shortly explain what you did in this block?, 2) What
preconditions should be fulfilled to successfully execute this block?, 3) What
                                                                                          After completing their analyses via the DataExplained platform,
were the other (if any) alternatives you considered in order to achieve the
                                                                                       analysts responded to a second survey in which they were asked to
results of this block? (explain the alternative, explain the advantages, explain
                                                                                       report their empirical results and the analytic methods they used, such
the disadvantage), and 4) Why did you choose your option? This allowed us
                                                                                       as transformations, exclusions, statistical techniques, covariates, and
to observe the reasons underlying an analytic decision, the justification
                                                                                       operationalizations (see Supplement 6 for the complete post-survey and
for it, the considered alternatives, the trade-offs evaluated, and the
                                                                                       https://osf.io/u8rmw/ for the data).
deliberation that led to the final implementation.
    To provide a useful unit of analysis, we asked the analysts partici-
pating in our study to split workflows (i.e., the whole sequence of all                3.5. Independent assessment of analysis quality
commands used in the analysis) into semantic blocks (essentially, sub-
sequences of commands). This way, each block was annotated with                           Finally, two teams of research assistants and statisticians carefully
descriptive properties which reflect the rationales and reasoning of the               reviewed each analyst’s approach for errors and ensured they could
                                                                                       independently reproduce the results (see Supplements 7 and 8 and htt

                                                                                   7
M. Schweinsberg et al. Organizational Behavior and Human Decision Processes xxx (xxxx) xxx
Table 1.1
Overview of analytic approaches and results across independent scientists for Hypothesis 1, “A woman’s tendency to participate actively in the conversation correlates
positively with the number of females in the discussion”
Analyst* Statistical Sample Unit of analysis Covariates Operationalization of Operationalization of Effect size
approach size female participation in number of women in
academic discussions discussion
1 logistic 5443 Comments None odds of next contributor to cumulative sum of previous 1.06 odds
regression conversation being a woman female comments in a ratio
conversation
2 linear regression 65 combination of None proxy for number of number of female contributors −1.32
conversations and comments by each female ordered by time of commenting regression
proxy for number of contributor in a conversation (first, second, third female coefficient
contributors contributor, etc)
3 generalized 645 Comments number of comments number of comments by percentage of unique female 0.33
linear mixed in a conversation author in a conversation contributors in a conversation regression
effects regression (females only) coefficient
(Poisson)1
4 Pearson 7975 Comments None number of comments made number of unique female 0.87
correlation by all female contributors in contributors in a conversation correlation
a conversation coefficient
5 Pearson 270 Comments None number of comments made percentage of comments made 0.56
correlation by all female contributors in by females in a conversation correlation
a conversation coefficient
6 linear regression 462 combination of None difference between female number of unique female −0.59
conversations and comments in current contributors in a conversation regression
contributors conversation and previous coefficient
conversation
7 logistic 4502 Comments academic discipline whether the current cumulative sum of female 0.15
regression contributor is a woman comments that precede a regression
specific comment coefficient
9 linear regression 634 Comments None number of words in a female cumulative proportion of 23.47
comment female comments in each regression
conversation coefficient
11 generalized 463 combination of None number of comments by number of unique female −0.02
linear mixed conversations and author in a conversation contributors in a conversation regression
effects regression contributors (females only) coefficient
(Poisson)2
12 generalized 96 Conversations 1) debate size 2) number of comments made percentage of unique female 27.3
linear regression conversation written by all female contributors in contributors in a conversation incidence
(Poisson) / transcribed a conversation rate ratio
13 linear regression 504 Conversations total number of percentage of comments number of unique female 0.26
unique contributors made by women in a contributors in a conversation regression
in a conversation conversation coefficient
14 linear regression 36 Conversations None percentage of comments number of unique female −0.001
made by women in a contributors in a conversation regression
conversation coefficient
17 Kendall 96 Conversations None proxy for average number of percentage of unique female 0.37
correlation comments made by each contributors in a conversation correlation
woman in a conversation coefficient
19 linear regression 193 Comments 1) number of prior number of comments by number of unique female −0.32
comments, 2) author in a conversation contributors in a conversation regression
contributor has PhD/ (females only) coefficient
not, 3) total citations
Notes. This table includes analyses not flagged as having clear errors by independent reviewers.
This table includes the original effect sizes reported by the analysts, which are not directly comparable to one another.
* In the online article, the column includes hyperlinks for each analyst’s error checks and raw code
1
Random intercept for conversation ID; random intercept and slope for contributor ID
2
Random intercept for conversation ID
ps://osf.io/n5q3c/). These error-checks involved a two-step process. potential errors, and if they found any discussed this with each other to
First, three research assistants from The European School of Manage- clarify whether they agreed on an analytical choice being an error or
ment and Technology (ESMT) conducted an initial review and error not. If need be, they also consulted a third ESMT research assistant and/
check. These three RAs were graduate students in computational or the first author. The RAs created an error check document for each
neuroscience, public policy, and economics and were selected for their analysis which contained the entire code, a summary of the code, key
strong data analysis backgrounds. They had advanced knowledge of information about each analysis, and an indication whether they sus-
statistics and econometrics and were skilled in R, Python, Matlab, and pected any serious errors. Second, a team of statistical experts based at
Stata. Two of the ESMT research assistants coded each analysis for the Tilburg University Department of Methodology (a graduate student,
8M. Schweinsberg et al. Organizational Behavior and Human Decision Processes xxx (xxxx) xxx
Table 1.2
Overview of analytic approaches and results across independent scientists for Hypothesis 2, “Higher status participants are more verbose than lower status
participants”
Analyst* Statistical Sample Unit of analysis Covariates Operationalization of Operationalization of status Effect size
approach size verbosity
1 linear 4262 Comments 1) contributor gender 2) number of characters in a academic job rank (postdoc, −0.16
regression contributor in academia or comment professor, etc…) regression
not coefficient
3 linear mixed 1497 Comments 1) academic job rank 2) number of words in a total number of citations 0.04
effects university ranking comment regression
regression1 coefficient
5 linear 306 Comments None number of conversations in job title 3.97
regression which a contributor has regression
participated in a specific coefficient
year
6 linear 297 Contributors None average number of words in academic job rank −64.38
regression a conversation regression
coefficient
7 linear 1537 Comments 1) academic job rank 2) number of characters in a total number of citations −0.22
regression discipline comment regression
coefficient
9 linear 721 Contributors None average number of words in combination of: 1) whether a 69.70
regression all comments contributor has a PhD or not and 2) regression
rank of their academic workplace coefficient
10 linear mixed 7718 Comments 1) contributor gender 2) number of words in a combination of: whether a 0.12
effects contributor role (author or comment contributor has a PhD or not, regression
regression2 commentator) 3) type of whether a contributor is in coefficient
exchange (annual questions academia or not, the rank of their
or conversations) PhD institution and academic
workplace, total number of
citations, academic job rank, and
the number of conversations in
which a contributor has
participated
11 linear mixed 857 Comments 1) contributor gender 2) number of words in h-index 0.09
effects number of citations 3) sentences regression
regression3 academic job rank 4) coefficient
number of years since
received PhD
12 linear 1007 combination of 1) contributor gender 2) average number of words in academic job rank 54.39
regression contributors and discipline all comments regression
status-related coefficient
variables
14 linear mixed 518 Comments 1) total number of citations number of characters in a rank of contributor’s academic 0.06
effects 2) university ranking comment workplace where higher values regression
regression2 indicate lower rank coefficient
17 Kendall 4263 Comments None number of words in a academic job rank −0.05
correlation comment correlation
coefficient
18 linear mixed 573 combination of collection of variables that proxy for the number of proxy for the combination of: 1) 0.13
effects contributors and include gender, whether characters, and the number academic job rank and 2) the year regression
regression2 conversations the person is the first to of times a person when PhD was obtained coefficient
contribute, conversation contributes to the
year, conversation type, conversation
and interaction terms
between them
21 factorial 355 Contributors None average number of words in academic job rank 0.02 eta
ANOVA, Eta- all comments squared
squared
value
22 Spearman 728 Contributors None number of comments in a academic job rank −0.04
correlation year correlation
coefficient
23 linear 386 combination of contributor gender average number of academic job rank −239.01
regression contributors and characters in all comments regression
academic job coefficient
rank
9M. Schweinsberg et al. Organizational Behavior and Human Decision Processes xxx (xxxx) xxx
Notes. This table includes analyses not flagged as having clear errors by independent reviewers.
This table includes the original effect sizes reported by the analysts, which are not directly comparable to one another.
* In the online article, the column includes hyperlinks for each analyst’s error checks and raw code
1
Random intercept for contributor ID; random intercept and slope for conversation ID
2
Random intercepts for conversation ID and contributor ID
3
Random intercept for whether the conversation was written / transcribed
postdoctoral researcher, and professor) reviewed these error checks and in the fields of management and psychology (Aguinis et al., 2010). Thus,
individual analyses, again examining whether the code by each analyst Table 2 does give us a sense of what might have been published had a
contained any serious errors. The error check documents are publicly single analyst conducted the research alone. In other words, had a
posted at https://osf.io/n5q3c/. In the end the ESMT and Tilburg sub- crowdsourced approach not been employed, there would have been a
teams converged on a subset of analyses that were deemed as contain- roughly 1 in 4 chance of a research report of statistically significant
ing errors. As noted earlier, only error-free and fully reproducible ana- support for Hypothesis 2, about a 1 in 4 chance of a report of the
lyses (N = 14 for Hypothesis 1 and N = 15 for Hypothesis 2) are included opposite pattern, and a 2 in 4 chance of null results. Further, in all of
in this primary report of the quantitative results. The results with these scenarios, the role of subjective researcher decisions in the pub-
excluded analyses are provided in Supplement 7. lished outcome would have remained unknown rather than made
transparent.
4. Results
4.2. Dispersion in standardized scores
4.1. Variability in analytic approaches and conclusions
Given the diversity in analytical choices and approaches, it is not
We set out to identify the extent of heterogeneity in researchers’ straightforward to compare or aggregate all the results. Tables 1.1 and
choices of analytic methods, and the impact of this heterogeneity on the 1.2 include the effect size estimates reported by the individual analysts,
conclusions drawn about research questions regarding gender and pro- which are not directly comparable to one another. We encountered two
fessional status in group meetings. We found that the participating an- challenges when attempting to compute standardized effect sizes on the
alysts employed a wide array of statistical techniques, covariates, and same scale for all independent analyses of the same hypothesis. First,
operationalizations of key theoretical variables such as professional most analyses were non-standard, so we often lacked a well-known and
status and verbosity (see https://osf.io/n5q3c/ for the code for each commonly used effect size measure. Second, even after applying or
individual analyst). As summarized in Tables 1.1–1.3, different analysts developing specialized effect size measures, there is no means by which
operationalized variables in various ways: for example, Analysts 3, 10, to convert all these different effect sizes to the same effect size metric.
and 17 operationalized verbosity as the number of words contributed in We bypassed these problems by computing the z-score for each statis-
a comment, Analyst 5 operationalized verbosity as the number of con- tical result’s p-value, which is also done before analyzing data in
versations participated in, and Analysts 1, 7, and 14 operationalized Stouffer’s method in meta-analysis and z-curve (Brunner & Schimmack,
verbosity as the number of characters in comments, among other ap- 2018). This method transforms individual p-values of test statistics to z-
proaches. Status was assessed using academic job rank, citation count, h- scores, assuming that the sampling distribution of the test statistic is
index, and university rank, as well as via a combination of indicators. approximately normally distributed, resulting in random variables with
Additionally, the unit of analysis varied. For example, Analyst 9 in H1 a variance of 1.
focused their analyses on the level of comments by counting the number It is crucial to realize that the analysts’ z-statistics are a function of
of words in a comment made by a female contributor, whereas Analyst the effect size, the number of independent observations in the analysis,
12 focused their analyses on the level of conversations by counting the as well as the selected statistical technique and their statistical proper-
number of comments made by all female contributors in a conversation. ties (e.g., statistical power, in case of a true nonzero effect). As the three
Sample size varied greatly even for analyses on the same unit of analysis. aforementioned factors are all affected by the analysts’ selected analysis,
Strikingly, no two individual analysts employed precisely the same and all analysts use the same dataset, differences in z-scores still reflect
specification for either Hypothesis 1 or 2 (see Botvinik-Nezer et al., differences in the consequences of analysts’ choices.
2020, and Carp, 2012a; 2012b, for similar findings in neuroimaging Regarding the normality assumption of the z-scores, note that most
studies and Bastiaansen et al., 2020, for a conceptual replication with parameters in models correspond to linear combinations of the data. For
event sampling data from a clinical patient). instance, a mean or probability (sum of values divided by N), variance
The crowd of independent researchers further obtained widely (sum of squared deviations divided by N-1), a regression coefficient
varying empirical results regarding Hypothesis 1 and 2, using widely (sum of (X-Xmean)*(Y-Ymean) divided by a constant equal to (X-
varying statistical techniques, and reported statistically significant re- Xmean)^2). If the sum is over independent observations, then it follows
sults in both directions for each hypothesis. Table 2 summarizes the from the central limit theorem that all these sums are increasingly better
number of analysts who obtained statistically significant support for the approximated by the normal distribution for larger N. More generally,
hypothesis, directional but non-significant support, directional results many test statistics are well approximated by a normal distribution for
contrary to the hypothesis, and statistically significant results contrary larger N. Except for the z-statistics, think of the t-statistic (same shape
to the initial prediction. As seen in the table, while 64.3% of analysts but a bit larger variance), the Chi2-statistic (similar shape but skewed to
reported statistically significant support for Hypothesis 1, 21.4% of the right), and for the F-statistic but only when df1 = 1 (this is the t) or
analysts reported a statistically significant effect in the opposite direc- when df1 has a ‘large’ value. Tables 1.1 and 1.2 contain detailed in-
tion (i.e., finding that a woman is less likely to contribute to the con- formation about the number of observations used in the analyses. For
versation when there are other women in the meeting). At the same example, Analyst 1 for H1 drew on a sample of 5,443 observations. The
time, while 28.6% of analysts reported significant support for Hypoth- sample sizes for all other analyses are reported in these tables. As most
esis 2, 21.4% reported a significant effect in the contrary direction (i.e., statistics are well approximated by a normal distribution for the number
finding that high status participants are less verbose that lower status of observations considered by the analysts, we believe that the normal
participants). approximation works rather well in this application.
Although we do not defend the use of p-value cutoffs for deciding The z-scores of individual results were obtained using different
what is true and what is not, a reliance on such thresholds by both au- methods. In some cases the z-scores could be directly retrieved from the
thors and gatekeepers (e.g., editors and reviewers) is extremely common output of the analyst, but in the majority of the cases z-scores were
10You can also read