Review Volume 30 Number 1 June 2021
←
→
Page content transcription
If your browser does not render page correctly, please read the page content below
Review
Volume 30 • Number 1
June 2021

Considerable efforts have been made to assure the accuracy and reliability of the
information contained in this publication. However, neither Concawe nor any
company participating in Concawe can accept liability for any loss, damage or in-
jury whatsoever resulting from the use of this information. The articles do not
necessarily represent the views of any company participating in Concawe.

Reproduction permitted with due acknowledgement.

Cover photograph reproduced courtesy of iStock/D-Keine.
Foreword

The European Green Deal tackles all aspects of our industry, and it is no surprise that all of the articles in
this edition of the Concawe Review are related to it.

In light of the zero pollution action plan and the proposed revision of the air quality standards, the first
article evaluates the feasibility and the level of success of current and projected compliance concerning
ozone, a secondary pollutant formed and removed via complex chemical reactions. In the second article,
the author analyses how the lockdown measures implemented in 2020 to counter the spread of the
SARS-CoV-2 virus have impacted air quality in selected European cities.

The European Commission is currently finalising its plan to achieve a 55% reduction in greenhouse gas
(GHG) emissions by 2030. In this context, the third article summarises a Concawe Report which provides
an outlook for the transport sector, modelling the evolution of different powertrains and the availability
of different alternative fuels. With the growing and rapid electrification of passenger cars, some
uncertainty has arisen as to whether the capacity for battery production will be able to meet the demand.
The fourth article explores the optimal passenger car sales composition (internal combustion engines,
hybrid electric vehicles, plug-in hybrid electric vehicles and battery electric vehicles) for minimising well-
to-wheels GHG emissions as a function of battery production capacity available in 2030.

The two last articles relate to the Green Deal toxic-free environment and the REACH legislation. The
correct evaluation of the persistence of our products in the environment is key to correctly evaluating
their potential to do harm, and is part of the evaluation under REACH. The fifth article refers to a study,
and a paper published in a peer-reviewed scientific journal, showing that temperature correction for
historical biodegradation simulation tests should be hydrocarbon-specific, rather than follow a generic
default correction as currently addressed in the ECHA guidance. The REACH regulation also promotes
alternative methods to animal testing for the hazard assessment of substances. The final article
summarises the achievements reached under Concawe’s important Cat-App project, which aims to
reduce the amount of animal testing required for hazard evaluation of our substances thanks to the
identification of biological similarity through innovative in-vitro testing, high-throughput genomics and
integrative data analyses.

I am confident that these articles will generate as big an interest to the reader as the passion of the
scientists who have written them.

Jean-Marc Sohier
Concawe Director

Concawe Review Volume 30 • Number 1 • June 2021                                                                  1
Contents

               Understanding the process of setting air quality limit values                                                                 6
               and the associated compliance challenge — the ozone study

Towards the adoption of the 2021 zero pollution action plan for air, water and soil, that has been announced by the European Commission
(EC) as part of the European Green Deal, the EC is notably proposing to revise air quality standards to align them more closely with the World
Health Organization (WHO) recommendations. This article focuses on ozone (O3), for which the EU air quality limit values (AQLVs) have not
been changed since the late 1990s, and assesses how current and projected compliance trends will change under the current EU AQLV as
well as under lower limit values, and under different emission reduction scenarios.
    The study highlights that any revision of the current AQLVs for O3 should follow a two-step process where quantifying the environmental
and human health risks associated with the concentrations of pollutants is as significant as assessing how these risks should be managed
(i.e. in terms of technical feasibility, cost-effectiveness, control measures and level of success in improving compliance).

The major findings of this study are as follows:
l   O3 compliance with the EU AQLV (120 μg/m3, not to be exceeded on more than 25 days) is currently fully achieved only in parts of Europe,
    with non-compliance remaining an issue in several areas in southern and eastern European countries.
l   The vast majority of European countries are currently not able to meet the Ambient Air Quality (AAQ) Directive long-term O3 objective of
    120 μg/m3 without any allowance for exceedances. In addition, reducing the threshold to the current WHO guideline value of 100 μg/m3
    results in a substantial EU-wide increase in non-compliance, with 94% of all monitoring stations in Europe being unable to achieve
    compliance in 2017 (i.e. the latest year for which O3 data were available at the time the study was undertaken).
l   Under current legislation, O3 compliance will continue to improve from 2025 onwards. However, full compliance with the existing EU AQLVs
    will not necessarily be achieved in all EU countries.
l   Further emission reduction measures, beyond the current legislation, that will mainly target NOx and VOC emissions, will further improve
    O3 compliance with the current EU AQLV. However, full compliance will still remain unachievable in some countries (e.g. Italy, Spain).
l   A move to a threshold of 100 μg/m3 (the current WHO air quality guideline value) or a move towards the AAQ Directive long-term O3
    objective (i.e. zero allowable exceedances at the current threshold) will essentially create an EU-wide compliance challenge for O3. Under
    such a revision of the current EU AQLV, O3 compliance will be far from technically achievable, regardless of the measures applied to
    control emissions.

Enquiries: athanasios.megaritis@concawe.eu

2                                                                                           Concawe Review Volume 30 • Number 1 • June 2021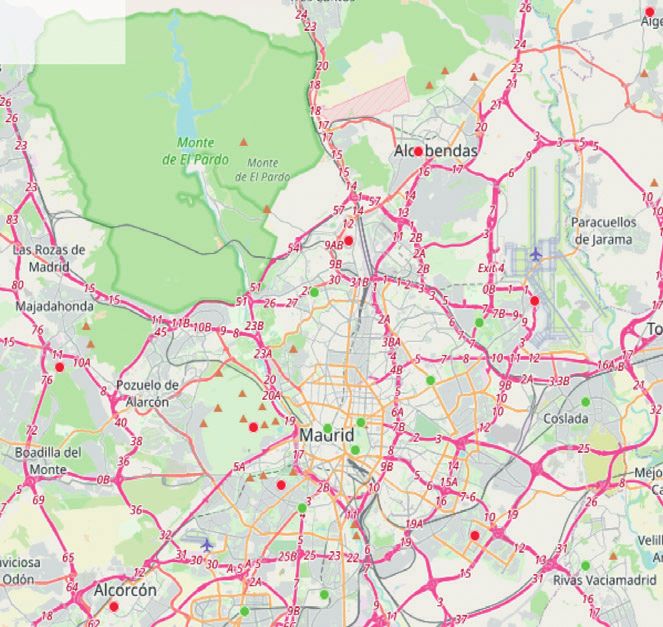
How Covid-19 lockdown affected air pollution in Europe — a multi-city analysis                                             21

In response to the spread of the novel coronavirus SARS-CoV-2 in Europe since the beginning of 2020, the implementation of restrictive
measures across countries to mitigate the rate of infection has led to a significant reduction in economic activity. This, in turn, has had a
consequent impact on air quality.
    This article uses up-to-date measured data from monitoring stations in selected European cities to quantify how the lockdown measures
have impacted the concentrations of NO2, PM and O3. The major findings of the study indicate the following:
l   NO2 concentrations in 2020 appear to be at lower levels compared to those in 2019.
l   NO2 concentrations showed a significant drop during the first period of the national lockdown measures, in some cases falling by more
    than 50%. This could be attributed mainly to the lower NOx emissions associated with road transport in the same period. During the
    subsequent deconfinement period, NO2 levels were seen to increase. The second period of restrictive measures that then followed is not
    proven to have been as effective in reducing NO2 concentrations as when similar measures were taken during the first lockdown period.
l   The impact of the lockdown measures on PM concentrations was less pronounced than for NO2 and did not show a consistent downward
    response. A variable response of PM levels was seen during all stages of the Covid-19 pandemic and the lockdown measures at national
    level. Compared with 2019 levels, PM concentrations in 2020 were, on average, found to be somewhat lower, although significant temporal
    variations were observed.
l   The implementation of lockdown measures has had a different effect on O3 concentrations, with the majority of cities analysed
    experiencing higher O3 concentrations in 2020 compared with 2019 levels, especially during the period when the first national lockdown
    measures were in place.

Enquiries: athanasios.megaritis@concawe.eu

               Concawe’s transport and fuel outlook towards EU 2030 climate targets                                                       33
               (baseline and sensitivity analysis)

This article summarises the findings of a Concawe report which provides an outlook for the European transport sector by modelling elements
such as the evolution of the different powertrains and the availability of different alternative fuels over a certain time frame. The outlook
focuses on the 2018–2030 period and, through the definition of a baseline, its main objective is to inform stakeholders on current market and
industry trends and 2030 target compliance, identifying key enablers for, and potential barriers to, boosting the penetration of renewable
energy as well as improvements in the GHG intensity of the European transport sector.

Enquiries: marta.yugo@concawe.eu

Concawe Review Volume 30 • Number 1 • June 2021                                                                                            3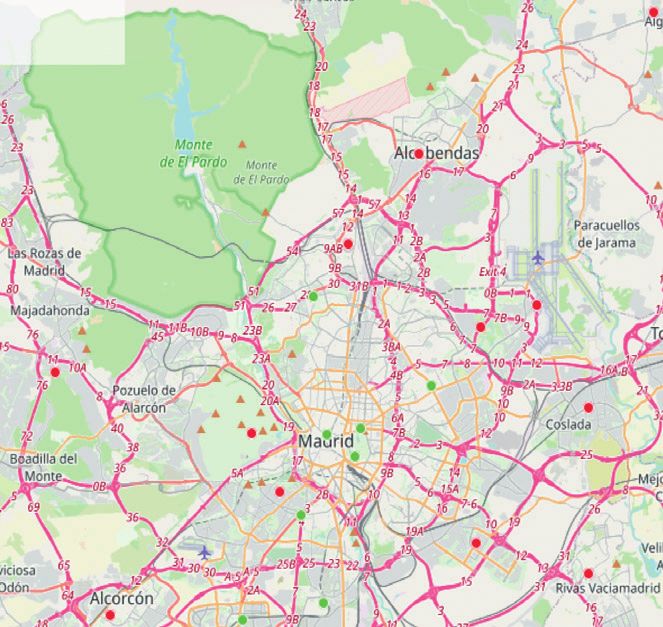
Contents (continued)

               The optimal vehicle electrification level in a battery-constrained future                                                         44

Recent forecasts for the rapid electrification of the road transport sector towards 2030 have given rise to considerable uncertainty associated
with battery production capacity and whether it will be able to meet the growing demand for batteries in Europe. In view of this uncertainty
and the potential implications for GHG emissions, this article explores the optimal passenger car sales composition for minimising well-to-
wheels (WTW) GHG emissions as a function of battery production capacity available for the electrification of the new vehicle sales mix in 2030.
    The options considered for the different levels of electrification of passenger cars include vehicles powered solely by internal combustion
engines (ICEVs), hybrid electric vehicles (HEVs), plug-in hybrid electric vehicles (PHEVs) and battery electric vehicles (BEVs). Within that context,
a wide range of possible cases are explored based on a sensitivity analysis of key parameters including the utility factor of PHEVs (i.e. their
share of electric driving), the carbon intensity of the electricity supply, the energy consumption of vehicles, and the use of low-carbon fuels.
The results present a break-even analysis of different passenger car sales compositions in terms of the minimum achievable GHG emissions.
    The findings indicate that, under a low/medium battery production capacity scenario (up to about 0.30 TWh/year) and moderate/high
levels of utility factor (higher than 45%), a combination of ‘HEV+PHEV’ in new passenger car sales is deemed to be the most effective option
to reduce GHG emissions. In the battery cap scenarios of up to 0.55 TWh/year in 2030, the PHEV with a moderate/high utility factor would be
a key component of the optimal sales mix, with its share reaching 94% of new sales at a battery supply capacity of 0.30–0.35 TWh/year. In the
scenarios considered, increasing the utility factor of PHEVs is the most immediate and accessible way to decrease GHG emissions in the
short term. Increasing the contribution of low-carbon fuels in the fuel mix, and a decrease in the carbon intensity of the electricity mix will offer
significant additional WTW savings, which are expected to be more significant in the period 2030+.

Enquiries: ehsan.shafiei@concawe.eu

               Regulator-suggested ‘temperature correction’ of biodegradation rates leads to                                                     60
               overestimation of persistence for hydrocarbon substances

The potential for a chemical to do harm is related to its persistence (P) in an environmental system. The persistence of chemicals is an
important part of substance evaluation under REACH. It is assessed primarily using standardised OECD biodegradation simulation testing
methods, which were historically performed at around 20°C. In 2017, ECHA altered its guidance to require biodegradation simulation data at
12°C, which is considered to be the average temperature in the EU. This means either performing the biodegradation simulation testing at
12°C or applying a mathematical correction, termed the Arrhenius equation, to adjust the biodegradation rates derived at other temperatures.
However, there are serious drawbacks associated with this practice. First, the REACH P criteria were developed using degradation studies
performed at room temperature on chemicals known to be persistent. Second, in a 2020 publication, Concawe showed that the use of ECHA’s
default ‘temperature correction’ would lead to an overestimation of persistence for petroleum hydrocarbons. The repercussions of
overestimating persistence can be severe, including authorisation and/or restriction of the chemical in Europe. Concawe therefore encourages
a more accurate study and substance-specific approach for temperature adjustment for petroleum hydrocarbons.

Enquiries: delina.lyon@concawe.eu

4                                                                                              Concawe Review Volume 30 • Number 1 • June 2021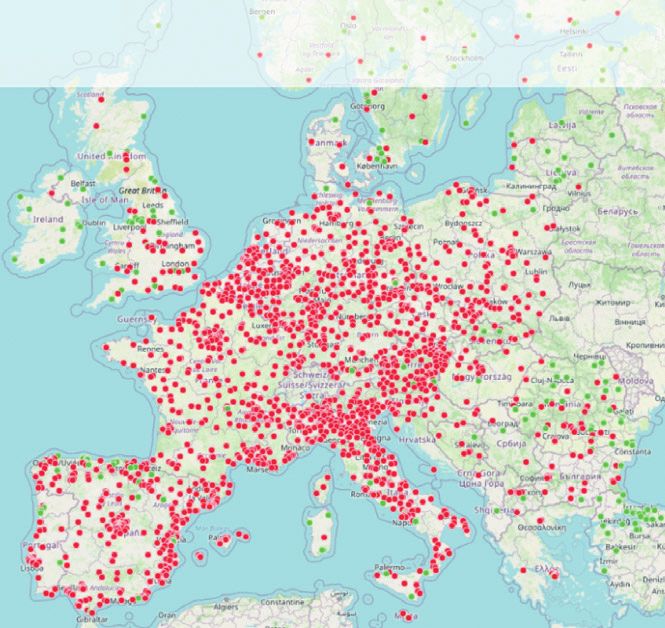
Cat-App: learnings from a multi-year research programme on alternatives to animal testing                                         66

One of the aims of the REACH regulation is to promote alternative methods for the hazard assessment of substances in order to reduce the
number of tests on animals. However, in practice it has proven to be challenging to obtain regulatory acceptance for the application of such
alternatives alongside existing toxicology data to minimise or replace the standard required animal tests. At the same time, the alternative
options currently proposed under REACH are not practically applicable to petroleum substances. Concawe’s Cat-App project aims to address
these challenges by developing a framework based on chemical-biological read-across, which integrates chemical compositional data with
innovations in (i) in-vitro testing, (ii) high-throughput genomics and (iii) integrative data analyses and visualisation into a transparent workflow.
   The practical work of the Cat-App project was completed in 2018, resulting in almost 3.5 million data points on 141 substances from 15
cell models. A final report was published in 2020, along with a peer reviewed publication in ALTEX (Vol. 38, No. 1, 2021), showing that a biological
component can be added to the required similarity assessment which facilitates grouping substances for a more holistic rather than substance-
driven assessment. In addition, it was shown that trends can be observed across the chemical space of these substances in line with the
hypothesised dose [of the specific chemical constituents]-response [in terms of bioactivity] relationship, which can be used in combination
with other available data to build read-across hypotheses and assessments.
   Overall, this is expected to help address practical challenges with the regulatory assessment of UVCB substances, which may help to avoid
unnecessary animal testing in the short term. In addition, if these data find regulatory acceptance for this purpose they can be further built
upon and will ultimately help to develop alternatives to animal testing in the longer term, eventually putting the opportunities provided by
REACH to innovate the conservative toxicology testing paradigm into practice.

Enquiries: hans.ketelslegers@concawe.eu

Abbreviations and terms                                                                                                                          83

Concawe reports and other publications                                                                                                           85

Concawe Review Volume 30 • Number 1 • June 2021                                                                                                    5
Understanding the process of setting
          air quality limit values and the associated
          compliance challenge—the ozone study

                                     Introduction
The European Commission is
proposing to revise air quality      The European Commission (EC) recently completed the fitness check of the EU Ambient Air Quality
standards to align them more         (AAQ) Directives (Directives 2008/50/EC[1] and 2004/107/EC[2]). The EC drew on the experience from
closely with the World Health        all Member States and various other stakeholders, focusing on the period from 2008 to 2018 (i.e. the
Organization (WHO) guidelines.       period in which both Directives were in force) and finalised the process by publishing its Staff Working
This article focuses on O3, and
                                     Document in November 2019.[3] The EC has concluded that, overall, the AAQ Directives have been
assesses how current and
projected compliance trends will     broadly fit for purpose; however, the existing air quality framework remains subject to further
change under the current EU          improvements that would help in achieving the overarching ambition to fully meet all air quality limit values
AQLV, as well as under lower         (AQLVs) for all pollutants and throughout the European Union.
limit values and under different
emission reduction scenarios. It
                                     Specifically, the fitness check identified several lessons learnt that should be considered in any follow-up
also highlights the need to follow
a two-step process including         decisions made by the EC. Among others, these include the following:
both risk assessment and risk        a) The EU AQLVs have been instrumental in driving a downward trend in exceedances, and in exposure
management when considering              of the population to exceedances. However, the current AQLVs are not as ambitious as established
further close alignment of the
                                         scientific advice suggests for several pollutants; the World Health Organization (WHO) is currently
current EU AQLVs for O3 with
the WHO guidelines.                      reviewing its air quality guidelines, and the EC is closely following this process.
                                     b) AQLVs have been more effective in facilitating downward trends than other types of air quality
                                         standards, such as target values.

                                     These important considerations have been taken into account by the EC in its Communication of the
                                     European Green Deal and its plan to adopt, in 2021, a zero pollution action plan for air, water and soil.[4]
                                     The EC has announced that it will draw on the lessons learnt from the fitness check of the AAQ Directives,
                                     and will notably propose to revise air quality standards to align them more closely with the WHO’s
                                     recommendations,1 [5, 6] which are lower than the limit values set in the AAQ Directives for the majority
                                     of regulated pollutants.

                                     Ozone (O3) is one of the 13 air pollutants for which AQLVs have been set under the current AAQ
                                     Directives. O3 is a secondary pollutant which is not directly emitted into the atmosphere, but is formed
                                     (and removed) via complex chemical reactions that take place in the presence of sunlight and gas
                                     precursors (mainly nitrogen oxides (NOx) and volatile organic compounds (VOCs)) emitted by both
                                     anthropogenic and biogenic sources. The EU AQLV for O3 was set under Directive 2002/3/EC[7] — the
                                     ‘Third Daughter Directive’—which is focused entirely on O3. This introduced a ‘target value’ of 120 μg/m3
                                     for maximum daily 8-hour O3 mean concentrations,2 not to be exceeded on more than 25 days per
                                     calendar year averaged over three years, that should be met as of 1 January 2010.

                                     1   In the preface of the WHO Air Quality Guidelines for Europe, it states that ‘It should be emphasised, however, that the
                                         guidelines are health-based or based on environmental effects, and are not standards per se. In setting legally binding
                                         standards, considerations such as prevailing exposure levels, technical feasibility, source control measures, abatement
                                         strategies, and social, economic and cultural conditions should be taken into account.’ As risk management is not
                                         considered in the WHO guidelines values, these are lower than the limits set in the AAQ Directives for the majority of
                                         regulated pollutants. https://www.euro.who.int/__data/assets/pdf_file/0005/74732/E71922.pdf
                                     2   The daily maximum 8-hour mean is the maximum of the valid 8-hour running means for that day. Calculation of all the
                                         8-hour running means for a given day is a prerequisite.

6                                                                                                    Concawe Review Volume 30 • Number 1 • June 2021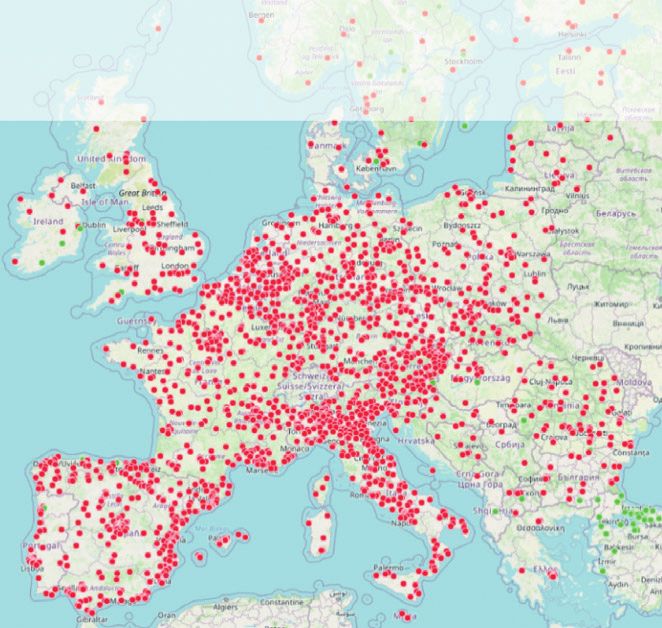
Understanding the process of setting
                                             air quality limit values and the associated
                                            compliance challenge—the ozone study

In addition, a long-term objective was introduced for O3 which refers to the same ‘target value’ of
120 μg/m3 but without any allowance for exceedance days within a calendar year. The AQLVs set in this
Directive reflected the risk assessment undertaken by the WHO in the late 1990s, and no changes were
made when the Third Daughter Directive was replaced with Directive 2008/50/EC.

Since the establishment of the EU AQLV for O3, significant further research has been undertaken on the
health impacts of O3. This was already partly reflected in the 2005 revision of the WHO’s Air Quality
Guidelines[5] in which the WHO reduced the O3 guide value (i.e. the maximum daily 8-hour O3 mean
concentration) from 120 μg/m3 to 100 μg/m3. This represents a significant toughening of the guide value,
which might be lowered further based on the outcome of the ongoing review of the WHO’s air quality
guidelines. It is therefore highly likely that, in the expected revision of the AAQ Directives, the current
‘target values’ for O3 will be revised downwards and will be made binding (and get the same status as, for
example, NO2 and PM10).

However, any decision for further close alignment of the current EU AQLVs for O3 with the WHO air quality
guidelines should not be made by only taking into account the environmental and human health risks
presented by concentrations of air pollutants (risk assessment step). According to the WHO instructions,
this should be a two-step process where the risk assessment step will be followed by an assessment of
how these risks may be managed (risk management step). In practical terms, the risk management step
should assess how emissions of pollutants and their precursors may be controlled, how emission limits
are technically achievable, the associated cost, and the level of success in improving air quality.

Building on the important insights derived from an earlier Concawe study[8] with respect to the significance
of the risk management step as part of the AAQ Directive revision process, Concawe worked with Aeris
Europe to carry out a study that analyses the current compliance trends for O3 in Europe, and how these
would change in response to a potential lowering of the AQLV to the current WHO guideline value of
100 μg/m3. In addition, the analysis of these trends is extended into the future (up to 2030) to also assess
the implications of changing the EU AQLV under the current EU legislative emissions projections and
under several emissions scenarios. The analysis covers the EU, with a special focus on five Member States
(France, Germany, Italy, Poland and Spain) and the UK.3 For brevity, this article uses illustrative examples
from the analysis to demonstrate the results of the study.

3   The United Kingdom left the EU on 1 February 2020 but will apply EU law until the end of the transition period.

Concawe Review Volume 30 • Number 1 • June 2021                                                                       7
Understanding the process of setting
air quality limit values and the associated
compliance challenge—the ozone study
Current compliance trends for O3
Based on available hourly measurement data from all European O3 monitoring stations (~2,200 stations)
taken from the European Environment Agency (EEA) Air Quality e-Reporting database,[9] the state of
compliance in each Member State under the current AQLV of 120 μg/m3 (with an exceedance allowance
of 25 days) was analysed. The analysis covered both the latest year for which O3 data were available (i.e.
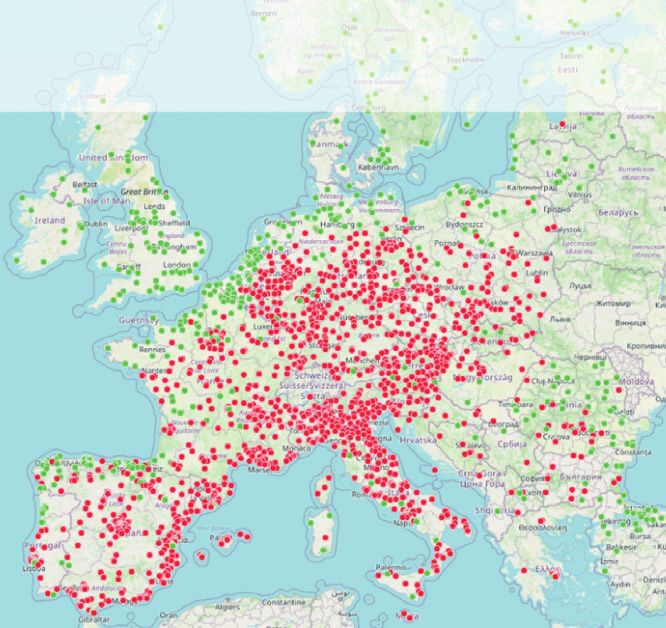
2017) at the time when the study was undertaken, as well as historical years. Figure 1 shows the O3
compliance picture in Europe in 2017 under the current AQLV.
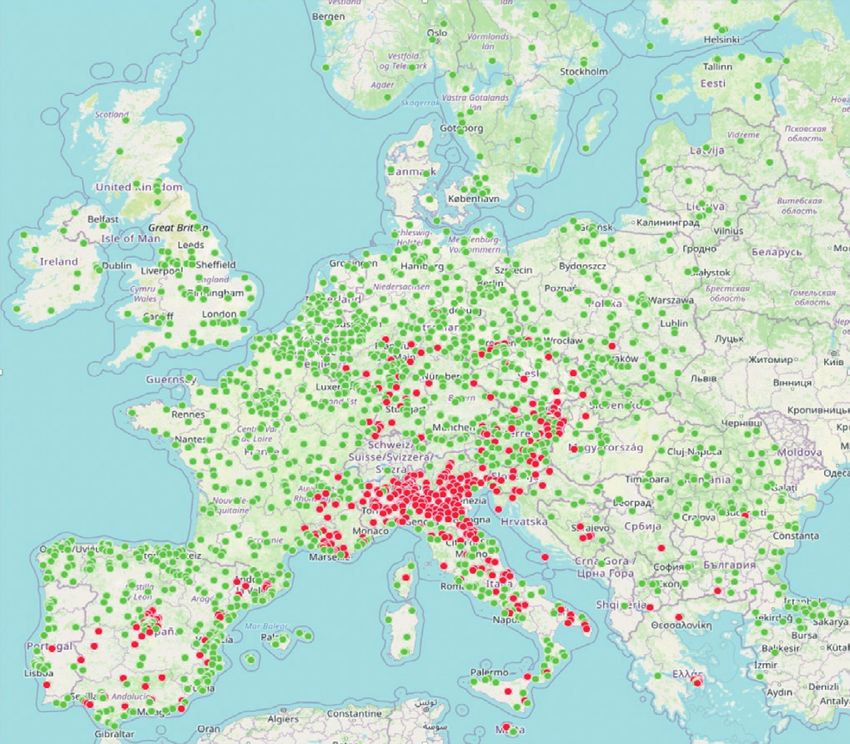
Figure 1: Maximum daily 8-hour mean O3 concentrations (μg/m3) in Europe in 2017
monitoring stations that
measure concentrations
below the target value of
120 μg/m3 (not to be
exceeded on more than
25 days) (compliant stations)
monitoring stations that
measure concentrations
above the target value
(non-compliant stations)
In 2017, approximately 81% of all stations measuring O3 in Europe were compliant with the current EU
AQLV. However, on the national scale, full compliance in all monitoring stations within a country is only
achieved in approximately 35% of European countries, with 17 Member States and 5 other reporting
countries4 registering concentrations above the O3 target value for more than 25 days. O3 compliance
also shows a strong spatial variability, with most of the non-compliant stations being found in southern
and eastern European countries; this indicates the important role that meteorology plays on O3 formation,
especially during peak O3 episodes which are strongly linked and favoured by warm, stagnant conditions
which occur in this part of Europe. Ozone concentrations also show a strong inter-annual variation, with
compliance ranging between 75–90% over the past five years.
4 Andorra, North Macedonia, Bosnia and Herzegovina, Serbia and Switzerland.
8 Concawe Review Volume 30 • Number 1 • June 2021Understanding the process of setting
air quality limit values and the associated
compliance challenge—the ozone study
However, the vast majority of the monitoring stations in Europe are a long way from fulfilling the long-
term O3 objective of 120 μg/m3 without any allowance for exceedance days set in the AAQ Directive. In
2017, only 17% of all stations in Europe were compliant with the long-term O3 objective of zero
exceedances of 120 μg/m3 (maximum 8-hour daily average) — see Figure 2a. In addition, a significant
downward change in the AQLV raises notable compliance problems. For example, a reduction in the EU
AQLV to the current WHO guideline value of 100 μg/m3, while keeping the 25 exceedance days threshold,
results in a substantial EU-wide increase in O3 non-compliance (67% in Europe) — see Figure 2b. The
non-compliance issues could be even more significant when the long-term O3 objective is aligned with
the current WHO air quality guideline value, as only 6% of all O3 monitoring stations in Europe were able
to achieve this value in 2017 (Figure 2c).
Figure 2: O3 compliance in Europe in 2017 under three different scenarios
a) The AAQ Directive long-term O3 objective of b) The scenario of lowering the EU AQLV to the
120 μg/m3 (no allowance of exceedance days) current WHO guideline value of 100 μg/m3
(allowing 25 exceedance days over the year)
compliant monitoring stations
c) The scenario of aligning the AAQ Directive long-term
O3 objective with the current WHO guideline value of non-compliant monitoring stations
100 μg/m3 (no allowance of exceedance days)
Concawe Review Volume 30 • Number 1 • June 2021 9Understanding the process of setting
air quality limit values and the associated
compliance challenge—the ozone study
Analysing the O3 compliance trends at a national scale, in the six countries (i.e. five EU-27 Member States
and the UK) used for a more detailed focus, the results show that over the years from 2005 to 2017, O3
compliance has generally improved. However, full compliance with the current EU AQLV is currently
achieved only in the UK, with non-compliance in 2017 ranging from 4–70% in the other five countries
(Figure 3). A move to a limit value of 100 μg/m3, or a move towards zero allowable exceedances at the
current or lower AQLV, creates a significant non-compliance problem. These findings provide an important
illustration of the need to include the risk management step in any AQLV setting revision process.
Figure 3: Percentage of O3 non-compliant monitoring stations in six European countries (five EU-27 Member States and the UK)
under the various scenarios
2005 Ñ current AQLV 2010 Ñ current AQLV 2015 Ñ current AQLV 2017 Ñ current AQLV
2017 Ñ lowering the EU AQLV to the WHO air quality guideline value
2017 Ñ AAQ Directive long-term O3 objective
2017 Ñ lowering the long-term O3 objective to the WHO air quality guideline value (no exceedance days)
100
90
80
% of O3 non-compliant stations
70
60
50
40
30
20
10
0
France Germany Italy Poland Spain United Kingdom
Another important finding that can be derived from the analysis is that O3 compliance does not show a
similar spatial pattern in all areas within a country. This can be more evident in the major urban areas where,
in most cases, the analysis shows that O3 concentrations could impose compliance issues in contradiction
to the general compliance improvement at the national scale. This is mainly attributed to reductions in
NOx emissions in urban areas, mainly due to the implementation of measures to mitigate road transport
emissions, which could eventually favour the formation of O3.
10 Concawe Review Volume 30 • Number 1 • June 2021Understanding the process of setting
air quality limit values and the associated
compliance challenge—the ozone study
Ozone formation is mainly driven by emissions of NOx and VOCs through complex photochemical
reactions, and in areas where NOx concentrations are significantly high (i.e. in urban areas and cities) O3
formation is dominated by NOx. In such areas, a reduction in NOx emissions will have a counter-effect on
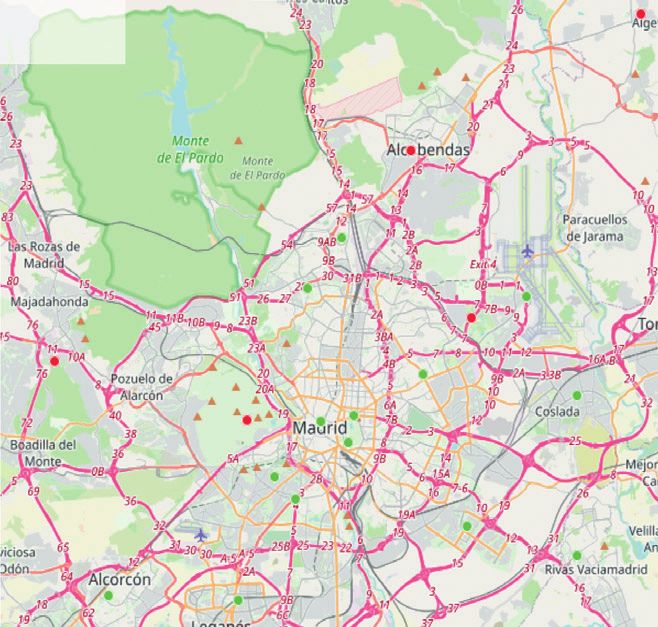
O3 formation, causing O3 levels to increase.[10,11] In Madrid, for example, O3 non-compliance remains an
important issue from 2010 onwards, in contrast with earlier years (2005) when full compliance with the
current EU AQLV was achieved (Figure 4).
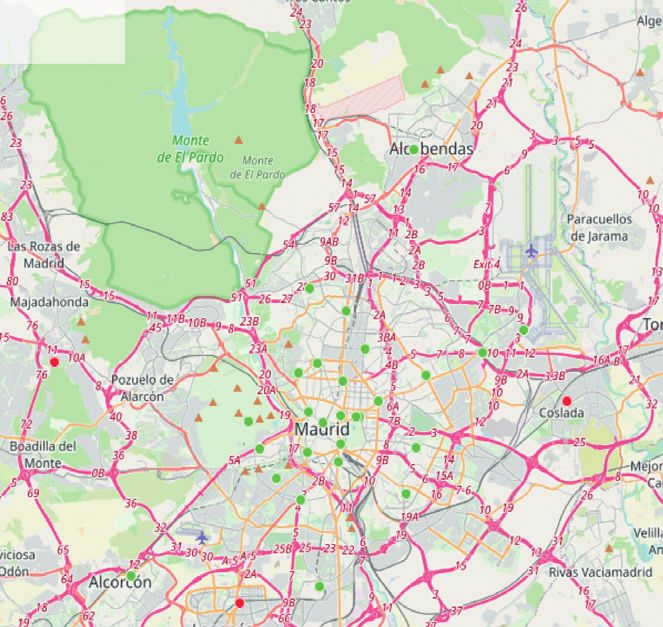
Figure 4: O3 compliance in Madrid from 2005 to 2017
a) 2005 b) 2010
c) 2015 d) 2017
monitoring stations that measure maximum daily 8-hour mean concentrations below the target value of 120 μg/m3
(not to be exceeded on more than 25 days) (compliant stations)
monitoring stations that measure concentrations above the target value (non-compliant stations)
Concawe Review Volume 30 • Number 1 • June 2021 11Understanding the process of setting
air quality limit values and the associated
compliance challenge—the ozone study
In 2010, around 30% of the monitoring stations measuring O3 in Madrid were not able to achieve
compliance with the current EU AQLV, while in 2017 the proportion of O3 non-compliant stations
increased to 50%. On the other hand, NOx concentrations in Madrid showed a downward trend, with
concentrations in 2017 being 26% lower compared to 2005 (on average over Madrid) (Figure 5). It should
be noted that 2015 and 2017 were two of the warmest years in Europe,[12,13] which could favour O3
episodes. This fact, in combination with the effect of NOx on O3 formation, could explain the increased
number of O3 non-compliant stations in 2015 and 2017 compared to 2010.
Figure 5: Annual mean NOx concentrations in Madrid, 2005–2017
120
100
NOx concentration (µg/m3)
80
60
40
20
0
2005 2010 2015 2017
Long-term O3 compliance assessment
Modelling approach
To predict how O3 concentrations will project into the future (i.e. 2030), as well as to assess the
practicability of achieving compliance with current and lower ambient air quality limit values, a modelling
approach was taken using the AQUIReS+ model.[14] The model uses a gridded emission inventory and
source-receptor relationships[15] that relate a change in emission to a change in concentration. These
data are derived from regional chemical transport models (EMEP,[16] CHIMERE [17]) used in air quality
studies. The model takes into account the local environment, traffic and topographical characteristics of
each monitoring station. Model predictions are compared with data from the EEA Air Quality e-Reporting
database[9] to ensure that the model performs well and accurately reflects concentrations of pollutants
over historic years.
Ozone concentrations at the monitoring stations were predicted under different emissions scenarios.
The following section provides an overview of the scenarios examined, and the modelling results are
presented in the section that follows thereafter.
12 Concawe Review Volume 30 • Number 1 • June 2021Understanding the process of setting
air quality limit values and the associated
compliance challenge—the ozone study
Emissions scenarios
a) Current legislation baseline
The starting point of the modelling part of the study are the emissions under a current legislation (CLE)
scenario. This is an official EU projection of how emissions (based on multiple sector contributions) will
evolve over time. The CLE scenario takes account of economic growth and the progressive impact of
European legislation currently in force. Projections are made in five-year steps (2015–2020–2025–2030).
The geographic distribution of emissions is accounted for at a fine scale, and national emissions for the
EU Member States (EU-27 + UK) are calculated by spatial aggregation.
The CLE scenario is described in the Thematic Strategy on Air Pollution (TSAP) Report #16, published
by IIASA.[18,19,20] The focus of that report is on PM2.5, NOx, SO2, NH3 and NMVOCs (non-methane volatile
organic compounds). For simplicity, the many source emissions are aggregated into 10 different sectors
according to the SNAP (Selected Nomenclature for sources of Air Pollution) method.
b) Maximum Technically Feasible Reductions (MTFR) scenario
A second scenario used in policy planning is the Maximum Technically Feasible Reductions (MTFR)
scenario. This is historically named and refers to the case where emissions from stationary sources are
reduced by using all available technical measures. It gives a reference point for both ‘minimum emissions’
and ‘maximum costs’ for these sources. It is important to note that not all sources are included, and non-
technical measures can also be used to reduce emissions. The implementation of non-technical
measures would require specific political will, and their feasibility is not considered. Foreseen plant
closures, such as the phasing out of some older fossil-fuelled power stations, are accounted for in the
CLE scenario.
In addition to the MTFR scenario, and since O3 formation strongly depends on NOx and NMVOC
emissions, two additional MTFR-based emissions scenarios were considered explicitly for the purposes
of this study:
i) NOx-MTFR: implementation of all available technical NOx abatement measures only; and
ii) VOC-MTFR: implementation of all available technical NMVOC abatement measures only.
Under both of these scenarios, the emissions of the remaining pollutants were assumed to remain below
the levels projected under the CLE scenario.
c) Removal of NMVOC emissions
As the reduction of NMVOC emissions limits the formation of O3, and can partially offset any increase in
O3 concentrations due to NOx emissions reductions, especially in urban areas, an additional scenario was
considered which assumes the removal of all NMVOC emissions from human activities. This scenario,
however, is extreme and should be considered only as a sensitivity test.
Concawe Review Volume 30 • Number 1 • June 2021 13Understanding the process of setting
air quality limit values and the associated
compliance challenge—the ozone study
Results
Figure 6 shows how O3 compliance at a European level is projected into the future, from 2020 onwards
until 2030, under the current CLE scenario, and how this changes depending on the AQLV that is set.
Under the CLE scenario, a slight O3 compliance improvement with the current EU AQLV is predicted in
Europe over the period. However, even in 2030, full compliance with the current EU AQLV is not predicted
to be achieved as a remaining 7% of monitoring stations are found to record exceedances. Reducing the
current AQLV clearly has important implications for making compliance more challenging in Europe, even
in 2030. A lowering, for example, of the limit value to the current WHO level (100 μg/m3), or a move
towards zero exceedance days, is predicted to result in substantial EU-wide compliance issues with more
than half of the O3 monitoring stations measuring concentrations above the limits in all cases examined;
this could increase by up to 97% in Europe if the EU AAQ Directive long-term O3 objective is aligned with
the current WHO air quality guideline value for O3 (100 μg/m3 and no exceedance days).
Figure 6: Predicted percentage of O3 non-compliant monitoring stations in Europe under the CLE scenario
current EU AQLV 100
lowering the EU AQLV to 90
the WHO air quality
guideline value
80
AAQ Directive long-term O3
% of O3 non-compliant stations
objective 70
lowering the long-term O3
objective to the WHO air 60
quality guideline value
50
40
30
20
10
0
2020 CLE 2025 CLE 2030 CLE
14 Concawe Review Volume 30 • Number 1 • June 2021Understanding the process of setting
air quality limit values and the associated
compliance challenge—the ozone study
At a national scale, the projected future O3 compliance trends are consistent with the predicted results
across Europe. Analysing, for example, the projected O3 concentrations in the six countries used for a
more detailed focus in this study (i.e. five EU-27 Member States and the UK), the results show that under
current legislation, Germany and the UK are predicted to achieve full compliance with the current EU
AQLV for O3 in 2030, and in France and Poland only a limited number of monitoring stations will remain
non-compliant (Figure 7). The adoption of all available MTFR measures could eventually lead to full
compliance in France and Poland. On the other hand, southern European countries (Italy, Spain) are
predicted to have significant compliance problems with O3 in 2030 under the current legislation. In Italy,
for example, around 30% of the O3 monitoring network is predicted to be non-compliant with the current
EU AQLV in 2030 (Figure 7). The application of MTFR measures will reduce O3 concentrations in both
countries, although neither country will achieve full compliance. In Italy in particular, to arrive close to full
compliance (~98% of its monitoring network), an extreme scenario of removing all NMVOC emissions
from anthropogenic sources would be needed.
Figure 7: Predicted percentage of O3 non-compliant monitoring stations in six European countries, with the current EU AQLV
(120 μg/m3 not to be exceeded on more than 25 days) in 2030 under the different scenarios examined
2030 CLE NOx-MTFR NMVOC-MTFR MTFR No NMVOCs
100
90
80
% of O3 non-compliant stations
70
60
50
40
30
20
10
0
France Germany Italy Poland Spain United Kingdom
Concawe Review Volume 30 • Number 1 • June 2021 15Understanding the process of setting
air quality limit values and the associated
compliance challenge—the ozone study
Any downward change of the current EU AQLV, either towards a reduction in the number of allowable
exceedance days in order to achieve the EU AAQ Directive long-term O3 objective, or a reduction in the
current threshold of 120 μg/m3 to align with the WHO air quality guideline value, will pose essential non-
compliance problems in 2030 even with maximum abatement measures in place (Figure 8).
Figure 8: Predicted percentage of O3 non-compliant monitoring stations in six European countries in 2030 under the different scenarios examined
2030 CLE NOx-MTFR NMVOC-MTFR MTFR No NMVOCs
a) The current EU AQLV lowered to the WHO air quality guideline value of 100 µg/m3 (not to be exceeded on more than 25 days)
100
90
80
% of O3 non-compliant stations
70
60
50
40
30
20
10
0
France Germany Italy Poland Spain United Kingdom
b) The current EU AQLV being aligned with the AAQ Directive long-term O3 objective of 120 µg/m3 (no allowance of exceedance days)
100
90
80
% of O3 non-compliant stations
70
60
50
40
30
20
10
0
France Germany Italy Poland Spain United Kingdom
16 Concawe Review Volume 30 • Number 1 • June 2021Understanding the process of setting
air quality limit values and the associated
compliance challenge—the ozone study
Under the current legislation, by lowering, for example, the concentration threshold to the current WHO
guideline value of 100 μg/m3 (with 25 allowable exceedance days), the proportion of monitoring stations
that are non-compliant exceeds 40% in five of the Member States examined (in the UK, the number of
non-compliant O3 monitoring stations is only around 2%). The application of all available technical
measures to reduce emissions of O3 precursors (i.e.the NOx-only and NMVOC-only MTFR scenarios) as
well as the application of all available MTFR measures is predicted to significantly reduce O3 concentrations
in all Member States, thereby improving compliance. However, even with MTFR measures, full compliance
with the 100 μg/m3 threshold (even if the 25 allowable exceedance days are maintained) will be far from
technically achievable (Figure 8a). Similar results are also predicted when the AAQ Directive long-term O3
objective of 120 μg/m3 (without the exceedance days allowance) is considered as the EU AQLV, with the
UK experiencing a significant increase in non-compliance5 (Figure 8b). These are important findings, as
they reflect the need for the inclusion of a risk management process in setting AQLVs, bearing in mind
that technical achievability may prevent several countries from meeting a new EU AQLV even if cost and
social considerations are not barriers.
It should be noted that since O3 formation depends strongly on the meteorological conditions, the
predicted results are subject to some uncertainty. This arises from the fact that the modelling simulations
do not take into account any changes in meteorology, as their only focus is to assess how O3
concentrations will change in the future due to changes in emissions. However, the projected future
trends in O3 compliance, even though they are subject to some uncertainty due to meteorology, are still
dominated by the changes in emissions.[21,22] The compliance picture is not, therefore, expected to
change significantly due to meteorology. Another point of uncertainty may also arise from the fact that
the analyses focus on how the already-agreed measures, as well as measures beyond the current
legislation, to reduce emissions of O3 precursors from anthropogenic sources would affect O3
concentrations in the future. However, VOC emissions from biogenic sources also play a significant role
in O3 formation. Several studies have indicated that, despite biogenic VOC emissions being a subject of
high uncertainty, the increased temperature in a future climate will result in higher biogenic VOC emissions
that will enhance O3 formation.[23,24,25,26] This might, therefore, offset the potential effectiveness of
measures to reduce anthropogenic emissions of O3 in future efforts to achieve compliance.
5 This indicates that O3 compliance in the UK is mainly subject to exceedances above the number of allowance days that
is currently set, rather than absolute concentrations above the limits.
Concawe Review Volume 30 • Number 1 • June 2021 17Understanding the process of setting
air quality limit values and the associated
compliance challenge—the ozone study
Conclusions
The zero pollution action plan for air, water and soil that the EC will adopt in 2021 as part of the European
Green Deal includes, among others, a proposal for revising the current air quality standards and aligning
them more closely with the WHO recommendations. The WHO’s guidelines for the majority of regulated
pollutants are lower than the limit values set in the current AAQ Directives.
An earlier Concawe study highlighted the importance of following a two-step process of firstly assessing
the environmental and human health risks presented by concentrations of air pollutants (risk assessment
step) and secondly, assessing how these risks may be managed (risk management step) when binding
AQLVs are set. The current study builds on the earlier study, and focuses on O3, for which the current EU
AQLV reflects a risk assessment undertaken by the WHO in the late 1990s without further changes; a
revision of the AQLV is therefore highly possible.
The study analyses the current O3 compliance trends in Europe and how these would change in a potential
lowering of the AQLV. In addition, the study uses modelling to analyse how these trends are extended
into the future (up to 2030) under several potential emission reduction scenarios. The analysis covers the
EU, with a special focus on six European countries (France, Germany, Italy, Poland, Spain and the UK). The
results of these analyses are summarised below:
l Full compliance with the EU AQLV (120 μg/m3, not to be exceeded on more than 25 days) is currently
achieved (based on the 2017 EEA data) in nine Member States, with non-compliance issues mostly
found in southern and eastern European countries.
l The vast majority of the European countries are currently not able to meet the AAQ Directive long-
term O3 objective of 120 μg/m3 without any allowance for exceedances. In addition, they are unlikely
to be able to achieve compliance if the EU AQLV is lowered to the current WHO guideline value of
100 μg/m3 (either keeping the 25 exceedance days threshold or not).
l The current emissions legislation, as described under the CLE scenario, will be effective in reducing
O3 concentrations from 2025 onwards and improving compliance. However, full compliance with the
existing EU AQLVs will not necessarily be achieved in all EU countries. The country variation in terms
of O3 compliance remains significant in the future, with countries in southern Europe still experiencing
significant non-compliance issues (e.g. 30% of monitoring stations in Italy are non-compliant in 2030
under the CLE scenario).
l Reductions beyond the already-legislated emission reduction measures, and towards MTFR, will
further improve O3 compliance with the current EU AQLV. However, full compliance still remains
unachievable in some countries (e.g. Italy, Spain), despite the significant economic investment that
will be required for implementing all MTFR measures.
l A move to a threshold of 100 μg/m3 (the current WHO air quality guideline value) or a move toward
the AAQ Directive’s long-term objective for O3 (i.e. zero allowable exceedances at the current
threshold) will essentially create an EU-wide compliance challenge for O3. Under such a revision of the
current EU AQLV, O3 compliance will be far from technically achievable, regardless of the measures
applied to control emissions.
18 Concawe Review Volume 30 • Number 1 • June 2021Understanding the process of setting
air quality limit values and the associated
compliance challenge—the ozone study
The above findings provide an important illustration that moving to a binding EU AQLV which will be closely
aligned to the WHO air quality guideline value (with potentially less or even zero allowable exceedance
days) is highly likely to be infeasible in large parts of Europe. It is therefore essential that all consequences
of changing the AQLVs embedded in the AQ Directive are considered from the perspective of
implementation by including a risk management step in the AQLV revision process.
It should also be noted that the analyses focus on how already-agreed measures, as well as measures
beyond the current legislation, to reduce emissions from anthropogenic sources would affect O3
concentrations in the future. However, VOC emissions from biogenic sources also play a significant role
in O3 formation. Even though they are subject to a high degree of uncertainty, biogenic VOC emissions
are predicted to increase in the future and enhance O3 formation, therefore offsetting the effectiveness
of anthropogenic emission reduction measures.
References
1. European Commission (2008). Directive 2008/50/EC of the European Parliament and of the Council of 21
May 2008 on ambient air quality and cleaner air for Europe.
https://eur-lex.europa.eu/legal-content/en/ALL/?uri=CELEX%3A32008L0050
2. European Commission (2004). Directive 2004/107/EC of the European Parliament and of the Council of
15 December 2004 relating to arsenic, cadmium, mercury, nickel and polycyclic aromatic hydrocarbons in
ambient air. https://eur-lex.europa.eu/legal-content/EN/TXT/?qid=1575558618688&uri=CELEX:
32004L0107
3. European Commission (2019). Fitness Check of the Ambient Air Quality Directives. Staff Working
Document, SWD(2019) 42. https://ec.europa.eu/environment/air/quality/aqd_fitness_check_en.htm
4. European Commission (2019): Communication from the Commission to the European Parliament, the
European Council, the European Economic and Social Committee and the Committee of the Regions:
The European Green Deal. COM/2019/640. https://eur-lex.europa.eu/legal-content/EN/TXT/?uri=
COM:2019:640:FIN
5. World Health Organization (2006). Air Quality Guidelines. Global Update 2005. Particulate matter, ozone,
nitrogen dioxide, and sulfur dioxide. https://www.euro.who.int/en/health-topics/environment-and-
health/air-quality/publications/pre2009/air-quality-guidelines.-global-update-2005.-particulate-matter,
-ozone,-nitrogen-dioxide-and-sulfur-dioxide
6. European Commission (2013). Communication from the Commission to the European Parliament, the
Council, the European Economic and Social Committee and the Committee of the Regions: A Clean Air
Programme for Europe. COM (2013) 918 final, Brussels, 18 December 2013. https://eur-lex.europa.eu/
LexUriServ/LexUriServ.do?uri=COM:2013:0918:FIN:EN:PDF
7. European Commission (2002). Directive 2002/3/EC of the European Parliament and of the Council of
12 February 2002 relating to ozone in ambient air. https://eur-lex.europa.eu/legal-content/EN/TXT/
?uri=celex%3A32002L0003
8. Concawe (2020). ‘Understanding the process of setting air quality limit values and the associated
compliance challenge.’ Concawe Review, Vol. 29, No. 1, pp. 12–28. https://www.concawe.eu/wp-
content/uploads/Air-quality-Review-29-1.pdf
9. European Environment Agency (2018). ‘Air Quality e-Reporting’ (website).
https://www.eea.europa.eu/data-and-maps/data/aqereporting-8
Concawe Review Volume 30 • Number 1 • June 2021 19Understanding the process of setting
air quality limit values and the associated
compliance challenge—the ozone study
10. Thunis, P., Rouil, L., Cuveliera, C., Stern, R., Kerschbaumer, A., Bessagnet, B., Schaap, M., Builtjes, P.,
Tarrason, L., Douros, J., Moussiopoulos, N., Pirovano, G. and Bedogni, M. (2007). ‘Analysis of model
responses to emission-reduction scenarios within the City-Delta project.’ In Atmospheric Environment,
Vol. 41, Issue 1, pp. 208–220. https://www.sciencedirect.com/science/article/abs/pii/S1352231006009101
11. Megaritis, A. G., Fountoukis, C., Charalampidis, P. E., Pilinis, C. and Pandis, S. N. (2013). ‘Response of fine
particulate matter concentrations to changes of emissions and temperature in Europe.’ In Atmospheric
Chemistry and Physics, Vol. 13, Issue 6, pp. 3423-3443. https://doi.org/10.5194/acp-13-3423-2013
12. European Environment Agency (2017). Air quality in Europe — 2017 report. EEA Report No 13/2017.
https://www.eea.europa.eu/publications/air-quality-in-europe-2017
13. European Environment Agency (2019). Air quality in Europe — 2019 report. EEA Report No 12/2019.
https://www.eea.europa.eu/publications/air-quality-in-europe-2019
14. Concawe (2016). Urban Air Quality Study. Sections 5.2–5.4 (description of AQUIReS+). Concawe Report
No. 11/16. https://www.concawe.eu/wp-content/uploads/2017/01/rpt_16-11.pdf
15. Norwegian Meteorological Institute (2004). Transboundary Acidification, Eutrophication and Ground Level
Ozone in Europe. EMEP Report 1/2004. https://emep.int/publ/reports/2004/Status_report_int_del1.pdf
16. Simpson, D., Benedictow, A., Berge, H., Bergström, R., Emberson, L. D., Fagerli, H., Flechard, C. R.,
Hayman, G. D., Gauss, M., Jonson, J. E., Jenkin, M. E., Nyíri, A., Richter, C., Semeena, V. S., Tsyro, S.,
Tuovinen, J.-P., Valdebenito, Á. and Wind, P. (2012). ‘The EMEP MSC-W chemical transport model –
technical description.’ In Atmospheric Chemistry and Physics, Vol. 12, Issue 16, pp. 7825–7865.
https://doi.org/10.5194/acp-12-7825-2012
17. École Polytechnique (2017). Documentation of the chemistry-transport model CHIMERE. LMD (CNRS),
INERIS and LISA (CNRS). http://www.lmd.polytechnique.fr/chimere/docs/CHIMEREdoc2017.pdf
18. IIASA (2015). Adjusted historic emission data, projections, and optimized emission reduction targets for 2030
– A comparison with COM data 2013. Part A: Results for EU-28. TSAP Report #16A.
https://ec.europa.eu/environment/air/pdf/review/TSAP_16a.pdf
19. IIASA (2015). Adjusted historic emission data, projections, and optimized emission reduction targets for 2030
– A comparison with COM data 2013. Part B: Results for Member States. TSAP Report #16B.
https://ec.europa.eu/environment/air/pdf/review/TSAP_16b.pdf
20. European Commission (2017). TSAP 16 Underlying Assumptions: Implementing Article 14(3) of NEC
Directive 2016/2284 Requesting the European Commission to publish the TSAP 16 Underlying Assumptions
used for determining the National Emission Reduction Potentials. Produced by DG Environment, unit C.3 – Air,
8 February 2017. https://ec.europa.eu/environment/air/pdf/TSAP_16_underlying_assumptions.pdf
21. European Environment Agency (2018). Air quality in Europe — 2018 report. EEA Report No 12/2018.
https://www.eea.europa.eu/publications/air-quality-in-europe-2018
22. European Topic Centre on Air Pollution and Climate Change Mitigation (2017). Long-term air quality trends
in Europe. Contribution of meteorological variability, natural factors and emissions. Technical Paper 2016/7.
https://www.eionet.europa.eu/etcs/etc-atni/products/etc-atni-reports/etcacm_tp_2016_7_aqtrendseurope
23. Forkel, R. and Knoche, R. (2006). ‘Regional climate change and its impact on photooxidant
concentrations in southern Germany: Simulations with a coupled regional chemistry-climate model.’
In Journal of Geophysical Research (Atmospheres), Vol. 111, Issue D12.
https://doi.org/10.1029/2005JD006748
24. Meleux, F., Solmon, F. and Giorgi, F. (2007). ‘Increase in summer European ozone amounts due to climate
change.’ In Atmospheric Environment, Vol. 41, Issue 35, pp. 7577–7587.
https://doi.org/10.1016/j.atmosenv.2007.05.048
25. Churkina, G., Kuik, F., Bonn, B., Lauer, A., Grote, R., Tomiak, K. and Butler, T. M. (2017). ‘Effect of VOC
Emissions from Vegetation on Air Quality in Berlin during a Heatwave.’ In Environmental Science &
Technology, Vol. 15, Issue 11, pp. 6120-6130. https://doi.org/10.1021/acs.est.6b06514
26. Jiang, J., Aksoyoglu, S., Ciarelli, G., Oikonomakis, E., El-Haddad, I., Canonaco, F., O’Dowd, C., Ovadnevaite, J.,
Minguillón, M. C., Baltensperger, U. and Prévôt, A. S. H. (2019). ‘Effects of two different biogenic emission
models on modelled ozone and aerosol concentrations in Europe.’ In Atmospheric Chemistry and Physics,
Vol. 19, Issue 6, pp. 3747-3768. https://doi.org/10.5194/acp-19-3747-2019
20 Concawe Review Volume 30 • Number 1 • June 2021How Covid-19 lockdown affected
air pollution in Europe —
a multi-city analysis
Introduction
Concawe has undertaken a city-
Following the emergence of the novel coronavirus SARS-CoV-2 in late 2019, when the first case was level analysis to quantify the
reported in the city of Wuhan in China, the Covid-19 pandemic outbreak has had significant health and ways in which the Covid-19
economic consequences for the world.[1] As of January 2021, SARS-CoV-2 has globally infected more lockdown measures have had an
than 100 million people and caused more than 2 million deaths.[2] In Europe, more than 19 million cases impact on air quality in Europe.
This article presents the results
and 450,000 deaths have been reported, with the UK, France, Spain and Italy being the most affected
of the analysis for particulate
countries.[3] matter (PM2.5), nitrogen dioxide
(NO2) and ozone (O3).
After the virus had spread across Europe, most European countries began to introduce lockdown
measures, starting in mid-March 2020, to mitigate the infection rate. Depending on the level of Covid-19
impact in each country, as well as country-specific situations and response capacity, European
governments began, and continue, to adopt different types of interventions including partial or full closure
of national/international borders, various restrictions on travel, closure of schools, and numerous
economic responses as well as restrictions on social mobility. These efforts to prevent the virus spreading
have inevitably led to a significant drop in emissions of air pollutants from several sectors, most notably
from road transport and aviation.[4]
The changes in air pollutant emissions resulting from the sudden decrease in economic activities, and
the subsequent impact on air quality, have been the objective of several studies during the past year since
the Covid-19 pandemic started. For example, Guevara et al.[5] used a bottom-up approach that
considered a wide range of information sources (e.g. open access and near real-time measured activity
data, proxy indicators, etc.) and prepared an open-source dataset of daily, sector- and country-
dependent emission reduction factors for Europe associated with the Covid-19 lockdowns. Their
estimates showed average emissions reductions of 33% for NOx, 8% for NMVOCs, and 7% for SOx and
PM2.5 across 30 European countries (EU-27 plus UK, Norway and Switzerland). For all pollutants except
SOx, more than 85% of the total reduction was attributed to road transport. In addition, all studies
conducted so far[6,7,8,9,10,11,12] agree that there has been a profound reduction in NO2 concentrations1
as a consequence of the implemented lockdown measures, while for PM2.5 a consistent reduction cannot
yet be seen because the response of PM2.5 emissions and PM formation during the lockdown is more
complex. On the other hand, the majority of studies indicate an increase in O3 concentrations during the
lockdown, which is mainly attributed to the titration effect of NOx emissions.
Among the different initiatives that have been undertaken over the past year to study how the lockdown
measures implemented in Europe have impacted air quality, the European Environment Agency (EEA)
launched an online data viewer which includes hourly data for PM and NO2 as measured by approximately
3,000 monitoring stations across European countries during the period 2018-2020.[13]
1 There have been exceptions which show that, in some cases, the reduction in NOx levels was less obvious (i.e. German
Federal Environment Agency study: https://www.cleanenergywire.org/news/diesel-driving-bans-table-lockdown-
shows-low-effect-german-nox-levels-state-sec). This could be explained by the fact that the reduction in emissions
from road activity might relate more to newer vehicles with more advanced NOx control technology, and not to older
vehicles or vehicles that emit more NOx and were still operating (e.g. delivery vans).
Concawe Review Volume 30 • Number 1 • June 2021 21You can also read