Technology Innovation for Energy Intensive Industry in the United Kingdom - July 2011
←
→
Page content transcription
If your browser does not render page correctly, please read the page content below
Technology Innovation for
Energy Intensive Industry
in the United Kingdom
July 2011

Project Manager:
Matthew Savage – Oxford Consulting Partners

Project Advisor:
Peter Wooders – Senior Economist, IISD, Geneva

Authors:
Harry Vallack – Stockholm Environment Institute, Environment Department, University of
York.
Andrew Timmis – University of Sheffield.
Katherine Robinson – Program Manager, Centre for Low Carbon Futures.
Misato Sato – Grantham Research Institute on Climate Change and the Environment,
the London School of Economics and Political Science (LSE).
Pieter Kroon and Arjan Plomp, translation by Marlies Kamp – Energy Research Centre
of the Netherlands (ECN).

Acknowledgement
The authors wish to thank the representatives of the following organisations for their
participation in study: BOC, British Ceramic Confederation, British Glass, GrowHow,
Ibstock Brick Ltd, Iggesund Paperboard, INEOS, Lucite, Mineral Products Association,
Sheffield Forgemasters, Rio Tinto Alcan, Tata Steel, UK Steel.

Publication date: July 2011
Report no. 601
Publisher: The Centre for Low Carbon Futures 2011
For citation and reprints, please contact the Centre for Low Carbon Futures.
Notes
Costs quoted in literature other than in pounds sterling have been converted using the
following exchange rates;
Currency Unit                  Exchange Rate (/£)             Date
United States Dollar ($)       1.624                          28/02/11
Euro (€)                       1.174                          28/02/11

Estimations of costs, both in unit costs and capital costs of rollout, stage of technological
development and CO2 reductions have been included where possible.

Estimates of the costs of carbon capture and storage within individual sectors are based
on current costs, unless otherwise stated. It is predicted that by 2020-30 costs will have
decreased substantially, where estimates of future costs are available these have been
included.
Executive Summary

      Companies in the energy intensive sector are central to supporting low carbon transformation across
      the broader economy, including developing products for a low carbon economy, materials for
      construction and the development of low carbon power generation. These core industries – iron and
      steel, aluminum, ceramics, cement, lime and plaster, glass, pulp and paper, nitrogen fertilizers and
      basic inorganic chemicals - directly employ some 125,000 people in 2,800 enterprises across the
      UK, and an order of magnitude more are employed in their supply chains. Their annual turnover is
      around £23bn, providing £5 billion of gross value added to the UK economy.

      With employment costs in excess of £3.8bn (see figure 1), and total purchasing power of some
      £17bn, these companies make significant contributions in terms of direct regional employment and
      indirect economic value added through their diverse supply chains. From an innovation and value-
      added perspective, the energy intensive industries provide employment and training for highly
      qualified staff. A manufacturing job in the steel or chemical industries contributes around £70,000
      per employee to regional gross value added (GVA), perhaps double the added value of retail or
      warehousing position, for example. GVA per employee is significantly higher in energy intensive
      industries than in the broader economy. They are characterized by strong regional concentrations of
      production: steel making in South Wales, Yorkshire and Humberside, and the West Midlands;
      ceramics in the East and West Midlands; glass, pulp and paper manufacture in the North West and
      South East; cement, lime and plaster plants in the East Midlands and East of England; and
      aluminum production in the East and West Midlands.

      Figure 1: Contribution of energy intensive sectors to the UK Economy (2009)
SIC (2007 Revised)       Description                 Year       Number of Total turnover Approximate gross Total purchases                  Total          Total                 Notes
                                                                enterprises              value added at    of goods,                        employment - employment
                                                                                         basic prices      materials and                    average during costs
                                                                                                           services                         the year
                                                                Number         £ million           £ million           £ million            Thousand         £ million
     24.1, 24.2, 24.3
                         Iron and Steel                 2009             438               8,169               1,089                6,766               37               1,209
          20.11, 20.13                                                                                                                                                           Excludes sectors w ith high proportion of
                         Basic Inorganic Chemicals      2009             122               3,113               1,431                1,658               11                468 organic chemicals production
     23.2, 23.3, 23.4
                         Ceramics                       2009             745               1,781                 563                1,120               21                534
                 23.1
                         Glass                          2009             963               2,872                 894                1,972               27                662
                24.42
                         Aluminum                       2009             166               1,425                 131                1,212                7                206
                 23.5
                         Cement, Lime and Plaster       2009              23                 749                 279                  492                6                131
                 17.1
                         Pulp and Paper                 2009             277               2,993                 662                2,331               13                455 Excludes 17.2 Paper and Pulp Products
                20.15
                         Nitrogen Fertilisers           2009*            64                2,030                 150                1,788                2                114

                         Total                                       2,798             23,132                  5,199               17,339              124           3,779
                                                                                             1
      Source: UK Government Annual Business Survey 2009

      Securing the future of the energy intensive industries in the transition to a low carbon economy is
      therefore a high priority for the Trades Union Congress (TUC) and the Energy Intensive Users

      1
       See http://www.statistics.gov.uk/abi/downloads/ABS-BG-Info.pdf for classification and further detail. Annual turnover and
      annual purchase data for the Nitrogen fertilisers sector is taken from 2008 due to unavailability of data. Note these figures
      differ from those used in the Waters Wye report (2010) due to a narrower focus on upstream production.
Group (EIUG). The principle of a just economic and social transformation to a low carbon future is
applied here to secure strategic investments in green jobs, technologies and skills through dialogue
between stakeholders: governments, business and trade unions. Yet there have been a number of
published reports, and much debate within EU member states, highlighting the potential risks of
climate change and environmental legislation eroding the competitiveness of energy intensive
industries in countries such as the UK. Without a balancing mechanism, the substitution of domestic
production by imported goods from economies may not result in any decrease in global emissions; if
the goods were made with less efficient technologies than those in the UK, global emissions could
even increase. Transformative technologies, such as carbon capture and storage, remain perhaps
10-15 years away from commercial deployment. UK based assets may become less competitive,
resulting in closures or redeployment to lower cost economies, commonly referred to as “carbon
leakage”. The potential resulting economic decline and erosion of employment and skills arising from
carbon leakage is an ongoing concern to employers, unions and government across the EU member
states.
This report has been prepared for the Trades Union Congress (TUC) and the Energy Intensive
Users Group (EIUG) to consider the innovative low carbon technology solutions needed for key
energy intensive sectors. It reflects the aligned interests between employers, unions and the
government to support the transition of these key industries to a low carbon economy.
Representatives of the UK’s energy intensive industries were consulted to discuss sector specific
experiences of low carbon technologies and UK innovation. Potential technology options, barriers to
low carbon investment and the need for policy support and technical cooperation were examined.
Technology options and availability:
1. There are a number of potential technologies that could result in significant decarbonisation of
the manufacturing sectors, with additional benefits ranging from improved quality to a reduction
in the use of scarce resources. These technologies may be categorised in broad terms
according to the way in which they address emissions reductions:
! Use of carbon capture and storage/utilisation (CCS/U);
! Process change;
! Switching to biomass.
2. From a technology perspective, carbon capture and storage (CCS) offers the greatest
opportunity for carbon dioxide (CO2) abatement within the UK’s energy intensive industries.
The viability of this approach, both technologically and economically, varies between sectors,
with ammonia production, iron and steel production and chemical processing being best suited
to its early adoption. It is least applicable for paper and pulp, ceramics and glass sectors due to
the nature of the industry in terms of size and production distribution.
3. Technologies potentially available differ in their potential timescales for commercialisation and
deployment. Whilst some may be expected to be commercially competitive by 2020, assuming
that demonstrators can be developed in the near future, achieving the UK’s 2050 emissionstargets will require a further set of technologies requiring more fundamental research and
development. These might become available in 2030-2050, if proven, but are subject to a much
higher degree of uncertainty both from a technology and economic perspective.
Top 8 barriers to low carbon investment:
Price of energy: A number of representatives identified the high and rising costs of energy and
energy taxes in the UK, as well as rising commodity prices, as a barrier to investment. Parent
companies see relatively poor returns on investment in the UK compared with other countries. The
representatives consulted referenced the TUC/EIUG report (2010) on the cumulative impacts of
climate change policy on the energy intensive industries, with both electricity and gas costs
expected to rise by up to 22% by 2020.
Availability of capital: A large proportion of UK companies operating in the energy intensive sector
are subsidiaries of global organisations. They compete internally for capital investment. Higher
costs make it more difficult to justify internal group investment in the UK. The Green Investment
Bank was, however, seen as potential source of capital for energy efficiency projects.
Lack of financial support for R&D: Some respondents commented on the difficulty of accessing
government support to promote industry R&D.
Regulatory uncertainty: Long term clarity was seen as vital to underpin high cost, long term
technology investment.
Technology limitations: For many industries, much has already been done to improve the
efficiency of the processes involved; there are efficiency limitations on current processes.
Cross industry infrastructure: Some respondents noted the need for investment in national level
infrastructure, particularly in relation to carbon capture and storage, and electricity decarbonisation
and recycling.
Industrial geography: Dispersed geographic location characterises large integrated industries,
such as Iron and Steel, with different parts of the process located in a dispersed manner which can
lead to large inefficiencies, and prevent heat capture and transfer opportunities. Some industrial
regions may benefit from a concentration of production (e.g. Aire valley), for plants located outside
identified regional CCS clusters may be prevented from accessing CCS transportation and storage
networks due to high pipeline connection costs.
Supply chain geography: National policy and infrastructure need to be improved to generate
greater CO2 savings, for example, in glass recycling policy and operations.
Recommendations:A number of recommendations for the energy intensive sectors in the UK, aiming to address these barriers and create the basis for the successful transition to a low carbon economy, are drawn from the reports conclusions. A thorough assessment of the broader benefits of securing the energy intensive sectors is needed to further recognise the national level economic benefits of these sectors along with their emissions reduction potential. To achieve these benefits a supportive policy framework is needed but will require ongoing dialogue between government, industry and the trade unions. A policy focus on low carbon manufacturing, in addition to power sector decarbonisation, is needed for longer term clarity to encourage investment in technology innovation and to protect competitiveness of UK industry. Government support is needed to create national level infrastructure to support industries, which are geographically dispersed, and cross sectoral cooperation has the potential to reduce costs and maximize efficiencies. Many of the energy intensive sectors require transformative technologies to significantly reduce emissions and long term regulatory, reform, policy support and finance may be required to bridge the gap between research and development (R&D) and commercialisation of emerging technologies. Where only marginal efficiency improvements are possible in the short to medium term energy and carbon costs need to be phased to match the emergence of cost effective abatement opportunities to reduce the risk of ‘leakage’ and encourage investment in transformative technologies. An industrial mandate for the green investment bank (GIB) could potentially provide capital for energy efficiency projects and encourage other investment. Jon Price, Director, Centre for Low Carbon Futures Philip Pearson, Senior Policy Officer, Trades Union Congress Jeremy Nicholson, Director, Energy Intensive Users Group
Contents
       !
Introduction                                                   1!
Overview of Energy Intensive Sector                            3!
      Economic Contribution                                    3!
      Greenhouse gas Emissions                                 5!
Low Carbon Technology Options by Industry Sector              10!
     Introduction                                             10!
     i. Iron & steel                                          10!
     ii. Basic inorganic chemicals                            17!
     iii. Ceramics                                            20!
     iv. Glass                                                22!
     v. Aluminium                                             26!
     vi. Cement manufacture                                   28!
     vii. Pulp & paper making                                 33!
     viii. Nitrogen fertilisers                               35!
     ix. Carbon Capture and Storage Technology                37!
2. Barriers and opportunities for low carbon investment       42!
       Introduction                                           42!
       Barriers to Investment                                 42!
       UK Innovation Policy                                   45!
       Existing experience of low carbon support mechanisms   47!
       Potential Areas for Government Support                 48!
       Industry Collaboration                                 52!
Conclusions                                                   53!
Bibliography                                                  55!

!
Technology Innovation for Energy Intensive Industries Introduction This report has been prepared for the Trades Union Congress (TUC) and the Energy Intensive Users Group (EIUG), based on consultation with representatives of the UK’s energy intensive industries (iron and steel, basic inorganic chemicals, ceramics, glass, aluminium, cement and lime manufacture, pulp and paper, and nitrogen based fertilizers). There is a unique alignment of interests between government, employers and unions in supporting the United Kingdom’s successful transition to a low carbon economy. There is a shared recognition of the role that the energy intensive sector must play, not only in meeting national greenhouse gas reduction targets, but also in supplying the low carbon goods and material inputs to the wider economy. At the same time, this sector provides significant value added in terms of employment, research and exports. Internationally the coalition government is actively supporting the very valuable role that UKPLC can play in a global low carbon transition; building on both UK-based R&D capabilities and industry expertise in emerging new technologies. The need for low carbon solutions is clear to industry, however there is less visibility surrounding the timing and economics of their potential development. A number of reports have already highlighted that the lack of certainty in carbon pricing and environmental regulations are limiting factors impacting on both new investment in clean technologies and the upgrading of existing sites. The case to encourage investment is clear, from both an international perspective and domestically for regional economic prosperity. However, the current economic outlook leaves a lot of uncertainty around the financial mechanisms required to achieve transition. The coalition government has made a commitment to support the growth of a more robust manufacturing sector and to make regulations, such as the CRC (carbon reduction commitment) less complicated. However, the policy challenge of how to support investments in production capacity, while managing the environmental impacts of doing so remains. Issues of competitiveness and “leakage” of industry are critical to mobilizing the investments required and are the most contentious as tighter policies necessitate more expensive technologies investments2. This report reviews the technologies likely to be available to key energy intensive sectors, with the potential to help meet national emissions targets by 2050 by direct emissions reductions. It does not seek to evaluate the additional contribution that these industries may provide to downstream industries through the supply of materials and components for a decarbonised power sector, and low carbon inputs for construction, nor does it review the potential for demand reduction or product substitution. It aims to support the debate on the direction of policy towards the specific issues of energy intensive industry sectors, and reflects the alignment of interests between employers and trade unions to ensure that these industries continue to make a significant contribution towards economic growth. 2 See Droege, S. Tackling Leakage in a Word of Uneven Carbon Prices, Climate Strategies 2009. http://www.climatestrategies.org/research/our-reports/category/32/153.html 1
Technology Innovation for Energy Intensive Industries

The report has been prepared in the context of rising energy prices, in part reflecting the additional
costs of electricity network decarbonisation and meeting UK government greenhouse gas (GHG)
emission targets. As identified in the recent report - The Cumulative Impact of Climate Change
Policies on UK Energy Intensive Industries – Are Policies Effectively Focussed? - by Waters Wye
Associates for the TUC and EIUG, current proposals for the introduction of a carbon floor price and
other environmental legislation are expected to result in increasing electricity prices over the coming
years, with the potential to reduce the competitiveness of the UK’s energy intensive industries
against lower cost producer economies.

Climate change legislation, as it exists, risks eroding the competitiveness of energy intensive
industries in the UK. The dangers lie in the loss of jobs, investment and carbon controls to countries
with weaker climate change policies, or none at all. “Carbon leakage” as it is known, is of immediate
concern, as many companies already operate according to the best available technology (BAT)
standards. Transformative technologies, such as carbon capture and storage (CCS), remain 10-15
years away from commercial application. As a result, there is the potential for UK assets to become
unprofitable, resulting in either closure or relocation to lower cost economies, with the associated
reduction in GDP, loss of regional employment and erosion of the skills base. The substitution of
domestic production by imported goods from economies with lower standards of environmental
regulation may also result in a net increase in global emissions.

This report explores some of the technology options likely to be available to the energy intensive
sector up to 2050. A number of these have been studied in some depth by policy makers and
academics, and several industry level research programs are underway, for example within the Iron
and Steel and Cement sectors. The report has been compiled on the basis of desk research,
interviews with representatives of the leading companies in each sector, and in consultation with the
TUC affiliates Unite, Community, GMB, Unity and Prospect. For many of the companies involved,
their UK operations represent just a small part of their international manufacturing base. The
respondents have discussed their experience of reducing emissions through technology upgrade,
identified those emission reduction technologies with the greatest potential, and where possible,
identified the costs and associated potential emissions benefits. However, for many of the
technologies identified, these costs and environmental benefits remain unclear, reflecting the early
stage of their development.

The first section examines potential technology options by sector. The second section discusses
experience of technology innovation and sets out options for supporting this process. The final
section examines how policy support and industrial cooperation may work to support technological
innovation, thereby enhancing the role of the energy intensive sector to support low carbon
innovation.

The report identifies potential barriers to achieving decarbonisation, and outlines the type of
institutional support and financing mechanisms that would be required to achieve the development
and full scale application of these technologies. There are a number of hurdles to overcome in
supporting decarbonisation of the energy intensive sector, principally regarding the identification of
emerging low carbon technologies by industry sector, and moreover determining who pays.

2
Technology Innovation for Energy Intensive Industries

      Overview of Energy Intensive Sector
      Economic Contribution
      The energy intensive industries make a significant contribution to the UK economy in terms of GDP
      and employment. With an annual turnover in excess of £22.7 billion and directly employing
      approximately 124,000 people, they provide of Gross Value Added (GVA) was in excess of £5
      billion. Based on the findings of the UK Government’s Annual Business Survey (2009), the Energy
      Intensive Industries in the sectors under consideration were represented by more than 2,700
      enterprises, with an annual turnover in excess of £22.7 billion and directly employing approximately
      124,000 people. Their overall contribution, measured in terms of Gross Value Added (GVA)3 was in
      excess of £5 billion.

      While these industries represent a small proportion of the overall number of companies involved in
      manufacturing (approximately 2%), their size and strategic nature mean that they account for
      between 4-5% of manufacturing turnover, GVA and employment, and provide vital inputs to
      downstream UK manufacturing industry.

      Of the industry sectors analysed, the Iron & Steel and Chemical industries were the major
      contributors in terms of GVA, with the Ceramics and Glass industries also providing significant
      employment. Figure 1 outlines the direct economic contribution by sector (excluding downstream or
      supply chain benefits).

      Figure 1: Contribution of key energy intensive sectors to the UK Economy (2009)
SIC (2007 Revised)       Description                 Year       Number of Total turnover Approximate gross Total purchases                  Total          Total                 Notes
                                                                enterprises              value added at    of goods,                        employment - employment
                                                                                         basic prices      materials and                    average during costs
                                                                                                           services                         the year
                                                                Number         £ million           £ million           £ million            Thousand         £ million
     24.1, 24.2, 24.3
                         Iron and Steel                 2009             438               8,169               1,089                6,766               37               1,209
          20.11, 20.13                                                                                                                                                           Excludes sectors w ith high proportion of
                         Basic Inorganic Chemicals      2009             122               3,113               1,431                1,658               11                468 organic chemicals production
     23.2, 23.3, 23.4
                         Ceramics                       2009             745               1,781                 563                1,120               21                534
                 23.1
                         Glass                          2009             963               2,872                 894                1,972               27                662
                24.42
                         Aluminum                       2009             166               1,425                 131                1,212                7                206
                 23.5
                         Cement, Lime and Plaster       2009              23                 749                 279                  492                6                131
                 17.1
                         Pulp and Paper                 2009             277               2,993                 662                2,331               13                455 Excludes 17.2 Paper and Pulp Products
                20.15
                         Nitrogen Fertilisers           2009*            64                2,030                 150                1,788                2                114

                         Total                                       2,798             23,132                  5,199               17,339              124           3,779

      Source: UK Government Annual Business Survey 20094

      3
        Gross value added (GVA) represents the amount that individual businesses, industries or sectors contribute to the
      economy. Broadly, this is measured by the income generated by the business, industry or sector less their intermediate
      consumption of goods and services used up in order to produce their output. GVA consists of labour costs (e.g. wages and
      salaries) and an operating surplus (or loss).
      4
        See http://www.statistics.gov.uk/abi/downloads/ABS-BG-Info.pdf for classification and further detail. Annual turnover and
      annual purchase data for the Nitrogen fertilisers sector is taken from 2008 due to unavailability of data. Note these figures
      differ from those used in the Waters Wye report due to a narrower focus on upstream production.

      3
Technology Innovation for Energy Intensive Industries These figures do not include ‘indirect’ GVA and employment contributions from the supply chain (manufacture of downstream products and inputs) which are of a magnitude greater.5 Whilst the share of manufacturing in UK GDP, tax revenue and employment has declined significantly since the late 1970s, their vital role in the revival of regional economies and transition to a low-carbon economy has been recognised. The contribution of these sectors to the UK economy has been set out in the recent Waters Wye report for the TUC/EIUG, and it is not proposed to duplicate the findings here. Nonetheless, it should be stressed that these industries provide material inputs into the low carbon manufacturing (energy efficient glass, solar PV cells, longer-life and better-insulating construction materials), and for construction of renewable energy infrastructure. These industries are crucial to meeting government emissions targets. Many of the energy intensive industries are beginning to set out their contribution case, particularly in the context of reducing total lifecycle emissions of downstream products. For example, the international Aluminium Institute (IAI) has identified that the use of lightweight aluminium components in a vehicle can save between six to twelve times the energy taken to produce the primary aluminium used in its construction, and up to 8% fuel savings can be realised for every 10% reduction in weight. The Cement Sustainability Initiative and the work of the World Steel Association are pursuing similar research6. In this respect, simply raising energy and carbon prices for certain sectors of the economy may not result in the most efficient set of abatement outcomes. Encouraging downstream lifecycle benefits will require a broader set of policies across the economy, of which carbon pricing may be only one. Other potential measures may include minimum efficiency standards, green procurement, and efficiency obligations on electricity distributors. Mechanisms need to be identified to ensure that low carbon incentives are shared equitably across the supply chain. Currently, the benefits of reducing greenhouse gas emissions flow primarily to plant operators, rather than to those that provide the material inputs, such as steel for wind turbine manufacture. From an innovation and value-added perspective, the energy intensive industries provide employment and training for highly qualified staff. A manufacturing job in the steel or chemical industries contributes around £70,000 to regional gross value added (GVA) while a job in warehousing, for example, contributes only £30,000. Per employee GVA is significantly higher in these industries than in the broader economy7. The size and concentration of these industries makes them significant contributors to many regional economies. They contribute significantly to R&D investment8 vital to national competitiveness. An increase in their costs may result in lower levels of R&D investment and loss of innovation capacity, resulting in higher barriers to entry for those looking to expand R&D in the country. 5 For instance, the UK Pulp and Paper industry comprise of broadly two subsectors: the upstream “manufacturing of pulp, paper and paperboard” and the downstream “manufacturing or articles of paper and paper board”. The latter includes the manufacturing of paper stationary, household and sanitary goods and wall paper. Of the sector’s 64,000 persons employed and turnover of £10.9bn in 2008, the downstream sector was responsible for roughly 80% and 70% respectively. 6 See for example the International Aluminium Association at http://www.world-aluminium.org/About+Aluminium/Story+of 7 Tees Valley Unlimited: Report to North East Regional Select Committee Inquiry, 19 January 2010 ; www.teesvalleyunlimited.gov.uk/ http://www.publications.parliament.uk/pa/cm200910/cmselect/cmneast/279/27903.htm 8 The UK steel sector spends £50m each year on R&D. 4
Technology Innovation for Energy Intensive Industries

Recent research has also demonstrated the positive international spill-over impacts, from
technology innovation in manufacturing and energy industries in developed countries such as the
UK, for global industrial emissions mitigation. The UK currently ranks 5th in terms of global share of
patent holdings in “clean technologies” which include technologies in industrial production sectors
such as cement. Whilst patent data give evidence to parallel technology developments occurring in
emerging economies such as South Korea and China, these inventions are less likely to find
markets beyond those borders. This suggests that technological developments in the UK and other
industrialised countries are also likely to play a key role in achieving decarbonisation of these
energy-intensive sectors from a global perspective9.

Greenhouse gas Emissions
Current Emissions
Reducing emissions from the energy intensive sector is a key policy focus to meet the UK’s
greenhouse gas commitments. A report by Element Energy (2010), for the UK Climate Change
Committee (CCC) estimated direct emissions from industrial sources at 125 MtCO2 in 2008, which
represented approximately one quarter of total UK emissions (531 MtCO2). It estimates that more
than two thirds of industrial emissions (89 MtCO2) are already covered by the EU emissions trading
scheme (EU ETS).

As Figure 2 demonstrates, industrial emissions are dominated by four sectors – of which two (iron
and steel, and chemicals) are the subject of this report. Blast furnaces in iron and steel plants
represent the largest source of emissions, together with gas fired CHP plant across a range of
industries, and process and fuel emissions from cement kilns.

                                                                                               Figure 2: 2008
                                                                                               Industrial Emissions
                                                                                               by Industry Sector

                                                                                               Source: Element
                                                                                               Energy 2010

9
  See Dechezleprêtre, A., Martin, R., 2010. Low carbon innovation in the UK: Evidence from patent data, Report for the
UK Committee on Climate Change; Dechezleprêtre, A., Glachant, M., Ménière, Y., 2007. The North-South transfer of
Climate-Friendly Technologies through the Clean Development Mechanism, Report for ADEME (French Environment
Protection Agency))

5
Technology Innovation for Energy Intensive Industries
The profile of these sectors in terms of the number and size vary by industry. Within the EU ETS,
some of the industry sectors, such as iron and steel and cement, are characterised by a relatively
small number of large individual point sources emitting over 500,000 tonnes of CO2 per annum
(>500,000t CO2 pa). These industries are perhaps best placed for large scale emissions capture
through Carbon Capture and Storage. Other industries, such as ceramics and pulp and paper have
a larger number of smaller point sources, with lower overall contribution to UK emissions. Broader
industry sectors, such as chemicals, have a broad range of point emission sizes. Figure 3 sets out
the number of point sources and their average emissions by industry.
Figure 3: Number of Installations and Direct Emissions by Industry (2008)10
Note: figures above
columns indicate
average sector CO2
emissions per
installation (MtCO2/yr)
Source: Element Energy
(2010)
For example, Figure 3 shows that 20 glass production sites in the UK emit an average of 90,000
tonnes of CO2 a year per site. The glass industry as a whole emits around 2 million tonnes of CO2 a
year.
At an industry-wide level, the data indicates that around one third of emissions originated from very
large sources emitting more than 1 MtCO2 per year (iron and steel, refineries) and that around a
third originated from very small emissions sources emitting less than 50,000 tCO2 per year
(comprising of a large range of activities including chemicals, food and drink production and various
manufacturing and engineering activities).
It should be noted that while production emissions from the UK energy intensive sector have been
decreasing, there has, in fact, been a net increase from a UK consumption perspective due to the
large and increasing share of imports of industrial materials. For example, a series of Carbon Trust
reports (Carbon Trust 2011a, 2011b) estimates that while the production of steel in 2004 was
responsible for emissions of 25 MtCO2 (3% of UK emissions), the UK’s consumption of steel was
10
Note there have been a number of closures in the period since, for example there have been 3 plant closures in the
cement industry since this data was compiled.
6Technology Innovation for Energy Intensive Industries
equivalent to 51 MtCO2 (5% of UK’s consumption based emissions)11. Likewise, for non-ferrous
metals, production of aluminium in the UK accounted for 9 MtCO2 (1% of UK emissions), whereas
consumption of aluminium was equivalent to 24 MtCO2 (approximately 3% of UK consumption
based emissions).
Figure 4: Evolution of EU steel production and consumption; (Right) Drivers of change between
2005 and 2020 emissions (Carbon Trust, 2011)
Figure 5: (Left) Evolution of EU non-ferrous metal production and consumption; (Right) Drivers of
change between 2005 and 2020 emissions (Carbon Trust, 2011)
11
This assumes that the embedded carbon in imported steel containing goods is also included
7Technology Innovation for Energy Intensive Industries As indicated in Figures 4 and 5, the share of emissions associated with imported product within UK consumption is predicted to rise over time. The Carbon Trust projects that emissions associated with steel imports are expected to double over the period to 2020, with those associated with aluminium imports expected to increase by 50%. Both of these should be seen in the context of much flatter domestic emissions projections. Future Emission Reductions The government has recognised that the timing and burden sharing of greenhouse gas emission reductions over coming decades must be based on a realistic assessment of technological and economic capacity for implementing the necessary measures. Of clear concern to the TUC and EIUG is the prospect of unilateral policy action, leaving certain energy intensive sectors exposed to international price competition less able to compete. Discussions with the energy intensive sector indicate that there are serious concerns about the feasibility of maintaining manufacturing capacity in the United Kingdom under a high cost regulatory environment. The government has recently accepted the CCC’s recommendations relating to the UK’s Fourth Carbon Budget, which recommends a reduction by 2030 of 60% relative to 1990 levels (46% relative to 2009 levels), and 80% reduction by 2050 (CCC, 2010). The Fourth Budget offers the potential for even tighter emission reductions (1800 MtCO2e) as part of the UK’s national contribution to the UN’s efforts to secure a global agreement on climate change. The 2030 targets are to be achieved primarily by domestic action, and may also include the use of international carbon credits should there by a global agreement. [Fourth Carbon Budget: Oral Ministerial Statement (Chris Huhne) 17 May 2011]. These imply significant reductions from both the power and industrial sectors. The Fourth Carbon Budget estimates the investments in the industrial sector as being approximately £1 billion per annum to meet the 2021-2030 targets. During the fourth budget, the CCC maintained its stance that there was the potential for leakage for a limited number of sectors exposed to both international competition and high energy costs. These “leakage” industries represent approximately 1% of GDP (although potentially much more at a local level), but play a significant role in maintaining the security of the domestic supply chain and associated economic benefits. The climate change committee kept open the option for dealing with potential leakage concerns through industry sectoral agreements or border price adjustments where they were not addressed through international agreements. The Fourth Budget nonetheless recognises the potential difficulty of radical decarbonisation of industry prior to 2030. During the period 2030-2050, the government’s projections are that available biomass and biogas not used for power generation will be used within industry rather than in the residential and commercial sectors. CCS is also considered to be a priority approach during the 2030s, without which reductions from the industrial sector are viewed as “very challenging” (CCC, 2010). The government expects these options to support the reduction of industrial emissions to 40 MtCO2 in 2050, with further abatement potential from product substitution and reduction in refining demand. 8
Technology Innovation for Energy Intensive Industries
The government has recognised the role that CCS can play in assisting the reductions of emissions
associated with the energy intensive industry sector, particularly for those sectors where emissions
emanate from chemical processes as well as fossil fuel combustion (iron and steel, cement). The
climate change committee recognises that this will require a policy support approach, either through
a UK funded or “demonstrator” project, or under the European Union Emission Trading Scheme (EU
ETS) demonstration program.

Nonetheless, the climate change committee recognises that there may be the need for further
research beyond CCS and biomass/biogas to identify potential radical abatement options, such as
process electrification, resource efficiency and low carbon product substitution to meet both 2030
and 2050 targets. Industry representatives remain sceptical that the power sector will be fully
decarbonised within these timescales.

The Element Energy report for the CCC projects that under Business as Usual, direct industrial
emissions are projected to fall from 125 MtCO2 to 109 MtCO2in the period to 2050 as energy
efficiency measures are adopted by industry (assuming no major carbon leakage). This is broadly
consistent with the UK Low Carbon Transition Plan, which projects industry emissions declining to
120 MtCO2 in 2020. Figure 6 sets out the split by industry.

                                                                                     Figure 6: Projected
                                                                                     emissions excluding
                                                                                     step change
                                                                                     technologies and
                                                                                     fuel switching.

                                                                                     Source: Element
                                                                                     Energy 2010

Expected changes under business as usual include the increased use of materials blending,
increased fuel switching for the cement sector (from coke and coal to gas and biomass) and more
widespread use of best available technology (BAT) for the iron and steel sector. The projections do
not include major step changes in fuel switching, new low carbon industrial processes
(electrification) or CCS

Given an 80% reduction target on 1990 levels by 2050 (equating to an overall UK emissions cap of
159 MtCO2e), this would equate to direct industrial emissions representing more than 60% of the
total. It is clear, therefore that Business as Usual (BAU) within the energy intensive industries, even
accounting for efficiency improvements, will be not be adequate to meet the overall national target.

9
Technology Innovation for Energy Intensive Industries Low Carbon Technology Options by Industry Sector Introduction This section sets out the range of technology options identified in the research process and in consultation with industry representatives. While a total of eight industry sectors are analysed, the potential for technology innovation is not uniform across the energy intensive sector. Some industries have more potential for the application of new processes than others. For example, the steel and cement industries have the potential for breakthrough technologies and significant emission reductions, but that further RD&D is required before potential solutions become commercially feasible. CCS appears to be technologically achievable, but will require significant investment in shared transportation and storage infrastructure, both between industry users and with the energy supply sector. The paper industry also has significant potential for technological innovation. Aluminium has a number of potential transformative technologies at an early stage that have not yet been piloted. (CE Delft 2010). In the existing literature, technology innovation within the glass, ceramic, inorganic chemicals, ammonia/fertiliser and metals using electricity are assessed as having less potential for breakthrough in emissions abatement. This can be due to a lack of clear technology options, lower emissions intensity associated with production, or to the smaller and more dispersed nature of production sites. For example, there is limited publically funded research into ammonia production and metal ores, under either the European Commission’s Directorate-General for Research and Innovation (DG Research) or the US Department of the Environment (DOE) Industrial Technologies Programme (CE Delft 2010). While the range of technologies identified includes those that can be retrofitted to existing installations, the main focus of this report is upon those technologies that can be applied to plant replacement to deliver significant step change improvements in emissions intensity. It should be remembered however, that there is also a number of Best Available Technologies (BATs) delivering energy efficiency with relatively short payback periods. These can be applied by industry in the short run to help offset increased energy prices while other technologies are developed. However many BATs are only applicable when there is an opportunity to perform a complete rebuild. In the glass industry for example this opportunity may occur only every 15 to 20 years when the furnace is rebuilt. i. Iron & steel The UK Iron and Steel industry is the largest of the energy intensive sectors under consideration, in terms of GVA, employment and GHG emissions. While the UK’s trade balance in steel products was broadly in balance in 2010, the industry exported approximately 6mt of product during the 10
Technology Innovation for Energy Intensive Industries
year12. It is a large investor in research and development. Emissions of the 13 iron and steel plants
included in the EU ETS in the United Kingdom amounted to 20.4 Mt CO2 in 2008 (excluding CHP).
Nearly all of these emissions were from three integrated plant operated by Tata Steel and SSI at
Redcar, Scunthorpe and Port Talbot, using a blast furnace-basic oxygen furnace route (BF-BOF).
These sites were the largest emitters of GHG in the United Kingdom excluding the power sector,
and have achieved significant energy efficiencies through investment in the past decade. .

The carbon intensity of iron and steel production varies considerably between the major process
types, ranging from around 0.4 tonnes of CO2 emissions (0.4 tCO2) for every tonne of recycled steel
produced for electric arc furnace (EAF) to 2.5 tCO2 per tonne of steel for the coal-fired direct
reduced iron (DRI) process. Low carbon alternatives are limited by the availability and cost of
natural gas (DRI) and the availability of sponge iron or scrap steel.

In the UK, where steel is produced using the most commonly used blast furnace/basic oxygen
furnace route, average carbon intensity is currently around 1.7-1.8 tCO2 per tonne of steel. While
this is higher than in some countries, such as Brazil (1.25 tCO2) and Korea/Mexico ((1.6 tCO2), it is
noticeably lower than in other economies such as India and China (3.1-3.8 tCO2) (IPCC 2007). The
marginal costs of steel production may result in UK production becoming less competitive under a
high unilateral carbon price scenario.

However, given that UK and EU blast furnaces are operating very efficiently within the constraints of
their existing technology, there is limited room for efficiency gains without a major step change in
technology. For example, Industry representatives report a number of investments to date to
improve efficiency and reduce emissions. For Tata Steel plants, these include:

       !   Basic oxygen steelmaking (BOS) gas recovery (reused for other processes)
       !   Increased use of coal injection to replace coke use in furnace
       !   Hot linking where possible (to reduce heat loss)
       !   Recuperation and regeneration (heat recovery from reheating furnaces)
       !   Variable speed drives for motors (20-30 % energy savings for motors)
       !   Studies have been undertaken for upgrading of on-site, blast furnace-gas fuelled power
           stations at a cost (without CCS) of several hundred million pounds.

Sheffield Forgemasters have also made substantial investments in energy use efficiency at their
steel production plant resulting in a 36% reduction in total CO2 emissions since 1990. These include:

       !   Installing pulse-fired burners (reduced natural gas consumption in re-heat furnaces by 20-
           30%)
       !   Better planning – less ‘keep warms’ reduces heat loss
       !   Process re-engineering (reduce gas use e.g. making hollow ingots which need less
           processing and so less energy) - reduced CO2 emissions from gas consumption by at least
           25%.
       !   Phasing out old coal-fired power plants (all electricity is now supplied from the grid), meaning
           only small incremental increases are now feasible
12
     See International Steel Statistics Bureau http://www.issb.co.uk/uk.html

11
Technology Innovation for Energy Intensive Industries
Element Energy estimates that a minimum price of €25/tCO2 would be required to make investments
in new technologies cost-effective, and that only energy efficiency and CHP are cost effective based
on the payback resulting from reduced energy costs. Consultations with the steel industry
representatives indicate that the price may need to be significantly higher (up to €40/tCO2). It has
been reported that CCS is the most expensive of the available emission reduction technologies for
the Iron and Steel sector both retrofit and new build plant (Element Energy 2010).
Potential Technology Options
Improved energy and materials consumption, and fuel and materials substitution, account for most
of the abatement potential within the sector. For blast furnaces, a large range of technologies exist,
both for new build or retrofit to existing plant. The technologies discussed in this report, likely to be
implemented post 2020 are:
! Top-Gas Recycling Blast Furnace (TGR-BF) with CCS
! Gas-based Direct Reduced Iron (DRI)
! Coke-free steel-making (HIsarna) with CCS – based on cyclone converter furnace
! Fastmelt
There are in addition, a number of potential technologies that are under slower development, but
which may become commercially available. These are not discussed here in detail. These include
direct reduction processes using hydrogen and natural gas (with CCS) for blast furnace processes,
the use of biomass as a reducing agent instead of fossil fuels, and the introduction of electrolysis as
an alternative to traditional furnaces. If the electricity supply were decarbonised, the last of these
would result in carbon neutral iron production without the need for on-site CCS. However, these are
not discussed here as there is limited cost information available and the technologies are still at an
early stage of development. The major technology options having the potential to significantly
reduce GHG emissions from the Iron and Steel industry are described in more detail below:
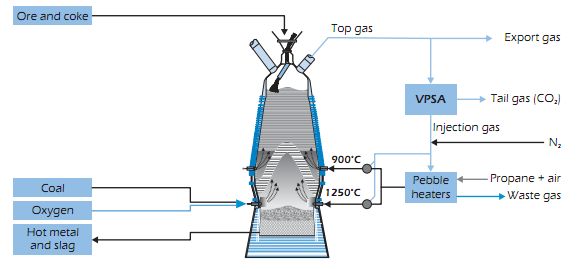
Top-Gas Recycling Blast Furnace (TGR-BF)
The TGR-BF is currently in the demonstration phase of the ULCOS programme, a European wide
cooperative research programme. The TGR-BF component is headed by Arcelor Mitttal, the
technology is in small scale demonstration phase; the LKAB Experimental Blast Furnace in Luleå,
Sweden.
The furnace uses oxygen injection into the blast-furnace, rather than enriched air. The top gas is
primarily CO and CO2, which are separated through a process known as Vacuum Swing Pressure
Absorption (VSPA). The CO is injected back into the blast furnace as a reduction agent and the CO2
can be cleaned and compressed for transportation and sequestration. A benefit of TGR-BF is that it
removes the majority of NOx production (ULCOS, 2011).
It is estimated that the TGR process does not result in a net reduction in energy use, as increased
electricity use for CO2 separation offset the reduction in use of coke. GHG reduction is dependent
12Technology Innovation for Energy Intensive Industries on the use of CCS. A TGR-BF unit with CCS could reduce the CO2 emissions of the steel making process by 50% to 60% (IEA, 2007), providing CO2 savings of up to 12 Mt per annum in the UK. By 2015 a full scale demonstration project of a TGR-BF and CCS unit should be operational at Florange, France, with validation and rollout not expected before 2020. IEA estimates (2009) of the costs of new blast furnaces with CCS is ~£215/t capacity, therefore rollout of new technology in the UK would be in the region £2.5 billion, assuming 100% replacement of the current blast furnace fleet. Figure 7: Schematic of a TGR-BF (ULCOS, 2007) Tata steel indicated the emission benefits of top gas recycling - CO2 emission reductions of 52% with CCS (zero without CCS). Costs relative to EU average for blast furnace: Capital expenditure 105% (Greenfield site) 25% (Brownfield site); operational expenditure 120% (CE Delft, 2010) Gas-based Direct Reduced Iron (DRI) Gas-based DRI is an alternative method of reducing iron ore into metallurgical iron. Gas based DRI can reduce the carbon emissions of the reduction process as gas is less carbon intensive than coal on a per energy unit basis. The MIDREX process is the most widespread technique globally, the largest facility at Al-Jubail in Saudi Arabia currently has an output of 1.76Mt per annum. Iron ore pellets are reduced in a vertical shaft by means of a reduction gas. The reduction gas is a H2 and carbon monoxide mix (CO), produced from natural gas and gas recycled from the reduction furnace. The iron can then be briquetted or directly fed in to an Electric Arc Furnace (EAF). Direct feeding from the reduction furnace into the EAF significantly reduces energy consumption as the iron is preheated. Gas-based DRI consumes approximately half the energy (~10GJ/t) of a traditional blast furnace. A MIDREX-EAF plant can emit 50% less CO2/t than a traditional blast furnace-basic oxygen furnace (MIDREX, 2008). Gas-based DRI is already a commercially viable technology, though is best suited to countries with a readily available and relatively cheap source of natural gas. Investment in gas-based DRI is 13
Technology Innovation for Energy Intensive Industries
approximately £125/t capacity (IEA, 2009). A total roll out and conversion of the UK primary steel
making industry would cost £1.5 billion and possible CO2 abatement of ~10 Mt.
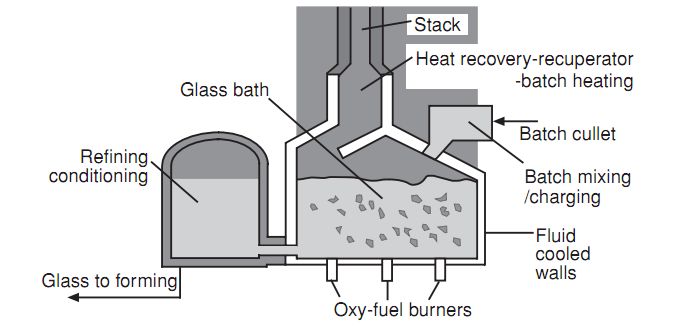
Hlsarna technology (Coke free steelmaking)
HIsarna uses a bath-smelting technology to produce more energy efficient and less carbon intensive
steel. It brings together a number of processes including the preheating of coal, partial pyrolysis in a
reactor, an ore melting cyclone, and a vessel for ore reduction and iron production. All of these
technologies have been proven at small scale, but Hlsarna brings them together in an integrated
way. The emission benefits are achieved through the lower use of coal in the process, and by the
fact that it removes the need for a separate process to create pig iron pellets. The process allows
for partial replacement of coal by biomass, natural gas or Hydrogen.
The first Hlsarna plant is currently under construction in the Netherlands by Tata Steel, and is
expected to produce up to 60,000 tonnes of pig iron per annum. The potential for CCS and the use
of biomass as a reducing agent continue to be explored as part of the process. Assuming the plants
succeed, there are plans to extend capacity up to 700,000 tonnes per annum.
Estimates of CO2 emission reductions from laboratory trials are as high as a 20% and of up to 80%
with CCS.
The costs relative to EU average for blast furnace indicate that both capital and operational
expenditure would be lower. Capital costs are estimated at 75% (Greenfield site) and 65%
(Brownfield site) with operational expenditure at 90% of current blast furnace costs. (CE Delft,
2010)13
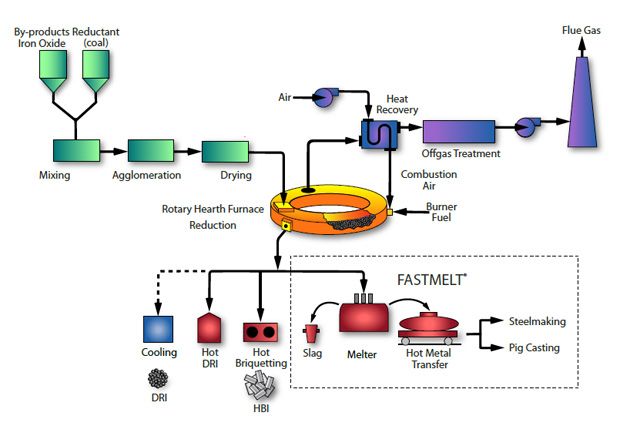
Fast Melt
The Fastmelt process is designed to be used primarily for processing steel mill by products. It uses
a rotary hearth furnace to convert waste and iron oxide fines to a metallized DRI. Carbon is used
as the reductant, either in the wastes or through the addition of coal or coke. The waste, reductant
and binder are mixed and consolidated either by pelletising or briquetting. These are then heated by
fuel gas and fed into the RHF. The heat is generated either by electricity or coal combustion. A
melter is used to produce hot metal. Hot DRI is discharged from the RHF and melted in an electric
furnace or coal-based melter. The technology is promoted by Midrex Technologies and Kobe Steel.
13
http://www.ulcos.org/en/research/isarna.php
14Technology Innovation for Energy Intensive Industries Figure 8: Overview of Fastmelt system Fastmelt allows a wider range and lower quality of ores (important from the point of availability of raw material inputs) to be used when compared to standard blast furnace technology, and does not rely on cokes as a reducing agent. This results in lower operating costs overall, and slightly lower energy use and carbon emissions per unit of output. Fast melt offers CO2 emission reductions of 54% with CCS (5% without CCS) compared to an average EU blast furnace. Costs are estimated at capital expenditure 200% relative to current blast furnaces (Greenfield site, no CCS) and with operational expenditure of between 80 - 90% of the equivalent plant. (CE Delft, 2010) Carbon Capture and Storage (CCS) Integrated iron and steel plants offer good potential for CO2 capture and storage, with over 75% of total emissions from core processes having the potential for CCS applications. Oxy-fuelling may be used pre-combustion to create pure CO2 off gas, or alternatively the gas may be captured post combustion using chemical absorption techniques relying on waste heat, although this would require installation of CHP units in most plants in the UK (See section on CCS for more details on technologies). CCS does not offer a complete solution for integrated Iron and Steel plants, due to the significant volumes of GHG emissions from the wide range of processes involved, including rolling mills, oxygen furnaces and sinter plants (Element Energy 2010). CCS is central to the ULCOS II programme, organised by the European steel industry. It is pursuing four iron manufacture processes incorporating CCS as the main GHG reduction technology, and the aim is to create a CCS demonstration project, with the TGR-BF technology (above) seen as the most likely candidate for application (Element Energy 2010). Within the UK, the 3 major plants are considered suitable for CCS. Redcar and Scunthorpe are particularly suitable due to their location near the North Sea oil fields and potential power sector regional CCS infrastructure. All three would require retrofitting of pre- or post combustion technology. Element Energy (2010) reports that engineering and economic assessments have been undertaken for TGR-BF technology at 15
Technology Innovation for Energy Intensive Industries
Scunthorpe and are planned for Redcar and Port Talbot, assuming that transportation infrastructure
is made available.

The cost of CCS in blast furnaces is estimated at between £24.5/tCO2 to £30.8/ tCO2 for capture,
transport and storage (IEA, 2008). In blast furnaces the capture costs are estimated at between
£17/t CO2 and £21.3/t CO2. The cost of CCS can be significantly reduced through the wider
adoption of gas-based DRI, which simplifies the CCS process, and which could reduce costs by up
to 50% to £15.4/t CO2. From 2008 reported and verified CO2 emissions as part of the EU ETS (20.3
Mt CO2; DECC, 2009), the costs of rollout of CCS will be in the range £250 million to £330 million
per annum, assuming capture from just blast furnaces. Total capital investment for CCS in blast
furnaces is estimated at ~£125/t of production capacity (IEA, 2009). The UK primary steel industry
has an estimated production capacity of 12 Mt per annum (AEA, 2010); total capital investment is
estimated in the region of £1.5 billion, excluding the cost of pipelines.

Current configuration of blast furnaces are not ideally suited to post combustion CCS, due to
insufficient waste heat from the blast furnace for chemical adsorption (IEA, 2008); this process
would require an additional CHP plant. The development of TGR-BF could result in a sufficiently
CO2 rich flue gas to allow CCS, though this technology is in development stage, with demonstration
projects set for 2015-2020. TGR-BF with oxygen injection and CCS could reduce CO2 emissions in
the range of 85% to 95% from the reduction process (75% of total process emission), the remaining
emissions from coking oven etc. could only be recovered at prohibitive costs (IEA, 2009).Both
France and the Netherlands are each hosting the development of breakthrough low carbon steel
technologies. It is vital that the UK secures the opportunity to host the development of CCS
infrastructure and technologies for industry.

Figure 9. Carbon Reduction options for the steel sector (Carbon Trust, 2011).

16
You can also read