Hawaiʻi Island Tourism Strategic Plan 2020-2025 - Hawai'i Island Tourism Strategic Plan
←
→
Page content transcription
If your browser does not render page correctly, please read the page content below
Hawai‘i Island Tourism Strategic Plan
              2020-2025

         June 23, 2020 DRAFT

Hawaiʻi Island Tourism
Strategic Plan

2020-2025
The Island of Hawaiʻi is a very special name given to a special place. Before we
 discuss sustainable tourism, community-based tourism, and responsible tourism,
         we need to center ourselves within the significance of this place.

We start with our island’s name that represents the optimum form of health. Under
 health comes subsets which include tourism and economics. We are seeing the
connection between economic independence and community wellbeing more than
  ever. With challenges to health which include on island life, natural resources,
increase in population, usage of space, and water consumption, these impacts lead
us to more deeply think about other currencies besides money: natural resources,
                  water supply, access to resources, marine life.

                                               Hawai‘i Island Tourism Strategic Plan | 1
Mahalo & Acknowledgements                                                                    3

E ‘ola hou iā Hawai‘i, I ke alo o nā kuahiwi ‘elima                                          5

Executive Summary                                                                            6

Introduction and Background                                                                 11

Data on the Health of Our Land, People, & Visitor Industry                                  17
   Health of Our Land                                                                       17
   Health of Our People                                                                     19
   Health of Our Industry                                                                   22

Stakeholder Feedback & Survey Results                                                       32
   Initial Round of Feedback                                                                33
   Network Gathering                                                                        36

Vision - Ola ka ‘Āina, Ola ke Kānaka!                                                       39

Goals & Objectives                                                                          40
  Goal #1: Responsible Tourism                                                              40
  Goal #2: Pono-Based Visitor Communication                                                 40
  Goal #3: Place Based Education for Residents                                              41
  Goal #4: Infrastructure                                                                   41

Guiding Principles for Metrics                                                              41
   Health of Our Land                                                                       42
   Health of Our People                                                                     44

County Strategies & Actions Going Forward                                                   45
   Responsible Tourism                                                                      45
   Pono-Based Visitor Communication                                                         48
   Place Based Education for Residents                                                      50
   Infrastructure                                                                           52
   Initial Collaborative Action Planning                                                    54

Appendices                                                                                  61
  Appendix A: Stakeholder Meetings & Community Process & Detailed Feedback                  61
  Appendix B: County Data from the Aloha+ Challenge Dashboard                               71
  Appendix C: Questions to Assess Connectedness as tied to Pilinahā                         76
  Appendix D: Action Plan Template for Community-Driven Initiatives                         79
  Appendix E: Initial Collaborative Action Planning                                         80

                                                      Hawai‘i Island Tourism Strategic Plan | 2
Mahalo & Acknowledgements

The County would like to extend a mahalo to the Advisory Group, as well as other
industry and community partners, who helped to provide ongoing focused feedback in
the development of the TSP. These individuals come from a wide cross section of the
community and below are their names and organizational affiliation based on when they
provided feedback. We have done our best to include all those who contributed, but due
to the scope of the plan, some names may have unintentionally been left off or
misspelled and apologize in advance for any oversight.

Advisory Group
◾Amedeo Markoff,             ◾Jay Rubenstein, Royal       ◾Leināʻala Fruean,
Pāhoa Mainstreet             Kona Resort                  Island Breeze
◾Craig Anderson,             ◾Jesse and Kūlia             Productions
Hawaiʻi Lodging and          Potter, Pōhāhā I Ka          ◾Linda Nako, Hawaiʻi
Tourism Association,         Lani                         Island Visitors Bureau
Hawaiʻi Island               ◾Jessica Ferracane,          ◾Micah Alameda, Nā
◾Cindi Punihaole             Hawaiʻi Volcanoes            Leo o Hawaiʻi
Kennedy, The Kohala          National Park                ◾Miles Yoshioka,
Center                       ◾John McCollum,              Hawaiʻi Island Chamber
◾Charles Young, KUPA         Umauma Falls &               of Commerce
Friends of Hoʻokena          ZipLine Experience           ◾Pualilia Hanamaikaʻi,
◾Donna Kimura, Island        ◾Kaʻiu Kimura, ʻImiloa       Hilton Waikoloa Village
of Hawaiʻi Visitors          Astronomy Center             ◾Rolinda Bean,
Bureau                       ◾Kaʻiulani Blankenfeld,      Sheraton Kona at
◾ Earl Regidor, Four         Fairmont Orchid              Keauhou Bay
Seasons Resort               ◾Kamanaʻopono                ◾Ross Birch, Island of
Hualalai                     Crabbe, Kohala Institute     Hawaiʻi Visitors Bureau
◾Ed Gunderson, Grand         ◾Kaniela Danny and           ◾Wendy Laros, Kona-
Naniloa Hotel                Anna Akaka, Mauna            Kohala Chamber of
◾Grayden Haʻi-Kelly,         Lani, Auberge Resorts        Commerce
Mauna Kea Beach              Collection
Hotel

                                                 Hawai‘i Island Tourism Strategic Plan | 3
Additional Contributors
◾Amanda Rieux, Malaʻai: The            ◾Jean Jewell, Destination Kona          ◾Mia Akau-LaClair,The Kohala
Culinary Garden of Waimea Middle       Coast                                   Center
School                                 ◾Jessica Hamad, Hawaiʻi Tropical        ◾Michael Schorr, Marriott Vacations
◾Andrew Hara, Visual Media             Botanical Gardens                       Worldwide
Specialist                             ◾Joey Alvarado, Men of Paʻa             ◾Michaela Larson, Hawaiʻi
◾Anne Chung, Hawai‘i Community         ◾Kathy Clarke, Hawaiʻi Events &         Untouched,
College                                DMC                                     ◾Mike Donoho, Kukui Planning
◾Beckie Marshall, VASH                 ◾Keala Kadooka, Mauna Lani,             ◾Mike Nelson, Volcano Art Center
◾Beckie Stocchetti, Hawaiʻi Island     Auberge Resorts Collection              ◾Moani Akana, Hawaiʻi Island
Film Festival                          ◾Keli Donnelly, Keli’s Concierge and    Festival - 30 Days of Aloha
◾Bill Wolden, Dolphin Quest            Tours                                   ◾Noʻeau Peralto, huiMAU
◾Brent Imonen, Pacific Rim Sports      ◾Kim Olson, Hawaiʻi Pacific Parks       ◾Noland Eskaran, Waipiʻo Taro
◾Candee Ellsworth, Friends of          ◾Kirstin Kahaloa, Native Hawaiian       Farmers Association
NELHA                                  Chamber of Commerce                     ◾Ola Jenkins, Destination Hilo
◾Cara Goodrich, Castle Resorts &       ◾Kūhaʻo Zane, Sig Zane Designs          ◾Oriana Brown, Island Breeze
Hotels                                 ◾Kumu Micah Kamohoaliʻi, Halau Na       Productions
◾Catherine Rehberg, Lavaloha           Kipuʻupuʻu                              ◾Paula Kekahuna, ‘O Makuʻu Ke
Chocolate Farm                         ◾Lahela Spencer, Hilton Waikōloa        Kahua Community Center
◾Chris Paterson, Kailani Tours         ◾Lanakila Mangauil, Hawaiian            ◾Penn Henderson, Fair Wind Cruises
Hawaiʻi                                Cultural Center of Hāmākua              ◾Phoebe Barela, VASH
◾Coco Kreusling, KapohoKine            ◾Lauren Ruotolo, Hawaiʻi Institute of   ◾Rachelle Hennings, VASH
Adventures                             Pacific Agriculture                     ◾Rae Okawa, Hawaiʻi Wildlife Center
◾Cynthia Kennedy, The Kohala           ◾Lauren Smith, Hawaiian Islands         ◾Rebecca Villegas, County Council
Center                                 Recreational Scuba Association          District 7
◾David Bock, Hawaiʻi Island Chamber    ◾Laua‘e Kekahuna, ‘O Makuʻu Ke          ◾Riley Saito, County of Hawai‘i
of Commerce                            Kahua Community Center
                                                                               ◾Rob Pacheco, Hawaiʻi Forest & Trail
◾David Kurohara, Hawai‘i Electric      ◾Lawrence Kaʻamoana, Men of Paʻa
                                                                               ◾Sheena Wong, Island Breeze
Light Company                          ◾Leslie Kimura, ʻImiloa Astronomy       Productions
◾Deane "Dinnie" Kysar, Destination     Center
                                                                               ◾Stallone Chartrand, Hālau Na
Hilo                                   ◾Linda Ulgade, Cooper Center            Kipuʻupuʻu
◾Desiree Cruz, Volcano Art Center   ◾Lisa Hadway Spain, University of          ◾Stephanie Donoho, Kohala Coast
◾Diane Ley, County R&D              Hawaiʻi at Hilo                            Resort Association
◾Elizabeth Fien, Friends of Hawaiʻi ◾Lito Arkangel, Nā kīhāpai o Hale          ◾Stephen Schmelz, Kona Pier
Volcanoes National Park             ʻŌlelo
                                                                               ◾Steven Santiago, Hilo International
◾Elizabeth Mallion, Hāmākua Harvest ◾Luana Jones, Hui Aloha o Puna Kai
                                                                               Airport
◾Emily Weiss, Volcano Art Center    ◾Lucille Chung, Laupāhoehoe                ◾Susan Maddox, Friends of the
◾Fern Gavelek, Fern Gavelek            Hawaiian Civic Club                     Future
Communications                         ◾Lynn Taube, Holualoa Companies         ◾Tawn Keeney, Honokaʻa People’s
◾Frecia Cevallos, County of Hawaiʻi    ◾M. Johannes Seidel, CarbonBuddy        Theatre
◾George Appplegate, Grand Naniloa      ◾Manu Powers, Sea Quest Hawaiʻi         ◾Teresa Cosgrove, Island of
Resort                                 ◾Marcia Timboy, Events Curator          Hawaiʻi Visitors Bureau
◾Gerry Rott, Lavaman Triathlon         ◾Margo Bunnell, Robert’s Hawaiʻi        ◾Terri Racine, The Grand Naniloa
◾Ilimia Guerrero-Livingston,           ◾Marie Aguilar, Destination Kona        Resort ◾Timothy Murphy, Dolphin
SeaQuest Tours                         Coast                                   Quest
◾Iopa Maunakea, Men of Paʻa            ◾Marleen Mareko, Fair Wind Cruises      ◾Tina Clothier, PATH ◾Valerie
◾Jade Haughian, Dolphin Quest          ◾Mary Beth Witzel, Destination Kona     Overlan, PATH
◾Jason Cohn, Hawaiʻi Forest & Trails   Coast                                   ◾Yu Yok Pearring, ʻImiloa Astronomy
                                                                               Center

                                                                   Hawai‘i Island Tourism Strategic Plan | 4
E ola hou iā Hawai‘i, I ke alo o nā
                  kuahiwi ‘elima
“Life returns to Hawai‘i nestled in the presence of the
                five sacred mountains.”
            -Kaniela Akaka (Uncle Danny)

 This ‘ōlelo no‘eau shares the love we have for Hawai‘i Island and
  sets the basis for the Hawai‘i Island Tourism Strategic Plan (the
 TSP). Uncle Danny’s inspiration for this ‘ōlelo no‘eau began with
 an Oli he wrote based off his experience of viewing the sun rising
over Mauna Kea and highlighting the plains of Waimea. He recalls
   the sunshine rising over the mountains and its reflection on the
ripples of the water. Uncle Danny remembers diving into the water
and coming out feeling refreshed, renewed, and rejuvenated. This
 early morning experience led to the creation of this ‘ōlelo no‘eau.
  The five mountains of Hawai‘i Island -- Kohala, Hualālai, Mauna
Kea, Mauna Loa, and Kīlauea -- makes Hawai‘i Island unique and
  majestic. It emphasizes the needs to preserve what we have for
  future generations. It expresses a deep respect for the traditions
  of our native islands captured in Uncle Danny’s quote, “To know
 and to understand this ‘ōlelo no‘eau is to know and to understand
                         the mana of Hawai‘i.”

                                     Hawai‘i Island Tourism Strategic Plan | 5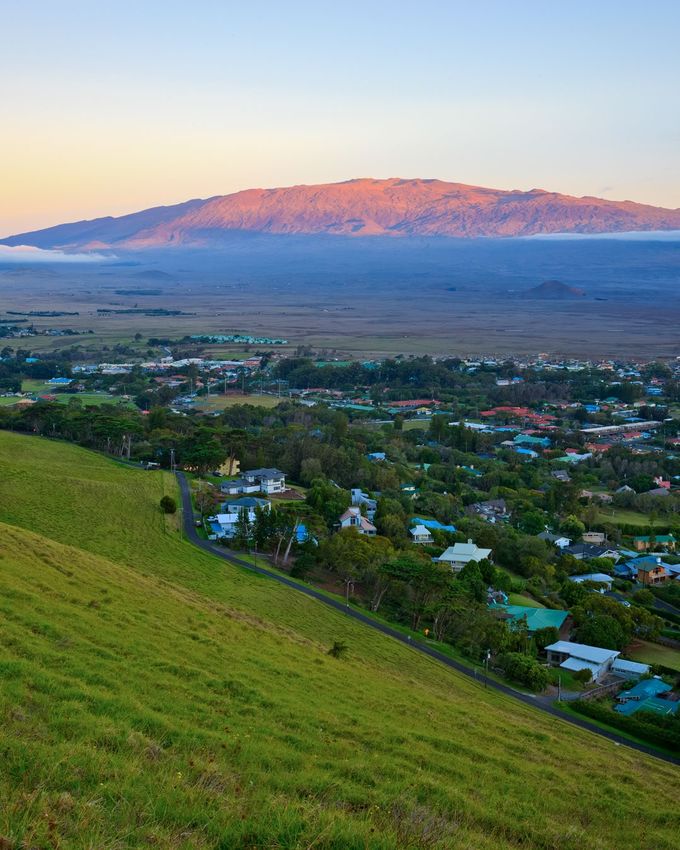
Executive Summary
The Hawai‘i Island Tourism Strategic Plan 2020-2025 (TSP) carries forward the idea that
successful tourism starts with a high quality of life for residents defined by Ola ka ‘Āina, Ola ke
Kānaka (Healthy Land, Healthy People) and sets it as the vision for the future of Hawai‘i
Island. Based on the data and community feedback the following goals were distilled:

   ●   Responsible Tourism -- Support a sustainable visitor industry on Hawai‘i Island that
       promotes the preservation of our natural and cultural resources and a high quality of life
       for residents that results in authentic experiences for visitors and economic growth for
       the county.
   ●   Pono-Based Visitor Communication -- Reinforces authentic Hawaiian culture that
       ensures the foundation of our unique sense of place and establishes the necessary
       communication to visitors for the care of our ‘āina and culture.
   ●   Place Based Education for Residents -- Support and encourage both community-
       driven and institutional initiatives that are grounded in place based efforts to train and
       educate a local workforce that lifts up opportunities that are unique and authentic to
       Hawai‘i Island.
   ●   Infrastructure -- Provide social benefits to both residents and visitors by supporting
       initiatives and existing efforts that improve transportation, community assets, and
       housing for residents, which will also benefit visitors.

Taking a step back, the County of Hawai‘i (the County) began the process for updating the TSP
in 2019 before the COVID-19 situation escalated and dramatically changed the economy,
especially the visitor industry. Data and research focused on metrics that focused on health in
the following ways and subsequent takeaways:

   ●   Health of Our Land -- numerous indicators of negative impacts on our natural resources
       prior to the COVID-19 situation, such as alarming low scores for habitat biodiversity and
       coastal protection, which assess the condition of coral reefs, wetlands, beaches, and
       ponds, are buoyed by the observations of cultural practitioners of the quick recovery of
       our ‘āina due to the sudden decrease in human activity.
   ●   Health of Our People -- negative indicators highlighted by the decrease in County
       residents agreeing that tourism has brought more benefits than problems from 2010 to
       2019 by 24%. Also, the high percentage of households (48%) that were either living
       below the federal poverty level or classified as Asset Limited, Income Constrained,
       Employed (ALICE), which means they earn less than the basic cost of living for the
       County
   ●   Health of Our Visitor Industry -- mixed indicators prior to the COVID-19 situation that
       indicate in 2019 that visitor expenditures have declined while arrivals grew. Meanwhile,
       79% of visitors from all major market areas rating they were “extremely satisfied”
       regarding their overall satisfaction to their most recent trip to the state of Hawaiʻi.
       Looking ahead, DBEDT forecast much lower projections for tourism at about 3.4 million
       arrivals overall for 2020 across the state, followed by 6.2 million in 2021, 8.3 million in

                                                         Hawai‘i Island Tourism Strategic Plan | 6
2022, and 9.4 million in 2023, and the opportunity to broaden the County’s reach
       towards a more responsibly-minded visitor, such as the environmentally-minded traveler
       who may be willing to pay as much as 10% more.

The TSP also incorporated the perspectives of the visitor industry, community, and government
stakeholders, to integrate a range of perspectives on the future direction of tourism in Hawaiʻi
Island. Below is a summarized timeline of the process:

Themes that arose from the talk stories, focus groups, and survey results included:

   ●   Importance of Place & Culture -- need to rebuild authentic relationships that people
       have with the places and culture of Hawaiʻi Island, particularly native Hawaiian culture.
   ●   Protecting the ʻĀina -- important to address environmental degradation by both
       residents and visitors and provide opportunities for both groups to collaborate on.
   ●   Lifting Up People -- ensure decisions are community driven, particularly by native
       Hawaiian stakeholders.
   ●   Supporting a More Responsible Visitor Industry Connected to the Environment
       and Culture -- this included promoting activities like agrotourism and voluntourism,
       limiting the number of visitors based on environmental concerns, and focusing on the
       type of visitor that would respect and care for the land and culture.
   ●   Increasing Visitor Awareness and Changing Mindsets -- emphasize the importance
       of caring for ‘āina, the uniqueness of Hawai‘i Island, being mindful of residents, and
       native Hawaiian culture.
   ●   Providing Educational Opportunities for Residents -- building capacity of residents in
       a variety of ways that centers place and culture would strengthen the visitor industry in a
       variety of ways.
   ●   Improved Infrastructure -- supporting communal resources for residents will benefit
       visitors alike.

                                                        Hawai‘i Island Tourism Strategic Plan | 7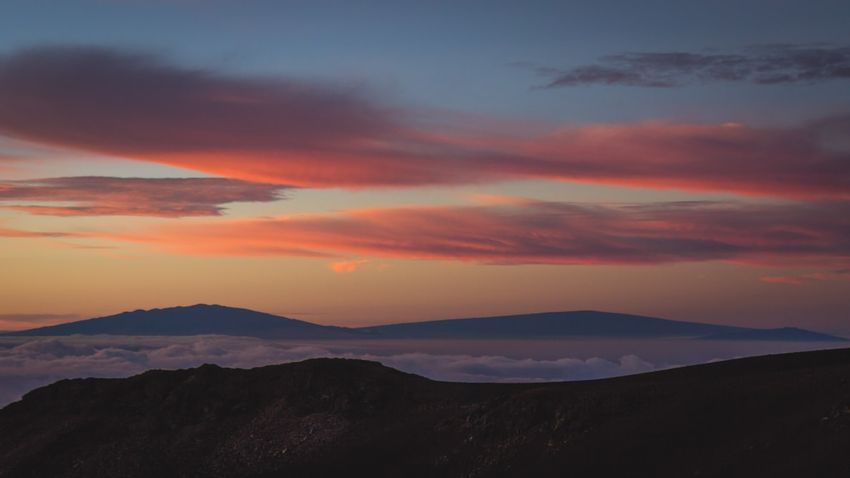
Subsequently, the County held a network gathering in order to present initial findings to
stakeholders and collect additional feedback on the initial draft of TSP goals, objectives, and
strategies, as well as to get initial thoughts on metrics. The TSP builds from the 2016 Hawaiʻi
Island Tourism Road Map and incorporates Pilinahā (the Four Connections Framework), which
is an indigenous framework for measuring health, designed by Kōkua Kalihi Valley
Comprehensive Family Services and the Islander Institute in 2015. 1,2 The TSP provides an
update on the foundation for the metrics the County will be tracking to measure progress. Given
feedback from the community, the indicators for the health of our industry must be tied to the
health of our land and health of our people and below are starting points:

       ●    Health of Our Land -- Aloha+ Dashboard
       ●    Health of Our People -- resident satisfaction and visitor employee satisfaction

The County encourages community driven efforts to build on this foundation and develop their
own place-specific metrics to support the County’s strategies and actions going forward.
Subsequently, the County views its role as a connector, convener, facilitator, and catalyst
for community-driven approaches to achieving the vision and goals of the TSP. In those
roles, the County works to build a network of community and industry people; provide capacity
building and technical assistance; offer some grant support to community-driven initiatives; and
help with synthesis of information for decision making.

Looking ahead, the County identified more detailed objectives (starting on page 40) as well as
strategies, actions, metrics, and outcomes (starting on page 45) as tied to each goal. Below are
the immediate actions as tied to each goal:

    Responsible Tourism

    Develop an inventory of cultural practices and natural resource areas identifying those that
    are determined appropriate for access as well as plans to sustain those resources.
        ● Create an action plan to form metrics that will determine pono practices for sustaining
           the cultural and natural resources.

    Put “community first” and help to ensure communities retain their sense of place, including
    recognizing Native Hawaiian knowledge, culture, and people first and then the multi-cultural
    diversity of each community.
        ● Integrate Native Hawaiian practitioners as leaders within visitor industry conversations
            and actions.
        ● Encourage visitors and incentivize companies to buy local goods and services by
            providing technical support for local businesses who want to promote or further
            develop their local products, services, and activities in the visitor industry.
        ● Identify and reduce barriers that prevent visitor industry companies from buying
            Hawai‘i Island local products.

1
    Hawaiʻi Island Tourism Road Map, 2016, pg. 8
2
    Pilinahā: An Indigenous Framework for Health, 2019

                                                             Hawai‘i Island Tourism Strategic Plan | 8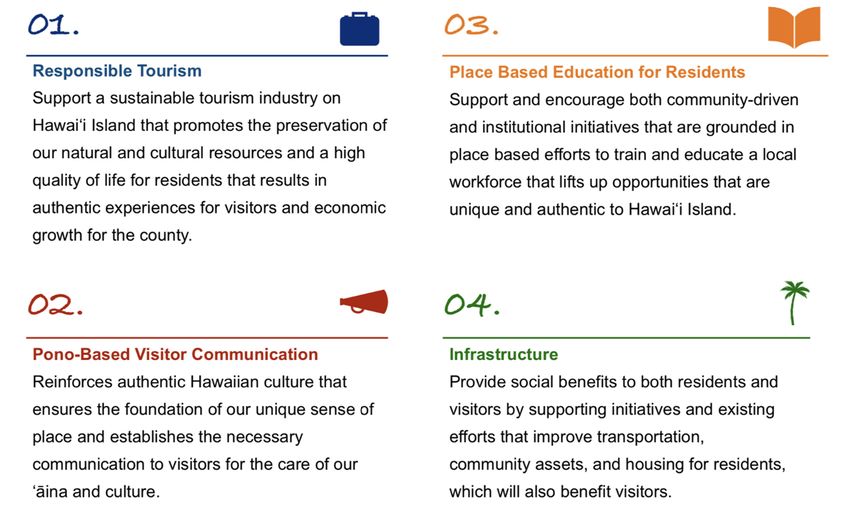
Coordinate with the visitor industry and other stakeholders to provide employment that
sustains families on Hawai‘i Island, proactively reinvests back into the local community and
commits to uplifting Native Hawaiian culture, values, and customs.

Develop ways for visitors to authentically engage and contribute back to Hawai‘i Island and be
accountable for their actions.

Pono-Based Communication

Develop and implement a coordinated action plan based on ‘āina based and place-based
values tied to communicating Hawai‘i Island’s brand to visitors and exchanging information
between stakeholders:
    ● Conduct research identifying more active visitors attracted to the authentic features of
       Hawai‘i Island.
    ● Integrate community-based plans to ensure marketing efforts take into account
       reciprocity, pono practices, and place-based values.
    ● Coordinate with leaders from community organizations, the Mayor’s office, County
       Council, state elected officials and visitor industry stakeholders.
    ● Use the Connections Framework to design a survey to measure the impact of
       communication strategies on Hawai‘i Island residents.

Place Based Education for Residents

Work with appropriate stakeholders to further develop training and integrated programs to
share Hawaiian culture and history with visitor industry workforce and related community
stakeholders. Support programs that also provide multi-ethnic cultural and historical workforce
training.
    ● Identify potential communities for pilot projects and share the success of the pilot
        projects to encourage more communities to engage in this process.
    ● Develop a Hawai‘i Island program that recognizes and rewards visitor industry
        employees and volunteers for acquiring greater knowledge of Hawaiian culture,
        history, and pono practices.
Work with appropriate stakeholders to further develop visitor industry-related training,
education and outreach programs within the DOE, community college, and university.
    ● Support programs that incentivize students to enter the visitor industry workforce on
        Hawaiʻi Island.
    ● Support programs that provide students with relevant place-based and culturally
        grounded knowledge that lead to careers with growth potential.
    ● Support programs that conduct outreach to students in STEM fields and connect them
        to successful careers in the visitor industry.

                                                       Hawai‘i Island Tourism Strategic Plan | 9
Develop a Hawai‘i Island program that recognizes and rewards visitor industry employees and
volunteers for acquiring greater knowledge of Hawaiian culture, history, and pono practices.
Infrastructure
Work with appropriate stakeholders to support the coordination, collaboration and
improvement in general public transportation services as well as eco-friendly options for
residents, which by extension, will also benefit visitors.
Work with community members to identify high priority areas in communities for addressing
resident and visitor safety and develop plans for ensuring ongoing improvements and
maintenance.
● Identify and recommend opportunities for improving signage that meet resident needs
and by extension will meet visitor needs.
● Integrate plans and protocols tied to disaster mitigation.
Work with appropriate stakeholders to identify solutions for the lack of affordable workforce
housing.
In moving to action, the County additionally worked internally to connect across concurrent
County processes (page 54), the Hawai‘i Tourism Authority (page 55), and other COVID-19
recovery efforts (page 57).
Hawai‘i Island Tourism Strategic Plan | 10Introduction and Background
The County of Hawai‘i (the County) is committed to implementing the Hawai‘i Island Tourism
Strategic Plan 2020-2025 (TSP) that seeks to improve the quality of life for residents, which in
turn, creates a strong visitor industry. This TSP lays out the direction for the County for the next
five years, and it proposes an active role of local government in building industry and community
partnerships to ensure that tourism is inclusive, sustainable and Pono (righteous and in
alignment) with Hawai‘i Island’s natural and cultural resources. The desired outcomes of the
TSP are reflected in the updated goals, objectives, strategies and metrics, and are consistent
with the County’s General Plan, Community Development Plans, and the Kīlauea Recovery &
Resilience Plan.
The process for updating the TSP began in 2019 before the COVID-19 situation escalated and
dramatically changed the economy, especially the visitor industry. The data and community
feedback collected during this time reflected the desires to shift the industry towards one that is
more Pono: respectful of people, cultural practices, sacred and historical sites, natural resource
protection, and raising up future generations to carry on the community legacy while providing
economic opportunities. In the post-COVID-19 climate, the industry is presented with the
opportunity to remodel and refocus the industry to be Pono, and the County aims to be a
resource that will support the industry and communities during this process.
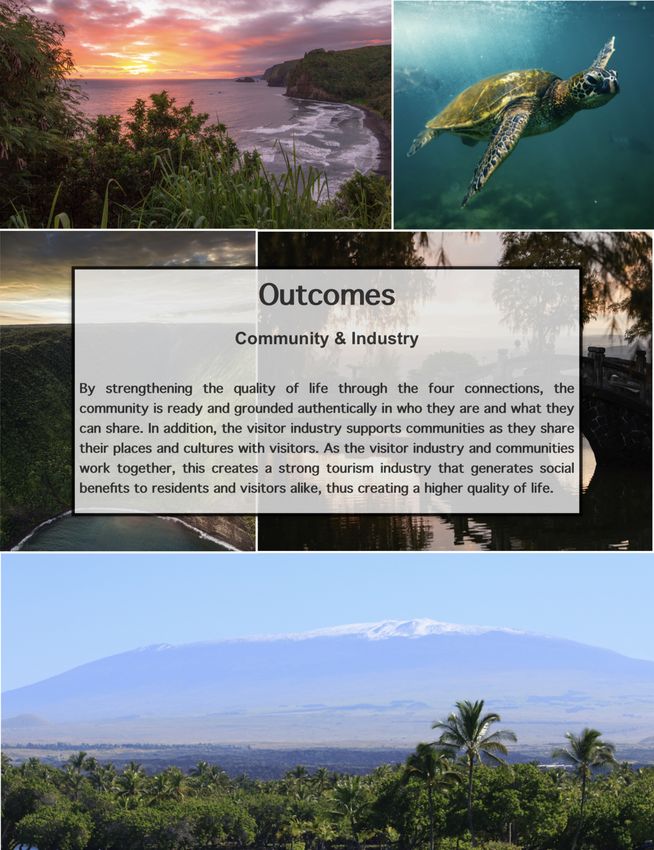
Hawai‘i Island Tourism Strategic Plan | 11Our Values
Commitment to Place
ByCommitment
embracingto Place Graphic
these values, tourism on Hawai'i Island can create a
healthier E olabetween
relationship hou iāourHawai‘i, I ke and visitors.
E ‘ola hou ia Hawai‘i, I ke alo o nā kuahiwi ‘elima -- Commitment to Place
land, communities,
The values underlying the TSP resonate first in the ‘ōlelo noeʻau that Kaniela Akaka shared with
alo o nā kuahiwi ‘elima
the County in 2019: E ‘ola hou ia Hawai‘i, I ke alo o nā kuahiwi ‘elima (Life returns to Hawai‘i
nestled in the presence of the five sacred mountains). The ‘ōlelo noeʻau aligns with the
commitment made in the 2006-2015 Hawaiʻi Island Tourism Strategic Plan to preserve and
support the natural environment, and to support efforts that improve the quality of life on Hawai‘i
Island. Similarly, the 2016 Hawaiʻi Island Tourism Roadmap included an action plan to address
the following question: “How should we work—as policymakers, businesses, workers,
organizations, neighbors, and families—to enhance quality of life?”
E ola hou iā
E ‘ola hou iā Hawai‘i, I ke alo o nā kuahiwi ‘elima -- Commitment to Place
Ola ka ‘Āina, Hawai‘ i, I ke Pilinahā
TheOla keunderlying
values Kānaka alo first
the TSP resonate o nā in the ō‘lelo no‘eau that Kaniela Akaka
E ola hou iā‘ elima
shared with the County in 2019:kuahiwi Hawai‘i, I ke alo o nā kuahiwi ‘elima (Life
returns to Hawai‘i nestled in the presence of the five sacred mountains). The ō‘lelo
no‘eau aligns with the commitment made in the 2006-2015 Hawaiʻi Island Tourism
Strategic Plan to preserve and support the natural environment, and to support efforts
that improve the quality of life on Hawai‘i Island. Similarly, the 2016 Hawaiʻi Island
Tourism Roadmap included an action plan to address the following question: “How
should we work—as policymakers, businesses, workers, organizations, neighbors, and
families—to enhance quality of life?”
Connection to Place,
High Quality of Life Commitment to
Community, Past and
The valuesforunderlying
ResidentstheasTSP
a resonate first Place
in the ‘ōlelo no‘eau thatFuture,
Kanielaand
Akaka shared with
Your
Foundation
the County in 2019: E ‘ola hou iā Hawai‘i, I ke alo o nā kuahiwi ‘elima (Life returns
Better Selfto Hawai‘i
nestled in the presence of the five sacred mountains). The ‘ōlelo no‘eau aligns with the
commitment made in the 2006-2015 Hawaiʻi Island Tourism Strategic Plan to preserve and
support the natural environment, and to support efforts that improve the quality of life on Hawai‘i
Island. Similarly, the 2016 Hawaiʻi Island Tourism Roadmap included an action plan to address
the following question: “How should we work—as policymakers, businesses, workers,
organizations, neighbors, and families—to enhance quality of life?”
Hawai‘i Island Tourism Strategic Plan | 12Connection to Place,
Community, Past and Future,
and Your Better Self
Pilinahā
Pilinahā -- Connection to Place, Community, Past and Future, and to Your Better Self
The TSP builds from the 2016 Hawaiʻi Island Tourism Road Map and incorporates
Pilinahā (the Four Connections Framework) with traditional industry metrics. The
2016 Hawaiʻi Island Tourism Road Map recognized how existing data points are
unable to measure community and island health so it integrated Pilinahā, an
indigenous framework for measuring health, designed by Kōkua Kalihi Valley
Comprehensive Family Services and the Islander Institute in 2015, Pilinahā focuses
on four dimensions of connection: connection to place, community, past and future,
and to your better self. Pilinahā provides a framework to capture these broader
indicators to ensure quality of life for residents is maintained through these
connections. It also provides a starting point for the visitor industry to capture how it
contributes to the high quality of life through actions that acknowledge connections to
place, community, past and future, and ourselves.
Hawai‘i Island Tourism Strategic Plan | 13High Quality of Life for Residents as a
Foundation
Ola ka ‘Āina, Ola ke Kānaka
This document carries forward the idea that successful tourism starts with a high
quality of life for residents defined by Ola ka ‘Āina, Ola ke Kānaka (Healthy Land,
Healthy People) and sets it as the vision for the future. The TSP incorporates recent
sentiments of members of Hawai‘i Island communities, including residents, visitor
industry workers, businesses, and government officials, which help to guide the County
in improving the quality of life on Hawaiʻi Island. To achieve the vision of Ola ka ‘Āina,
Ola ke Kānaka, the TSP outlines the following four goals, which builds on the County’s
past plans with current feedback from community and industry stakeholders:
Hawai‘i Island Tourism Strategic Plan | 14The County of Hawai‘i Department of Research and Development in partnership with the
Hawai‘i Alliance for Community Based Economic Development (HACBED) conducted research
and outreach to gather feedback on the state of tourism on Hawai‘i Island. A series of talk
stories and a network gathering with nonprofit and community based organizations, hoteliers,
tour operators, destination management companies, marketing and PR firms, local businesses,
festival and event organizers and program managers. Appendix A lays out a timeline of key
events and captures the planning process.
Connection with Other County Efforts
The TSP aims to connect with other County processes to ensure alignment and collaborative
opportunities across departments. Below is a snapshot of where some of the County processes
are at:
● General Plan -- the Planning Department is currently updating the first draft after a
robust community outreach process to guide policies for the next forty years for the
County.
● Community Development Plans (CDP) -- the Planning Department is currently revisiting
how it will engage with the CDP Action Committees as a mechanism for community
activated implementation, which equates to community led, county supported
implementation, as well as information gathering.
● Kīlauea Recovery & Resilience Plan -- the Department of Research and Development is
in the process of capturing and uplifting community-based recovery actions (CBRAs)
that focus on community planning and capacity building, natural and cultural resources
management, supporting a network of resilience hubs, strengthening food security and
resilience as well as agriculture development, youth development and entrepreneurship,
and health and medical services.
The TSP’s vision of Ola ka ‘Āina, Ola ke Kānaka subsequently provides support to each of the
different County activities.
Hawai‘i Island Tourism Strategic Plan | 15Data on the Health of Our Land, People, & Visitor
Industry
The World Health Organization states that “the social determinants of health are conditions in
which people are born, grow, live, work, and age. These circumstances are shaped by the
distribution of money, power and resources at global, national, and local level.” 3 This section
highlights existing data that describes the current conditions and circumstances of the health of
our land, people, and the visitor industry as well as how the industry impacts health.
Health of Our Land
Currently, the COVID situation has led to an opportunity for our ‘āina to get a respite from the
influx of people due to the increase in visitors to Hawaiʻi over the past few years. In 2019 alone,
10.5 million visitors came to Hawai‘i, 4 almost ten times the population of the state. The County
had 1.8 million visitors, which is nine times larger than the County population. 5 The vast number
of people puts a strain on the health of our land and natural resources. Hannah Springer, a
Native Hawaiian cultural practitioner on Hawai‘i Island, observes how the ‘āina, including the
wildlife and the atmosphere, are quickly responding to the rest from human activity. 6
Negative Natural Resource Indicators Prior to the COVID-19 Situation
“There is a limit to the amount of tourists the environment can withstand. Each
site should have a maximum per day visitor limit which would include residents
and visitors that can sustain or not harm the site.” 7
The Hawaiʻi Ocean Health Index (OHI) demonstrates the low health of Hawai‘i Island’s ocean
biodiversity, coastal protection, and by extension the condition of coral reefs, wetlands,
beaches, and ponds. The OHI specifically measures the health of ocean resources by tracking
six goals: food provisions, coastal protection, biodiversity, economies and livelihoods,
sustainable tourism, and a sense of place. OHI scores range from 0 to 100 and a score of 100 is
the overall aim for each goal. A score of 100 “represents a healthy ocean that provides
maximum benefits now and into the future.” 8 Lower scores mean that optimal benefits are not
being obtained in a sustainable way and should subsequently not be equated to the academic
mode of scoring. In 2018 the average OHI for Hawaiʻi Island was 72, a couple points lower than
the average OHI across the Hawaiian islands, which is not a healthy indicator. The goals for
habitat biodiversity and coastal protection, which assess the condition of coral reefs, wetlands,
beaches, and ponds scored the lowest for Hawaiʻi Island with an OHI of 42 for each measure,
3
https://www.who.int/social_determinants/sdh_definition/en/
4
https://www.hawaiitourismauthority.org/media/4166/2020-01-29-hawaii-visitor-statistics-released-for-december-2019.pdf
5
UHERO Data Portal, Average Daily Census
6
https://kawaiola.news/cover/envisioning-a-new-normal/
7
TSP Survey Round 2
8
Marine Managed Areas, Aloha+ Dashboard
Hawai‘i Island Tourism Strategic Plan | 16which is an extremely alarming score. As a comparison, Samoa scored a 98 in 2018 for coastal
protection whereas Belize scored 24. In addition to indicating the lower health of these aquatic
resources they also indicate a decrease in the benefits they provide, such as food provision and
the prevention of coastal flooding and inundation.
The goals for habitat biodiversity and coastal protection, which
assess the condition of coral reefs, wetlands, beaches, and
ponds scored the lowest for Hawaiʻi Island with an OHI of 42
for each measure, which is an extremely alarming score.
Other indicators demonstrate that increases in urban land use has negatively impacted water
recharge and stream flow. On Hawaiʻi Island, the National Oceanic and Atmospheric
Administration (NOAA) reported an increase of impervious surface area (e.g. sidewalks,
asphalt, parking lots) of about 7.2% between 2005 to 2011. 9 Some of the impacts of
development can be seen in changes in streamflow, “which recharges groundwater and
maintains thriving ecosystems and drinking water.” 10 For Hawaiʻi Island, as of May 2020, US
Geological Survey reported that streamflow for Wailuku river and Honoliʻi stream, when
compared to historical streamflow for the same day and for previous years, were “much below
normal” or in the less than 10 percentile. 11 Streams near Kamuela were normal and were
between the 25 to 75 percentile. There are currently no other streams that have been ranked by
the US Geological Survey in Hawaiʻi Island due to insufficient historical data or missing
streamflow estimates, which are glaring gaps in data to capture the current health of our land.
Reducing the accumulation of solid waste contributes to lower emissions of methane, which has
a significant impact on climate change. The more waste diverted away from landfills means
“less need to extract raw materials from mines, such as aluminum, and decreases the amount
of methane gas released into our atmosphere as waste decomposes.” 12 In 2018, the County
diverted only 20% of solid waste from landfills compared to a 36% waste reduction in 2010. One
reason more solid waste in entering landfills is because 21% more solid waste has been
generated in 2018 (283,021 tons) compared to 2011 (234,091 tons). Second, -35% less of
recycled and composted materials were recycled in 2018 (58,825 tons) compared to 2010
(87,575). In addition, in late 2019 the County scaled back on collecting plastics and paper due
to decline in demand in global recycling markets. 13 This will unfortunately increase the solid
waste that goes to County landfills. Addressing the indicators for unhealthy oceans and lands,
such as OHI, streamflow, and waste will help to elevate the health of our people and support a
healthy visitor industry.
9
NOAA C-CAP Land Cover Atlas
10
Land Use Impacts, Aloha+ Dashboard
11
WaterWatch, US Geological Survey, https://waterwatch.usgs.gov/?m=real&r=hi
12
Total Solid Waste Reduction, Aloha+ Dashboard
13
https://www.staradvertiser.com/2019/10/01/breaking-news/hawaii-county-recycling-bins-will-no-longer-accept-papers-and-plastics/
Hawai‘i Island Tourism Strategic Plan | 17Opportunity to Better Protect Our Land in the Post COVID-19 Situation
The COVID-19 situation reminds us of the importance of the health of our land going forward.
Hawai‘i’s natural beauty is a big reason why many visitors pay premium prices to travel here
and why many residents make economic sacrifices to live here. 14 Hawai‘i’s ocean quality is an
important factor in the health of the visitor industry given the importance of marine recreation
and the decrease of visitors from the COVID situation has already had a noticeable positive
change. In addition to improving the health of our ‘āina, Springer talks about how the decrease
in human activity reduces air pollution and improves the air quality for populations who are
susceptible to chronic lung disease. 15 Native Hawaiian people and cultural practitioners are
experts who can lead recovery efforts, from a much needed island perspective, that regenerates
natural resources for the āina and the people. In the ʻĀina Aloha Economic Futures Declaration,
the ʻĀina Aloha guiding principle reflects that:
“We are of and from this ʻāina that ultimately sustains us. We employ
strategies for economic development that place our kuleana to steward
precious, limited resources in a manner that ensures our long-term horizon as a
viable island people and place.” 16
As the state and Hawai‘i Island begins to reopen to visitors, adopting Native Hawaiian practices
to protect our natural resources and their health are critical to sustaining the health of our
people and by extension the health of the visitor industry.
Health of Our People
The impact of the COVID-19 situation on employment is critical to keep in mind when tracking
the health of people whose lives are being reshaped due to the loss of financial security. The
Department of Labor and Industrial Relations reported that the unemployment rate in April was
22.3% across the state and was 2.4% the month prior. It was estimated that 139,900 people
were unemployed out of a total labor force of 627,450. 17 As of 2019, the unemployment rate in
the County was 3.5%, which is an improvement since 2010 when the rate was 9.8%. 18
However, the COVID-19 situation resulted in many people experiencing firsthand a loss of
critical income because of the number of jobs dependent on tourism. Employment in
occupations related to the visitor industry (Accommodations, Food Service, Arts and
Entertainment, and Retail Trade) account for 30% of jobs across all industries. 19 The County
received over 31,929 unemployment claims from mid-March until the end of May 2020 20 and in
14
2016 Hawaiʻi Island Tourism Roadmap
15
https://kawaiola.news/cover/envisioning-a-new-normal/
16
https://www.ainaalohafutures.com/declaration
17
Hawaiʻi’s Unemployment Rate at 22.3% in April, Department of Labor and Industrial Relations
18
UHERO Data Portal, Employment
19
Employment Projects for Industries and Occupations 2016-2026 (pg.4) https://www.hiwi.org/admin/gsipub/htmlarea/uploads/Long-
TermProjections-2016-2026-HawCty.pdf
20
UHERO Hawaiʻi High Frequency Economic Data
Hawai‘i Island Tourism Strategic Plan | 18April unemployment was estimated to be 24%. UHEROʻs baseline forecast projects
unemployment to be 22% overall for 2020, 11.6% for 2021, and 7.8% for 2022. 21
48% were either living below the federal poverty level or
classified as ALICE, which means they earn less than
the basic cost of living for the county.
The COVID-19 situation exacerbates the situations of many families on Hawai‘i Island. In 2018,
the County resident population was 200,980 and in recent years the annual growth rate has
dropped below 1%. 22 The United Way reported that there were 71,565 households in 2018. 23
Out of those households 48% were either living below the federal poverty level or classified as
Asset Limited, Income Constrained, Employed (ALICE), which means they earn less than the
basic cost of living for the county. The County’s percentage was 6% higher than the state
average, which was 42% in 2018. Town-level data reveal that the distribution of ALICE
households vary across the county. Prior reports in 2016 show that ALICE and below-the-
poverty-level households were the most concentrated in towns such as Pahoa-Kalapana (78%,
4,136 households), Kau (77%, 2,860 households), and Keaau-Mountain View (72%, 12,341
households). 24 In the towns that have the most households in the county, Hilo (60%, 16,432
households) and North Kona (52%, 14,163 households), more than half are ALICE or living
below the poverty level. The above unemployment numbers indicate the increasingly precarious
situation for families on Hawai‘i Island and their physical, emotional, mental, and spiritual health.
Residents Feel the Visitor Industry Brings More Problems Than Benefits
“If we going to share with visitors it must come from a
place of abundance.” 25
Before the COVID-19 situation, residents’ attitude toward the visitor industry had been
deteriorating on the state and County level. Between 2010 to 2019, the percentage of County
residents that completely agree that tourism has brought more benefits than problems had
dropped by 24%. There was also a 5% increase of residents who feel that the island is being
run for tourists at the expense of local people.
21
Battered by COVID-19, Hawaiʻi Begins to Reopen, UHERO Forecast with Scenario Analysis
22
UHERO Data Portal, Resident Population
23
ALICE in Hawaiʻi County, 2018
24
ALICE in Hawaiʻi County, 2016
25
2-4-2020 Honokaʻa Talk Story
Hawai‘i Island Tourism Strategic Plan | 19Hawaiʻi County Statewide Sentiments
Sentiments (% Completely Agree or
(% Completely Agree) Agree)
2010 26 2019 27 20109 201910
Tourism Has Brought More Benefits 44% 20% 67% 58%
Than Problems
This Island is Being Run For 12% 17% 50% 64%
Tourists at the Expense of Local
People
County residents who were surveyed felt that tourism created the following problems: 28
● Traffic Problems (68% of residents)
● Damage to Environment (56% of residents)
● Overcrowding (56% of residents)
● No Respect for Culture/ʻĀina (56% of residents)
The increasing number of visitors arriving each year, coupled with the limited type of
accommodations, play a significant role and intensifies the major issues felt by residents listed
above. While the number of arrivals has traditionally represented a success metric for the visitor
industry, this TSP focuses on how the influx of arrival numbers is threatening the health of the
land and people of Hawaiʻi Island.
Need for Broader Health Considerations in the Post COVID-19 Situation
“Pay closer attention to how we are being “packaged” and sold. Industry is
foreign owned and operated by transplants.”29
Many families will continue to struggle as the state and County reopens following the COVID-19
situation. As a result, there are a variety of considerations to take into account for the health of
our people. In addition to the above ALICE data, the County’s Social Vulnerability Index (SVI),
created by the Centers for Disease Control and Prevention, has declined in 2018 (SVI of 0.58)
since 2000 (SVI of 0.74). SVI scores range from 0 (least vulnerable) to 1 (most vulnerable). The
score considers fifteen variables such as poverty, vehicle access, and housing to measure the
resilience of communities during emergency situations like natural disasters or disease
outbreaks. The County’s SVI decline represents movement in the right direction, however,
26
HTA Resident Sentiment Survey 2012
27
HTA Resident Sentiment Survey 2019
28
HTA Resident Sentiment Survey 2019
29
9-11-19 HTA Kūkulu Ola & Aloha ʻĀina Contractors Meeting
Hawai‘i Island Tourism Strategic Plan | 20social vulnerability will need to be further managed given the tremendous impact that COVID-19
has had on people’s capacity to stay employed and earn a living wage.
Recovering from the situation brought on by the pandemic means restoring employment,
creating opportunities for more people to earn a living wage above the poverty line, as well as
the ALICE threshold, mitigating people’s vulnerability to disasters that impact the visitor industry,
and taking into account mental, emotional, and spiritual health. Recovery efforts can build on
the various recovery movements that already have momentum. Some of the many examples
that lift up the health of people include:
● ʻĀina Aloha Economic Futures Declaration represents a set of principles for economic
recovery drafted by a group of Native Hawaiian community members who feel the need
to have Native Hawaiian voices, values, and experiences influence the path towards
ʻāina aloha. 30
● Building Bridges, Not Walking on Backs is a “Feminist Economic Recovery Plan for
COVID-19” that highlights the impact that the COVID-19 situation has on the lives of
women who rely on tourism and the effect it will have on maternal health, childcare, and
kūpuna caregiving. 31
● Uplift Hawaiʻi supports a culturally grounded and sustainable tourism model that benefits
local residents’ quality of life by prioritizing health, preventing overcrowding, rooting
experiences in Native Hawaiian values, and strengthening our natural resources. 32
● Larrakia Declaration on the Development of Indigenous Tourism contains one principle
that focuses on equitable partnerships between the visitor industry and indigenous
people that support the well-being of communities. 33
Many communities and leaders are poised and organized to take further action in transforming
the visitor industry to lift up healthy people.
Health of Our Industry
The COVID-19 situation has had a devastating negative effect on the health of the visitor
industry. In the County, there was a 53% reduction of visitors in March 2020 compared to the
period prior. Arrivals were recorded at 70,000 in March 2020 compared to 149,000 the period
prior. 34 By April there was a complete halt on arrivals when the County recorded just 705
arrivals. When compared to the combined impact of the eruption of Kīlauea and Hurricane
Lane, where arrivals fell to 135,000 in December 2018, COVID-19 has had a significant impact
on the visitor industry unlike any other event experienced in recent history. As depicted in the
graph below, March 2020 arrivals were lower than they were in the 2008 recession when
arrivals fell to 95,000 in February 2009.
30
https://www.ainaalohafutures.com/declaration
31
Hawaiʻi State Commission on the Status of Women, Department of Human Services State of Hawaiʻi
32
https://www.uplifthawaii.org/
33
2012 Larrakia Declaration on the Development of Indigenous Tourism
34
HTA Visitor Statistics Released for March and April 2020
Hawai‘i Island Tourism Strategic Plan | 21The County also experienced a reduction of nearly half (-44%) of the expenditures received
from visitor spending in March 2020 compared to the prior year. 35 Total expenditures were
recorded at $92 million in March 2020 compared to $165 million the year prior. Since
expenditures are related to arrival numbers, expenditures during COVID also fell to its lowest
point as depicted in the graph below. Expenditures for April were not reported likely due to the
98% drop in arrivals for that month. Other disasters were recorded at $106 million in February
2009 during the recession and $159 million in April 2019, the worst performing month following
the natural disasters of 2018.
35
UHERO Data Portal, Total Visitor Expenditures
Hawai‘i Island Tourism Strategic Plan | 22Need to Balance Visitor Arrivals and Expenditures Prior to COVID-19
Number of visitors and visitor expenditures are two traditional indicators of industry health and
coupled with the rise in negative resident sentiment discussed earlier indicates that there is a
greater need to balance these indicators in more responsible ways. When looking at visitor
arrival numbers between 2009 to 2019, tourism around the world grew at an average annual
rate of 5.1%. 36 The UNWTO recorded 1.5 billion visitor arrivals in 2019 compared to 952 million
in 2010. The global economy expanded during the period between the 2008 recession and the
COVID-19 situation and the number of arrivals in Hawaiʻi Island grew almost every year.
Changing conditions for air travel were creating more opportunities for travel and created a need
to better manage future overcrowding for the health of our land and health of our people. The
UNWTO has identified how an increase in new connecting flights between cities as well as an
increase in eVisas and “visas on arrival” are among different factors for growth. The HTA 2020-
2025 Strategic Plan states that “a strong commitment from Hawai‘i’s airline partners has
resulted in a consistent increase in air seats to the state over the last nine years.” 37 For Hawaiʻi
Island, one factor that promoted visitor arrivals was the 29% increase in air seats to the island in
2018, which was 302,554 more seats than 2017. 38 Southwest Airlines, for example, introduced
competitive fares for domestic and inter-island travel and has provided more opportunity for
36
https://www.unwto.org/global-and-regional-tourism-performance
37
HTA Strategic Plan 2020-2025
38
2018 Annual Visitor Research Report
Hawai‘i Island Tourism Strategic Plan | 23visitors from the U.S. West major market area to travel to Hawai‘i. In 2019 the visitor census, or
average daily visitor population in the County, was estimated to be 35,750. 39 Provided that the
County resident population was 200,980 in 2018 and grew by 1% then, on average, visitors
comprised about 15% of all inhabitants on the island in 2019. This percentage was probably
even higher during the peak months of visitor travel.
The past increase in air arrivals indicated a need for better management of visitor arrivals and
past disasters demonstrate the opportunity for changes to occur with the current COVID-19
situation. The Economic Research Organization at the University of Hawaiʻi (UHERO) reported
close to 1.8 million air arrivals in 2019 compared to 1.3 million in 2010. 40 Although Hurricane
Lane and the eruption of Kīlauea in 2018 decreased the number of visitor arrivals by air to
Hawaiʻi Island that year by almost 61,000 people, the average annual rate of visitors to the
island still grew by 3.9% from 2010 to 2019. The reduced number of air arrivals in 2018 due to
the lava event resulted in $2.3 billion, $39 million less in visitor expenditures for the County
compared to the previous year, a negative change of -1.6%. 41 However, in 2010, the County
recorded only $1.6 billion in expenditures. Therefore, between 2010 to 2019, the average
annual growth rate was 4.8%. This growth was largely due to strong gains in 2010 (10%), 2012
(11%), 2016 (12%), and 2017 (11%).
The number of visitors discussed above do not account for cruise ships, which also bring a large
number of visitors in concentrated periods of time. From 2010 to 2018, Hawai‘i Island's annual
number of visitors who arrived by cruise ship has remained fairly constant (0.1% average
annual rate). Nevertheless, roughly 236,000 visitors come to Hawaiʻi Island each year spending
two days on-island, one day in Hilo and one in Kona. On average, this means approximately
4,500 visitors per week add to the total visitor census.
While the graph below shows a correlation between the increase in arrival numbers with the
increase in visitor expenditures between 2009 and 2019 for the County, there have also been
individual years with an inverse relationship, which pushes the need for a more nuanced
analysis of these indicators. Recently, in 2019, there was an intersection between these lines,
which means that expenditures have declined while arrivals grew. A similar outcome occurred in
2015 when expenditures fell compared to the year prior and the County hosted more visitors.
These years may represent opportunities to do more research and learn what caused a
decrease in spending per visitor. Similarly, research can also investigate years when arrival
numbers were low and expenditures were high (2013 and 2014) to understand what caused an
increase in spending per visitor.
Recently, in 2019, there was an intersection between these lines, which
means that expenditures have declined while arrivals grew.
39
UHERO Data Portal, Average Daily Census
40
UHERO Data Portal, Total Visitor Arrivals
41
2018 DBEDT Historical Visitors
Hawai‘i Island Tourism Strategic Plan | 24Important to Better Manage Accommodation Options
Managing accommodations units, including hotel units and short term vacation rentals (STVRs),
is critical for promoting residents’ health and supporting the health of the industry. In 2019,
Hawai‘i Island had approximately 10,505 visitor units, a decrease of 3% over the previous
year. 42 The number of visitor units decreased since the formulation of the 2006-2015 Hawaiʻi
Island Tourism Strategic Plan, which was 11,351 visitor units in 2005. Of these units, hotels
continue to comprise a majority (5,782 units or 55%) of Hawaiʻi Island’s inventory of visitor
accommodations in 2019. Bill 108, passed by the County Council in 2018, created new
definitions and regulations for where STVRs are allowed, how they are used, and what actions
existing STVR owners need to take to continue their operations. 43 In 2019, STVR comprised
19% (1,992 units) of accommodations on Hawaiʻi Island. Determining the mix of accommodation
units based on the health of our land and the health of our people will be critical for the health of
the industry.
In 2019, Hawai‘i Island had approximately 10,505 visitor
units, a decrease of 3% over the previous year. 44
Recent occupancy rates for both hotels and STVRs provide a glimpse at the impact of the
COVID-19 situation and an opportunity to plan ahead for the health of the industry as well as the
42
2019 Visitor Plant Inventory
43
County of Hawaiʻi Planning Department, http://www.hiplanningdept.com/short-term-vacation-rentals/
44
2019 Visitor Plant Inventory
Hawai‘i Island Tourism Strategic Plan | 25health of our people. In 2019, the average hotel occupancy rate throughout the year was 77%. 45
Occupancy rates reach their highest during July (84%) and their lowest during September
(68%). In March 2020, during the peak of COVID-19, hotel occupancy rates declined to 46.1%,
which is a -33% change compared to the year prior. 46 In March 2020, during the peak of
COVID-19, the occupancy rate for STVUs was 66%, which is a -8% change compared to the
year prior. 47 According to HTA, social media and STVRs have also opened up access to new
residential areas where irresponsible visitor behavior remains unchecked. 48 As new regulations
take effect alongside the evolution of the pandemic, tracking which accommodations visitors
choose to stay will be critical for managing tourism. It will also be helpful to capture if themes
arise on defining features of visitors who stay in STVRs and in hotels or other traditional visitor
accommodations, including their interests, where they spend their money, how much they
spend, and so forth.
Growing Popularity of Hawai‘i Island Based on Visitor Behavior and Satisfaction
“People generally want to be respectful, but they don’t know how.” 49
Hawai‘i Island appears to have been growing in popularity amongst visitors as indicated by
length of stay and the number of visitors coming only to Hawai‘i Island. On average, visitors
stayed for about a week (7.4 days) on the island in 2019. 50 About half of visitors only traveled to
visit Hawaiʻi Island, the other half continued their trip to visit one other island. 51 The average
annual growth rate of visitors arriving at Kona International Airport from 2010 to 2018 is about
4%. In 2018, approximately 1.5 million visitors arrived at Kona compared to 601,000 who arrived
at the Hilo International Airport. From 2010 to 2018, visitors have been arriving at Hilo at a
slower annual rate (2.6%) compared to visitors arriving in Kona.
A significant proportion of visitors to Hawai‘i Island traversed the island, which indicates
distance may not be an issue. The HTA Visitor Satisfaction Study Q3 2019 shows that for
visitors from all major market areas who visited Hawaiʻi Island, about 29% of them traveled to
the other side of the island. 52 Another 27% of visitors traveled more than one hour and the
remaining 45% of visitors either traveled one hour or less (one way) to reach an activity or
enjoyed activities that were a short drive from their accommodations.
Hawai‘i Island’s natural attractions topped the list for visitor activities, which underscores the
importance of the health of land and caring for the island’s natural resources. Hawaiʻi Volcanoes
National Park was the most popular activity among visitors (52%) from each major market area
(U.S. West/East, Japan, Canada, Europe, Oceania, China), aside from Korea. The most popular
activity for visitors (34%) from Korea was the Kona Coffee Living History Farm. Based on the
45
UHERO Data Portal, Hotel Occupancy Rate
46
HTA March 2020 Hawaiʻi Hotel Performance Report
47
HTA March 2020 Hawaiʻi Vacation Rental Performance Report
48
From: HTA Strategic Plan 2020-2025
49
9-11-19 HTA Kūkulu Ola & Aloha ʻĀina Contractors Meeting
50
UHERO Data Portal, Length of Stay
51
2018 Annual Visitor Research Report
52
HTA Visitor Satisfaction Study Q3 2019
Hawai‘i Island Tourism Strategic Plan | 26average percent of visitor participation from each major market area, Punalu‘u Black Sand
Beach (28%), ‘Akaka Falls (25%), Rainbow Falls (25%), and Mauna Kea (19%) were the other
most popular attractions.
Visitor satisfaction numbers also indicate the potential for the visitor industry and the draw
Hawai‘i Island has in its current state. The 2019 study also shows that 79% of visitors from all
major market areas rated that they were “extremely satisfied” regarding their overall satisfaction
to their most recent trip to the state of Hawaiʻi. 53 When compared to 2018 third quarter results,
there was a 2% increase in overall satisfaction as every major market area resulted in an
improved score or remained stable. Overall visitor satisfaction for Hawaiʻi Island was higher for
the same quarter, a score of 84%. The visitor satisfaction score for Hawaiʻi Island actually
improved each year by 2% since the third quarter of 2016.
The visitor satisfaction score for Hawaiʻi Island actually
improved each year by 2% since the third quarter of 2016
COVID-19 Forecast as an Opportunity to Reimagine Tourism
The COVID-19 situation has disrupted recent positive forecasts for visitor arrivals and
expenditures, which creates a window of opportunity for the County to lift up the health of our
land and people as it rebuilds the health of the industry. Before the COVID-19 situation, the
primary driver for international tourism had been the growth of the global economy. However,
during the peak of the pandemic, UNWTO reports that international visitor arrival numbers have
declined to 46 million in March 2020, which was recorded at 107 million the year prior (-57%). 54
Tourism Economics’ “downside scenario” forecasts 263 million fewer global arrivals in 2020
than the year prior, a change of -17.9%. 55 The downside scenario considers travel restrictions
that were imposed in various countries and could be a potential scenario if coronavirus cases
reemerge. Assuming this downside scenario occurs, the decline in global arrivals could be
similar numbers in 2015 when 1.2 billion arrivals and 1.2 trillion international visitor receipts
were recorded.
Current studies forecast a dramatic decrease in visitor arrivals in the next year and paints an
uncertain picture of the industry’s future. However, it presents an opportunity to reinvent tourism
on Hawaiʻi Island so that it is aligned with the community’s values and helps to conserve natural
and cultural resources.
“Get every executive to understand that they do not get to make
choices, and that we demand that culture has a seat at the table.” 56
53
HTA Visitor Satisfaction Study Q3 2019
54
UNWTO International Tourism & COVID-19,https://www.unwto.org/international-tourism-and-covid-19
55
Tourism Economics Travel & Tourism Global, COVID-19: updated outlook and pandemic impacts
56
HTA Cultural Resources Meeting 11-20-19
Hawai‘i Island Tourism Strategic Plan | 27You can also read