Carbon Sequestration and Irish Forest Ecosystems - Edited by Kevin G. Black and Edward P. Farrell
←
→
Page content transcription
If your browser does not render page correctly, please read the page content below
Carbon Sequestration
and Irish Forest Ecosystems

Edited by Kevin G. Black and Edward P. Farrell
COFORD, National Council for Forest Research and Development
Arena House
Arena Road
Sandyford
Dublin 18
Ireland
Tel: + 353 1 2130725
Fax: + 353 1 2130611
© COFORD 2006

First published in 2006 by COFORD, National Council for Forest Research and Development, Dublin, Ireland.

All rights reserved. No part of this publication may be reproduced, or stored in a retrieval system or transmitted in any form or by any means,
electronic, electrostatic, magnetic tape, mechanical, photocopying recording or otherwise, without prior permission in writing from COFORD.

ISBN 1 902696 48 4

Title:     Carbon sequestration and Irish forest ecosystems.
Editors:   Kevin G. Black and Edward P. Farrell

Citation: Black, K.G. and Farrell, E.P. (eds). 2006. Carbon sequestration and Irish forest ecosystems. COFORD, Dublin.

The views and opinions expressed in this publication belong to the authors alone and do not necessarily reflect those of COFORD.
i

                                             Foreword
Ireland’s rapidly expanding economy has, over the period since 1990, pushed emissions of greenhouse gases
to well over the level the country signed up to in the Kyoto Protocol. Government policies to counteract this
trend are rightly focused on reducing consumption of fossil fuels, changes in agricultural practices and a range
of other measures, including the use of wood energy.
   Along with reductions in emissions arising the areas outlined forests have a well defined role in mitigating
climate change, as a land use that sequesters and stores atmospheric carbon dioxide, the main greenhouse gas,
as a provider of energy efficient wood materials, and as a source of clean, renewable wood fuel.
   Carbon sequestration was the focus of the work funded by COFORD in the CARBiFOR project, carried
at University College Dublin, and reported here. Using a range of approaches, the team has done valuable
work in updating estimates of carbon uptake in the main forest type – Sitka spruce, across a range of age
classes. Innovative and challenging research has also been undertaken on ecosystem level uptakes and fluxes
of greenhouse gases - work that has been linked to international efforts in gaining a deeper understanding of
how forest ecosystems interact with the global climate. New information and insights have also been gained
on forest soils and their carbon dynamics.
   Linking research to policy development is a key task of nationally funded R&D programmes. CARBiFOR
has been of great value in this arena: in providing input to guide the development of afforestation policy and,
of course, in the climate change area itself, including the emissions trading scheme. The work has been
instrumental in providing estimates of annual sequestration rates over the period 2008-2012. Without
CARBiFOR, estimates of changes in forest carbon stocks would be on a far weaker footing, which would
have direct economic consequences for Ireland in terms of purchases of carbon credits.
   Expertise development is another important task of national R&D funding. CARBiFOR has proven to an
excellent investment from this perspective - not only have team members achieved post-graduate
qualifications and published extensively, but they have also been part of the team that has developed the
national forest carbon reporting system to an international standard. They have also been active in developing
land use reporting processes under the Intergovernmental Panel on Climate Change.
    Forests have an important role to play in future climate change polices. At the global level the main need
is to reduce tropical deforestation, and the greenhouse gases that arise when these forests are converted to
food production. How forests adopt to climate change is another important area for the future – as is the role
that forests may have in helping adaptation strategies, such as flood control.
   Continued national investment is required in researching climate change mitigation and adaptation by
forest ecosystems, and in building reporting systems that will add to the work described in this important
report.

David Nevins                                                                                Eugene Hendrick
Chairman                                                                                    Director
ii
Brollach
Mar gheall ar fhorbairt ghasta gheilleagar na hÉireann thar an tréimhse ó 1990, tá astuithe de gháis cheaptha
teasa á mbrú go maith thar an leibhéal ar shínigh an tír dó i bPrótacal Kyoto. Mar is cóir, tá polasaithe an
Rialtais leis an treocht seo a chealú dírithe ar thomhailt na mbreoslaí iontaise a laghdú, athruithe a dhéanamh
ar chleachtais talmhaíochta agus raon bearta eile, lena n-áirítear fuinneamh adhmaid a úsáid.
Chomh maith le laghduithe ar astuithe ag teacht ó na rudaí thuasluaite, tá ról soiléir ag foraoisí maidir le
hathrú aeráide a mhaolú, cionn is gur úsáid thalaimh iad a leithlisíonn agus a stórálann dé-ocsaíd charbóin
atmasféarach, an príomhghás ceaptha teasa, a chuireann ábhair adhmaid atá tíosach ar fhuinneamh ar fáil,
agus atá ina foinse breosla adhmaid, breosla atá glan inathnuaite.
Bhí leithlisiú carbóin mar fhócas ag an obair a mhaoinigh COFORD sa tionscadal CARBiFOR, a rinneadh
ag Coláiste Ollscoile Bhaile Átha Cliath, agus a thuairiscítear anseo. Ag úsáid réimse leathan modhanna oibre,
tá obair luachmhar déanta ag an fhoireann le meastacháin ar thógáil charbóin a nuashonrú sa phríomhchineál
foraoise – is é sin an sprús Sitceach, thar réimse d’aicmí aoise. Tá taighde dúshlánach nuálaíoch déanta chomh
maith ar thógáil agus floscanna de gháis theach ghloine ar leibhéal an éiceachórais - obair atá nasctha le
hiarrachtaí idirnáisiúnta chun tuiscint níos doimhne a bhaint amach faoin dóigh a mbíonn éiceachórais
fhoraoise ag idirghníomhú leis an aeráid dhomhanda. Fuarthas eolas agus léargais úra chomh maith faoi ithir
fhoraoise agus an dinimic charbóin a bhaineann léi.
Ar cheann de na tascanna is tábhachtaí atá ag na cláir thaighde agus forbartha a mhaoinítear go náisiúnta,
tá an taighde a nascadh le forbairt pholasaí. Bhí CARBiFOR an-luachmhar maidir leis seo: ag soláthar
ionchuir leis an pholasaí coilltithe a stiúradh, agus ar ndóigh, i limistéar athraithe aeráide é féin, lena n-áirítear
scéim trádála na n-astuithe. Bhí an obair seo ina shiocair le meastacháin a chur ar fáil de rátaí bliantúla
leithlisithe thar an tréimhse 2008-2012. Murach CARBiFOR, bheadh bunús i bhfad níos laige faoi
mheastacháin d’athruithe ar stoic charbóin fhoraoise, rud a mbeadh torthaí díreacha eacnamaíocha acu
d’Éirinn maidir le sochair charbóin a cheannach.
Feidhm thábhachtach eile atá ag an mhaoiniú náisiúnta ar thaighde agus fhorbairt ná scileanna a fhorbairt.
Chruthaigh CARBiFOR gur infheistíocht den scoth a bhí ann ar an dóigh seo – ní hamháin gur ghnóthaigh
baill den fhoireann cáilíochtaí iarchéime agus go bhfuil cuid mhór foilsithe acu, bhí siad ina gcuid den
fhoireann a d’fhorbair córas tuairiscithe carbóin na bhforaoisí náisiúnta go caighdeán idirnáisiúnta. Bhí siad
gníomhach fosta i bpróisis thuairiscithe úsáid thalún a fhorbairt faoin Phainéal Idir-rialtais ar Athrú Aeráide.
Tá ról tábhachtach le himirt ag foraoisí i bpolasaithe amach anseo maidir le hathrú aeráide. Ar an leibhéal
domhanda, is é an gá is mó ná dífhoraoisiú trópaiceach a laghdú, chomh maith leis na gáis ceaptha teasa a
dhéantar nuair a thiontaítear na foraoisí seo chun bia a tháirgeadh. Rudaí tábhachtacha eile don am le teacht
ná an dóigh a gcuireann foraoisí iad féin in oiriúint don athrú aeráide, agus an ról a thiocfaí a bheith ag foraoisí
i straitéisí oiriúnaithe, amhail tuilte a smachtú.
Tá gá le hinfheistíocht náisiúnta leanúnach a dhéanamh i dtaighde ar mhaolú athraithe aeráide agus oiriúnú
ag éiceachórais fhoraoise, agus i gcórais thuairiscithe a thógáil a chuirfidh leis an obair a ndéantar cur síos air
sa tuairisc thábhachtach seo.
David Nevins Eugene Hendrick
Cathaoirleach Stiúrthóiriii
Contents
FOREWORD . . . . . . . . . . . . . . . . . . . . . . . . . . . . . . . . . . . . . . . . . . . . . . . . . . . . . . . . . . . . . . . . . . . . . . . . . . . . . . . . .i
BROLLACH . . . . . . . . . . . . . . . . . . . . . . . . . . . . . . . . . . . . . . . . . . . . . . . . . . . . . . . . . . . . . . . . . . . . . . . . . . . . . . . . .ii
EXECUTIVE SUMMARY . . . . . . . . . . . . . . . . . . . . . . . . . . . . . . . . . . . . . . . . . . . . . . . . . . . . . . . . . . . . . . . . . . . . . .v
ACHOIMRE FHEIDHMEANNACH . . . . . . . . . . . . . . . . . . . . . . . . . . . . . . . . . . . . . . . . . . . . . . . . . . . . . . . . . . . . .vi
LIST OF ABBREVIATIONS AND TERMS . . . . . . . . . . . . . . . . . . . . . . . . . . . . . . . . . . . . . . . . . . . . . . . . . . . . . . .vii
CHAPTER 1: INTRODUCTION . . . . . . . . . . . . . . . . . . . . . . . . . . . . . . . . . . . . . . . . . . . . . . . . . . . . . . . . . . . . . . . . .1
Kenneth A. Byrne and Kevin G. Black
CHAPTER 2: SOIL CARBON FLUXES . . . . . . . . . . . . . . . . . . . . . . . . . . . . . . . . . . . . . . . . . . . . . . . . . . . . . . . . . . .7
Gustavo Saiz, Kenneth A. Byrne and Edward P. Farrell
CHAPTER 3: SOIL STOCKS AND SOIL PROCESSES . . . . . . . . . . . . . . . . . . . . . . . . . . . . . . . . . . . . . . . . . . . . .19
Brian Reidy, Jens Dyckmans, Olaf Schmidt and Tom Bolger
CHAPTER 4: BIOMASS EXPANSION FACTORS AND FOREST BIOMASS C STORES . . . . . . . . . . . . . . . . .29
Brian Tobin, Kevin G. Black, Maarten Nieuwenhuis and John Gardiner
CHAPTER 5: ECOSYSTEM PROCESSES . . . . . . . . . . . . . . . . . . . . . . . . . . . . . . . . . . . . . . . . . . . . . . . . . . . . . . .41
Kevin G. Black, Brian Tobin and Bruce Osborne
CHAPTER 6: RELATED STUDIES . . . . . . . . . . . . . . . . . . . . . . . . . . . . . . . . . . . . . . . . . . . . . . . . . . . . . . . . . . . . . .55
A) BIOMASS STOCKS IN YOUNG SITKA SPRUCE AND LODGEPOLE PINE STANDS . . . . . . . . . .55
Brian Tobin and Carly Green
B) A COMPARISON OF CO2 FLUXES FROM THREE IRISH LAND-USE CATEGORIES: ARABLE,
GRASSLAND AND FORESTRY . . . . . . . . . . . . . . . . . . . . . . . . . . . . . . . . . . . . . . . . . . . . . . . . . . . . . . .57
Kevin G. Black, Phill Davis, Mike Jones and Bruce Osborne
C) CONTINENTAL-SCALE δ13C AND δ18O ISOTOPE SIGNATURES OF FOREST ECOSYSTEMS:
RESULTS FROM A EUROPEAN NETWORK . . . . . . . . . . . . . . . . . . . . . . . . . . . . . . . . . . . . . . . . . . . .58
Deborah Hemming and Kevin G. Black
CHAPTER 7: IMPLICATIONS FOR NATIONAL REPORTING . . . . . . . . . . . . . . . . . . . . . . . . . . . . . . . . . . . . . . .61
Kevin G. Black, Kenneth A. Byrne and Gerhardt Gallagher
REFERENCES . . . . . . . . . . . . . . . . . . . . . . . . . . . . . . . . . . . . . . . . . . . . . . . . . . . . . . . . . . . . . . . . . . . . . . . . . . . . . .67iv
Acknowledgements
The CARBiFor team would like to thank John O’Sullivan and John O’Brien, Coillte Portlaoise, for their
assistance in the selection of sites and the setting up of the flux tower site. Thanks are also extended to
COFORD for funding this project.v
Executive Summary
Under the agreed terms of the Kyoto Protocol, carbon sequestration by forests may be used to offset
greenhouse gas emissions. In the Irish context, carbon sequestration which is eligible for Kyoto
compliance purposes refers to afforestation activities since 1990. The primary objective of the
CARBiFOR project was to provide data to enable the level of such offsets to be determined. It provided
data on carbon (C) stocks and sequestration rates, spanning the entire life cycle of the main forest type in
Ireland, for national reporting.
Based on inventory, eddy covariance and other physiological methods, the average C sequestration
rate over the entire life cycle of a selected chronosequence (10 to 50 year old stands) was estimated to be
4 to 8 t C ha-1 yr-1. This value is higher than a previously reported average estimate of 3.36 t C ha-1 yr-1
(Kilbride et al. 1999). The higher average sequestration rate reported in this study was due to the use of
improved biomass models, particularly for younger Sitka spruce stands. Afforested wet mineral soils also
represent a significant C sink of 0.05 to 1 t C ha-1 yr-1. However, changes in soil C stocks may be more
difficult to measure in highly organic soils, such as peats, because of the high background soil C.
The information available from the CARBiFOR project has now been used to improve the
CARBWARE model to report national forest C stock changes. The new estimated annual C sequestrations
rates for Irish forests are equivalent to 1.56 to 2.39 Mt CO2 yr-1 for the first commitment period 2008-
2012 (assuming an annual afforestation rate of 14000 ha), which is higher than the previously reported
CARBWARE values for the same period (1.54 Mt yr-1, ICF/Byrne Ó Cléirigh report 2004). Assuming a
business-as-usual scenario, it is estimated that the contribution of Article 3.3 forests for this period may
account for ~ 20% of the required reduction in national emissions for Ireland to meet its Kyoto target. The
CARBWARE model is constantly being improved as new research information and national inventory
data become available.
Although these results are useful for providing a baseline for the carbon sequestration potential of the
dominant forest species in Ireland, more information on C stocks and fluxes for different soil types and
associated species is required. Furthermore, the potential for integrating the work reported here as well as
future work with the ongoing National Forest Inventory, in order to improve the national C accounting
system, should be explored and implemented.
More work is required to facilitate the development of comprehensive C balance models that can be
used to simulate the effect of stand age, disturbance and climate change scenarios on forest C fluxes. The
development of these models would be aimed at end users, such as forest managers and policy makers,
to aid in management decisions, reporting procedures to the UNFCCC and climate change risk
assessments. Beyond changes associated with stand age, there is a need to incorporate an analysis of the
effects of disturbances, particularly those related to management practices (e.g. thinning) and land-use
change, such as the transition from grassland to forest.vi
Achoimre Fheidhmeannach
Faoi théarmaí a aontaíodh de réir Phrótacal Kyoto, is féidir leithlisiú carbóin ag foraoisí a úsáid chun
astuithe de ghás ceaptha teasa a chúiteamh. I gcomhthéacs na hÉireann, is é an leithlisiú carbóin atá
incháilithe chun críche cloí le Kyoto ná gníomhaíochtaí coilltithe ó 1990. Ba í príomhchuspóir
thionscadal CARBiFOR ná sonraí a chur ar fáil le leibhéal an chúitimh den sórt sin a chinntiú. Chuir sé
sonraí ar fáil faoi stoic charbóin (C) agus rátaí leithlisithe, a mhaireann thar thimthriall iomlán saoil an
phríomhchineáil fhoraoise in Éirinn, faoi choinne tuairiscithe náisiúnta.
Bunaithe ar fhardal, comhathraitheas guairneáin agus modhanna fiseolaíochta eile, measadh gurbh é
gnáthráta leithlisithe carbóin thar thimthriall iomlán de chróinisheicheamh áirithe (clampaí 10 go 50
bliain) ná 4 go dtí 8 t C ha-1 yr-1. Tá an luach seo níos airde ná an meánmheastachán a tuairiscíodh roimhe
seo de 3.36 t C ha-1 yr-1 (Kilbride et al. 1999). Bhí an meánráta leithlisithe ní b’airde a tuairiscíodh sa
staidéar seo le cur síos d’úsáid samhlacha bithmhaise níos fearr, go háirithe do chlampaí níos óige de
sprús Sitceach. Is féidir le hithir fhliuch mhianra bheith ina ndoirteal substaintiúil carbóin de 0.05 go 1 t
C ha-1 yr-1. Bíodh sin mar atá, is féidir le hathruithe i stoic charbóin ithreach a bheith níos deacra a
thomhas in ithir an-orgánach, mar mhóin, mar gheall ar an leibhéal ard carbóin sa chúlra san ithir féin.
Tá úsáid bainte as an tionscadal CARBiFOR anois leis an tsamhail CARBWARE a fheabhsú le
hathruithe stoic C i bhforaoisí náisiúnta a thuairisciú. Is ionann na rátaí bliantúla measta leithlisithe C
d’fhoraoisí na hÉireann ná 1.56 go 2.39 Mt CO2 yr-1 don chéad tréimhse thiomantais 2008-2012 (ag
glacadh leis go bhfuil ráta bliantúil coilltithe de 14000 heicteár ann). Tá sé seo níos airde ná na luacha
CARBWARE a tuairiscíodh roimhe seo don tréimhse chéanna (1.54 Mt yr-1, ICF/Byrne Ó Cléirigh -
tuairisc 2004). Ag glacadh leis nach dtarlóidh mórathrú ar bith, meastar gurb ionann foraoisí Alt 3.3 ná
20% den laghdú ar astuithe a bheadh de dhíth le sprioc na hÉireann faoi Kyoto a bhaint amach. Tá múnla
CARBWARE á fheabhsú go leanúnach de réir mar a chuirtear níos mó faisnéise agus sonraí fardail
náisiúnta ar fáil.
Cé go bhfuil na torthaí seo úsáideach sa dóigh is go gcuireann siad bunlíne ar fáil faoi acmhainn
leithlisithe carbóin na príomhspéiceas foraoise in Éirinn, tá níos mó faisnéise de dhíth ar stoic agus ar
fhloisc charbóin do chineálacha difriúla ithreach agus na speicis a bhaineann leo. Lena chois sin, ba chóir
na féidearthachtaí atá ann a fhiosrú agus a chur i bhfeidhm leis an obair a thuairiscítear anseo agus obair
san am le teacht a chomhlánú leis an Fhardal leanúnach Náisiúnta Foraoise, d’fhonn córas cuntasaíochta
náisiúnta carbóin a fheabhsú.
Tá tuilleadh oibre de dhíth chun forbairt samhlacha cuimsitheacha de chothramaíocht charbóin a
éascú, samhlacha arbh fhéidir a úsáid le héifeachtaí aois an chlampa, cur isteach agus cásanna athraithe
aeráide ar fhloscanna carbóin fhoraoise a ionsamhlú. Bheadh forbairt na samhlacha seo bunaithe ar
úsáideoirí deiridh, leithéidí bainisteoirí foraoise agus lucht déanta polasaithe, le cuidiú leo ina gcinntí
bainistíochta, modhanna oibre tuairiscithe leis an UNFCCC agus le measúnuithe riosca athraithe aeráide.
Taobh amuigh d’athruithe a bhaineann le haois an chlampa, tá gá le hanailís ar éifeachtaí cur isteach a
ionchorprú, go háirithe iad siúd a bhaineann le nósanna bainistíochta agus athrú ar úsáid talaimh (m.sh.
caolú), amhail an t-athrú ó thalamh féaraigh go foraois.vii
List of abbreviations and terms
a annum
ABEF above-ground biomass expansion factor
BEF biomass expansion factor
cm centimetre (10-2 m)
C Carbon
CAI current annual increment
CF carbon fraction
COP Conference of the Parties
D basic wood density
Da above-ground annual litter fall
Db below-ground detritus
d day
dbh diameter at breast height (1.3 m)
F-disturb disturbance related-changes
GHG green house gas
GPP gross primary productivity (or forest photosynthesis)
h height
ha hectare
IPCC International Panel and Climate Change
LULUCF Land-Use, Land-Use Change and Forestry
MDV mean diurnal variation
m metre
mg milligram (10-3 g)
NBP net biome productivity
NEP net ecosystem productivity
NPP net primary productivity
ppmv parts per million by volume
Pg Petagram (1015 g)
r2 coefficient of determination
R respiration
RH heterotrophic respiration
RA autotrophic respitation
RTOT total soil respiration
R:S root to shoot ratio
SEE standard error of estimate
SOM soil organic matter
TBCA total below-ground carbon allocation
Tg Teragram (1012 g equivalent to a ton (t))
UNFCCC United Nations Framework Convention on Climate Change
w/v weigh to volume
w/w weight to weight
y year
YC yield class (index representing potential maximum mean annual increment)
∆AGB annual change in above-ground dead plant material
∆B annual change in living biomass
∆C change in carbon stock
∆e ecosystem isotope discrimination
‰ parts per thousand
δ13C 13C isotope discrimination relative to 14Cviii
Carbon sequestration and Irish forest ecosystems                                                               1

                                              Chapter 1
                                   INTRODUCTION
                               Kenneth A. Byrne and Kevin G. Black

CLIMATE CHANGE AND POLICY                                sector for which an inventory is required. This was
                                                         followed in 1997 by the Kyoto Protocol. Its main
Weather and climate are intimately linked to life on     features are as follows:
Earth. They are essential for food production and        • 1990 is the base year against which all
health as well as being closely linked to ecosystem          emission reductions are calculated.
functioning and sustainability, infrastructure, and      • Developed countries (so-called Annex I)
property. Many consider the prospect of human-               committed to reduce annual GHG emissions to
induced climate change to be one of the foremost             5.2% below 1990 levels by the first
environmental issues facing the Earth. There is              commitment period of 2008-2012.
growing scientific evidence that human activities        • The European Union committed itself to a
are altering the climate (IPCC 2001) and this has            reduction of 8%. This burden is shared between
been attributed to increasing atmospheric levels of          member states and under this agreement
the so-called greenhouse gases (GHG) because of              Ireland is committed to limiting its GHG
their ability to absorb and re-emit infrared radiation       emissions to 13% above 1990 levels by 2008-
and so raise the temperature near the Earth’s                2012.
surface. The principal greenhouse gases are carbon       • The Protocol could only enter into force when
dioxide (CO2), methane (CH4) and nitrous oxide               ratified by at least 55% of Annex I countries,
(N2O), and since 1750 their atmospheric                      which cumulatively represent at least 55% of
concentrations have increased by 31, 151 and 17%             global GHG emissions.
respectively. About 75% of human-induced CO2             • The Protocol made provision for the use of
emissions are derived from fossil fuel burning with          carbon (C) sequestration by land-use, land-use
the remainder due to land-use change, particularly           change and forestry (LULUCF) as a means to
deforestation. CH4 is mainly produced in anaerobic           offset GHG emissions.
environments such as wetland soils, rice paddies,
landfills and the ruminant gut. The principal                The principal articles of the Kyoto Protocol that
emitters of N2O are agricultural soils, cattle feed      refer to forestry are 3.3 and 3.4. Article 3.3 refers to
lots and the chemical industry. A proper                 net changes in greenhouse gas emissions by
understanding of the cycling of greenhouse gases at      sources and removals by sinks resulting from direct
global, regional and national level is a vital           human-induced afforestation, reforestation and
prerequisite to attempts to mitigate, respond to and     deforestation which have taken place since 1990;
predict the effects of climate change.                   Article 3.4 refers to additional human-induced
                                                         activities in the agriculture, land-use change and
   The United Nations Framework Convention on            forestry sectors. The rules for the implementation
Climate Change (UNFCCC), agreed at the Earth             of the Kyoto Protocol were agreed at the Seventh
Summit in Rio de Janeiro in 1992, was the first          Conference of the Parties (COP7) at Marrakesh in
major attempt to deal with climate change. While it      November 2001. Under this agreement, there is no
did not set targets for the reduction of greenhouse      limit to the amount of credits a Party may accrue
gas emissions, Parties to it (including Ireland) are     from Article 3.3 while limits have been placed on
required to develop, publish, update and make            the amount of credits which can be obtained from
available national inventories of GHG emission by        forest management under Article 3.4; for Ireland
sources and removals by sinks. Forests are one           this limit is set at 50,000 t C yr-1 during the first
2 Carbon sequestration and Irish forest ecosystems
commitment period, i.e. 2008-2012. Furthermore organic matter (SOM) C pool is the largest and
all developed countries are required to account for most significant storage pool in the forest
C stock changes in: ecosystem. An estimated 247-286 Pg C are stored
• above-ground biomass, in boreal forest soils Schlesinger 2000). In
• below-ground biomass, addition, the soils are considered to be a significant
• litter, sink for atmospheric C, accounting for as much as
• deadwood and 662 Tg C yr-1. The ability of forest soils to
• soil organic carbon. sequester C is due to the deposition and
accumulation of a resistant slowly decomposable C
pool with a half-life 1000 + years. The size of the
THE DYNAMICS OF FOREST SOM pool represents a balance between the
CARBON STORES organic matter input as litter of various types and
the rate of decomposition of dead material
The balance between gross primary productivity
(heterotrophic respiration). Decomposition is
(GPP or forest photosynthesis) and respiration
determined largely by climate, the chemical quality
from living and/or dead material determines the net
of the litter input and the decomposer organisms
sequestration rate by a forest ecosystem (Figure
present in the system.
1.1). Generally, about half of GPP is respired by
plants to provide energy for growth and The changes in the sequestration potential of a
maintenance (Waring and Running 1998). Net forest at different ages can be determined by
primary productivity (NPP) is the net C gain by natural or disturbance related-perturbations in GPP,
trees (equivalent to biomass increment) and equals NPP and respiration. Disturbance related-changes
the difference between GPP and autotrophic (plant) (F-disturb) include various management practices
respiration (Figure 1.1). such as planting, thinning and harvest.
Plants lose C through several pathways Forest inventory data, together with additional
including litterfall and root exudation. The soil knowledge on biomass conversion factors, can be
Figure 1.1: An overview of the major C fluxes of a forest ecosystem (see text for a description of these
processes (taken from Chapin et al. 2002).Carbon sequestration and Irish forest ecosystems 3
used to estimate NPP and this forms the framework AIMS AND OBJECTIVES
for estimating C sequestration rates for national
reporting. However, additional information on The primary objective of the CARBiFOR project
respiratory, soil stock changes and disturbance was to provide data to determine carbon stocks and
related changes are required to compile an sequestration rates spanning the entire life cycle of
ecosystem C sequestration balance. The innovative the major forest type (i.e. Sitka spruce) in Ireland.
approach adopted by CARBiFOR was to assess C The project cluster was designed to provide
sequestration rates using both inventory and improved estimates, based on micrometeorological
ecosystem-based methodologies. and inventory methods, of above- and below-
ground, litter, deadwood and soil carbon stocks,
and sequestration rates for first rotation Sitka
DEVELOPMENT OF A CARBON spruce stand on wet mineral soils. Each working
ACCOUNTING SYSTEM group had specific objectives and these are
described in the succeeding chapters.
Estimation of the extent to which forests sequester
C in the mid to long term is hindered by a high The specific aims of the CARBiFOR project
degree of spatial heterogeneity and temporal were:
variability. Therefore, carbon accounting • To account for post 1990 afforestation
procedures rely heavily on the establishment of activities in terms of the location and quantity
national forest inventory programmes, which can of carbon sequestered or emitted for the major
capture the change in C stocks over time. Guidance Irish forest type (Article 3.3)
on the development of inventories is provided by • Provide the basis for estimating the
the Revised 1996 Intergovernmental Panel on contribution of the Land-use Change and
Climate Change Guidelines for National Forestry Sectors to Ireland’s net greenhouse
Greenhouse Gas Inventories (Houghton et al. gas emissions in the first and subsequent
1997) and the Intergovernmental Panel on Climate commitment periods of the Protocol
Change Good Practice Guidance for Land-use, • Improve the basis of ‘annual’ inventory
Land-Use Change and Forestry (Penman et al. reporting for Land-use Change and Forestry
2003). These guidelines have raised a demand for Sectors by enabling verification of estimates
country-specific biomass and growth data, and and establishment of criteria, standards and
measurements of inputs and losses from forest acceptable confidence bounds
soils, which can be used to calculate the potential • Collect better information about the carbon
of forests to mitigate the anthropogenic increase of stocks in live biomass and litter associated with
atmospheric CO2 concentrations. It is also the major forest type in Ireland and its CO2
important that these inventory methods, may be sequestration or emission time course.
suitable for C accounting reports, but these
methods should be cross-validated using a ‘full C
accounting’ procedure to estimate C flux losses THE CHRONOSEQUENCE
associated with disturbance and land-use change, The core sites representing the Sitka spruce
which can not be determined using conventional chronosequence (reconstructed historical age
biomass or soil C stock estimates. From a ‘full distribution) were located in different Coillte
carbon accounting’ perspective, ecosystem flux forests in the Portlaoise area (Table 1.1). Selected
measurements by eddy covariance (Aubinet et al. stands (9 to 45 year old trees) are representative of
2002) can be used to verify, at a stand or local the typical yield class (18-24) for Sitka spruce
scale, reported changes in carbon stocks by growing on wet mineral soils in Ireland (Table 1.2).
providing data that can be compared with the An additional 14 year old-stand, with a yield class
activities, emission factors or default values used to of 24 was used for eddy covariance measurements
compile carbon budgets for a particular LULUCF and validation of inventory-based estimates. A
category. grassland site was also selected to represent a non-4 Carbon sequestration and Irish forest ecosystems
Table 1.1: Location and management history of core CARBiFOR chronosequence sites.
Site Name/ Planting Compartment Geo- Previous Cultivation and Thinning
Code date ID reference Land Management History
Position Management (dates)
Baunoge 1993 72018 K-2 52o55’ N, Grass/rush Ripped (1 m depth with ball N.a.
(B9) 7o14’ W pasture and chain), surface drains
across rip lines, no fertiliser.
Clontycoe 1988 78010 E-1 52o56’ N, Poor fertilised Ripped (1 m depth with ball N.a.
(C14) 7o15’ W marginal and chain), surface drains
grassland across rip lines, no fertiliser.
Dooary 1988 78012 R-1 52o57’ N, Grassland, Ripped (1 m depth with ball first due in
(D14) 7o15’ W regularly and chain), surface drains ’06.
fertilised across rip lines, no fertiliser.
Glenbarrow 1978 77166 O-1 53o 8’ N, Rough Mouldboard ploughed. Poor first ‘98
(G25) 7o27’ W grassland establishment (80%).
Dooary 1972 77971 A-8 52o57’ N, Grass pasture Mole drained, shallow ’91, ’95, ’99,
(D30) 7o16’ W ploughed, no fertiliser. ’03.(20%)
Cullenagh 1957 77982 M-1 52o57’ N, Rough Mouldboard ploughed, no mid ‘70s, ’81,
(C45) 7o15’ W grassland fertiliser. late ‘80s, mid
‘90s, ’01 and
felled in ’04.
Table 1.2: Description and biometric characteristics of core Coillte stands in the CARBiFOR
chronosequence (2002).
Forest Age Stocking DBH Height Yield Basal Timber Leaf area Crown to
Code density class area volume* index Height
ratio
Years stem ha-1 cm m m2 ha-1 m3 ha-1 m2 m-2
B9 9 2333 6 3.5 20-24 6.3 60.4 4.3 0.08
C14 14 2533 13 7.3 20 34.0 173.6 7.8 0.13
D14 14 2467 16 9.5 24 52.2 290.0 8.4 0.41
G25 25 1250 22 14.3 16 48.9 363.4 5.7 0.56
D30 30 1033 24 16.8 22-24 60.7 500.3 5.6 0.59
C45 45 767 32 26.7 22 65.3 835.3 4.8 0.62
forested site, to assess changes in C sequestration Site D14 was selected as the main site, where all
associated with land-use change. measurements were made and ecosystem models
were parameterised with measured values.
Additional sites were selected for individual
Measurements at this site included eddy
aspects of the project and these are highlighted in
covariance, inventory surveys, soil C, soil
the working group chapters. A grassland site (G0)
respiration, litterfall, biomass data and isotope
was also selected to represent an non-forested
tracer studies.
stand, to assess changes in C sequestration
associated with land-use change. The soils in these sites are wet mineral gleys
(Table 1.3), with a clay content of ca. 30-50%,Carbon sequestration and Irish forest ecosystems 5
Table 1.3: Soil Description and characteristics of core sites (adapted from Green et al. submitted).
Forest Age Sand Silt Clay pH Pa Kb N Bulk
Code years % % % (mg/l (mg/l (% w/w) Density
Available) Available) kg m-3
G0 0 23 41 36 5.3 11.07 63.54 0.40 0.918
D10 10 37 32 30 4.8 8.46 92.30 0.38 0.950
D14 14 9 38 53 5.0 9.11 78.06 0.29 0.998
D30 30 14 39 47 4.3 8.20 90.60 0.45 1.002
C45 45 20 50 30 4.3 6.39 53.14 0.48 1.063
a Available Phosphorus-Sodium Bicarbonate Extractable – “Olsens” – reported as mg/l dry basis
b Available Potassium – Ammonium Nitrate Extractable – reported as mg/l day basis
except for the C45 site where there was a more Management, UCD (now at University College
sandy soil. An additional 47 year old stand, with a Cork)
higher clay content, was selected at the Dooary
Dr Gustavo Saiz, Forest Ecosystem Research
forest (D47) for C analysis. However, the stand was
Group, Department of Environmental Resource
felled before any biometric measurements were
Management, UCD
recorded.
Working Group 3: Soil Carbon Stocks
THE CARBIFOR TEAM Prof. Tom Bolger, Department of Zoology, UCD
The CARBiFOR project (Carbon Sequestration in Brian Reidy, Department of Zoology, UCD
Irish Forest Ecosystems, October 2001 – June Dr Olaf Schmidt, Department of Environmental
2005) was co-ordinated by Prof. Edward P. Farrell Resource Management, UCD
and organised into four working groups as follows:
Dr Jens Dyckmans, Department of Environmental
Working Group 1: Ecosystem Processes Resource Management, UCD
Prof. Bruce Osborne, Department of Botany, UCD Working Group 4: Biomass Carbon Stocks
Dr Kevin Black, Department of Botany, UCD and Expansion Factors
Collaborators: Prof. Maarten Nieuwenhuis, Department of Crop
Science, Horticulture and Forestry, UCD
Dr Deborah Hemming, Weisman Institute, Israel;
and CarboEurope, C isotope studies Dr Brian Tobin, Department of Crop Science,
Horticulture and Forestry, UCD
Prof. M Jones, Trinity College, Grassland and
agricultural GHG fluxes Prof. John Gardiner, Department of Crop Science,
Horticulture and Forestry, UCD
Working Group 2: Soil Carbon Fluxes
Prof. Edward Farrell, Forest Ecosystem Research
Group, Department of Environmental Resource
Management, UCD
Dr Kenneth Byrne, Forest Ecosystem Research
Group, Department of Environmental Resource6 Carbon sequestration and Irish forest ecosystems
Carbon sequestration and Irish forest ecosystems                                                            7

                                            Chapter 2
                         SOIL CARBON FLUXES
                   Gustavo Saiz, Kenneth A. Byrne and Edward P. Farrell

OBJECTIVES                                             2002). Soil respiration is the primary path by which
                                                       CO2 fixed by land plants returns to the atmosphere
The aim of Working Group 2 was the study of soil       (Raich and Schlesinger 1992, Rustad et al. 2000,
respiration over the Sitka spruce (Picea sitchensis    Schlesinger and Andrews 2000). In forests, total
(Bong.) Carr.) chronosequence in Co Laois (see         ecosystem respiration (i.e. loss of CO2) tends to be
Tables 1.1 and 1.2). The research focused on the       dominated by soil respiration (Valentini et al.
quantification and understanding of the factors that   2000).
drive C emissions from soils, which are essential
for the understanding of forest ecosystem C                The production of CO2 in the soil profile is
balance as a whole.                                    primarily the result of autotrophic respiration by
                                                       live roots (allowing their growth and maintenance),
    The specific objectives of the study were to:      associated mycorrhizae, and heterotrophic
•   Investigate the influence of climatic variables    respiration by microbes oxidizing plant detritus,
    on soil respiration;                               root exudates and humified organic matter (Boone
•   Investigate the effect of stand age on soil        et al. 1998, Buchmann 2000, Hanson et al. 2000).
    respiration;
•   Estimate mean annual soil respiration rates for        The factors that control heterotrophic and
    each stand age;                                    autotrophic respiration determine the contribution
•   Estimate fine root biomass;                        of each component to the total soil respiration.
•   Estimate of heterotrophic and autotrophic soil     Temperature, together with soil moisture content, is
    respiration rates;                                 the main factor controlling soil respiration (Raich
•   Quantify the temporal variability of soil          and Schlesinger 1992, Kirschbaum 1995, Davidson
    respiration;                                       et al. 1998, Fang and Moncrieff 2001). Moderate,
•   Quantify the spatial variability of soil           low or high soil water contents may limit soil
    respiration.                                       respiration. These environmental factors affect root
                                                       respiration and soil organic matter decomposition
  Supplementary objectives were:                       differently. Research has shown that the
• Provision of data to Working Group 1 for the         contribution of autotrophic and heterotrophic
  construction of empirical and mechanistic            respiration to total soil respiration varies seasonally
  models to be used to derive net ecosystem            (Hanson et al. 2000).
  productivity, net primary productivity and
  gross primary productivity.                             In addition to temperature and moisture, root
• Provision of soil respiration and fine root          respiration is strongly influenced by plant
  biomass data to Working Group 3 for                  photosynthetic activity (Högberg et al. 2001,
  calibration of the CENTURY model.                    Kuzyakov and Cheng 2001). This light-dependant
                                                       process may co-vary with temperature, which in
                                                       some field studies may have been the factor
RATIONALE FOR THE STUDY                                responsible for the different temperature sensitivity
                                                       values reported for autotrophic and heterotrophic
An ecosystem acts as a C source when gross             respiration (Bååth and Wallander 2003). Roots not
primary productivity surpasses autotrophic and         only make a direct contribution to heterotrophic
heterotrophic respiration (see Figure 1.1; Klopatek    respiration, but also affect the respiratory activity
8 Carbon sequestration and Irish forest ecosystems
of heterotrophic organisms by exuding C-rich harvest. Three sites per stand age were used, giving
substances and by altering the soil physical and an overall total of twelve sites. All the stands were
chemical environment (Kuzyakov and Cheng within 5 km of each other.
2001).
For each stand age, one site was used to study
An important area of research is aimed at total and heterotrophic soil respiration (hereafter
focusing on the impact of forest age on soil CO2 referred to as core sites). For each stand age two
efflux (Irvine and Law 2002). Stand soil respiration additional sites were used to study total respiration
is dependant upon both the amount of fine roots (hereafter referred to as reference sites). The core
and quality of soil C pools. Soil respiration can be sites were common to all CARBiFOR working
expected to differ according to the structure and groups and facilitated collaboration between
age of the stand (Klopatek 2002). It is therefore working groups (Tables 1.1, 1.2 and 1.3). The two
important to understand the processes that additional sites per stand age had the same
determine total soil respiration in order to predict characteristics for forest management, tree age, soil
how each component may react to alterations of the type, and tree establishment as their core site.
soil environment (Kirschbaum 1995, Boone et al.
Soil types were classified as low humic
1998, Ohashi et al. 2000, Fierer et al. 2003).
(mineral) gleys in the 10, 15, and 31 year old
High spatial and temporal variation of soil stands, and as gleyic brown earth in the 47 year old
respiration has been reported for a number of stands, which seemed to have better drainage due
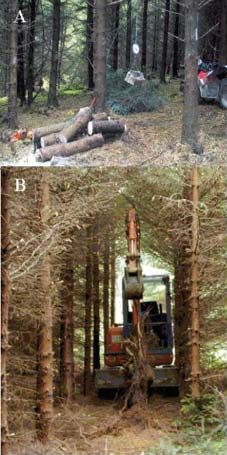
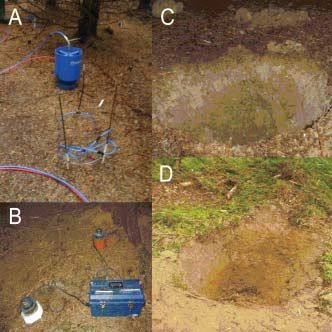
ecosystems (Thierron and Laudelout 1996, to their location on sloping terrain (Image 1).
Davidson et al. 1998, Epron et al. 1999b). An
The younger sites (10 and 15 years old stands)
understanding of this variability is a vital
had been established along ripped lines 1 m deep
component of efforts to understand and quantify
and 2 m apart. There were surface drains across the
the C balance in forest ecosystems.
ripped lines at 50 m intervals. Prior to the
establishment of the 31 and 47 year old stands the
sites were ploughed at 1.7 m intervals, following
METHODS the contour lines of the slope. In these two older
Site Characteristics plantations, 3-4 regular thinnings had already taken
place (Table 1.1). Neither fertilisation nor drainage
The selected study sites were first rotation Sitka
works had been carried out since tree establishment
spruce plantations established on former
in any of the stands. All the plots selected for the
unmanaged grassland (afforestation sites). The
present study had reached canopy closure. Since no
stands were characterised by a nearly absolute
thinning had been carried out in either the 10 or 15
absence of understory or herbaceous vegetation
year old plantations, their stand densities were
after reaching canopy closure. The stands made up
higher when compared to the older stands (Table
a chronosequence ranging from 10 to 47 years
2.1).
(Table 2.1), with the oldest stand being mature for
Table 2.1: Characteristics of the Sitka spruce stands over which measurement of total and heterotrophic
soil respiration took place (core sites). pH, nitrogen and phosphorous (pooled samples) measured for A1
soil horizon (n=15).
Site Age Stem Basal Area Yield pH Nitrogen Phosphorous
(years) Density (m2 ha-1) Class (g kg-1) (mg l-1
(trees ha-1) available)
Dooary 1 10 2300 5.3 16-20 4.52 0.627 11.2
Dooary 2 15 2366 34.4 20-24 4.77 0.418 11.4
Dooary 3 31 1083 54.0 16-20 4.07 0.599 9.4
Cullenagh 47 730 57.0 16-20 4.01 nd 8.8Carbon sequestration and Irish forest ecosystems 9
Image 1: The open top
automated (A) and manual (B)
respiration chambers used to
measure soil CO2 fluxes. Soils
were typical wet mineral gleys
(C) at all of the sites except for
the 47 year old stand, where
the soil was characterised as a
gleyic brown earth (D).
Experimental design that the soil respiration within the cores were
derived from the decomposition of organic matter
Soil respiration measurements were carried out in
only (Ewel et al. 1986b, Bowden et al. 1993). In
three forest stands each for the age classes 10, 15,
this study, a stabilisation period of eight months
31 and 471 years. For each site, a stratified random
was allowed after the collars were installed, before
sampling design was used taking into account
the first measurements were taken. Subsequently, a
disturbance during site preparation and distance to
correction was made to account for the
the nearest tree. Trees were randomly chosen from
overestimation of heterotrophic respiration
within 30 x 30 m plots. The study plots were placed
produced by the decomposition of trenched roots.
at least 20 m apart from stand discontinuities or its
Root density within the pipes was assumed to be
boundaries.
the same as the average calculated for each stand.
A series of 30 PVC circular collars (16 cm To calculate the flux resultant from roots left within
internal diameter) per stand were inserted into the the pipes, a decay constant of 0.2 year-1 was
soil to an average depth of 1.5 cm for applied, based on Silver and Miya (2001).
measurements of total soil CO2 fluxes. Collars set
at this depth were stable and caused minimal
disturbance to shallow fine roots. For the Soil CO2 flux measurements
estimation of heterotrophic respiration, at each of
Soil respiration measurements were carried out
the core sites, 30 stainless steel pipes (16 cm
during 2003 at all the core sites on a monthly basis.
internal diameter) were driven into the soil to a
Reference sites were sampled bi-monthly during
depth of 30 cm to kill tree roots. After the freshly
the same year. At the core sites, soil respiration was
killed fine roots had decomposed, it was assumed
1 The 47 year old site is the same as the 45 year old stand in the previous chapter. Soil respiration measurements were taken two
yeas after the sites were initially characterised.10 Carbon sequestration and Irish forest ecosystems
measured at each paired sampling point using two for each of the core and reference sites were
portable infrared gas analysers connected to soil estimated by means of linear regressions
respiration chambers having a headspace volume performed between the temperature taken at the
of 2250 cm3 (EGM-4 and SRC-1; PP Systems, time of measurements in the different stands and
Hitchin, UK). The system was calibrated before the ones simultaneously recorded by the automatic
each sampling day against CO2 with a nominal system. Given the physical proximity among all the
concentration of 409 ppmv. Measurements of total stands, regressions were highly correlated (data not
(RTOT) and heterotrophic (RH) respiration were shown).
carried out simultaneously.
Soil moisture content in the top 6 cm of every
Whilst the importance of diurnal variation in collar was determined using a moisture probe
soil CO2 efflux has been recognised in agricultural (ThetaProbe ML2x, Delta-T Devices, Cambridge,
research (Parkin and Kaspari 2003), this variation UK). A soil-specific calibration of the instrument
is less important in heavily shaded forested areas based on the relationship between the measured
(Davidson et al. 2000). Furthermore, it has been dielectric constant of the soil and its volumetric
previously suggested that there are no significant moisture content was performed to theoretically
diurnal changes in soil respiration under closed achieve an accuracy of ±1% (Delta-T Devices soil-
canopies (Epron et al. 1999a). In order to minimise specific calibration protocol).
the influence of any diurnal variation in soil
respiration, measurements were made between 10
am and 4 pm. On two occasions, 24 hours Relationships between soil
measurements were carried out. The average temperature and soil respiration
values obtained for the hours 10 am to 4 pm did not
A two parametric exponential function was used to
differ significantly from the other 18 hours period
describe the relationships between soil CO2 fluxes
in both days where the 24 hours measurements
and soil temperature. The formula is:
were taken.
y = a e bT
Continuous total soil respiration was also
measured, using an automated open-top chamber where y is the measured soil CO2 efflux rate, T
system based on the design of Fang and Moncrieff is the measured soil temperature, a and b are the
(1998), with a parallel 4-way solenoid control fitted parameters obtained using non-linear
system and data logger (Goulden and Crill 1997). regressions with SigmaPlot V.8.02 software.
Continuous chamber respiration measurements
Q10 is an index used to explain the sensitivity of
were taken every half hour for 120 days to assess
soil respiration to temperature. The Q10 values
the sampling resolution of the soil respiration
were calculated as:
model (Black et al. 2005).
Q10 = e 10 b (1)
Standard error for Q10 was calculated as
Soil temperature and moisture
Q10· 10· s.e.(b).
measurements
Soil temperature at 2, 6 and 10 cm depths was
measured adjacent to each collar (220 K Root biomass
temperature meter, Jenway, Essex, UK). In
In May 2003, between 7 and 15 soil cores per stand
addition, soil temperature was continuously
were taken using a root auger (4 cm radius) up to a
monitored in the 15 year old stand using soil
depth of 30 cm. Soil samples were immediately
temperature probes that were vertically inserted
stored at 4ºC and processed within four days of
into the soil to different depths, from ground level
their collection. For this, fine roots were washed
to 30 cm (Campbell Scientific Ltd., Shepshed,
and sieved to separate them from soil mineral
UK). The system was set up to record 30 minute
particles. Roots were sorted into three diameter
average temperatures. Site-specific temperatures
classes (Carbon sequestration and Irish forest ecosystems 11
washed roots were weighed after being oven-dried RTOT values were at their lowest during winter time
at 70º for 48 hours to determine fine root biomass. with a minimum CO2 flux rate of 24.3 ± 3.1 mg C
The carbon content and nitrogen concentration of m-2 h-1 measured in the 47 year old stand. By
roots 0.05). Volumetric soil slightly higher and had lower regression fits (data
moisture contents determined in the top 6 cm of the not shown).
soil profiles averaged about 36%, and showed no
significant differences between three of the four
stands over the course of the year (P>0.05). Spatial heterogeneity in similar aged
However, there was an exception with the 31 year stands
old stand, where soil water content was
Soil respiration rates measured at the core sites
significantly lower in comparison to the rest of the
were compared to the ones obtained at their
stands. Soil temperature and soil volumetric water
reference stand ages by means of paired t-tests
content were not significantly different within
(SPSS Inc., USA), (Table 2.2). There were no
stands of the same age (P>0.05).
significant differences (P>0.05) among core sites
In all stand ages, total soil respiration (RTOT) and their correspondent references in the 10, 31,
showed pronounced seasonal variations, which and 47 year old stands. In the 15 year old stands,
paralleled changes in soil temperature (Figure 2.1). while the references sites had higher respiration
rates than the core site, only one of them was12 Carbon sequestration and Irish forest ecosystems Figure 2.1: Seasonal variation of soil CO2 flux, soil temperature and soil water content in the different stand ages. Each measured value for temperature, water content and soil CO2 flux is the mean of 30 measurements. Error bars are standard errors of the means. The continuous line represents the modelled flux based on the exponential functions fitted for each stand (Table 2.4).
Carbon sequestration and Irish forest ecosystems                                                                       13

                                                         Table 2.2: Mean soil respiration rates (mg CO2-C
                                                         m-2 h-1) and standard errors for core and
                                                         reference sites in each stand age. Different letters
                                                         within the same rows denote significant different
                                                         soil respiration rates (P< 0.05).

                                                                                               Sites
                                                         Stand age       n     Core        Reference       Reference
                                                                                               B               C
                                                         10 year old     6   132.4±22.4a   124.2±26.6a     124.1±28.2a

                                                         15 year old     6   80.8±18.1a    109.8±17.8ab    136.2±39.9b

                                                         31 year old     6   59.5±17.8a     81.0±24.5a      69.8±21.7a

                                                         47 year old     6   60.1±14.5a     65.5±12.3a      54.9±17.7a

Figure 2.2: Relationships between soil CO2 fluxes
and soil temperature measured at 2 cm for the
core Sitka spruce stands. Each point is the mean
of 30 sampling points made per sampling day.
The exponential functions are shown in Table 2.4.

marginally different from its core site (P=0.042).       Annual soil respiration rates
The other reference was not significantly different
                                                         Estimations of annual RTOT were achieved with
from its core site (P=0.075). The 15 year old
                                                         the temperature-based models fitted for each stand.
references were not significantly different from
                                                         Daily mean soil temperatures were used to simulate
each other (P=0.580).
                                                         daily soil respiration. Mean modelled daily values
                                                         were then summed to obtain the annual estimate of
                                                         soil respiration in each stand. Those values ranged
Age related changes in soil respiration
                                                         from 991, 686, 556, and 564 g C m-2 for the 10, 15,
There was a decrease in RTOT with stand age              31, and 47 year old stands respectively (Table 2.4).
(Table 2.3). All the core stand ages were compared       There was close agreement between predicted and
by means of a paired t-test. The youngest stand (10      observed soil CO2 efflux in the different stand ages
year old) with a mean soil respiration rate of 111.1     as shown in Figure 2.1, with R2 values of 0.75;
± 16.4 mg C m-2 h-1 was significantly higher             0.70; 0.57, and 0.92 for the 10, 15, 31, and 47 year
(P 10 years-old) were similar (P>0.05) (Table 2.3),      interpolating measured soil respiration between
which may indicate a steady state in soil respiration    sampling dates for every day of the year to obtain
process.                                                 the annual value. Interpolated respiration rates

Table 2.3: Mean soil respiration rates (mg CO2-C m-2 h-1) measured over 2003 for each treatment in the
four core sites of the chronosequence. Means and standard errors for the different stand ages are based
on n=11 sampling dates in which an average of 30 points per treatment were sampled. Different letters
within the same treatment denote significantly different soil respiration rates (paired t-tests, α=0.05).

Treatment                  n             10 year old     15 year old           31 year old             47 year old

Total                      11           111.1 ± 16.4 a   83.3 ± 13.2 b         68.7 ± 10.3 b           68.8 ± 11.1 b

Heterotrophic              11            48.5 ± 5.3 a    36.6 ± 3.5 b          30.1 ± 5.5 b            35.1 ± 5.2 b

Roots                      11           62.6 ± 11.2 a    48.7± 7.8 b           36.7 ± 6.0 b            32.9 ± 5.1 b
14 Carbon sequestration and Irish forest ecosystems produced similar results as the modelled ones (Table 2.4). These interpolated annual values were 1013, 692, 559, and 577 g C m-2 for the 10, 15, 31, and 47 year old stands respectively (Table 2.4). Fine root biomass Fine root biomass varied over the chronosequence, and did so following trends depending on the diameter of the roots (Figure 2.3). There was a decreasing trend in root biomass
Carbon sequestration and Irish forest ecosystems                                                          15

Figure 2.4: Seasonal variation of heterotrophic and autotrophic soil CO2 flux measured in the different
stand ages. Each measured heterotrophic CO2 flux is the mean of 30 measurements per sampling date.
Error bars are standard errors of the means. The lines represent the modelled fluxes based on the
exponential functions fitted for each stand and treatment (see Table 2.4).

from the roots. In all the stands, RA rates peaked      respiration during the growing season (May to
around mid summer (day of year 209), and reached        October). RA accounted for 64% of the total flux at
minimum values during winter. The maximum               the 10 year old stand in late July. During winter
calculated rate was 141.1 mg C m-2 h-1 at the 10        months RH and RA contributed equally (each at ca.
year old stand. The lowest rate in RA was 4.1 mg C      50% of RTOT).
m-2 h-1 and this occurred at the 31 year old stand at
the same time as lowest recorded mean daily soil
temperature at 2 cm (2.1ºC) for all sites during        Continuous soil respiration
2003.                                                   measurements
   The measured annual mean RA for the 10 year          Comparisons of the model estimates with the
old stand was 62.6 ± 11.2 mg C m-2 h-1, and was         automated soil respiration measurements also
significantly higher (P
16                                                           Carbon sequestration and Irish forest ecosystems

Figure 2.5: A comparison between predicted soil heterotrophic respiration (Rh (soil)) and measured total soil
respiration rates (a), and changes in relative soil moisture content (line plot) and rainfall (histograms) during
June and July (b).

CONCLUSIONS                                                 afforested blanket peats, (Byrne and Farrell 2005),
                                                            where soil CO2 emissions varied from 170 to 260 g
The results show that afforestation with Sitka              C m-2 for 3 to 39 year old Sitka spruce stands.
spruce on former semi-managed grassland leads to            Clearly the variation in CO2 emissions from forests
a high soil efflux for the first 10 years followed by       on different soils requires further investigation.
a decline at canopy closure and maturation. Soil
respiration rates reach steady state in the later              Autotrophic respiration showed a decreasing
stages prior to felling.                                    trend with stand age, which is explained by a
                                                            decrease in fine root biomass
You can also read