Evaluation of natural aerosols in CRESCENDO Earth system models (ESMs): mineral dust - Recent

Page created by Byron Fernandez
 
CONTINUE READING
Evaluation of natural aerosols in CRESCENDO Earth system models (ESMs): mineral dust - Recent
Atmos. Chem. Phys., 21, 10295–10335, 2021
https://doi.org/10.5194/acp-21-10295-2021
© Author(s) 2021. This work is distributed under
the Creative Commons Attribution 4.0 License.

Evaluation of natural aerosols in
CRESCENDO Earth system models (ESMs): mineral dust
Ramiro Checa-Garcia1 , Yves Balkanski1 , Samuel Albani8 , Tommi Bergman5 , Ken Carslaw2 , Anne Cozic1 ,
Chris Dearden10 , Beatrice Marticorena3 , Martine Michou4 , Twan van Noije5 , Pierre Nabat4 , Fiona M. O’Connor7 ,
Dirk Olivié6 , Joseph M. Prospero9 , Philippe Le Sager5 , Michael Schulz6 , and Catherine Scott2
1 Laboratoire  des Sciences du Climat et de l’Environnement, CEA-CNRS-UVSQ, IPSL, Gif-sur-Yvette, France
2 Institutefor Climate and Atmospheric Science, School of Earth & Environment,
University of Leeds, Leeds, United Kingdom
3 Laboratoire Interuniversitaire des Systèmes Atmosphériques, Universités Paris Est-Paris Diderot-Paris 7,

UMR CNRS 7583, Créteil, France
4 CNRM, Université de Toulouse, Météo-France, CNRS, Toulouse, France
5 Royal Netherlands Meteorological Institute (KNMI), De Bilt, the Netherlands
6 Norwegian Meteorological Institute, Oslo, Norway
7 Met Office Hadley Centre, Exeter, United Kingdom
8 Department of Environmental and Earth Sciences, University of Milano-Bicocca, Milan, Italy
9 Department of Atmospheric Sciences, University of Miami, Miami, USA
10 Centre for Environmental Modelling and Computation (CEMAC), School of Earth and Environment,

University of Leeds, Leeds, UK

Correspondence: Ramiro Checa-Garcia (ramiro.checa-garcia@lsce.ipsl.fr)

Received: 3 November 2020 – Discussion started: 19 November 2020
Revised: 11 May 2021 – Accepted: 21 May 2021 – Published: 8 July 2021

Abstract. This paper presents an analysis of the mineral       models. Significant discrepancies in the globally averaged
dust aerosol modelled by five Earth system models (ESMs)       dust mass extinction efficiency explain why even models
within the project entitled Coordinated Research in Earth      with relatively similar global dust load budgets can display
Systems and Climate: Experiments, kNowledge, Dissemina-        strong differences in dust optical depth. The comparison
tion and Outreach (CRESCENDO). We quantify the global          against observations has been done in terms of dust opti-
dust cycle described by each model in terms of global emis-    cal depths based on MODIS (Moderate Resolution Imag-
sions, together with dry and wet deposition, reporting large   ing Spectroradiometer) satellite products, showing global
differences in the ratio of dry over wet deposition across     consistency in terms of preferential dust sources and trans-
the models not directly correlated with the range of parti-    port across the Atlantic. The global localisation of source
cle sizes emitted. The multi-model mean dust emissions with    regions is consistent with MODIS, but we found regional
five ESMs is 2836 Tg yr−1 but with a large uncertainty due     and seasonal differences between models and observations
mainly to the difference in the maximum dust particle size     when we quantified the cross-correlation of time series over
emitted. The multi-model mean of the subset of four ESMs       dust-emitting regions. To faithfully compare local emissions
without particle diameters larger than 10 µ m is 1664 (σ =     between models we introduce a re-gridded normalisation
651) Tg yr−1 . Total dust emissions in the simulations with    method that can also be compared with satellite products de-
identical nudged winds from reanalysis give us better con-     rived from dust event frequencies. Dust total deposition is
sistency between models; i.e. the multi-model mean global      compared with an instrumental network to assess global and
emissions with three ESMs are 1613 (σ = 278) Tg yr−1 , but     regional differences. We find that models agree with observa-
1834 (σ = 666) Tg yr−1 without nudged winds and the same       tions within a factor of 10 for data stations distant from dust

Published by Copernicus Publications on behalf of the European Geosciences Union.
Evaluation of natural aerosols in CRESCENDO Earth system models (ESMs): mineral dust - Recent
10296                                                               R. Checa-Garcia et al.: CRESCENDO ESMs: mineral dust

sources, but the approximations of dust particle size distri-        port and deposition of dust play a role in the design and main-
bution at emission contributed to a misrepresentation of the         tenance of solar energy stations in semi-desert areas (Piedra
actual range of deposition values when instruments are close         et al., 2018), whereas at the Earth’s surface fine dust parti-
to dust-emitting regions. The observed dust surface concen-          cles (diameter smaller than 2.5 µm) can cause long-term res-
trations also are reproduced to within a factor of 10. The           piratory problems (Pu and Ginoux, 2018a; Longueville et al.,
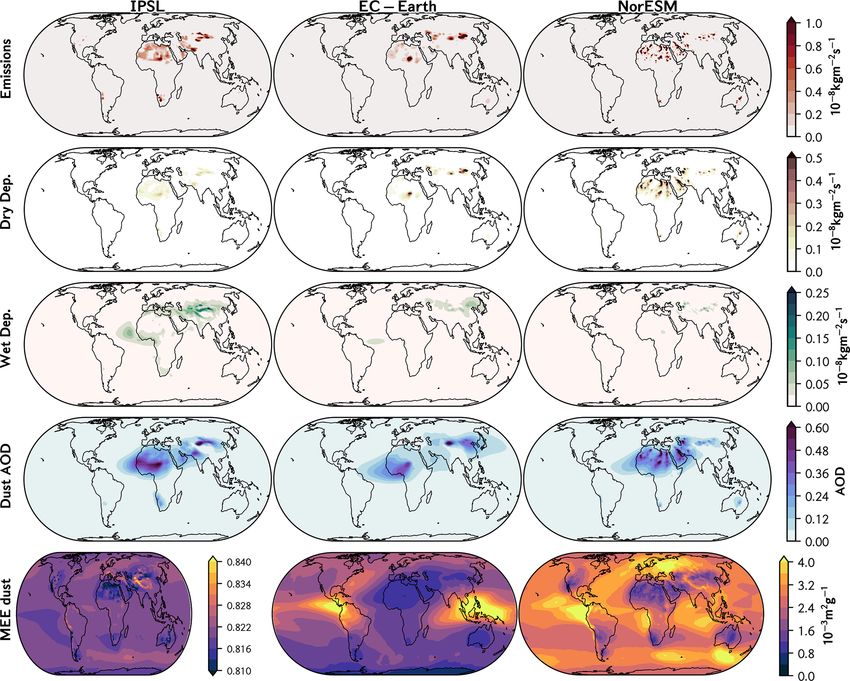
comparison of total aerosol optical depth with AERONET               2010). At regional scales dust has been reported to influence
(AErosol RObotic NETwork) stations where dust is domi-               the West African (Strong et al., 2015; Biasutti, 2019) and In-
nant shows large differences between models, although with           dian monsoons (Sharma and Miller, 2017; Jin et al., 2021).
an increase in the inter-model consistency when the simu-               As a consequence, the dust cycle is actively analysed on
lations are conducted with nudged winds. The increase in             regional (Pérez et al., 2006; Konare et al., 2008) and global
the model ensemble consistency also means better agree-              scales based on observations and models, covering aspects
ment with observations, which we have ascertained for dust           related to optical properties, mineral composition, emission
total deposition, surface concentrations and optical depths          processes, transport and deposition (Tegen and Fung, 1994).
(against both AERONET and MODIS retrievals). We intro-               Current global models represent the atmospheric lifetime of
duce a method to ascertain the contributions per mode con-           dust particles with a diameter of less than 20 µm reasonably
sistent with the multi-modal direct radiative effects, which         well (Kok et al., 2017), supporting a consistent modelling of
we apply to study the direct radiative effects of a multi-modal      the dust atmospheric cycle: emission, transport and deposi-
representation of the dust particle size distribution that in-       tion. Very large dust particles with diameters of several tens
cludes the largest particles.                                        of micrometres are, however, seldom represented in these
                                                                     models and have become an active area of research (van der
                                                                     Does et al., 2018; Di Biagio et al., 2020).
                                                                        Detailed comparisons between observations and models
1   Introduction                                                     indicate that the latter are not yet capturing the full dust spa-
                                                                     tial and temporal distribution in terms of its various proper-
Mineral dust is a key element of the Earth system. It plays          ties. This is due to the fact that current Earth system models
an important role in our planet’s energy budget in both the          are limited to approximate phenomenological descriptions of
longwave (LW) and the shortwave (SW) spectrum through                dust mobilisation (Zender et al., 2003). These dust emission
direct radiative effects and feedbacks on the climate system         schemes are based on either a saltation process (Marticorena
(Knippertz and Stuut, 2014). It also contributes significantly       and Bergametti, 1995) or a brittle fragmentation model (Kok,
to the global aerosol burden. Kok et al. (2017), based on            2011), but in both cases the momentum transfer between the
models and observations, estimated that global emissions are         wind in the boundary layer and the soil particles is condi-
1700 Tg yr−1 (with a range between 1000–2700 Tg yr−1 and             tioned by erodibility or surface roughness parameters, which
particle diameters up to 20 µm), which indicates that mineral        are sometimes simply scaled to be in agreement with obser-
dust, together with sea spray, has the largest mass emission         vations of aerosol index and/or aerosol optical depth. These
fluxes of primary aerosols. Furthermore, it is transported by        constraints allow the models to reproduce the dust optical
the atmospheric flow from emission source regions to dis-            depth reasonably well (Ridley et al., 2016) but cannot fully
tant remote regions up to thousands of kilometres (Kaufman           constrain the whole range of the dust particle size distribu-
et al., 2005; Li et al., 2008). When it is deposited over the        tion. This explains the considerable differences in surface
ocean (Schulz et al., 2012) dust constitutes a source of min-        concentrations and vertical deposition fluxes when global
erals, in particular iron (Wang et al., 2015; Mahowald et al.,       models are evaluated against dust observations at regional
2005; Mahowald, 2011) and phosphorus (Wang Rong et al.,              and local scales. These challenges increase in regions with
2014); therefore, it indirectly participates in the carbon cy-       strong seasonal cycles and sparse vegetation cover that re-
cle and the ocean removal of carbon dioxide from the atmo-           quire a description of the evolving vegetation, like the Sa-
sphere (Gruber et al., 2009; Shaffer et al., 2009). When dust        hel or semi-arid regions. Other difficulties emerge when the
is deposited over land it impacts ecosystems (Prospero et al.,       anthropogenic component of atmospheric dust has to be as-
2020) and snow albedo (Painter et al., 2007). In the tropo-          certained, as it requires land use change and agricultural ac-
sphere dust contributes to heterogeneous chemical reactions          tivities to be considered. Optical properties of mineral dust
(Tang et al., 2017; Dentener et al., 1996; Perlwitz et al., 2015;    aerosols are another field of research as both the refractive
Bauer, 2004) and ice nucleation (Tang et al., 2016; Atkinson         index and the particle shape introduce uncertainties in the es-
et al., 2013; Hoose and Möhler, 2012; Prenni et al., 2009)           timation of scattering and absorption properties (Nousiainen,
but also behaves as cloud condensation nuclei (Bègue et al.,         2009). Finally, the total mass of mineral dust emitted to the
2015), presenting additional interactions with precipitation         atmosphere is mostly conditioned by a few events with in-
(Solomos et al., 2011). Air quality studies link dust con-           tense surface winds, as the dust emission flux has a non-
centrations with health effects (Monks et al., 2009) but also        linear dependence on the wind speed, which models attempt
with visibility (Mahowald et al., 2007). Additionally, trans-        to capture. Actually, the meteorological phenomena condi-

Atmos. Chem. Phys., 21, 10295–10335, 2021                                            https://doi.org/10.5194/acp-21-10295-2021
Evaluation of natural aerosols in CRESCENDO Earth system models (ESMs): mineral dust - Recent
R. Checa-Garcia et al.: CRESCENDO ESMs: mineral dust                                                                                                                                                                                                                                                                                                                                                                                                                                                                                                                10297
 Table 1. Main characteristics of the CRESCENDO models used in this study and the simulation experiments analysed: PD (present day), PDN (present day with nudged winds), PI
 (pre-industrial aerosol and chemistry forcings). Resolution is given in degrees (longitude × latitude), and all dust emissions are interactively driven by wind speed. DPSD stands for dust
 particle size distribution; detailed information for each model is given in the Supplement in Tables S.MD.8 and S.MD.9. To describe the modelling of the largest particles we defined
 two classifiers: D10 to differentiate the schemes that explicitly aim to model diameters larger than > 10 µm and BM20 if a specific bin or mode for particles larger than 20 µm is defined
 (yes), is not included (not) or is joint into a single mode or bin with particles smaller than 20 µm particles (mix). κ DUST indicates the refractive index used for mineral dust aerosols. For
                                                                                                                                                                                                                                                                                                                                                                                                                                                                                                    Table 2. CRESCENDO ESM experiments analysed: PD (present
                                                                                                                                                                                                                                                                                                                                                                                                                                                                                                    day), PDN (present day with nudged winds), PI (pre-industrial
                                                                                                                                                                                                                                                                                                                                                                                                                                                                                                    aerosol and chemistry forcings). The sea surface temperatures
                                                                                                                                                                                                                                                                                                                                                                                                                                                                                                    (SSTs) and ice cover are prescribed based on CMIP6-DECK-
                                                                                                                                                                                                                                                                                                                                                                                                                                                                                                    AMIP (Durack and Taylor, 2018). The solar forcing uses the in-
                                                                                                                                                                                                                                                                                                                                                                                                                                                                                                    put4MIPs dataset (Matthes et al., 2017), but NorESM uses the pre-
                                                                                                                                                                                                                                                                                                                                                                                                                                                                                                    vious dataset. The gas and aerosol emissions are consistent with
                                                                                                                                                                                                                                                                                                                                                                                                                                                                                                    CMIP6,but depending on the complexity of the gas-phase species,
                                                                                                                                                                                                                                                                                                                                                                                                                                                                                                    ozone can be prescribed with either ozone concentrations from a
                                                                                                                                                                                                                                                                                                                                                                                                                                                                                                    previous full chemistry simulation or the input4MIPs ozone forc-
                                                                                                                                                                                                    References

                                                                                                                                                                                                                                                                                                                                                                                                                                                                                                    ing dataset (Checa-Garcia et al., 2018; Hegglin et al., 2016). Wind

                                                                                                                                                                                                                                                                                           Dust scheme description: (1) Schulz et al. (1998), (2) Michou et al. (2020), (3) Zender et al. (2003), (4) Tegen et al. (2002), (5) Woodward (2001), (6) Albani et al., 2020, 2021. Earth system model
                                                                                                                                                                                                                                              (1)
                                                                                                                                                                                                                                              (2)
                                                                                                                                                                                                                                              (2)
                                                                                                                                                                                                                                              (3)
                                                                                                                                                                                                                                              (4)
                                                                                                                                                                                                                                              (5)
                                                                                                                                                                                                                                                                       (6)
                                                                                                                                                                                                                                                                                                                                                                                                                                                                                                    fields used for the specified dynamics are obtained from reanalysis
                                                                                                                                                                                                                                                                                                                                                                                                                                                                                                    of ERA-Interim (Dee et al., 2011).

                                                                                                                                                                                                                                                                                                                                                                                                                                                                                                                                 PD            PDN           PI
                                                                                                                                                                                                                      Dust refraction Index
                                                                                                                                                                                                                                              1.520–i1.47 × 10−3

                                                                                                                                                                                                                                              1.530–i2.40 × 10−3
                                                                                                                                                                                                                                              1.517–i1.09 × 10−3
                                                                                                                                                                                                                                              1.520–i1.48 × 10−3
                                                                                                                                                                                                                                                                   1.520–i1.47 × 10−3
                                                                                                                                                                                                                                              1.51–i8.0 × 10−3
                                                                                                                                                                                                                                              1.51–i8.0 × 10−3

                                                                                                                                                                                                                                                                                                                                                                                                                                                                                                       Time period               2000–2014     2000–2014     2000–2014

                                                                                                                                                                                                                                                                                           description: (1) and (6) Boucher et al. (2020), (2) Séférian et al. (2019), (3) Kirkevåg et al. (2018), (4) van Noije et al. (2020), (5) Sellar et al. (2019), Mulcahy et al. (2020).
                                                                                                                                                                                                                                                                                                                                                                                                                                                                                                       SSTs and ice cover        prescribed    prescribed    prescribed
                                                                                                                                                                                                                                                                                                                                                                                                                                                                                                       Aerosol precursors        present day   present day   1850
                                                                                                                                                                                                                                                                                                                                                                                                                                                                                                       Anthropogenic emissions   present day   present day   1850
                                                                                                                                                                                                   κ DUST

                                                                                                                                                                                                                                                                                                                                                                                                                                                                                                       Solar forcing             present day   present day   present day
 additional information on the dust schemes and their implementation in the Earth system models, key references are given.

                                                                                                                                                                                                                                                                                                                                                                                                                                                                                                       Wind fields               modelled      prescribed    modelled
                                                                                                                                                                                                    Large particles
                                                                                                                                                                                                                      BM20

                                                                                                                                                                                                                                              Mix

                                                                                                                                                                                                                                              Yes
                                                                                                                                                                                                                                                                      Yes
                                                                                                                                                                                                                                              No
                                                                                                                                                                                                                                              No

                                                                                                                                                                                                                                              No
                                                                                                                                                                                                                                              No

                                                                                                                                                                                                                                                                                                                                                                                                                                                                                                    tioning these events exhibit regional dependencies; e.g. in
                                                                                                                                                                                                                                                                                                                                                                                                                                                                                                    western Africa deep convection (Knippertz and Todd, 2012)
                                                                                                                                                                                                                      D10

                                                                                                                                                                                                                                              Yes
                                                                                                                                                                                                                                              Yes

                                                                                                                                                                                                                                              Yes
                                                                                                                                                                                                                                                                      Yes

                                                                                                                                                                                                                                                                                                                                                                                                                                                                                                    and nocturnal low-level jets (Heinold et al., 2013; Washing-
                                                                                                                                                                                                                                              No

                                                                                                                                                                                                                                              No
                                                                                                                                                                                                                                              No

                                                                                                                                                                                                                                                                                                                                                                                                                                                                                                    ton and Todd, 2005) have been found to be key drivers. Re-
                                                                                                                                                                                                                                              modes: 1

                                                                                                                                                                                                                                              modes: 2
                                                                                                                                                                                                                                              modes: 2

                                                                                                                                                                                                                                                                      modes: 4

                                                                                                                                                                                                                                                                                                                                                                                                                                                                                                    cently, Yu et al. (2019) reported differences in the frequency
                                                                                                                                                                                                                                              bins: 3
                                                                                                                                                                                                                                              bins: 6

                                                                                                                                                                                                                                              bins: 6
                                                                                                                                                                                                    DPSD

                                                                                                                                                                                                                                                                                                                                                                                                                                                                                                    of dust events between the Gobi (very high frequency of dust
                                                                                                                                                                                                                                                                                                                                                                                                                                                                                                    events in March and April) and Taklamakan (more than half
                                                                                                                                                                                                                                                                                                                                                                                                                                                                                                    of the events from May to September) deserts, which can be
                                                                                                                                                                                                                                                                      Special PDN
                                                                                                                                                                                                                                              PD, PDN, PI
                                                                                                                                                                                                                                              PD, PDN, PI
                                                                                                                                                                                                                                              PD, PDN, PI
                                                                                                                                                                                                                                              PD, PDN, PI
                                                                                                                                                                                                    Experiments

                                                                                                                                                                                                                                                                                                                                                                                                                                                                                                    interpreted by a larger role in dust activation of the nocturnal
                                                                                                                                                                                                                                                                                                                                                                                                                                                                                                    low-level jet in the Taklamakan (Ge et al., 2016).
                                                                                                                                                                                                                                              PD, PI
                                                                                                                                                                                                                                              PD, PI

                                                                                                                                                                                                                                                                                                                                                                                                                                                                                                       The relevance of dust in the Earth system implies that most
                                                                                                                                                                                                                                                                                                                                                                                                                                                                                                    climate models have introduced parameterisation schemes to
                                                                                                                                                                                                                                                                                                                                                                                                                                                                                                    properly describe the dust cycle in the last 2 decades. Wood-
                                                                                                                                                                                                    Levels

                                                                                                                                                                                                                                              79
                                                                                                                                                                                                                                              91
                                                                                                                                                                                                                                              91
                                                                                                                                                                                                                                              30
                                                                                                                                                                                                                                              34
                                                                                                                                                                                                                                              85
                                                                                                                                                                                                                                                                      79

                                                                                                                                                                                                                                                                                                                                                                                                                                                                                                    ward (2001) describes the parameterisation implemented in
                                                                                                                                                                                                                                                                                                                                                                                                                                                                                                    the Hadley Centre climate model, Miller et al. (2006) intro-
                                                                                                                                                                                                                                                                                                                                                                                                                                                                                                    duce the NASA Goddard dust model, and Schulz et al. (1998)
                                                                                                                                                                                                    Resolution

                                                                                                                                                                                                                                              2.50 × 1.25
                                                                                                                                                                                                                                              1.40 × 1.40
                                                                                                                                                                                                                                              1.40 × 1.40
                                                                                                                                                                                                                                              1.25 × 0.94
                                                                                                                                                                                                                                              3.00 × 2.00
                                                                                                                                                                                                                                              1.87 × 1.25
                                                                                                                                                                                                                                                                      2.50 × 1.25

                                                                                                                                                                                                                                                                                                                                                                                                                                                                                                    and later Schulz et al. (2009) show the implementation of
                                                                                                                                                                                                                                                                                                                                                                                                                                                                                                    dust emissions in the INteraction of Chemistry and Aerosols
                                                                                                                                                                                                                                                                                                                                                                                                                                                                                                    (INCA) module of the IPSL model. Pérez et al. (2011) de-
                                                                                                                                                                                                                                                                                                                                                                                                                                                                                                    scribe the BSC-DUST model, and more recently other mod-
                                                                                                                                                                                                                                              CNRM-3DU
                                                                                                                                                                                                                                              CNRM-6DU

                                                                                                                                                                                                                                                                                                                                                                                                                                                                                                    els have either incorporated new dust schemes or improved
                                                                                                                                                                                                    Short name

                                                                                                                                                                                                                                                                      IPSL-4DU

                                                                                                                                                                                                                                                                                                                                                                                                                                                                                                    on previous ones; e.g. Albani et al. (2014) and Scanza et al.
                                                                                                                                                                                                                                              EC-Earth
                                                                                                                                                                                                                                              NorESM

                                                                                                                                                                                                                                              UKESM

                                                                                                                                                                                                                                                                                                                                                                                                                                                                                                    (2015) in the CAM climate model, LeGrand et al. (2019) for
                                                                                                                                                                                                                                              IPSL

                                                                                                                                                                                                                                                                                                                                                                                                                                                                                                    the GOCART (Goddard Chemistry Aerosol Radiation and
                                                                                                                                                                                                                                                                                                                                                                                                                                                                                                    Transport) aerosol model, Klingmüller et al. (2018) in the
                                                                                                                                                                                                                                              CNRM-ESM2-1-CRESC

                                                                                                                                                                                                                                                                                                                                                                                                                                                                                                    EMAC atmospheric chemistry–climate model, Colarco et al.
                                                                                                                                                                                                                                                                      IPSL-CM6-INCA5-4DU

                                                                                                                                                                                                                                                                                                                                                                                                                                                                                                    (2014) in the NASA GEOS-5 climate model, and Astitha
                                                                                                                                                                                                                                              EC-Earth3-AerChem
                                                                                                                                                                                                                                              IPSL-CM6-INCA5

                                                                                                                                                                                                                                                                                                                                                                                                                                                                                                    et al. (2012) and Gläser et al. (2012) in the ECHAM climate
                                                                                                                                                                                                    Model full name

                                                                                                                                                                                                                                              CNRM-ESM2-1

                                                                                                                                                                                                                                                                                                                                                                                                                                                                                                    model. Therefore, comparisons to ascertain how the models
                                                                                                                                                                                                                                              NorESM1.2

                                                                                                                                                                                                                                                                                                                                                                                                                                                                                                    are improving the description of dust-related processes are
                                                                                                                                                                                                                                              UKESM1

                                                                                                                                                                                                                                                                                                                                                                                                                                                                                                    needed to make progress in the above challenges. A broad
                                                                                                                                                                                                                                                                                                                                                                                                                                                                                                    comparison of 15 AeroCom models (including both climate
                                                                                                                                                                                                                                                                                                                                                                                                                                                                                                    models and chemistry transport models) in terms of dust has

https://doi.org/10.5194/acp-21-10295-2021                                                                                                                                                                                                                                                                                                                                                                                                                                                                            Atmos. Chem. Phys., 21, 10295–10335, 2021
Evaluation of natural aerosols in CRESCENDO Earth system models (ESMs): mineral dust - Recent
10298                                                              R. Checa-Garcia et al.: CRESCENDO ESMs: mineral dust

been conducted by Huneeus et al. (2011), and more recently          (with three bins). The UKESM includes six bins, with both
there has been a comparison of dust optical depth in 7 CMIP5        UKESM and CNRM-6DU also covering particles with diam-
(Coupled Model Intercomparison Project phase 5) climate             eters larger than 20 µm, two bins in the case of the UKESM
models (Pu and Ginoux, 2018b). Albani et al. (2014) show            and one bin in the case of the CNRM-6DU model.
a detailed comparison of several dust schemes of the CAM               In the case of modal description the evolution of the
climate model. However, as the evolution of ESMs and dust           size distribution is controlled by balance equations of mass
schemes continues, in parallel with the availability of longer      and number concentrations of each mode, as they effec-
and new and/or refined observations, exhaustive comparisons         tively constrain a log-normal distribution with fixed width. In
of dust cycle modelling, covering scales from the global to         CRESCENDO there are two main approaches: EC-Earth and
the local, are still needed.                                        NorESM consider bimodal size distributions (with one fine–
   This study aims to carry out an extensive compari-               accumulation mode and one coarse mode) mixed with other
son between observations and five Earth system models               aerosols, whereas IPSL considers an externally mixed sin-
from the Coordinated Research in Earth Systems and Cli-             gle dust coarse mode (see Table S.MD.9). The limit between
mate: Experiments, kNowledge, Dissemination and Out-                coarse and fine particles is located at about 1 µm (while accu-
reach (CRESCENDO) project, which aims to develop the                mulation refers to fine particles from 0.1 to 1 µm). Denjean
current European ESMs through targeted improvements to              et al. (2016) aimed to estimate the typical parameters of a
a range of key processes, in particular natural aerosols and        multi-modal description of the dust size distribution but con-
trace gases. We compare the ESMs against observations in            fined to the range of sizes typical of accumulation and coarse
terms of optical properties (dust optical depth, Ångström ex-       modes. Recent experiments have also included larger parti-
ponent), surface concentration, wet and dry deposition, and         cles (Ryder et al., 2018, 2019). A new analysis by Adebiyi
dust emissions, as well as how these aspects evolve in time         and Kok (2020) proposes that the coarse mode, more specif-
and space. The paper is structured as follows: Sect. 2 de-          ically particles with diameters larger than 20 µm, is impor-
scribes the models analysed, which is followed by Sect. 3           tant to better understand the global dust cycle (often referred
describing the observational datasets used and the methods          to as super-coarse and giant dust particles). Therefore, we
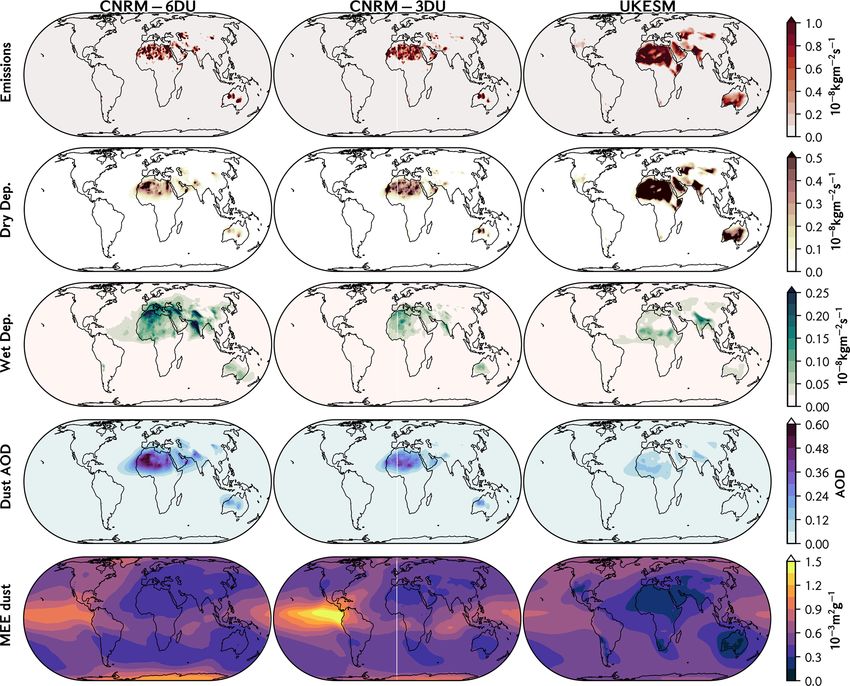
(Sect. 4). The results of the comparison are presented first at     also compared the CRESCENDO ESM modal dust schemes
the global scale (Sect. 5.1), also showing its climatological       with a new dust scheme of the IPSL model with four insolu-
spatial patterns (Sect. 5.2), followed by sections describing       ble dust modes whose properties are based on the FENNEC
dust emission (Sect. 5.3), dust deposition (Sect. 5.4), dust op-    campaign (Rocha-Lima et al., 2018; Di Biagio et al., 2020).
tical depths (Sect. 5.5) and surface concentrations (Sect. 5.6).    Table S.MD.9 shows the modal approaches in CRESCENDO
These results are then discussed in Sect. 6 where the main          and how they compare with IPSL-4DU.
conclusions are also summarised. Our final summary of fu-              To better describe the CRESCENDO ensemble diversity
ture research recommendations is in Sect. 7. The Supplement         in the modelling of the coarse mode (large particles), two
is a single document but organised according to the sections        classifiers are introduced in Table 1: one to differentiate dust
of the main paper: the Supplement MD has additional infor-          schemes that aim to include particles with diameters larger
mation in Sects. 2 (models) and 3 (datasets). The Supplement        than 10 µm and the other one to indicate whether the model
GL complements Sect. 5.1. The other Supplement parts refer          explicitly has a bin or mode for particles with diameters
to each of the diagnostics analysed.                                larger than 20 µm.
                                                                       All the models provide standard approaches that estimate
                                                                    dust mobilisation based on a velocity threshold, informa-
2   Model description                                               tion on soil texture (clay–silt), erodibility factors (including
                                                                    soil moisture or accumulated precipitation) and prescribed
Five different Earth system models (Table 1) consti-                vegetation cover. Conceptually, a fraction of the horizontal
tute the CRESCENDO ESM ensemble: CNRM-ESM2-1,                       flux of dust particles, dominated by sandblasting, is actually
NorESM1.2, EC-Earth3-AerChem, IPSL-CM6-INCA5 and                    transformed into a vertical flux with a mass efficiency factor
UKESM1, with two different dust schemes for CNRM-                   and then effectively transported by the atmosphere. EC-Earth
ESM2-1 and IPLS-CM6-INCA5 (hereafter we refer to each               emissions are calculated following the scheme described by
model by the short names in Table 1). This ensemble cov-            Tegen et al. (2002) based on the horizontal dust flux proposed
ers the two main methods to describe the dust particle size         by Marticorena and Bergametti (1995), which is also used in
distribution: binned–sectional and multi-modal log-normal.          the UKESM dust scheme (Woodward, 2001). The NorESM
   In the sectional methodology the full size distribution is       emissions are estimated with the Dust Entrainment And De-
divided into a fixed number of bins, while inside each bin the      position (DEAD) model (Zender et al., 2003). The IPSL dust
size distribution is considered invariant. For CNRM-ESM2-           emission has been described by Schulz et al. (2009, 1998),
1 two different dust schemes based on two different sets of         and the CNRM-3DU model (Nabat et al., 2012) also used
bins have been evaluated (see Table S.MD.8 for further de-          Marticorena and Bergametti (1995) with an emitted size dis-
tails), named CNRM-6DU (with six bins) and CNRM-3DU

Atmos. Chem. Phys., 21, 10295–10335, 2021                                           https://doi.org/10.5194/acp-21-10295-2021
Evaluation of natural aerosols in CRESCENDO Earth system models (ESMs): mineral dust - Recent
R. Checa-Garcia et al.: CRESCENDO ESMs: mineral dust                                                                                  10299

Table 3. Observations used for the comparison of the CRESCENDO models against observations indicating the spatial and temporal scales
considered. Loadings and mass extinction efficiency (MEE) were derived from model results only and are compared between them. L: local,
N: network, G: global, R: regional, A: annual, M: monthly, CM: monthly climatology, CA: annual climatology, TS: time series available.

 Diagnostic                  Dataset              Spatial   Temporal       Reference                                     Comments
                             AERONET              (L, N)    (A, M, TS)     Giles et al. (2019)                           AERONET v3
 Aerosol optical depth       MODIS                (G, R )   (A, M)         Sayer et al. (2014)                           DeepBlue-v6
                             MISR                 (G, R )   (A, M)         Diner et al. (2002)
                             AERONET              (L, N)    (A, M, TS)     Giles et al. (2019)                           AERONET v3
 Ångström exponent
                             MISR                 (G)       (A, M)         Diner et al. (2002)
                             AERONET dusty        (L, N)    (A, M, TS)     Giles et al. (2019)                           Subset of AERONET
 Dust optical depth          MODIS DOD            (G, R)    (A, M)         Pu and Ginoux (2018b)                         See the Supplement
                             IASI dust            (G, R)    (A, M)         Peyridieu et al. (2013)                       Near-infrared
                             UMOAC                (L, N)    (CA, CM)       Prospero and Nees (1986)                      Filter collectors
 Surface concentration       Mahowald-2009        (L, N)    (CA)           Mahowald et al. (2009)
                             INDAAF-PM10          (L)       (TS, CA)       Marticorena et al. (2017)                     INDAAF dataset
                             Network-H2011        (N)       (CA)           Huneeus et al. (2011)                         Compilation dataset
 Dust deposition flux
                             Network-SET-M        (N)       (CA)           O’Hara et al. (2006); Vincent et al. (2016)   Compilation dataset
 Wet–dry deposition flux     INDAAF-dep           (L)       (TS,CM)        Marticorena et al. (2017)                     INDAAF dataset

Figure 1. (a) Map with the stations of the dataset named Network-H2011, which collects annual dust deposition fluxes for multiple years
(Huneeus et al., 2011). (b) Map with the stations of the dataset named Network-SET-M, which collects additional station data in the Mediter-
ranean region where observations have been reported by O’Hara et al. (2006) and Vincent et al. (2016), as well as station data over the Sahel
(Marticorena et al., 2017). The different colours represent the region where each station is located.

tribution based on Kok (2011), while CNRM-6DU is a re-                   the fraction of hematite or goethite minerals induces larger
vised version of the CNRM-3DU dust scheme.                               values of optical absorption, as shown by Balkanski et al.
   Although none of the models have implemented an ex-                   (2007) and Balkanski et al. (2021). The refractive index, ex-
plicit mineralogical description of dust particles, the optical          pressed as κ DUST = n − ki, of each model is shown in Ta-
refractive index effectively accounts for the global average of          ble 1. They have similar values for the real component, but
the mixture of minerals present in the mineral dust aerosol.             the imaginary component, although small, can be different
Therefore, those optical properties are representative for the           by a factor of 2, which implies discrepancies in mass absorb-
global mineralogical composition rather than a description of            ing efficiency. Beyond the refractive index, the optical model
the soil-type dependence of the mineralogy that would imply              used to estimate the key optical properties is another factor
local differences in emitted optical properties. This approxi-           of diversity.
mation is considered to drive specific biases in regions where

https://doi.org/10.5194/acp-21-10295-2021                                               Atmos. Chem. Phys., 21, 10295–10335, 2021
Evaluation of natural aerosols in CRESCENDO Earth system models (ESMs): mineral dust - Recent
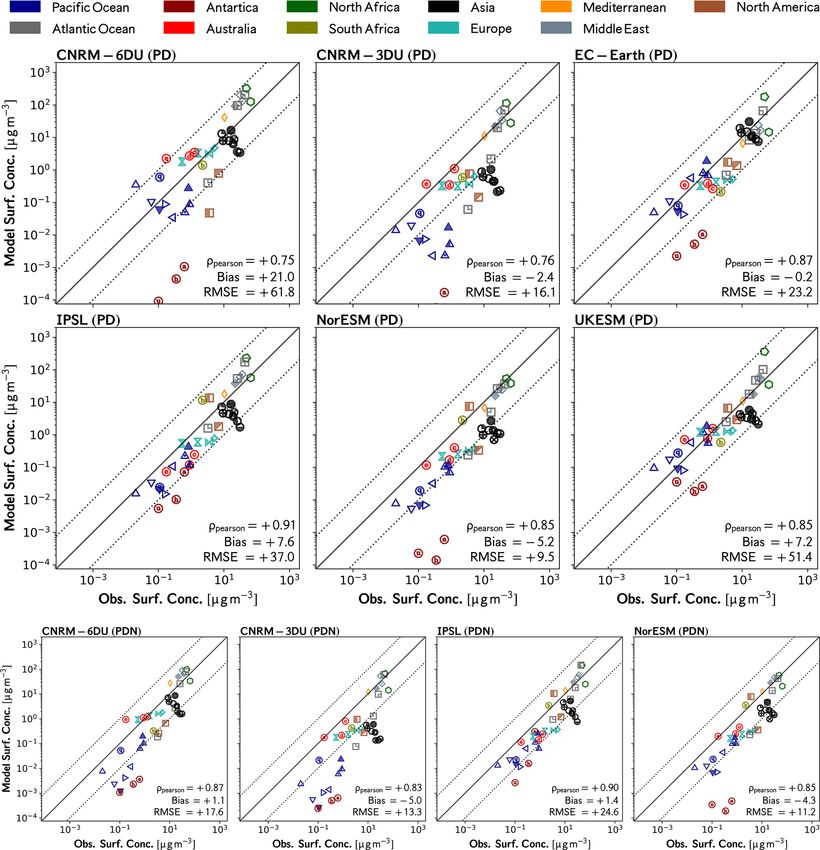
10300                                                             R. Checa-Garcia et al.: CRESCENDO ESMs: mineral dust

   In all the models the particle size is described by the geo-
metric diameter; the dust particles with irregular shapes are
modelled by spherical particles with the same effective vol-
ume. Optical properties are calculated based on Mie scatter-
ing; this approximation is reasonable as far as the orientation
of the particles is randomly distributed, but any physical pro-
cess that breaks this hypothesis, like preferential transport
of specific geometries or physical processes that promote a
specific orientation of the particles, will imply a bias in the
methodology. The geometry of the particles also affects the
gravitational settling and therefore the transport of particles
with specific geometries (Li and Osada, 2007) and their life-
time in the atmosphere. Recently, Huang et al. (2020) have
estimated that the asphericity increases gravitational settling
lifetime by 20 % for both fine and coarse modes. Addition-         Figure 2. Map with 36 stations where surface concentrations were
ally, the spherical approximation is considered to underesti-      monitored by UMOAC (University of Miami Oceanic Aerosols
                                                                   Network) and also those described by Mahowald et al. (2009).
mate the optical extinction of mineral dust (Kok et al., 2017).
                                                                   Colours represent the region where each station is located. The re-
This hypothesis also affects the actual area of the global min-
                                                                   gions correspond to those used for the regional analysis of dust
eral dust surface, which is important in heterogeneous chem-       deposition over the ocean: North Atlantic (0), South Atlantic (1),
istry (Bauer, 2004) and influences tropospheric chemistry.         northern Indian Ocean (2), southern Indian Ocean (3), Pacific west
                                                                   (4), Pacific north-east (5), Pacific south-east (6) and Antarctic
2.1   Model experiments                                            Ocean (7). For each of the oceanic regions a land mask is also ap-
                                                                   plied to filter inland grid cells.
Because the models have interactive dust emissions, wind
fields play a prominent role in dust emission and transport
(Timmreck and Schulz, 2004). Therefore, this study con-
                                                                   3     Observational datasets
trasts two different present-day forcing experiments: one
with winds generated by the dynamical part of the climate          The observational datasets used to assess the performance of
model (named PD) and the other nudged to reanalysed winds          the CRESCENDO ESMs in their representation of mineral
(named PDN) from ERA-Interim (Dee et al., 2011). The               dust are based on a compilation of ground site and satellite
historical greenhouse gas concentrations are consistent with       measurements. Table 3 summarises the different available
Meinshausen et al. (2017). The models IPSL and IPSL-               datasets used as well as the spatial and temporal scales ap-
4DU were run without explicit gas-phase interactive chem-          plied in the analysis. Additionally, this table includes datasets
istry activated; therefore, they use the CMIP6 ozone forc-         representative of either a monthly or a yearly climatology
ing database (Checa-Garcia et al., 2018). The CNRM-ESM2-           (respectively referred to as CM and CA in Table 3). In this
1 has explicit chemistry in the stratosphere and upper at-         section these datasets are briefly described, but we refer to
mosphere (Michou et al., 2020). A last simulation wherein          the original publications for further details. For datasets with
aerosols and chemistry emissions are prescribed for 1850           specific preprocessing additional details are given in the Sup-
(named PI) is presented as well; see Table 2. All the simu-        plement.
lations are from 2000 to 2014 plus at least 1 year of spin-
up (except NorESM-PDN that covers 2001 to 2014). All               3.1    Surface deposition flux
the simulations implement prescribed sea surface tempera-
tures (SSTs) of present-day conditions according to the in-        This dataset comprises deposition flux observations de-
put4MIPs dataset (Durack and Taylor, 2018). The solar forc-        scribed in Huneeus et al. (2011) composed of several mea-
ing implemented by all the models is derived from the dataset      surement campaigns over land and ocean (Fig. 1a), hereafter
of Matthes et al. (2017). The comparison between the PD and        named Network-H2011, plus an additional set of measure-
PDN experiments provides information on the role of wind           ments at stations in the Mediterranean and Sahel regions
fields in explaining model diversity. The difference between       (Fig. 1b), hereafter named Network-SET-M, for which data
PD and PI dust emissions allows us to evaluate whether the         values are shown in Table S.MD.5.
effects in the climate system due to non-dust emissions have          The set Network-H2011 gives deposition fluxes estimated
a discernible impact on the global dust cycle (as both PD and      from sedimentation corresponding to the DIRTMAP (Dust
PI have been prescribed with the same SSTs). A summary of          Indicators and Records of Terrestrial and MArine Palaeo-
the properties of the model experiments is given in Table 2.       environments) database (Kohfeld and Harrison, 2001), while
                                                                   direct measurements of deposition fluxes were acquired dur-
                                                                   ing the SEAREX campaign (Ginoux et al., 2001), mostly in

Atmos. Chem. Phys., 21, 10295–10335, 2021                                           https://doi.org/10.5194/acp-21-10295-2021
Evaluation of natural aerosols in CRESCENDO Earth system models (ESMs): mineral dust - Recent
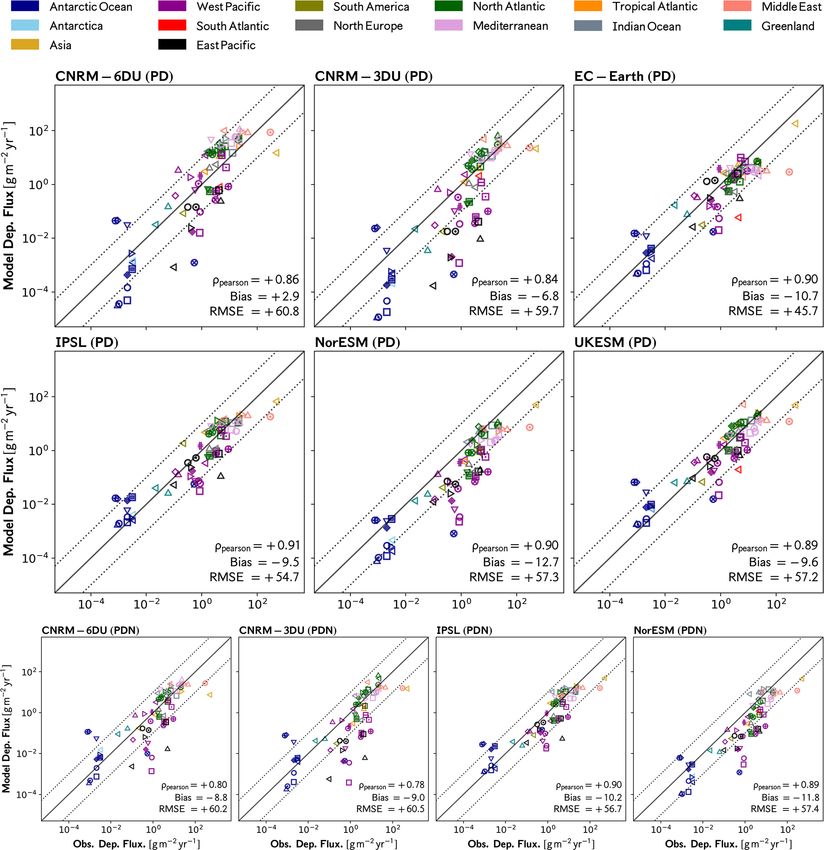
R. Checa-Garcia et al.: CRESCENDO ESMs: mineral dust                                                                               10301

                                                                       from estimations done by the University of Miami Oceanic
                                                                       Aerosols Network (UMOAN) whose instruments are filter
                                                                       collectors deployed in the North Atlantic and Pacific oceans
                                                                       (Prospero and Nees, 1986; Prospero and Savoie, 1989).
                                                                       This dataset provides climatological monthly averages with
                                                                       a standard deviation that represents inter-annual variability.
                                                                       The second part of the climatological dataset is based on
                                                                       yearly values from the station data shown in Mahowald et al.
                                                                       (2009). The dataset comprises 36 stations with values from
                                                                       5 × 10⁻² to 100 µg m−3 distributed within the full range of
                                                                       values but grouped in clusters correlated with the geographi-
                                                                       cal regions they belong to.

                                                                       3.3   INDAAF stations of data

                                                                       The multi-instrument network was deployed in the frame-
Figure 3. Map showing the 39 dusty stations from AERONET clas-
sified in two groups: 21 dust-dominated stations (uppercase letters)
                                                                       work of the African Monsoon Multidisciplinary Analysis and
and 18 stations where dust is important but not necessarily domi-      belongs to the INDAAF set of data stations. Marticorena
nant (lowercase letters). The colour allows also differentiating the   et al. (2010) described the collocated measurements of wet
number of months in the observed time series. The regions for the      and dry deposition as well as surface concentrations (of par-
preferential dust emission sources (plus the mid-Atlantic region)      ticulate matter smaller than 10 µm) at three stations in the Sa-
are indicated by numbered boxes. The region number corresponds         hel region; see Tables S.MD.6 and S.MD.7 and Fig. 1b. The
to the name of the region in which they are located: South Amer-       stations also measured precipitation, wind velocity and sur-
ica (0), southern Africa (1), Australia (2), mid-Atlantic (3), Gulf    face temperature. Additionally, in the same locations there
of Guinea (4), western Sahara (5), Mali–Niger (6), Bodélé–Sudan        are AERONET sun photometers to measure aerosol optical
(7), northern Sahara (8), northern Middle East (9), southern Mid-      depths.
dle East (10), Kyzyl Kum (11), Thar (12), Taklamakan (13), Gobi
Desert (14), North America (15).
                                                                       3.4   AERONET optical properties

the Northern Hemisphere. Mahowald et al. (2009) describe               The AERONET (aerosol robotic network) database imple-
28 sites where dust deposition is inferred assuming a 3.5 %            mented in our comparisons relies on the version 3 (level 2.0)
fraction of iron. The compilation also includes observations           algorithm. Based on this new algorithm the entire database
of deposition fluxes deduced from ice core data according              of observations was reprocessed in 2018 (Giles et al., 2019).
to Huneeus et al. (2011). The dataset covers a range of to-            The database comprises aerosol optical depths and Ångström
tal dust flux deposition from 10−3 to 0.5 × 10³ g m−2 yr−1             exponents, as well as fine and coarse optical properties ob-
but without a homogeneous distribution of values over this             tained with a new cloud-screening quality control scheme.
range. Only two stations have observational values larger              The actual division threshold between fine and coarse par-
than 100 g m−2 yr−1 , and the bulk set of stations comprised           ticles is ascertained by the inversion algorithm that aims to
values between 0.1 and 75 g m−2 yr−1 .                                 differentiate aerosol particles from ice crystals, and it lies be-
   The dataset Network-SET-M includes field measurements               tween 0.44 and 0.99 µm.
for 20 additional stations located in the Mediterranean and               The network database provides daily data, allowing for
Sahel regions to represent deposition both near dust sources           event analysis, and there is also a monthly time resolution
(O’Hara et al., 2006) and at intermediate distances from them          dataset used here to examine decadal, yearly and seasonal
(Vincent et al., 2016). The values in this dataset ranges from         properties. We processed data from 300 stations of the full
4.2 to 270 g m−2 yr−1 and allow us to visualise regional dif-          network to explore general properties. For the dust analy-
ferences in the dust deposition flux. The INDAAF (Interna-             sis we selected stations where all the models together con-
tional Network to study Deposition and Atmospheric com-                sidered dust to be an important contributor to the aerosol
position in Africa) stations (Marticorena et al., 2017) provide        composition (at the geographical location of the AERONET
us with an estimation of the inter-annual variability, which is        station). This subset is called the dusty set of stations here,
large in the Sahel region (see the Table S.MD.7)                       which are shown in Fig. 3. It comprises 39 stations divided
                                                                       into two subsets: stations where the dust has a dominant role
                                                                                                         dust > 0.5τ all-aer for all mod-
                                                                       in terms of the optical depth (τ440
3.2   Surface concentrations                                                                                        440
                                                                       els and all the months of the year, with τ440  all-aer referring to

The first part of the climatological dataset for dust concen-          optical depth at 440 nm of all aerosols and τ440   dust the optical

trations (see Table S.MD.4) at the surface has been adopted            depth of mineral dust aerosols at 440 nm) and those where

https://doi.org/10.5194/acp-21-10295-2021                                             Atmos. Chem. Phys., 21, 10295–10335, 2021
Evaluation of natural aerosols in CRESCENDO Earth system models (ESMs): mineral dust - Recent
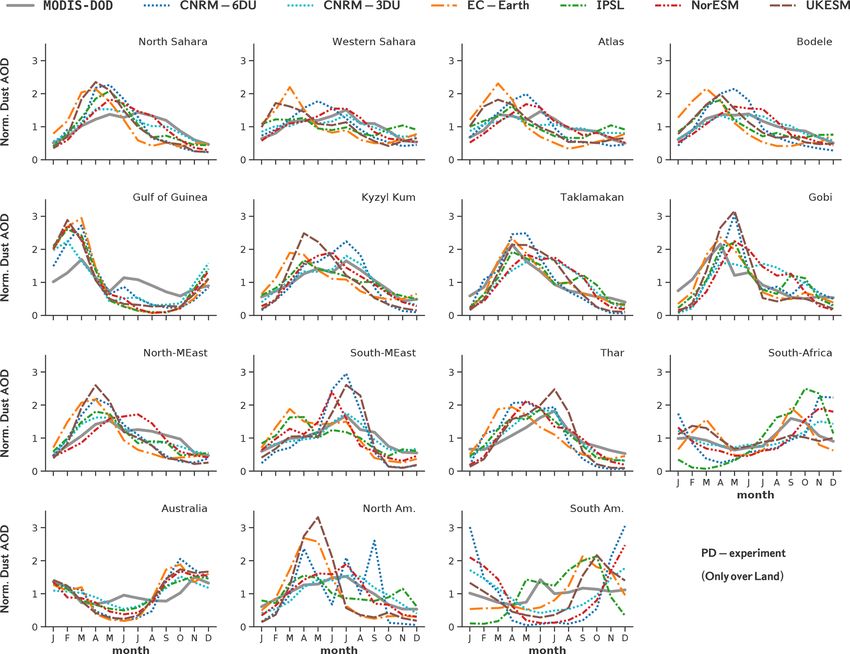
10302                                                                                R. Checa-Garcia et al.: CRESCENDO ESMs: mineral dust

Table 4. Given here are the mass mixing ratios Xs , air mass amass , optical depths τs per species s and air density ρair . We indicate the method
used to estimate other diagnostics; i and j are the coordinates and index of each cell grid, and l represents the level and layer. A(i, j ) is the
area of (i, j ) grid cell, and l0 represents the surface layer. The units refer to those of original CRESCENDO diagnostics.

             Diagnostic                       Symbol              Equation                                                                 Units
             Grid cell area                   A(i, j )            Diagnostic provided by models                                            m2
             Mass mixing ratio                Xs (i, j, l)        Diagnostic provided by models                                            kg kg−1
             Air mass                         amass (i, j, l)     Diagnostic provided by models                                            kg
             Optical depth at 550 nm          τs (i, j )          Diagnostic      provided by models                                       –
                                                                  P h                                                i
             Grid cell loadings               Ls (i, j )             l   X s (i, j, l) · amass (i, j, l)A(i, j )−1                         kg m−2
                                                                  P                              P
             Total column load                T Ls                   i,j Ls (i, j )A(i, j ) =       i,j,l Xs (i, j, l) · amass (i, j, l)   kg
             Surface concentrations           xes (i, j )         Xs (i, j, l0 ) · ρair (i, j, l0 )                                        kg m−3
             MEE at 550 nm (a )               mees (i, j )        τs (i, j )Ls (i, j )−1                                                   kg−1 m2 (b )
           a MEE: mass extinction efficiency. b The MEE shown in the analysis has units g−1 m2 = 10−3 kg−1 m2 .

Table 5. Statistic used to intercompare models and observations and                     3.5     MODIS dust-related products
perform model intercomparisons. N indicates the number of obser-
vations or sample size. When the analysis refers to a global per-                       Interactions between dust and radiation are defined through
formance of the model over a set of instruments, N represents the                       three optical properties: dust optical depth (DOD), single-
number of stations. When the statistical analysis is done over a time                   scattering albedo (ω) and the asymmetry parameter, which
series of values, N represents the number of time samples usually                       defines the ratio of the radiation scattered forward over the
corresponding to a specific location. The equations include the Pear-                   radiation scattered backward. For the dust coarse mode,
son correlation coefficient (ρ), bias (δ), normalised bias (δN ), ratio
                                                                                        the dust optical depth can be estimated using the Moderate
of standard deviations (6), normalised mean absolute error (θN )
and root mean square error (RMSE = η).
                                                                                        Resolution Imaging Spectroradiometer (MODIS) enhanced
                                                                                        deep-blue (DB) aerosol optical depth (Sayer et al., 2014) as
       Statistic estimator
                                                                                        done by Pu and Ginoux (2018b) with the additional sup-
                                                                                    port of the MODIS product of single-scattering albedo (ω)
       ρ = Cov log10 X,
                        log10 Y / σ log  10 X σ log10 X                               and Ångström exponent (α). The rationale of the method re-
                         (mod)     (obs)
       δ = N −1 N
                P
                  i=1   xi     − xi                                                     lies on the properties of these three optical parameters ap-
                                                                                        plied to aerosol particles. First, α is very sensitive to par-
                                      P             
                      (mod)     (obs)            (obs)
       δN = N                               N
            P
               i=1 xi       − xi       /    i=1 xi
                                                                                        ticle size, so there are parameterisations of aerosol optical
       6 = σmod /σobs
                     (mod)    (obs)
                                      P
                                               (obs)
                                                                                       depth that use it to separate each mode contribution. Second,
       θN = N                             N
            P
              i=1  xi      − xi     /     i=1 xi
                r                                                                       aerosols with low absorption and large scattering like sea salt
                 PN  (mod)         (obs) 2                                             have ω ' 1, whereas mineral dust is considered an absorb-
                                         
       η = N −1     i=1 xi      − xi        = RMSE
                                                                                        ing aerosol. Third, the dependency of α(λ) on wavelength
                                                                                        contains a signature of the aerosol composition. Given this
                                                                                        information, we have considered two different MODIS dust-
the dust is important although not necessarily dominant for                             optical-depth-related datasets. One of them is a pure filter of
all the models (even if the dust optical depth from a single                            aerosol optical depth to differentiate pixels wherein dust is
model contributes more than 50 % of the total aerosol opti-                             expected to be the dominant contribution to aerosol optical
cal depth). The first subset comprises 21 stations, and it is                           depth, but without an attempt to estimate the actual fraction
denoted with uppercase letters in Fig. 3. The second com-                               of mineral dust, so it is considered here to be an upper thresh-
prises 19 stations, and it is denoted with lowercase letters.                           old for the actual DOD of the coarse mode (because particles
The dusty station set over Africa is consistent with the sta-                           of dust with diameters below 1 µm are thought to contribute
tions analysed by Huneeus et al. (2011) based on the Bellouin                           less than 10 % to the total dust optical depth). The other
et al. (2005) criteria, but it has been extended with stations in                       method aims to explicitly separate sea salt and proceeds to
Australia, South America, North America and Asia, consis-                               rescale the aerosol optical depth to ascertain an actual value
tent with Klingmüller et al. (2018). Figures with the seasonal                          of DOD; according to Pu and Ginoux (2018b) it may be con-
cycle of aerosol optical depth for the dominantly dusty and                             sidered a lower bound for the DOD. Additional information
important stations that highlight the classification criteria are                       and a comparison of these created products are given in the
shown in the Supplement (Figs. S.DOD.10 and S.DOD.11).                                  Supplement; see Figs. S.MD.2 and S.MD.3.

Atmos. Chem. Phys., 21, 10295–10335, 2021                                                                      https://doi.org/10.5194/acp-21-10295-2021
Evaluation of natural aerosols in CRESCENDO Earth system models (ESMs): mineral dust - Recent
Table 6. Global dust mass balance, dust loading, dust optical depth (DOD), mass extinction efficiency (MEE) and lifetime for each model and each experiment available. CNRM has
                                            two configurations: one specific for CRESCENDO referred to as CNRM-6DU and another for CMIP6 denoted as CNRM-3DU. The UKESM does not diagnose the dust sedimentation
                                            separately, and dry deposition flux diagnostics account for all removal of dust except for wet deposition. The units are Tg yr−1 for emissions and deposition tendencies, Tg for load,
                                            m2 g−1 for MEE, and days for lifetime. MEE is calculated as the mean of the MEE(x, y) field, while MEE   [ is the ratio of DOD and load mean fields. 1 represents the ratio of the
                                            net (emission–total deposition) relative to emissions in percent (%). Rdep is the ratio of total dry (including gravitational settling) over total wet deposition. MM-mean shows the
                                            multi-model mean for each experiment (and each variable) and MM-σ the estimated multi-model standard deviation. Note that some statistical estimations (indicated with b ) related to
                                            the deposition do not include the UKESM as we cannot separate gravitational settling from other dry deposition processes. Due to the larger values of the 1 parameter, CNRM-6DU is
                                            not included in the statistics marked with c and b .

                                             Model               Exp.           Emi.            Dep.            Net            1      Dry dep.        Wet dep.         Sedim.       Rdep    DOD      Load       MEE        \
                                                                                                                                                                                                                           MEE       Lifetime
                                                                           [Tg yr−1 ]      [Tg yr−1 ]     [Tg yr−1 ]           %     [Tg yr−1 ]      [Tg yr−1 ]      [Tg yr−1 ]               –      [Tg]    [m2 g−1 ]   [m2 g−1 ]         [d]
                                             CNRM-3DU            PD           2605.2          2679.6          −74.5       −2.86          1708.1           753.8          217.8      2.55   0.011      13.3       0.63        0.44         1.9

https://doi.org/10.5194/acp-21-10295-2021
                                             EC-Earth            PD           1126.6          1126.7          −0.12       −0.01           367.8           493.2          265.7      1.28   0.029      11.7       1.86        1.27         3.8
                                             IPSL                PD           1557.5          1558.9          −1.44        −0.1           329.3           968.3          261.3      0.61   0.026      16.4       0.82        0.82         3.8
                                             NorESM              PD           1368.2          1368.3          −0.09       −0.01            84.0           275.7         1008.6      3.96   0.023       7.2       2.86        1.63         1.9
                                             UKESM               PD           7524.4          7527.6          −3.21       −0.04         6566.3a           949.8              –      6.91   0.011      18.1        0.5        0.31         0.9
                                             MM-mean             PD          2836.4c         2852.2c                –           –        622.3b          622.8b         438.5b         –    0.02c   13.32c      1.33c       0.89c        2.5c
                                             MM-σ                PD          2680.8c         2680.5c                –           –        734.7b          302.1b         380.9b         –   0.008c    4.25c      1.01c      0.556c        1.3c
                                                                                                                                                                                                                                                 R. Checa-Garcia et al.: CRESCENDO ESMs: mineral dust

                                             CNRM-3DU            PI           2651.5          2730.2          −78.7       −2.97          1728.7           781.0          220.4      2.49   0.012      13.4       0.63        0.44         1.8
                                             EC-Earth            PI           1145.8          1145.4           0.44        0.04           374.4           511.6          259.4      1.24   0.027      11.6        1.7        1.17         3.7
                                             IPSL                PI           1551.7          1553.2          −1.49        −0.1           330.6           961.0          261.5      0.62   0.027      16.7       0.82        0.82         3.9
                                             NorESM              PI           1407.3          1407.5          −0.21       −0.01            86.8           287.4         1033.2      3.90   0.023       7.4       2.75        1.56         1.9
                                             UKESM               PI           7421.9          7413.6           8.25        0.11         6475.6a           938.0              -      6.90    0.01      17.4       0.49        0.29         0.9
                                             MM-mean             PI          2835.6c         2850.0c                –           –       630.13b          635.3b         443.6b         –    0.02c    13.3c      1.28c       0.87c        2.4c
                                             MM-σ                PI          2627.4c         2622.4c                –           –       743.23b          296.5b         393.5b         –   0.008c    4.06c      0.95c       0.52c        1.3c
                                             CNRM-3DU            PDN          1812.1          1888.7         −77.62       −4.28          1290.6           435.1          164.0      3.34   0.011      11.6       0.63        0.46         2.3
                                             IPSL                PDN          1295.3          1297.1          −1.77       −0.13           268.8           813.1          215.2      0.60   0.024      14.8       0.82        0.82         4.2
                                             NorESM              PDN          1733.6          1733.4           0.12        0.01           115.7           345.5         1272.2      4.02   0.029       9.1       2.87        1.61         1.9
                                             MM-mean             PDN         1613.7c         1640.1c                –           –        558.4c          531.2c         550.4c         –    0.02c    11.8c      1.44c       0.96c        2.8c
                                             MM-σ                PDN          278.5c          307.1c                –           –        638.7c          248.2c         625.5c         –   0.009c    2.86c      1.24c       0.59c        1.2c
                                             CNRM-6DU            PD           3542.2          4134.7         −592.5       −16.7          1283.9          2108.9             741.9   0.96   0.023      32.6       0.55        0.36         3.4
                                             CNRM-6DU            PI           3887.3          4552.0         −664.7       −17.0          1415.2          2319.1             817.7   0.96   0.025      35.2       0.56        0.36         3.3
                                             CNRM-6DU            PDN          1278.4          1507.3         −228.8       −17.9           499.5           716.8             290.9   1.10   0.011      15.2       0.56        0.38         4.3
                                            a Values including the sedimentation. b Statistic does not include UKESM and CNRM-6DU. c Statistic does not include CNRM-6DU.

Atmos. Chem. Phys., 21, 10295–10335, 2021
                                                                                                                                                                                                                                                 10303
Evaluation of natural aerosols in CRESCENDO Earth system models (ESMs): mineral dust - Recent
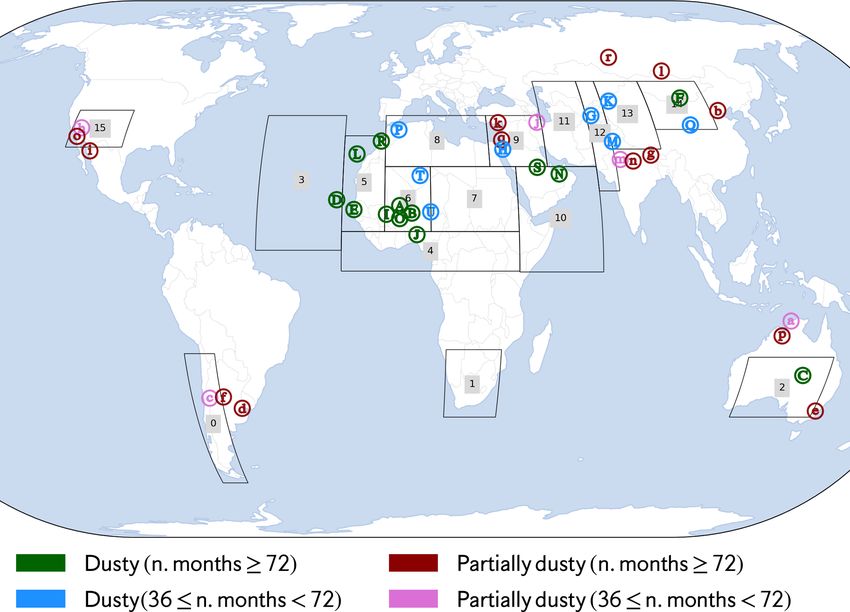
10304                                                                  R. Checa-Garcia et al.: CRESCENDO ESMs: mineral dust

3.6    MISR aerosol-optical-depth-derived products                      Additional statistics are summarised in Tables 11, 12 and 13
                                                                        including the normalised bias and the normalised mean ab-
The Multi-angle Imaging Spectroradiometer (MISR) is a                   solute error, which help us understand how the models differ
sensor on board the Terra satellite which takes advantage               when scaled to the observation values.
of its multi-angle measurement capabilities. It is able to as-
certain the presence of non-spherical particles in the aerosol
products at four different wavelengths. The optical depth at            5     Results
several wavelengths has been used to compute the Ångström
exponent between March 2000 and December 2014 from                      The results are divided into six different subsections. First a
MISR and compare with the models’ Ångström exponent                     comparison at the global scale summarises the main proper-
based on the same information. This product gives us in-                ties of the global dust cycle in the models analysed, which
formation on how the models represent the spectral depen-               is complemented by an overview of the spatial pattern of
dence of optical depth. Our computation using the 446 and               the temporal mean of the 15 years of simulation (based on
the 672 nm wavelengths has been compared with the MISR                  monthly values) for each of the climate models in the study.
Ångström exponent product to validate our computations;                 The next four sections give a detailed analysis of the dust
see Fig. S.GL.8.                                                        properties: emission, deposition, optical depth and surface
                                                                        concentrations. Each one is described at the regional scale
                                                                        and compared against a network of instruments and/or satel-
4     Methods                                                           lite retrievals when available. In all the cases, the PD experi-
                                                                        ment simulations have been taken as the baseline of the inter-
As part of this study we calculated several diagnostics not di-         comparison and shown in the main paper. The results for the
rectly provided by the different models. Table 4 shows how              other experiments (PDN and PI), if not present in the main
they have been estimated together with their units. Regarding           paper, are shown in the Supplement. The case of nudged
the statistical methods, Table 5 shows the metrics used for             wind simulations (PDN) is used to ascertain the role of mod-
the comparison of the CRESCENDO models with the com-                    elled surface winds in inter-model differences, whereas the
prehensive suite of observations. The skill of the models to            simulation with PI emissions helps us to evaluate the possi-
represent the dust optical depth over dust source regions has           ble role of prescribed emissions.
been calculated based on the Pearson correlation. Given that
this statistic is not robust because of its instability in the pres-    5.1    Global dust properties
ence of outliers (Li et al., 2006) and is only representative of
linear relationships, the skill is also estimated based on the          The global dust cycle has been analysed in terms of global
Spearman rank correlation to ensure the robustness of the re-           climatological values and complemented by a study of the
sults. For the other comparisons beyond the skill, the scatter-         role of the particle size distribution in the direct radiative ef-
plots are informative of the quality of the Pearson correlation         fects (based on the IPSL model with four dust modes).
estimator.                                                                 The dust particle size distribution is physically constrained
   For the comparison against the networks of instruments               by emission, transport and deposition (wet and dry), whereas
used (one monitoring surface concentrations, two for total              other aerosol processes like aerosol nucleation, condensation
deposition and one that retrieves dust optical depth), we pro-          and coagulation have a minor role in the evolution of the size
ceed with the same methodology. For each observation, we                distribution (Mahowald et al., 2014). Therefore, the first step
chose the model value of the corresponding variable in the              to describe the global atmospheric dust cycle in climate mod-
grid pixel to which this measuring station belongs. Given the           els consists of a characterisation of the emission and deposi-
different area covered by the grid cell and the grid point loca-        tion fluxes at the surface. This analysis is complemented by
tion of the in situ measurements, there is an underlying rep-           the analysis of two size-integrated properties: the dust optical
resentation error. However, the observational datasets of to-           depths and loadings. Other phenomena present in the Earth
tal deposition and surface concentrations at point-based sites          system dust cycle more relevant for paleoclimate studies, like
are climatological estimations which can be representative              those derived from the stabilisation of dust deposition on the
of larger areas. The values for the parameters discussed here           surface on long timescales, are not considered in this work.
are time-averaged over the 15-year simulations, and hence                  The global dust budget is analysed for the whole time pe-
the produced fields are smooth over sub-grid scales.                    riod of the simulations over the three different simulations
   The surface concentration and total deposition compar-               considered: PD, PDN and PI. Table 6 presents the mean
isons are presented as scatterplots together with three as-             global values of each model. It describes the dust mass bal-
sociated statistics: the Pearson correlation (evaluated in log          ance in terms of emission as well as dry and wet deposition.
scale), the bias and the RMSE (root mean square error).                 A parameter Rdep is defined to represent the ratio of total dry
These last two metrics can be used to characterise quanti-              to total wet deposition. In addition, 1 represents the fraction
tative differences between each model and the observations.             (%) of the emissions not deposited relative to the total emis-

Atmos. Chem. Phys., 21, 10295–10335, 2021                                                https://doi.org/10.5194/acp-21-10295-2021
R. Checa-Garcia et al.: CRESCENDO ESMs: mineral dust                                                                                  10305

Figure 4. (a) Global dust cycle values for the PD experiment. The grey shaded region represents the expected interval range based on Kok
et al. (2017) for dust particles with a diameter up to 20 µm for dust optical depth (DOD), load and mass extinction efficiency (MEE). The
grey dots over the box plot represent each of the annual values. (b) The estimated distribution of global dust optical depth annual values
(our sample values per model are represented by the coloured vertical marks just above the x axis). (c) The analogous distribution for the
optical depth of all aerosols. Both distributions are normalised, and the vertical axis represents a probability. For both the models and the
observations (MISR and MODIS) the estimates are for time period 2000–2014. Additional analyses analogous to the top panel but constrained
over different regions are in the Supplement (Figs. S.GL.1 and S.GL.2).

sion. This last parameter is used to ascertain if the dust cycle         quences of its dynamical core properties are the same; hence,
from emission to deposition is consistent in terms of global             there is also a bias. However, it is close to 600 Tg yr−1 in total
mass conservation or, on the contrary, whether the model                 deposition, producing a value of 1 larger than 15 %. There-
transport introduces any inconsistency in the modelled dust              fore, this model is not included in the ensemble means. In
cycle. In particular, the parameter 1 is used to identify the            both cases (the CNRM-3DU and the CNRM-6DU models),
models and experiments that will be included in the multi-               the bias in total deposition implies an excess of mineral dust
model ensemble mean to ensure internal consistency in the                in the atmosphere not consistent with the actual modelled
ensemble.                                                                emissions. A further complication is that the bias leads to
   In this regard, the mass budget of the CNRM-3DU model                 other biases in variables like concentrations, load and optical
is closed to within 1 ' 3 % as its dynamical core is based               depths. For this reason the CNRM-6DU model is not used in
on a semi-Lagrangian method (Voldoire et al., 2012, 2019),               our analysis to draw conclusions about the dust cycle. But it
which is not fully mass-conservative in terms of its tracers.            is kept in the other analyses to be compared with future de-
In the case of the PDN experiment there is an increase to                velopments of the model that improve or fix the mass conser-
1 ' 4.3 % because the excess of mass in the deposition with              vation and subsequently better highlight the implications of
respect to the emissions is similar for all the experiments, but         these kinds of numerical instabilities in dust modelling. For
the emissions of CNRM-3DU decrease with nudged winds                     the other models, 1 < 0.1 %, with NorESM and EC-Earth
by 30 %. The deposition value is therefore biased by an ap-              presenting values closest to zero.
proximately constant amount of 75 Tg yr−1 independently                     The multi-model mean global emissions for the PD and PI
of the wind field. Given in any case the value of 1 < 5 %,               simulation experiments are 2836 and 2835 Tg yr−1 , respec-
we have included the CNRM-3DU model in the ensemble                      tively, with standard deviations of 2680 and 2627 Tg yr−1 .
means. In the case of the CNRM-6DU model the conse-                      The PDN experiment shows an ensemble mean value of

https://doi.org/10.5194/acp-21-10295-2021                                               Atmos. Chem. Phys., 21, 10295–10335, 2021
10306                                                                  R. Checa-Garcia et al.: CRESCENDO ESMs: mineral dust

Table 7. Direct radiative effects (DREs) at the top of the atmosphere (TOA) and the surface (SRF) without clouds in the longwave (LW)
and shortwave (SW) for the IPSL model with four dust modes as described by (Samuel Albani, personal communication, 2021). For each
mode the value from each method in and out as well as their mean value (of both methods) are indicated (the mean value is in italics). Both
methods are described in the Appendix A; the method in adds each specific mode to a case without any mode of dust, and the method out
removes that specific mode to a case with all the modes of dust. Values in italics represent those derived from other values of the table. The
value of the sum of the four modes is not equal to the value of the multi-modal DRE of dust for each method in or out individually. But the
mean of both methods (in and out) is consistent with the multi-modal DRE.

                              Dust DRE            TOA LW [W m−2 ]                   TOA SW [W m−2 ]
                                                   in       out     Mean            in         out       Mean
                              Mode m1         0.0074     0.0063    0.0069    −0.1360      −0.0932     −0.1146
                              Mode m2.5       0.0399     0.0349    0.0375    −0.2737      −0.2300     −0.2518
                              Mode m7         0.0913     0.0848    0.0881    −0.0779      −0.0440     −0.0609
                              Mode m22        0.0110     0.0087    0.0099     0.0188       0.0139      0.0163
                              P
                                modes         0.1497     0.1348    0.1422    −0.4689      −0.3533        −0.41
                              Multi-modal                0.142                             −0.41
                              Dust DRE             SRF LW [W m−2 ]                   SRF SW [W m−2 ]
                                                   in       out     Mean            in         out       Mean
                              Mode m1         0.0194     0.0142    0.0168    −0.2367      −0.1854     −0.2110
                              Mode m2.5       0.1180     0.0910    0.1045    −0.6413      −0.5378     −0.5895
                              Mode m7         0.3217     0.2831    0.3024    −0.6615      −0.5548     −0.6082
                              Mode m22        0.0540     0.0371    0.0455    −0.0653      −0.0442     −0.0547
                              P
                                modes         0.5131     0.4253    0.4692    −1.6047      −1.3223     −1.4635
                              Multi-modal                0.467                             −1.45

1614 Tg yr−1 , which is significantly smaller because of the             to the 3000 Tg yr−1 reported by Tegen and Fung (1994) for
models included (see Table 1), but also because of an impor-             particle sizes between 0.1 and 50 µm. Finally, due to the pres-
tant decrease in the CNRM-3DU total emissions. Indeed, the               ence of particles with diameters up to 62 µm, the UKESM has
decrease in emissions with nudged winds is even higher in                notably higher emissions (although in this case we cannot as-
CNRM-6DU. As a consequence, our ensemble mean value                      sess the role of surface winds).
for the PDN experiments agrees well with recent estimations                  This higher value of total emissions due to large particles
(Kok et al., 2017) when large particles (diameter ≤ 20 µm)               is not directly correlated with the modelled dust load in the
are not included. But it also agrees well with previous esti-            atmosphere. The reason is that the lifetime of dust particles
mations of 1500 Tg yr−1 based on the DEAD model (Zender                  in the atmosphere depends on the size, and these large parti-
et al., 2003) for particles with diameters smaller than 10 µm.           cles sediment faster. For instance, the UKESM has monthly
At the same time, when nudged winds are used (PDN ensem-                 mean global loading values close to the other models and a
ble), the standard deviation of total emissions (278 Tg yr−1 )           smaller lifetime of dust in the atmosphere (less than 12 h,
is significantly smaller than for the PD or PI cases. For the PD         a characteristic value of the largest particles). In fact, the
experiment, the multi-model ensemble mean total emission,                dry deposition of larger particles for UKESM (which for this
for the same models as available for PDN, has a mean value               model includes sedimentation) is truly dominant, resulting in
of 1843 Tg yr−1 with a standard deviation of 544 Tg yr−1 ,               a wet deposition close to other models, like IPSL, without
which is significantly larger than the standard deviation of the         the largest particles modelled. In contrast, the CNRM-6DU
PDN experiment. Therefore, nudged winds decrease model                   wet deposition is 2 times larger than that of the UKESM and
diversity in terms of global emissions. Indeed, the CNRM-                IPSL model in the PD simulation (with CNRM-6DU being
6DU and CNRM-3DU models have total emissions with                        the only model for which wet deposition exceeds total dry
nudged winds similar to the CRESCENDO ESM ensemble                       deposition) but close to IPSL with nudged winds. Because
mean, but they produce higher emissions without nudged                   larger particles are deposited faster by gravitational settling,
wind fields, i.e. 2600 Tg yr−1 in the CNRM-3DU model (di-                it is expected that Rdep would be larger for models including
ameters up to 10 µm) and 3500 Tg yr−1 for CNRM-6DU (di-                  the largest particles, but it is only obvious for the UKESM.
ameters up to 100 µm; see Table 1). These values are similar             For the CNRM-6DU model that is not the case. EC-Earth

Atmos. Chem. Phys., 21, 10295–10335, 2021                                                  https://doi.org/10.5194/acp-21-10295-2021
You can also read