Emissions of non-methane volatile organic compounds from combustion of domestic fuels in Delhi, India
←
→
Page content transcription
If your browser does not render page correctly, please read the page content below
Atmos. Chem. Phys., 21, 2383–2406, 2021
https://doi.org/10.5194/acp-21-2383-2021
© Author(s) 2021. This work is distributed under
the Creative Commons Attribution 4.0 License.

Emissions of non-methane volatile organic compounds from
combustion of domestic fuels in Delhi, India
Gareth J. Stewart1 , W. Joe F. Acton2,a , Beth S. Nelson1 , Adam R. Vaughan1 , James R. Hopkins1,3 , Rahul Arya4,5 ,
Arnab Mondal4,5 , Ritu Jangirh4,5 , Sakshi Ahlawat4,5 , Lokesh Yadav4,5 , Sudhir K. Sharma4,5 , Rachel E. Dunmore1 ,
Siti S. M. Yunus6 , C. Nicholas Hewitt2 , Eiko Nemitz7 , Neil Mullinger7 , Ranu Gadi8 , Lokesh K. Sahu9 , Nidhi Tripathi9 ,
Andrew R. Rickard1,3 , James D. Lee1,3 , Tuhin K. Mandal4,5 , and Jacqueline F. Hamilton1
1 Wolfson  Atmospheric Chemistry Laboratories, Department of Chemistry, University of York, York, YO10 5DD, UK
2 Lancaster Environment Centre, Lancaster University, Lancaster LA1 4YQ, UK
3 National Centre for Atmospheric Science, University of York, York, YO10 5DD, UK
4 CSIR-National Physical Laboratory, Dr. K.S. Krishnan Marg, New Delhi, Delhi 110012, India
5 Academy of Scientific & Innovative Research, Ghaziabad, Uttar Pradesh 201 002, India
6 School of Water, Energy and Environment, Cranfield University, Cranfield, MK43 0AL, UK
7 UK Centre for Ecology and Hydrology, Bush Estate, Penicuik, EH26 0QB, UK
8 Indira Gandhi Delhi Technical University for Women, Kashmiri Gate, New Delhi, Delhi 110006, India
9 Physical Research Laboratory (PRL), Ahmedabad 380009, India
a now at: School of Geography, Earth and Environmental Sciences, University of Birmingham, B15 2TT, Birmingham, UK

Correspondence: Jacqueline F. Hamilton (jacqui.hamilton@york.ac.uk)

Received: 26 August 2020 – Discussion started: 19 October 2020
Revised: 17 December 2020 – Accepted: 21 December 2020 – Published: 18 February 2021

Abstract. Twenty-nine different fuel types used in resi-          The emission factors measured in this study allow for bet-
dential dwellings in northern India were collected from        ter characterisation, evaluation and understanding of the air
across Delhi (76 samples in total). Emission factors           quality impacts of residential solid-fuel combustion in India.
of a wide range of non-methane volatile organic com-
pounds (NMVOCs) (192 compounds in total) were mea-
sured during controlled burning experiments using dual-
channel gas chromatography with flame ionisation de-           1   Introduction
tection (DC-GC-FID), two-dimensional gas chromatogra-
phy (GC × GC-FID), proton-transfer-reaction time-of-flight     Biomass burning is the second largest source of trace gases
mass spectrometry (PTR-ToF-MS) and solid-phase extrac-         to the troposphere, releasing around a half of global CO,
tion two-dimensional gas chromatography with time-of-          ∼ 20 % of NO and ∼ 8 % of CO2 emissions (Olivier et al.,
flight mass spectrometry (SPE-GC × GC–ToF-MS). On av-          2005; Wiedinmyer et al., 2011; Andreae, 2019). Biomass
erage, 94 % speciation of total measured NMVOC emissions       burning releases an estimated 62 Tg yr−1 of non-methane
was achieved across all fuel types. The largest contributors   volatile organic compounds (NMVOCs) (Andreae, 2019)
to emissions from most fuel types were small non-aromatic      and is the dominant source of both black carbon (BC)
oxygenated species, phenolics and furanics. The emission       and primary organic aerosol (POA), representing 59 % and
factors (in g kg−1 ) for total gas-phase NMVOCs were fu-       85 % of global emissions, respectively (Bond et al., 2013).
elwood (18.7, 4.3–96.7), cow dung cake (62.0, 35.3–83.0),      Biomass burning includes open vegetation fires in forests,
crop residue (37.9, 8.9–73.8), charcoal (5.4, 2.4–7.9), saw-   savannahs, agricultural burning and peatlands (Chen et al.,
dust (72.4, 28.6–115.5), municipal solid waste (87.3, 56.6–    2017) as well as the biofuels used by approximately 3 bil-
119.1) and liquefied petroleum gas (5.7, 1.9–9.8).             lion people to meet their daily cooking and heating energy
                                                               requirements worldwide (World Bank, 2020). A wide range

Published by Copernicus Publications on behalf of the European Geosciences Union.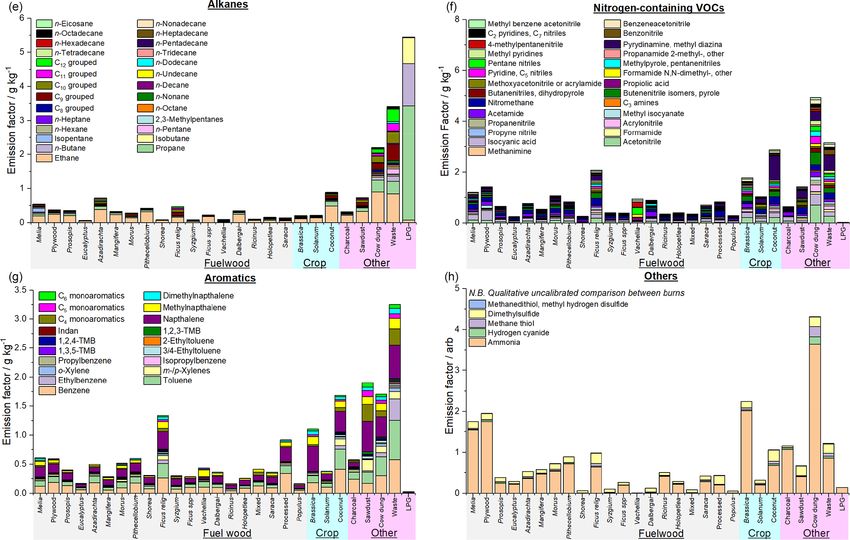
2384                                   G. J. Stewart et al.: Emissions of NMVOCs from domestic fuel combustion in India

of trace gases are released from biomass burning, in different    the main issues are that GC does not provide high time reso-
amounts depending on the fuel type and the combustion con-        lution measurements, and several instruments with different
ditions, meaning that detailed studies at the point of emis-      column configurations and detectors are required to provide
sion are required to accurately characterise emissions. The       information on different chemical classes. Samples can also
gases released lead to soil-nutrient redistribution (Ponette-     be collected into canisters or sample bags and then analysed
Gonzalez et al., 2016; N’Dri et al., 2019); can themselves be     offline (Wang et al., 2014; Sirithian et al., 2018; Barabad et
toxic (Naeher et al., 2007); and can significantly degrade lo-    al., 2018), which can increase time resolution but can also
cal, regional, and global air quality through the photochem-      lead to artefacts (Lerner et al., 2017).
ical formation of secondary pollutants such as ozone (O3 )           Recent developments have allowed for the application
(Pfister et al., 2008; Jaffe and Wigder, 2012) and secondary      of proton-transfer-reaction mass spectrometry (PTR-MS) to
organic aerosol (SOA) (Alvarado et al., 2015; Kroll and Se-       study the emissions from biomass burning (Warneke et al.,
infeld, 2008). They can also lead to indoor air quality issues    2011; Yokelson et al., 2013; Brilli et al., 2014; Stockwell et
(Fullerton et al., 2008).                                         al., 2015; Bruns et al., 2016; Koss et al., 2018). PTR-MS uses
   Emissions from biomass burning and their spatial distri-       proton transfer from the hydronium ion (H3 O+ ) to ionise and
bution remain uncertain, and estimates by satellite retrieval     simultaneously detect most polar and unsaturated NMVOCs
vary by over a factor of 3 (Andreae, 2019). Bottom-up ap-         including aromatics, oxygenated aromatics, alkenes, furan-
proaches use information about emission factors and fuel us-      ics and nitrogen-containing volatile organic compounds in
age. However, information for many developing countries,          gas samples. PTR-MS can measure at fast acquisition rates
where solid fuels are a primary energy source, is particu-        of up to 10 Hz over a mass range of 10–500 Th (thomson)
larly sparse. Toxic pollution from burning has been linked        with very low detection limits of tens to hundreds of parts
to chronic bronchitis (Akhtar et al., 2007; Moran-Mendoza         per trillion by volume (pptv) (Yuan et al., 2016). The more re-
et al., 2008), chronic obstructive pulmonary disease (Den-        cently developed technique of proton-transfer-reaction time-
nis et al., 1996; Orozco-Levi et al., 2006; Rinne et al., 2006;   of-flight mass spectrometry (PTR-ToF-MS) has allowed for
Ramirez-Venegas et al., 2006; Liu et al., 2007; Perez Padilla     around 90 % of total measured NMVOC emissions in terms
et al., 1996), lung cancer (Liu et al., 1993; Ko et al., 1997),   of mixing ratio from burning experiments to be speciated
childhood pneumonia (Smith et al., 2011), acute lower respi-      (Koss et al., 2018) and has also been used to study the for-
ratory infections (Bautista et al., 2009; Mishra, 2003) and       mation of SOA (Bruns et al., 2016). The main disadvantages
low birth weight of children (Boy et al., 2002; Yucra et          of the PTR-ToF-MS technique are its inability to speciate
al., 2011). Smoke from inefficient combustion of domestic         isomers, significant fragmentation of parent ions, only being
solid fuels is the leading cause of conjunctivitis in devel-      able to detect species with a proton affinity greater than water
oping countries (West et al., 2013). The harmful emissions        and the formation of water clusters needing to be considered
from burning also resulted in an estimated 2.8–3.9 million        (Stockwell et al., 2015; Yuan et al., 2017). More recently,
premature deaths due to household air pollution (Kodros et        measurements have also been made using iodide chemi-
al., 2018; WHO, 2018; Smith et al., 2014), of which 27 %          cal ionisation time-of-flight mass spectrometry (I− -CIMS),
originated from pneumonia, 18 % from strokes, 27 % from           which is well suited to measuring acids and multifunctional
ischaemic heart disease, 20 % from chronic obstructive pul-       oxygenates (Lee et al., 2014) as well as isocyanates, amides
monary disease and 8 % from lung cancer, with hazardous in-       and organo-nitrate species released from biomass burning
door air pollution responsible for 45 % of pneumonia deaths       (Priestley et al., 2018). Multiple measurement techniques
in children less than 5 years old (WHO, 2018). For this rea-      used in concert are therefore complementary, with the use
son, hazardous indoor air pollution from the combustion of        of PTR-ToF-MS and simultaneous gas chromatography of-
solid fuels has been calculated to be the most important risk     ten alleviating some of the difficulties highlighted above.
factor for the burden of disease in South Asia from a range of       Since the start of the century, rapid growth has resulted in
67 environmental and lifestyle risks (Lim et al., 2012; Smith     India becoming the second largest contributor to NMVOC
et al., 2014).                                                    emissions in Asia (Kurokawa et al., 2013; Kurokawa and
   The emissions from biomass burning fires are complex and       Ohara, 2020). However, effective understanding of the rel-
can contain many hundreds to thousands of chemical species        ative strength of different sources and subsequent mitigation
(Crutzen et al., 1979; McDonald et al., 2000; Hays et al.,        has been limited by a deficiency of suitably detailed, spatially
2002; Hatch et al., 2018; Stewart et al., 2021c). Measure-        disaggregated emission inventories (Garaga et al., 2018). A
ments of emissions by gas chromatography (GC) have been           current receptor-model study has shown elevated NMVOC
made (EPA, 2000; Wang et al., 2014; Gilman et al., 2015;          concentrations at an urban site in Delhi to be predominantly
Stockwell et al., 2016; Fleming et al., 2018), as it has the      due to vehicular emissions, with a smaller contribution from
potential to provide isomeric speciation of emissions. How-       solid-fuel combustion (Stewart et al., 2021a). However, ap-
ever, it is of limited use in untargeted measurements from        proximately 60 % of total NMVOC emissions from India
burning due to the complexity of emissions, leading to large      in 2010 were estimated to be due to solid-fuel combustion
amounts of NMVOCs released not being observed. Some of            (Sharma et al., 2015). Other studies have also suggested that

Atmos. Chem. Phys., 21, 2383–2406, 2021                                             https://doi.org/10.5194/acp-21-2383-2021
G. J. Stewart et al.: Emissions of NMVOCs from domestic fuel combustion in India                                            2385

burning may lead to enhanced concentrations of pollutants          at around 66 g kg−1 (Koss et al., 2018). Emissions from dung
such as polycyclic aromatic hydrocarbons in Delhi (Elzein          in Nepal have also been measured (Stockwell et al., 2016)
et al., 2020). A need has therefore been identified to measure     by sampling into whole air sample canisters followed by of-
local source profiles to allow for evaluation with activity data   fline analysis with GC-FID/ECD/MS and Fourier transform
to better understand the impact of unaccounted and unregu-         infrared spectroscopy (FTIR). However, very few speciated
lated local sources (Pant and Harrison, 2012).                     NMVOC measurements were made, and the emission fac-
   Approximately 25 % of worldwide residential solid-fuel          tors were similar to those measured using just GC (Fleming
use takes place in India (World Bank, 2020), with approxi-         et al., 2018). Studies have also focussed on making detailed
mately 25 % of ambient particulate matter in South Asia at-        measurements, using a range of techniques, from the burning
tributed to cooking emissions (Chafe et al., 2014). Despite        of municipal solid waste (Christian et al., 2010; Yokelson et
large government schemes, traditional solid-fuel cookstoves        al., 2011, 2013; Stockwell et al., 2015, 2016; Sharma et al.,
remain popular in India; this is because they are cheaper than     2019) and crop residues (Stockwell et al., 2015; Koss et al.,
ones that use liquefied petroleum gas (LPG), and the meals         2018; Kumar et al., 2018).
cooked on them are perceived to be tastier (Mukhopadhyay              Detailed chemical characterisation of NMVOC emissions
et al., 2012). The total number of biofuel users has been sus-     from fuel types widely used in the developing world is much
tained by an increasing population, despite the percentage         needed to resolve uncertainties in emission inventories used
use of biofuels decreasing as a proportion of overall fuel use     in regional policy models and global chemical transport mod-
due to increased LPG uptake (Pandey et al., 2014). Cow dung        els. A greater understanding of the key sources is required to
cakes remain prevalent as a fuel, because they are cheap,          characterise and hence understand air quality issues to al-
readily available, sustainable and ease pressure on local fu-      low for the development of effective mitigation strategies. In
elwood resources. Few studies have reported emissions data         the present study, we measure comprehensive emission fac-
from cow dung cake (Venkataraman et al., 2010; Stockwell           tors of NMVOCs from a range of solid fuels characteristic to
et al., 2016; Koss et al., 2018; Fleming et al., 2018), leav-      northern India.
ing considerable uncertainty over the impact that cow dung
cake combustion has on air quality. LPG usage has increased
to 500 million users but only reflects around 10 % of current      2     Methods
rural fuel consumption (Gould and Urpelainen, 2018).
   India-specific inventories which include residential burn-      2.1    Fuel collection and burning facility
ing indicate a considerable emission source of total
NMVOCs of around 6000–7000 kt yr−1 (Pandey et al., 2014;           A total of 76 fuels, reflecting the range of fuel types used
Sharma et al., 2015). Burning is likely to have a large impact     in northern India, were collected from across Delhi (see
on air quality in India, but considerable uncertainties exist      Fig. 1 and Table 1). Cow dung cake usage was prominent
over the total amount of NMVOCs released, owing to a lack          in the north and west regions, whereas fuelwood use was
of India-specific emission factors and information related to      more evenly spread across the state. Municipal solid waste
the spatial distribution of emissions.                             was collected from Bhalaswa, Ghazipur and Okhla land-
   Few studies measuring highly speciated NMVOC emis-              fill sites. Collection also included less used local fuel types
sion factors from fuels specific to India exist. Recent studies    which were found being burnt, including crop residues, saw-
using PTR-ToF-MS to develop emission factors, which are            dust and charcoal. A low-cost LPG stove, widely promoted
more reflective of the range of species emitted from burn-         across India as a cleaner fuel through government initiatives
ing, have focussed largely on grasses, crop residues and peat      such as the Pradhan Mantri Ujjwala Yojana and Pratyaksh
(Stockwell et al., 2015) as well as fuels characteristic of the    Hanstantrit Labh schemes, was used for direct emission com-
western US (Koss et al., 2018). A previous study measured          parison with other local fuel types.
emission factors of NMVOCs from cow dung cake using gas                Fuels were burnt at the CSIR-National Physical Labora-
chromatography with flame ionisation detection (GC-FID) of         tory (NPL), New Delhi, under controlled conditions utilising
8–32 g kg−1 (EPA, 2000). Fleming et al. (2018) quantified          a combustion chamber based on the design of Venkatara-
76 NMVOCs from fuelwood and cow dung cake combus-                  man and Rao (2001). Several previous studies have been
tion using chulha and angithi stoves by collecting samples         based on this chamber design (Venkataraman and Rao, 2001;
into Kynar bags; transferring their contents into canisters;       Venkataraman et al., 2002; Saud et al., 2011, 2012; Singh et
and offline analysing samples using GC-FID, GC-ECD (elec-          al., 2013), which was designed to simulate the convection-
tron capture detector), and GC-MS. The emission factors            driven conditions of real-world combustion and is displayed
measured from these 76 NMVOCs were 14 g kg−1 for cow               in Sect. S1 in the Supplement. The burn cycle used in this
dung cake burnt in chulha stoves, 27 g kg−1 for cow dung           study was adapted from the Volunteers in Technical Assis-
cake burnt in angithi stoves and 6 g kg−1 for fuelwood burnt       tance (VITA) water-boiling test, which was designed to sim-
in angithi stoves. An emission factor from one single dung         ulate emissions from cooking and included emissions from
burn measured using PTR-ToF-MS was considerably larger             both low- and high-temperature burning conditions. Fuels

https://doi.org/10.5194/acp-21-2383-2021                                            Atmos. Chem. Phys., 21, 2383–2406, 2021
2386                                      G. J. Stewart et al.: Emissions of NMVOCs from domestic fuel combustion in India

Table 1. Types and numbers of fuel samples burnt, the mean emission factor of total measured NMVOCs (TVOC) in g kg−1 and standard
deviation (SD) from all available burns.

                         Fuelwood types         n    TVOC       SD    Other                 n   TVOC       SD
                         Azadirachta indica     3      18.6     7.9   Cow dung cake         8      61.9   18.4
                         Morus spp.             4      27.4    21.1   Cocos nucifera        2      57.4   23.3
                         Melia azedarach        2      23.7    13.1   Charcoal              2       5.1    3.9
                         Shorea spp.            2       9.8     2.2   Sawdust               2      71.3   60.8
                         Ficus religiosa        2      51.9    63.4   Waste                 3      87.3   31.4
                         Syzygium spp.          2       8.9     4.9   LPG                   3       5.8    5.6
                         Ficus spp.             2       7.1     1.2   Cow dung cake mix     1      34.7      –
                         Vachellia spp.         2      13.5     9.7   Solanum melongena     2      13.6    6.5
                         Dalbergia sissoo       2      17.9     8.8   Brassica spp.         2      41.0   45.5
                         Ricinus spp.           2       8.5     2.5
                         Holoptelea spp.        2       6.0     0.8
                         Mixed woods            1       6.1       –
                         Saraca indica          2      12.9     5.2
                         Populus spp.           1       8.5       –
                         Pithecellobium spp.    2      19.5     5.4
                         Eucalyptus spp.        2       6.9     1.9
                         Prosopis spp.          6      14.5    10.4
                         Mangifera indica       2      12.4     3.4
                         Plywood                8      26.6    24.3
                         Processed wood         2      33.7    17.2

                                                                       local cooking practices, which should consequently give a
                                                                       more reflective NMVOC emission factor.
                                                                          Fuel (200 g) was placed 45 cm from the top of the hood
                                                                       and rapidly heated to spontaneous ignition, with emissions
                                                                       convectively driven into a hood and up a flue to allow enough
                                                                       dilution, cooling and residence time to achieve the quench-
                                                                       ing typically observed in indoor environments. These condi-
                                                                       tions have been previously optimised to ensure that emissions
                                                                       entrainment into the hood did not exert a draught which al-
                                                                       tered combustion conditions. The mid-point velocity of gases
                                                                       driven up the flue by convection was measured by a platinum
                                                                       hot-wire sensor, calibrated for total flow rate using a standard
                                                                       orifice calibrator. Samples were drawn down a sample line at
                                                                       4.4 L min−1 (Swagelok, 1/4 in. PFA, < 2.2 s residence time)
                                                                       from the top of the flue, passed through a pre-conditioned
                                                                       quartz filter (ø = 47 mm, conditioned at 550 ◦ C for 6 h and
                                                                       changed between samples) and held in a filter holder (Cole-
                                                                       Parmer, PFA) which was subsampled for analysis by PTR-
Figure 1. Locations across Delhi used for the local surveys of fuel    ToF-MS, GC × GC-FID and DC-GC-FID instruments at a
use and collection of representative biomass fuels. Map tiles by       distance no greater than 5 m from the top of the flue.
Stamen Design. Data by © OpenStreetMap contributors 2020. Dis-            Measurements of n-alkanes from n-tridecane (C13 ) to
tributed under a Creative Commons BY-SA License.                       eicosane (C20 ) were also made from a subset of 29 burns
                                                                       using solid-phase extraction discs (SPE, Resprep, C18 ). Sam-
                                                                       ples were passed through a cooling and dilution chamber de-
                                                                       signed to replicate the immediate condensational processes
were collected and stored in the same manner as local cus-             that occur in smoke particles approximately 5–20 min af-
toms using expert local judgement. This method was de-                 ter emission yet prior to photochemistry which may change
signed to ensure that the moisture content of fuelwood sam-            composition (Akagi et al., 2011). Further details of the SPE
ples was like those being burnt locally and that the combus-           sample collection are given in Stewart et al. (2021c).
tion replicated real-world burning conditions encountered in

Atmos. Chem. Phys., 21, 2383–2406, 2021                                                  https://doi.org/10.5194/acp-21-2383-2021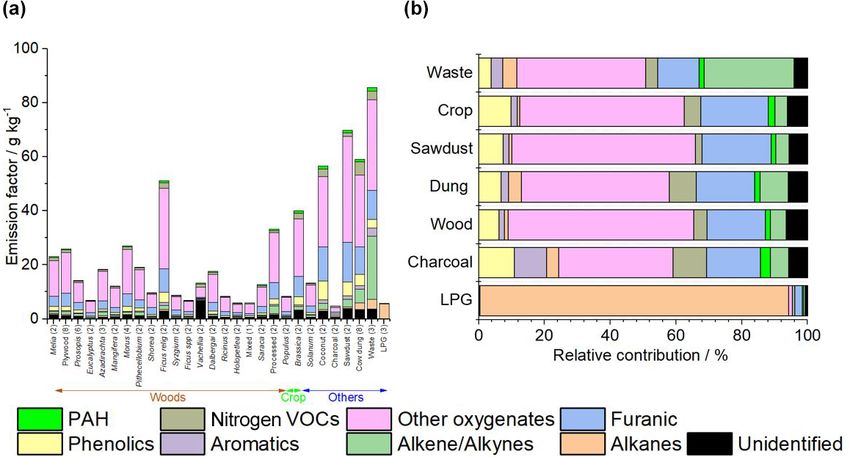
G. J. Stewart et al.: Emissions of NMVOCs from domestic fuel combustion in India                                            2387

2.2   PTR-ToF-MS                                                   example represented ∼ 15 % of anthropogenic UK NMVOC
                                                                   emissions in 2018 (Lewis et al., 2020). Fuel samples were
The PTR-ToF-MS (PTR 8000; Ionicon Analytik, Innsbruck)             placed in a small metal container (1/4 in. Swagelok cap)
instrument from the Physical Research Laboratory (PRL),            which was connected to a two-way tap (1/4 in. Swagelok).
Ahmedabad, was used to quantify 107 masses and sub-                The tap was connected to a T-piece (1/4 in. Swagelok),
sampled the common inlet line using 1/4 in. PFA (perfluo-          which had a flow of zero air (250 mL min−1 ) passed through
roalkoxy alkane). Additional details of the PTR-ToF-MS sys-        it and could be sampled by the PTR-ToF-MS. The tap was
tem used in this study are given in previous papers (Sahu and      then opened to analyse the headspace of fuels.
Saxena, 2015; Sahu et al., 2016). The sample air was diluted
into zero air, generated by passing ambient air (1 L min−1 )       2.3   DC-GC-FID
through a heated platinum filament at 550 ◦ C before enter-
ing the instrument with an inlet flow of 250 mL min−1 . Sam-       Gas chromatography was used to analyse entire burns to pro-
ples were diluted by either 5 or 6.25 times (50 mL min−1           vide an integrated picture of emissions from fuel types. The
in 200 mL min−1 zero air or 40 mL min−1 in 210 mL min−1            DC-GC-FID sampled 51 burns to measure 19 C2 –C7 non-
zero air). The instrument was operated with an electric field      methane hydrocarbons (NMHCs) and C2 –C5 oxygenated
strength (E/N , where N is the buffer gas density and E is         NMVOCs (OVOCs) (Hopkins et al., 2003). A 500 mL sam-
the electric field strength) of 120 Td (townsend, 1 Td= 10–        ple (1.5 L pre-purge of 100 mL min−1 for 15 min, sam-
17 V cm2 ). The drift tube temperature was 60 ◦ C with a pres-     ple at 17 mL min−1 for 30 min) was collected (Markes In-
sure of 2.3 mbar and 560 V applied across it.                      ternational CIA Advantage), passed through a glass fin-
   Calibrations were performed twice a week using a gas            ger at −30 ◦ C to remove water and adsorbed onto a dual-
calibration unit (Ionicon Analytik, Innsbruck). The calibra-       bed sorbent trap (Markes International ozone precursors
tion gas (Apel-Riemer Environmental Inc., Miami) contained         trap) at −20 ◦ C (Markes International Unity 2). The sam-
18 compounds: methanol, acetonitrile, acetaldehyde, ace-           ple was thermally desorbed (250 ◦ C for 3 min) then split
tone, dimethyl sulfide, isoprene, methacrolein, methyl vinyl       50 : 50 and injected into two separate columns for analy-
ketone, 2-butanol, benzene, toluene, 2-hexanone, m-xylene,         sis of NMHCs (50 m × 0.53 mm Al2 O3 PLOT) and OVOCs
heptanal, α-pinene, 3-octanone and 3-octanol at 1000 ppbv          (10 m × 0.53 mm LOWOX with 50 µm restrictor to balance
(±5 %), and β-caryophyllene at 500 ppbv (±5 %). This stan-         flow). The oven was held at 40 ◦ C for 5 min, then heated at
dard was dynamically diluted into zero air to provide a six-       13 ◦ C min−1 to 110 ◦ C, and then finally heated at 8 ◦ C min−1
point calibration. The normalized counts per second (ncps)         to 200 ◦ C with a 30 min hold.
per ppbv of the NMVOC (ncps/ppbv) was then determined
for each mass using a transmission curve (Taipale et al.,          2.4   GC × GC-FID
2008). The maximum error in this calibration approach was
shown to be 21 % (Taipale et al., 2008). Peak assignment was       The GC × GC-FID was used to measure 58 C7 –C12 hydro-
assisted with results reported by previous burning studies and     carbons (C7 –C12 alkanes, monoterpenes and monoaromat-
references therein (Brilli et al., 2014; Stockwell et al., 2015;   ics) and collected 3 L samples (100 mL min−1 for 30 min)
Koss et al., 2018). The results may also contain other indis-      using an adsorption–thermal-desorption system (Markes
tinguishable structural isomers not mentioned here.                International Unity 2). NMVOCs were trapped onto a
   Mass calibration and peak fitting of PTR-ToF-MS data            sorbent (Markes International U-T15ATA-2S) at −20 ◦ C
were performed using PTRwid software (Holzinger, 2015).            with water removed in a glass cold finger at −30 ◦ C,
Count rates per second (cps) of each mass spectral peak            removed and heated to ∼ 100 ◦ C after each sample to
were normalised to the primary ion (H3 O+ ) and water clus-        prevent carry-over of unanalysed, polar interfering com-
ter (H3 O · H2 O)+ peaks, and mixing ratios were then deter-       pounds. The sample was thermally desorbed (250 ◦ C for
mined for each mass using the normalised sensitivity. Where        5 min) and injected splitless down a transfer line. Ana-
compounds known to fragment in the PTR-ToF-MS were                 lytes were refocussed for 60 s using liquid CO2 at the
identified, the mixing ratio of these species was calculated by    head of a non-polar BPX5 held at 50 psi (1 psi = 6.9 kPa)
summing parent ion and fragment ion mixing ratios. Before          (SGE Analytical, 15 m × 0.15 µm × 0.25 mm), which was
each burn, ambient air was sampled to provide a background         connected to a polar BPX50 at 30 psi (SGE Analytical,
for the measurement.                                               2 m × 0.25 µm × 0.25 mm) via a modulator held at 180 ◦ C
   Petrol and diesel fuel samples were collected from an In-       (5 s modulation, Analytical Flow Products ELDV2-MT).
dian Oil fuel station in Pusa, New Delhi, and the headspace        The oven was held for 2 min at 35 ◦ C, then ramped at
was analysed to allow for comparison of benzene-to-toluene         2.5 ◦ C min−1 to 130 ◦ C and held for 1 min with a final ramp
ratios. This method was designed to analyse the ratios in          of 10 ◦ C min−1 to 180 ◦ C and a hold of 8 min. The GC sys-
evaporative emissions, as these have been shown to be an           tems were tested for breakthrough to ensure trapping of the
important source of atmospheric NMVOCs (Srivastava et al.,         most volatile components (see Sect. S2). Calibration was
2005; Rubin et al., 2006; Yamada et al., 2015), which for          carried out using 4 ppbv gas standards containing alkanes,

https://doi.org/10.5194/acp-21-2383-2021                                            Atmos. Chem. Phys., 21, 2383–2406, 2021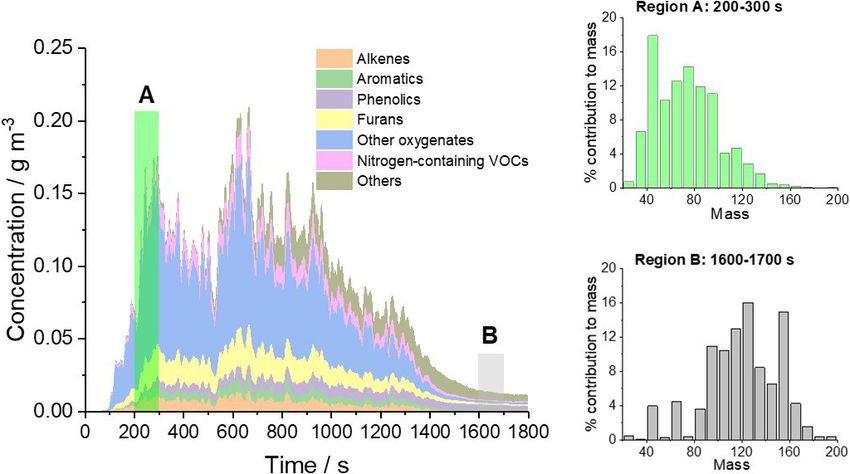
2388 G. J. Stewart et al.: Emissions of NMVOCs from domestic fuel combustion in India
alkenes and aromatics purchased from the British National Blank corrections have been applied by subtracting the mean
Physical Laboratory and through the relative response of liq- of blank values closest to measurement of the sample. An
uid standard injections to toluene for components not in this eight-point calibration was performed for n-alkanes using a
gas standard, as detailed elsewhere (Dunmore et al., 2015; commercial standard (C7 –C40 saturated alkane standard, cer-
Stewart et al., 2021a). Integration of peak areas was per- tified 1000 µg mL−1 in hexane, Sigma-Aldrich 49452-U) di-
formed in Zoex GC image software (Zoex, USA). Peaks were luted in the range 0.25–10 µg mL−1 .
individually checked, and where peaks were split in the soft-
ware, they were manually joined. The areas corresponding to
alkane isomers were manually joined within the GC image 3 Results
software and calibration performed by comparing the areas to
3.1 Comparison of chromatograms from combustion of
the corresponding n-alkane. For both GC instruments, blanks
different fuel types
of ambient air were made at the beginning, middle and end
of the day, and the mean was subtracted from samples. Figure 2 shows GC × GC-FID chromatograms obtained from
collecting the emissions during the combustion of LPG
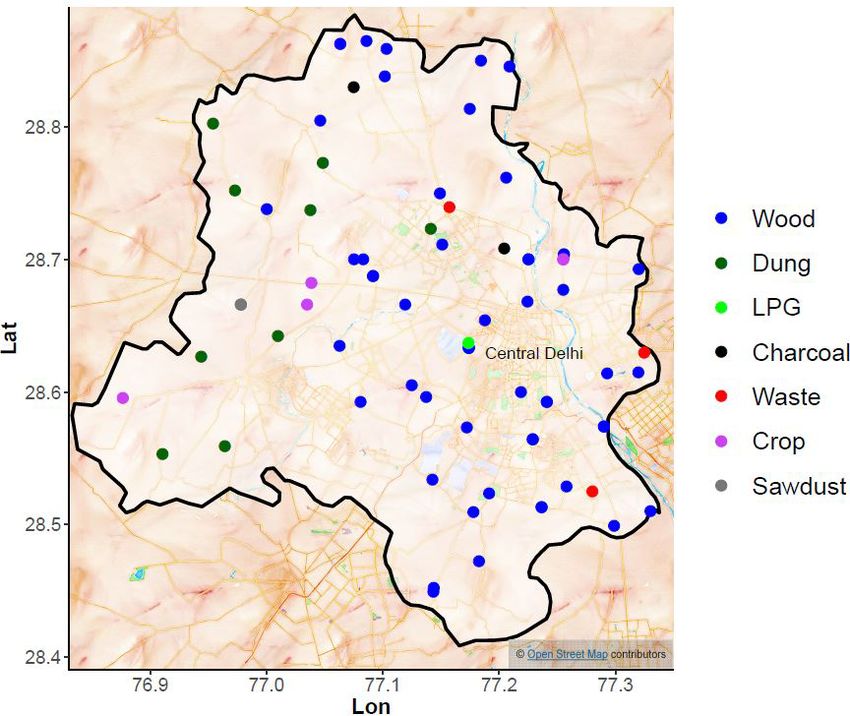
2.5 GC × GC–ToF-MS (Fig. 2a), Saraca indica fuelwood (Fig. 2b), cow dung cake
(Fig. 2c) and municipal solid waste (Fig. 2d). Figure 2d is
Measurements of a subset of 29 burns of C13 –C20 alkanes labelled to show the position of NMVOCs measured and
were made, as well as other gas-phase species to assist with displays a homologous series of n-alkanes from n-heptane
qualification of masses measured by PTR-ToF-MS, by ad- (C7 ) to n-tetradecane (C14 ) along the bottom, with the 1-
sorbing samples to the surface of SPE discs with analysis alkenes positioned to the left. Above are more polar species
by GC × GC–ToF-MS, as detailed in Stewart et al. (2021c). such as monoterpenes, aromatics from benzene to substituted
Samples of 180 L were adsorbed to the surface of C18 coated monoaromatics with up to five carbon substituents, and at
SPE discs (Resprep, C18 , 47 mm) prewashed with 2 × 5 mL a higher second dimension retention time even more polar
acetone washes and 1 × 5 mL methanol wash. These sam- species, such as styrene.
ples were collected at 6 L min−1 over 30 min using a low- Many peaks were present in the chromatograms for cow
volume sampler (Vayubodhan Pvt. Ltd), which passed sam- dung cake and municipal solid waste, and these fuels re-
ples through a cooling and dilution chamber at 46.7 L min−1 . leased significantly more NMVOCs per unit mass than fu-
Samples were then wrapped in foil, placed in an airtight bag elwood and LPG (see Table 1). Cow dung cake and mu-
and kept frozen until analysis. nicipal solid waste released a range of NMVOCs includ-
SPE extracts were spiked with an internal stan- ing n-alkanes, alkenes and aromatics. The municipal solid
dard (EPA 8270 Semivolatile Internal Standard Mix, waste (Fig. 2d) showed a particularly large and tailing peak
2000 µg mL−1 in DCM, dichloromethane) and extracted us- numbered 22, owing to large emissions of styrene. Several
ing accelerated solvent extraction into ethyl acetate. Ex- unidentified peaks were observed in these complex samples
tracts were analysed using GC × GC–ToF-MS (Leco Pe- which were broad in the second dimension. These were as-
gasus BT 4D) using a 10 : 1 split injection (1 µL in- sumed to be from polar, oxygenated species formed during
jection, 4 mm taper focus liner, SHG 560302). The pri- burning such as phenol. These species could not be identified
mary dimension column was a RXI-5SilMS (Restek, and were not analysed using the GC × GC-FID instrument.
30 m × 0.25 µm × 0.25 mm) connected to a second column Peaks have been omitted if these species were found to in-
of RXI-17SilMS (Restek, 0.25 µm × 0.25 mm, 0.17 m pri- terfere significantly. Analysis has only been carried out using
mary GC oven, 0.1 m modulator, 1.42 m secondary oven, the DC-GC-FID from ethane (C2 ) to n-hexane (C6 ), owing to
0.31 m transfer line) under a He flow of 1.4 mL min−1 . The the significant presence of coeluting peaks. The large peak in
primary oven was held at 40 ◦ C for 1 min and then ramped the LPG chromatogram (Fig. 2, primary dimension retention
at 3 ◦ C min−1 to 202 ◦ C where it was held for 0.07 min. The time ∼ 6 min, secondary dimension retention time ∼ 0.5 s)
secondary oven was held at 62 ◦ C for 1 min and then ramped was from unresolved propane and butane because of the high
at 3.2 ◦ C min−1 to 235 ◦ C. The inlet was held at 280 ◦ C and concentrations from this fuel source.
the transfer line at 340 ◦ C. A 5 s cryogenic modulation was
used with a 1.5 s hot pulse and 1 s cool time between stages. 3.2 PTR-ToF-MS concentration time series analysis
Peak assignment was conducted through comparison of
retention times to known standards and comparison to the Figure 3 shows an example concentration–time-series plot
National Institute of Standards and Technology (NIST) mass measured by the PTR-ToF-MS for a cow dung cake burn.
spectral library. Integration was carried out within the Chro- A sharp rise in NMVOC emissions was seen from the start
maTOF 5.0 software package (Leco, 2019). Eight blank mea- of the burn, which decreased as the fuel was combusted.
surements were made at the beginning and end of the day by Emissions of small oxygenated species as well as phenolics
passing air from the chamber (6 L min−1 for 30 min) through and furanics were dominant throughout most of the burn. At
the filter holder containing a PTFE filter and an SPE disc. the beginning, a greater proportion of lower-mass species
Atmos. Chem. Phys., 21, 2383–2406, 2021 https://doi.org/10.5194/acp-21-2383-2021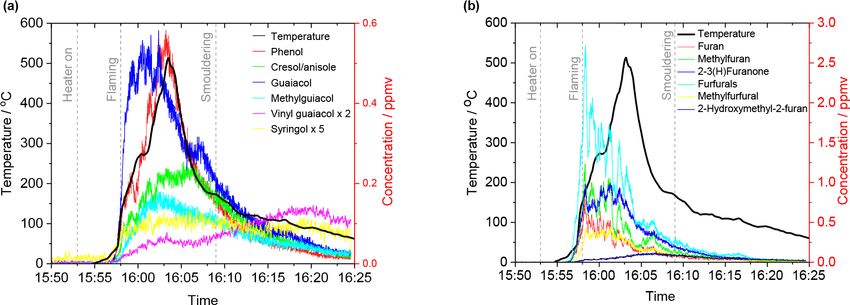
G. J. Stewart et al.: Emissions of NMVOCs from domestic fuel combustion in India                                                  2389

Figure 2. GC × GC-FID chromatograms from burning (a) LPG, (b) Saraca indica (fuelwood), (c) cow dung cake and (d) municipal solid
waste samples where 1–7 = n-octane to n-tetradecane, 8–13 = 1-octadecene to 1-tridecene, 14 = benzene, 15 = toluene, 16 = ethylbenzene,
17 = m/p-xylene, 18 = o-xylene, 19 = C3 -substituted monoaromatics, 20 = C4 -substituted monoaromatics and 21 = C5 -substituted monoaro-
matics and 22 = styrene. Samples (a)–(d) were collected with the same sample collection parameters, and the chromatograms are set at the
same contrast level to allow for direct comparison between different fuel types.

were released, as shown in the binned mass spectrum of                   Figure 5 shows a concentration time series for phenolics
region A in Fig. 3. At the end in the smouldering phase,              and furanics from the burning of an example fuelwood. Most
emissions were dominated by heavier and lower-volatility              species of similar functionality tracked each other. Stockwell
species (Fig. 3, region B). A previous study indicated higher-        et al. (2015) demonstrated that benzene, phenol and furan
molecular-weight phenolics were from low-temperature py-              could act as tracers for aromatic, phenolic and furanic species
rolysis (Sekimoto et al., 2018).                                      released from biomass burning. Figure 5a shows that heav-
   Figure 4 shows the cumulative mass of species mea-                 ier, more substituted phenolics appeared to be released at
sured from burns of fuelwood, cow dung cake, munici-                  cooler temperatures. Guaiacol (dark blue) was released at the
pal solid waste and charcoal as a proportion of the total             start of the flaming phase before the temperature increased
mass of NMVOCs quantified using PTR-ToF-MS. The re-                   and more phenol (red) was released at higher burn temper-
sults were like those reported by Brilli et al. (2014) and            atures. Later in the burn, a larger proportion of vinyl guaia-
Koss et al. (2018): 65 %–90 % of the mass of NMVOCs at                col (pink) and syringol (yellow) were emitted. This agreed
emission originated from around 40 NMVOCs, with around                well with previous results which showed that species emit-
70 %–90 % identification by mass when quantifying around              ted from lower temperature depolymerisation had a larger
100 NMVOCs. The largest contributors to the NMVOC mass                proportion of low-volatility compounds compared to higher
from burning of fuelwood and cow dung cake were methanol              temperature processes during flaming (Sekimoto et al., 2018;
(m/z 33.034); acetic acid (m/z 61.028); and a peak that               Koss et al., 2018). Figure 5b shows concentration time series
reflected the sum of hydroxyacetone, methyl acetate, and              of furanic species, with most species showing similar charac-
ethyl formate (m/z 75.043). For municipal solid waste sam-            teristics throughout the burn. The only species to peak later
ples, around 28 % of total mass was from methyl methacry-             in the burn was 2-hydroxymethyl-2-furan.
late (m/z 101.059) and styrene (m/z 105.068), and two of
the three municipal solid waste samples released significant
quantities of styrene, most likely the result of degradation of
polystyrene in the samples.

https://doi.org/10.5194/acp-21-2383-2021                                                Atmos. Chem. Phys., 21, 2383–2406, 2021
2390                                   G. J. Stewart et al.: Emissions of NMVOCs from domestic fuel combustion in India

Figure 3. PTR-ToF-MS concentration–time-series plot during the first 30 min of a cow dung cake burn coloured by functionality with
regions A and B displaying mass spectra placed into m/z bins of 10 Th. Fuel was collected from Pitam Pura, Delhi.

Figure 4. Cumulative NMVOC mass identified from PTR-ToF-MS compared with total NMVOC signal measured by PTR-ToF-MS with
(a) ordered by decreasing NMVOC mass contribution and (b) ordered by ion mass. High quantification of emissions from charcoal was due
to a low emission factor (2.4 g kg−1 ).

3.3    Comparison of emissions data obtained with                    agreed within a factor of 2 and had correlation coefficients
       different instruments                                         > 0.8 for most species except butadienes, furan, hydroxyace-
                                                                     tone, furfural, phenol and glyoxal. These previous compar-
                                                                     isons indicate the level of consistency expected with instru-
Previous instrument intercomparisons from biomass burn-              ment comparisons of quantitative NMVOC measurements
ing samples were between PTR-MS, GC–MS and open-                     from burning experiments.
path FTIR (Gilman et al., 2015) and between PTR-ToF-MS,                 Figure 6 shows a comparison of measurements made us-
FTIR, airborne cavity-enhanced spectroscopy (ACES) and               ing the DC-GC-FID, GC × GC-FID and PTR-ToF-MS tech-
I− -CIMS (Koss et al., 2018). Gilman et al. (2015) showed            niques. Bar plots show that the mean and lower/upper quar-
generally good agreement of slopes of measured emission              tiles of all measurements agreed within a factor of 2. The
factors between benzene, ethyne, furan, ethene, propene,             correlation coefficient between different instruments is given
methanol, toluene, isoprene and acetonitrile using different         by blue circles, with all > 0.8. Generally, the mean values
instruments and/or techniques with slopes of ∼ 1 ± 0.3 %             measured for the PTR-ToF-MS were slightly larger than us-
and correlation coefficients > 0.9. Koss et al. (2018) showed        ing the GC instruments, which was attributed to the pres-
mean measured values of most NMVOCs from all burns                   ence of other undistinguishable structural isomers measured
with other instruments compared to the PTR-ToF-MS which

Atmos. Chem. Phys., 21, 2383–2406, 2021                                                https://doi.org/10.5194/acp-21-2383-2021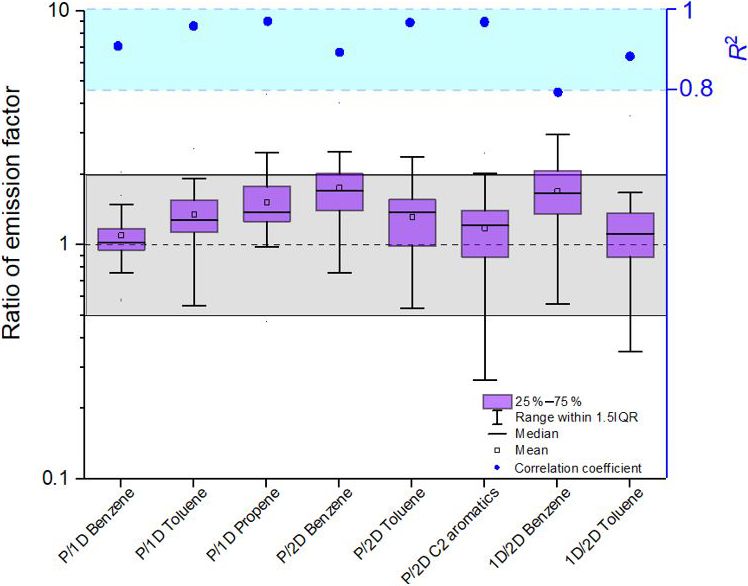
G. J. Stewart et al.: Emissions of NMVOCs from domestic fuel combustion in India 2391
Figure 5. Concentration time series analysis of phenolic and furanic compounds released from burning of Azadirachta indica which released
27.0 g kg−1 of NMVOCs. Temperature corresponds to the increase in temperature above ambient measured in the flame directly above the
combustion experiment.
by the PTR-ToF-MS. Comparison between DC-GC-FID and
GC × GC-FID measurements were also complicated by high
levels of coelution of additional NMVOC species released
from combustion with similar retention times (Rt ) to ben-
zene/toluene (Rt = 21/25 min) on the DC-GC-FID instru-
ment. Generally, the smallest values were measured with the
GC × GC-FID instrument, consistent with the greatest ability
to speciate isomers and limit the impacts of coelution. Signif-
icant efforts were made to synchronise the sample periods for
the three instruments as best as possible; however, slight un-
certainty existed over the exact time each instrument started
measuring when calculating mean sample windows (±30 s).
These factors combined may help to explain the slight dif-
ferences observed between different instruments during this
study. When multiple instruments have measured the same
NMVOC in this study, preference was given to the data from
the GC × GC-FID due to the ability of this instrument to re-
solve coeluting peaks, followed by the DC-GC-FID and then Figure 6. Comparison of PTR-ToF-MS to DC-GC-FID and
the PTR-ToF-MS. GC × GC-FID with the black dashed line representing slopes equal
to one, grey shaded region representing slopes agreeing within a
factor of 2 and shaded blue region indicating correlation coefficients
3.4 NMVOC emission factors from biomass fuels > 0.8; P = PTR-ToF-MS, 1D = DC-GC-FID and 2D = GC × GC-
FID.
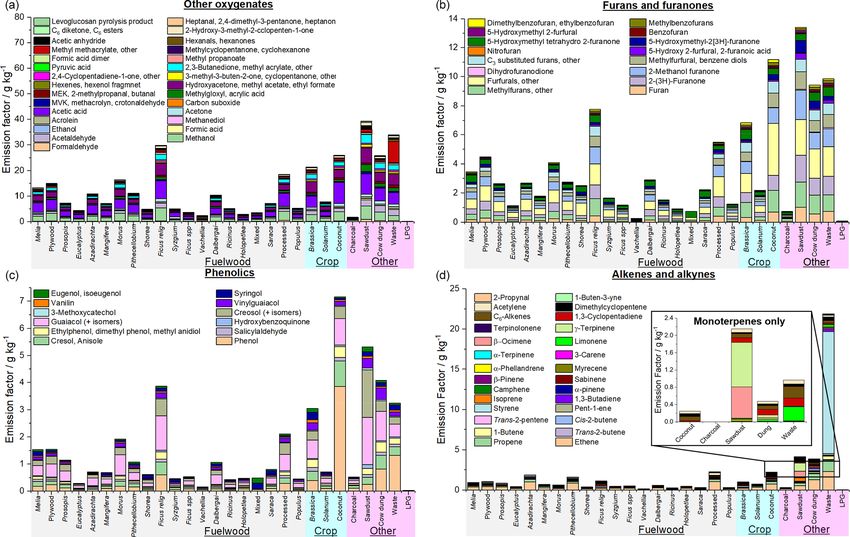
Figure 7 shows a detailed breakdown of the mean NMVOC
emission factors by fuel type measured for all 76 burns (see
Sect. S3 for values). Emission factors have been determined Figure 7a shows very large emissions of smaller oxy-
by calculating the mean NMVOC concentrations up the flue genated species which were driven by methanol; acetic
over a 30 min period, in line with the GC sample time, with acid; and the unresolved combined peak for hydroxy ace-
any small emissions after this sample window not included. tone, methyl acetate, and ethyl formate. For the fuelwood
This has been related to the total volume of air convectively samples, acetic acid/glycolaldehyde (2.6 g kg−1 ), methanol
drawn up the flue and the mass of fuel burnt (see Sect. S4 for (1.8 g kg−1 ) and acetaldehyde (0.6 g kg−1 ) compared well
details). The data are split by functionality to show trends for with mean values reported by Koss et al. (2018) for pines, firs
different chemical types. This shows that burning released a and spruces (2.7/1.3/1.2 g kg−1 ) and the mean values mea-
large amount of different NMVOCs across a wide range of sured by Stockwell et al. (2015) mainly from crop residues,
functionalities, molecular weights and volatilities. The large grasses and spruces (1.6/1.3/0.9 g kg−1 ). The emission factor
variety of NMVOCs are likely to have different influences on from this study for the unresolved peak of hydroxy acetone,
O3 formation, SOA production and the toxicity of emissions. methyl acetate and ethyl formate (1.4 g kg−1 ) was larger than
https://doi.org/10.5194/acp-21-2383-2021 Atmos. Chem. Phys., 21, 2383–2406, 2021
2392                             G. J. Stewart et al.: Emissions of NMVOCs from domestic fuel combustion in India

Figure 7.

Atmos. Chem. Phys., 21, 2383–2406, 2021                                  https://doi.org/10.5194/acp-21-2383-2021
G. J. Stewart et al.: Emissions of NMVOCs from domestic fuel combustion in India                            2393

Figure 7. Measured emission factors grouped by functionality.

https://doi.org/10.5194/acp-21-2383-2021                                  Atmos. Chem. Phys., 21, 2383–2406, 2021
2394                                   G. J. Stewart et al.: Emissions of NMVOCs from domestic fuel combustion in India

those previously reported by Koss et al. (2018) and Stockwell      being composed of around 75 % cellulose or hemi-cellulose
et al. (2015) of 0.55 and 0.25 g kg−1 , respectively.              and 25 % lignin (Sjöström, 1993).
   Figure 7b shows that there were large emissions of fu-             Figure 7d shows that the largest alkene emission was
rans and furanones from combustion, mainly from methyl             styrene from burning municipal solid waste, likely caused by
furans, furfurals, 2-(3H)-furanone, methyl furfurals and 2-        the presence of polystyrene in the fuel. Emissions of alkenes
methanol furanone. The World Health Organization consid-           from fuelwood were dominated by ethene and propene,
ers furan a carcinogenic species of high priority (WHO,            which are species with high photochemical ozone creation
2016) with furan and substituted furans suspected to be toxic      potentials (Cheng et al., 2010). Monoterpenes, which are ex-
and mutagenic (Ravindranath et al., 1984; Peterson, 2006;          tremely reactive with the OH radical (Atkinson and Arey,
Monien et al., 2011). Furan emissions originate from the           2003), were emitted from combustion of sawdust, cow dung
low-temperature depolymerisation of hemi-cellulose (Seki-          cake and municipal solid waste samples.
moto et al., 2018) and from large alcohols and enols in high-         Ethane and propane dominated the alkane emissions for
temperature regions of hydrocarbon flames (Johansson et al.,       fuelwood samples (see Fig. 7e). A wider range of alkanes
2016). The OH chemistry of furans has been the subject of          from C2 –C20 were observed from combustion of coconut,
several studies (Bierbach et al., 1994; Bierbach et al., 1995;     cow dung cake and municipal solid waste. The largest alkane
Tapia et al., 2011; Liljegren and Stevens, 2013; Strollo and       emission by mass was from LPG due to unburnt propane and
Ziemann, 2013; Zhao and Wang, 2017; Coggon et al., 2019)           butane.
and often produces more reactive products such as butene-             Nitrogen-containing NMVOCs are formed from the
dial, 4-oxo-2-pentenal and 2-methylbutenedial (Bierbach et         volatilisation and decomposition of nitrogen-containing
al., 1994; Gómez Alvarez et al., 2009; Aschmann et al.,            compounds within the fuel, mainly from free amino acids
2011, 2014). Photo-oxidation of furans may also be a poten-        but can also be from pyrroline, pyridine and chlorophyll
tially important source of small organic acids such as formic      (Leppalahti and Koljonen, 1995; Burling et al., 2010; Ren
acid (Wang et al., 2020). Oxidation can also occur by ni-          and Zhao, 2015). Nitrogen-containing NMVOCs are of in-
trate (Berndt et al., 1997; Colmenar et al., 2012) or chlorine     terest because nitrogen may be important in the develop-
radicals (Cabañas et al., 2005; Villanueva et al., 2007). As       ment of new particles (Smith et al., 2008; Kirkby et al.,
a result, furans have recently been shown to be some of the        2011; Yu and Luo, 2014), which act as cloud condensa-
species with the highest OH reactivity from biomass burning,       tion nuclei (Kerminen et al., 2005; Laaksonen et al., 2005;
causing an estimated 10 % of the O3 produced by the com-           Sotiropoulou et al., 2006) and alter the hydrological cycle
bustion emissions in the first 4 h after emission (Hartikainen     by forming new clouds and precipitation (Novakov and Pen-
et al., 2018; Coggon et al., 2019). Oxidation of furans can        ner, 1993). They can also contribute to light-absorbing brown
lead to SOA production (Gómez Alvarez et al., 2009; Strollo        carbon (BrC) aerosol formation, effecting climate (Laskin et
and Ziemann, 2013) with an estimated 8 %–15 % of the SOA           al., 2015). Additionally, nitrogen-containing NMVOCs can
caused by furans emitted by burning of black spruce, cut           be extremely toxic (Ramírez et al., 2012, 2014; Farren et al.,
grass, Indonesian peat and ponderosa pine and 28 %–50 % of         2015). Cow dung cake was the largest emitter of nitrogen-
the SOA from rice straw and wire grass (Hatch et al., 2015),       containing NMVOCs (4.9 g kg−1 ), releasing large amounts
although SOA yields are still uncertain for many species           of acetonitrile and nitriles, likely to have a large impact on
(Hatch et al., 2017).                                              the toxicity and chemistry of emissions (see Fig. 7f).
   Phenols are formed from the low-temperature depolymeri-            Figure 7g shows that emissions of aromatics from fuel-
sation of lignin (Simoneit et al., 1993; Sekimoto et al., 2018),   wood, cow dung cake and municipal solid waste were princi-
which is a polymer of randomly linked, amorphous high-             pally benzene, toluene and naphthalenes. Large emissions of
molecular-weight phenolic compounds (Shafizadeh, 1982).            benzene were unsurprising as biomass burning is the largest
Owing to their high emission factors and SOA formation po-         global benzene source (Andreae and Merlet, 2001). Emis-
tentials, phenolic compounds contribute significantly to SOA       sions of benzene, toluene, ethylbenzene and xylenes (BTEX)
production from biomass burning emissions (Yee et al., 2013;       from cow dung cake (0.5–1.7 g kg−1 ) were in line with pre-
Lauraguais et al., 2014; Gilman et al., 2015; Finewax et al.,      vious measurements of 1.3 g kg−1 (Koss et al., 2018) and
2018). Figure 7c shows that the largest phenolic emissions         1.8 g kg−1 (Fleming et al., 2018), but they were lower than
from fuelwood in this study were methoxyphenols, with              the 4.5 g kg−1 reported from cow dung cake combusted from
significant contributions from phenol, guaiacol, cresols and       Nepal (Stockwell et al., 2016). Emissions of BTEX from mu-
anisole. Phenolic emissions from sawdust were dominated by         nicipal solid waste burning (0.9–2.6 g kg−1 ) were compara-
guaiacol and creosol. Phenolic emissions from coconut shell        ble to those measured previously (3.5 g kg−1 ) (Stockwell et
were greatest, most likely as a result of the lignin-rich na-      al., 2016).
ture of coconut shell (Pandharipande et al., 2018). The larger        Figure 7h shows a qualitative comparison of species such
mean emission of furanics (3.2 g kg−1 ) compared to pheno-         as ammonia, HCN and dimethyl sulfide which were mea-
lics (1.1 g kg−1 ) from fuelwood was consistent with wood          sured during experiments, but they could not be accurately
                                                                   quantified as their sensitivity was too different from the

Atmos. Chem. Phys., 21, 2383–2406, 2021                                             https://doi.org/10.5194/acp-21-2383-2021
G. J. Stewart et al.: Emissions of NMVOCs from domestic fuel combustion in India 2395 NMVOCs used to build the transmission curve. Cow dung with the daily mixed waste and plastic bags collected at a US cake emitted significantly more of these species than other fire services laboratory (Stockwell et al., 2015) and a vari- fuel types. ety of mixed waste and plastics collected from around Nepal Table 2 shows the total measured emission factors of (Stockwell et al., 2016). It seems noteworthy that combus- NMVOCs for different fuel types. The total measured emis- tion experiments of fuels collected from developing coun- sion factor has been calculated as the sum of the PTR-ToF- tries in Stockwell et al. (2016) had larger emission factors MS signal, excluding reagent ion peaks (< m/z 31 Th), wa- than those collected from and burnt at a laboratory (Stock- ter cluster peaks (m/z 37 Th) and isotope peaks identified for well et al., 2015). The mean crop residue combustion emis- all masses (SIS, 2016). The emission factors for all alkanes sion factor (37.9 g kg−1 ) was comparable to that reported by and alkenes measured by the GC instruments were also in- Stockwell et al. (2015), despite the small number of samples cluded, as alkanes up to n-hexane had proton affinities less in this study and compositional differences. than water and larger alkanes had proton affinities similar to Considerable uncertainties exist in consumption estimates water (Ellis and Mayhew, 2014; Wróblewski et al., 2006). for fuels such as cow dung cake and municipal solid waste This low sensitivity meant that no peaks were present in the in India. A previous study estimated that in 1985 in India PTR-ToF-MS spectra for these larger species. Any alkenes fuelwood consumption was 220 Tg and cow dung cake con- measured by the DC-GC-FID were excluded from the PTR- sumption 93 Tg (Yevich and Logan, 2003). A different study ToF-MS data. Further information on the species included in made an India-wide estimate for 2000 which estimated fu- the calculation of the total measured emission factor is given elwood consumption to be 281 (192–409) Tg and cow dung in Sect. S5. cake consumption to be 62 (35–128) Tg (Habib et al., 2004). Coconut shell, sawdust, cow dung cake and municipal A more recent study estimated fuelwood usage at 256 Tg and solid waste released the greatest mass of NMVOC per kilo- cow dung cake consumption at 106 Tg for 2007 (Singh et gram of fuel burnt. The mean emission factor for all fuel- al., 2013). Estimates of the amount of municipal solid waste wood types (18.7 g kg−1 ) was comparable to that for cha- burnt in India are even fewer than for cow dung cake con- parral (16.6 g kg−1 ) measured using PTR-ToF-MS by Stock- sumption. Two previous studies have estimated that 81.4 Tg well et al. (2015). This may be due to similarities be- of municipal solid waste was burnt in India in 2010 (Wiedin- tween north Indian fuelwood types with chaparral, which myer et al., 2014) and that 68 (45–105) Tg was burnt in 2015 is characterised by hot dry summers, and mild wet win- (Sharma et al., 2019). The mean emission factors for cow ters. The mean fuelwood emission factor was smaller than dung cake and municipal solid waste combustion were con- Stockwell et al. (2015) reported for coniferous canopy siderably larger than for fuelwood, and they highlight that at (31.0 g kg−1 ). The NMVOC emission measured for cow an India-wide level these may represent significant NMVOC dung cake (62.0 g kg−1 ) was comparable to that previously sources. reported (66.3 g kg−1 ) in literature using PTR-ToF-MS (Koss Intermediate-volatility organic compounds (IVOCs) are et al., 2018) but 2–3 times larger than that measured by GC- defined as having effective saturation concentration, C ∗ , in FID/ECD/MS likely due to those techniques missing signifi- the range 300–3 × 10⁶ µg m−3 (Donahue et al., 2012). The cant amounts of emissions (Fleming et al., 2018). Whilst the C ∗ of several species was estimated using a previously es- total measured emissions reported by Fleming et al. (2018) tablished approach (Lu et al., 2018), with the IVOC bound- might therefore be an underestimate, it is noteworthy that the ary defined in this study at benzaldehyde (m = 106.12), for emission factors measured by Fleming et al. (2018) in angithi which C ∗ was ∼ 7 × 10⁶ µg m−3 . Table 2 also shows an ap- stoves for cow dung cake were a factor of ∼ 4 greater than fu- proximation for the mean amount of IVOCs released by fuel elwood under the same conditions. This result was compara- type. This approach was approximate as vapour pressures ble to this study, which showed that cow dung cake emissions depend on both mass and functionality. The fuels tested in were a factor of ∼ 3 larger than fuelwood, but the techniques this study showed that mean emissions of IVOC species rep- used here targeted a greater proportion of total emissions. resented approximately 18 %–27 % of total measured emis- Moreover, Fleming et al. (2018) reported emission factors sions from all fuel types other than LPG. This demonstrated from combustion of biomass fuels from a neighbouring state, that domestic solid-fuel combustion is potentially a large Haryana, and there may be slight heterogeneity between global source of IVOCs. In addition, this may represent an the different fuels collected in both studies. Venkataraman underestimate because, the quartz filter placed on the sam- et al. (2010) and Koss et al. (2018) also showed NMVOC ple line may remove IVOC species which have partitioned emissions from dung combustion to be greater than from to the aerosol phase due to the high aerosol concentrations fuelwood. NMVOC emissions from municipal solid waste present during source testing. Further studies are required to (87.3 g kg−1 ) were significantly larger than the ∼ 9 g kg−1 better understand the contribution of IVOC emissions from (Stockwell et al., 2015) and ∼ 35 g kg−1 (Stockwell et al., biomass burning to SOA formation. This is evaluated as part 2016) previously reported. This was likely due to differences of a different study, using the dataset generated as part of this in composition and moisture content of the fuels collected study and provided elsewhere (Stewart et al., 2021b). from Indian landfill sites for the present study, compared https://doi.org/10.5194/acp-21-2383-2021 Atmos. Chem. Phys., 21, 2383–2406, 2021
2396 G. J. Stewart et al.: Emissions of NMVOCs from domestic fuel combustion in India
Table 2. Mean total measured NMVOC emission factors (g kg−1 , including IVOC fraction) where high and low EF represent the largest and
smallest emission factors, respectively, measured for a given sample type (g kg−1 ); IVOC is the sum of emission factors of species with a
mass greater than benzaldehyde (g kg−1 ), where n represents the number of measurements made.
Wood Dung Waste LPG Charcoal Sawdust Crop
NMVOC 18.7 62.0 87.3 5.7 5.4 72.4 37.9
High EF 96.7 83.0 119.1 9.8 7.9 114.0 73.8
Low EF 4.3 35.3 56.3 1.9 2.4 28.3 8.9
IVOC 3.5 12.6 13.2 0.2 1.4 16.9 8.0
n 51 8 3 3 2 2 6
Figure 8. Variability in NMVOC emission factor by fuel type. (a) Range of emission factors measured for fuelwood, cow dung cake, crop
residue and municipal solid waste samples with boxplots showing the mean, median, interquartile range and range within 1.5IQR and solid
circles showing the spread of measured emission factors by fuel type. (b) Zoomed-in green region displaying range of NMVOC emission
factors measured for individual species of fuelwood with the grey shaded region indicating repeat samples from the same sample collection
location and diamonds indicating the measured NMVOC emission factors.
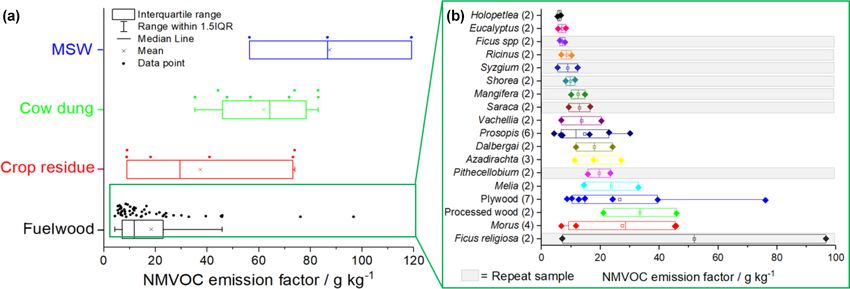
Figure 8a shows the distribution of total measured ing significantly different in terms of composition. Despite
NMVOC emission factors for fuelwood, cow dung cake, the samples for Holoptelea spp. and Eucalyptus spp. com-
crop residues and municipal solid waste (MSW). Boxplots ing from different locations, emission factors for these sam-
show the mean, median, interquartile range and range within ples were quite reproducible and only varied by a factor of
1.5IQR. The solid circles display the spread of measured 1.2–1.5. For the remaining identical species of fuelwood col-
emission factors by fuel type. The zoomed-in green region lected from different locations, emission factors varied over
given in Fig. 8b specifically focuses on the variability in a much larger range by factors of ∼ 2–9.
emission factors of individual species of fuelwood, which For the crop residue species studied here, NMVOC emis-
has been explored in detail due to the large number of sam- sions were right skewed with a median of 29.5 g kg−1 , which
ples. Repeat samples collected from the same location are was less than the mean of 37.9 g kg−1 and varied from 8.9–
shaded in grey. For fuelwood, measured NMVOC emission 73.8 g kg−1 with an interquartile range of 53.9 g kg−1 . Cocos
factors varied by over a factor of 20 between 4.3–96.7 g kg−1 . nucifera and Solanum melongena were repeat measurements
The NMVOC emission factors showed a right-skewed distri- of fuel collected from the same location and varied by factors
bution with a median of 11.7 g kg−1 , mean of 18.7 g kg−1 of 1.8–2. NMVOC emissions from Brassica spp. fuel, which
and an interquartile range of 15.3 g kg−1 . For repeat mea- was collected from different locations, varied by a factor of
surements of identical species of fuelwood collected at the ∼ 8. Cow dung cake and MSW samples were all collected
same location, except for Ficus religiosa, measured emission from different locations and varied by up to factors of 2.4
factors from repeat experiments varied over a much smaller and 2.1, respectively.
range, by up to a factor of 2.3. Variation between emissions Figure 9a shows the mean total emissions measured in
from these samples were likely due to different moisture con- this study for different fuel types split by functionality.
tents of actual samples measured and the specific combus- Large variability in total measured emissions were observed
tion conditions of individual burns. The large variation ob- for fuelwood, with emission factors from individual burns
served for Ficus religiosa was likely due to the samples be- varying by a factor of ∼ 20. Figure 9b shows the mean
Atmos. Chem. Phys., 21, 2383–2406, 2021 https://doi.org/10.5194/acp-21-2383-2021You can also read