Thalamus and claustrum control parallel layer 1 circuits in retrosplenial cortex
←
→
Page content transcription
If your browser does not render page correctly, please read the page content below

RESEARCH ARTICLE

                                    Thalamus and claustrum control parallel
                                    layer 1 circuits in retrosplenial cortex
                                    Ellen KW Brennan1,2†, Izabela Jedrasiak-Cape1†, Sameer Kailasa3†,
                                    Sharena P Rice1,2, Shyam Kumar Sudhakar1, Omar J Ahmed1,2,4,5,6*
                                    1
                                     Department of Psychology, University of Michigan, Ann Arbor, United States;
                                    2
                                     Neuroscience Graduate Program, University of Michigan, Ann Arbor, United
                                    States; 3Department of Mathematics, University of Michigan, Ann Arbor, United
                                    States; 4Michigan Center for Integrative Research in Critical Care, University of
                                    Michigan, Ann Arbor, United States; 5Kresge Hearing Research Institute, University
                                    of Michigan, Ann Arbor, United States; 6Department of Biomedical Engineering,
                                    University of Michigan, Ann Arbor, United States

                                    Abstract The granular retrosplenial cortex (RSG) is critical for both spatial and non-spatial
                                    behaviors, but the underlying neural codes remain poorly understood. Here, we use optogenetic
                                    circuit mapping in mice to reveal a double dissociation that allows parallel circuits in superficial RSG
                                    to process disparate inputs. The anterior thalamus and dorsal subiculum, sources of spatial
                                    information, strongly and selectively recruit small low-rheobase (LR) pyramidal cells in RSG. In
                                    contrast, neighboring regular-spiking (RS) cells are preferentially controlled by claustral and
                                    anterior cingulate inputs, sources of mostly non-spatial information. Precise sublaminar axonal and
                                    dendritic arborization within RSG layer 1, in particular, permits this parallel processing. Observed
                                    thalamocortical synaptic dynamics enable computational models of LR neurons to compute the
                                    speed of head rotation, despite receiving head direction inputs that do not explicitly encode
                                    speed. Thus, parallel input streams identify a distinct principal neuronal subtype ideally positioned
*For correspondence:                to support spatial orientation computations in the RSG.
ojahmed@umich.edu
†
 These authors contributed
equally to this work
                                    Introduction
Competing interests: The
                                    Activity in the granular retrosplenial cortex (RSG) is correlated with a wide variety of behaviors,
authors declare that no
                                    including spatial navigation, learning, memory, fear conditioning, imagination, and planning for the
competing interests exist.
                                    future (Alexander et al., 2020; Alexander and Nitz, 2017; Chang et al., 2020; Chrastil, 2018;
Funding: See page 31                Hinman et al., 2018; Mao et al., 2018; Miller et al., 2021; Miller et al., 2019). The RSG is also
Received: 18 August 2020            among the most densely connected regions of the brain, integrating inputs from a bevy of cortical
Accepted: 17 May 2021               and subcortical sources and serving as part of the default mode network (Greicius et al., 2009;
Published: 25 June 2021             Kaboodvand et al., 2018; Liu et al., 2019; Whitesell et al., 2021). While these anatomical connec-
                                    tions are well-documented (Van Groen and Wyss, 2003; van Groen and Wyss, 1990;
Reviewing editor: Mario Penzo,
National Institute of Mental
                                    Whitesell et al., 2021; Wyss and Van Groen, 1992), few studies have examined their functional
Health, United States               nature (Nitzan et al., 2020; Yamawaki et al., 2019b; Yamawaki et al., 2019a; Yamawaki et al.,
                                    2016a), and cell-type specificity has yet to be sufficiently explored. Such knowledge is critical to
   Copyright Brennan et al. This
                                    develop a mechanistic understanding of how the RSG integrates information from multiple sources
article is distributed under the
                                    to carry out its spatial and non-spatial functions.
terms of the Creative Commons
Attribution License, which             Cortical regions, including the RSG, receive inputs from one or more thalamic nuclei (Herken-
permits unrestricted use and        ham, 1986; Herkenham, 1980; Jones, 2001; Jones, 1998; Peters, 1979; Van Groen and Wyss,
redistribution provided that the    1995). Thalamic relay cells (Clascá et al., 2012) are grouped into three distinct classes: core, intrala-
original author and source are      minar, and paralaminar/ventral midline (matrix) nuclei (Hanbery and Jasper, 1953; Herken-
credited.                           ham, 1986; Jones, 2001; Jones, 1998; Morison and Dempsey, 1941; Rubio-Garrido et al., 2009).

Brennan, Jedrasiak-Cape, Kailasa, et al. eLife 2021;10:e62207. DOI: https://doi.org/10.7554/eLife.62207                                1 of 42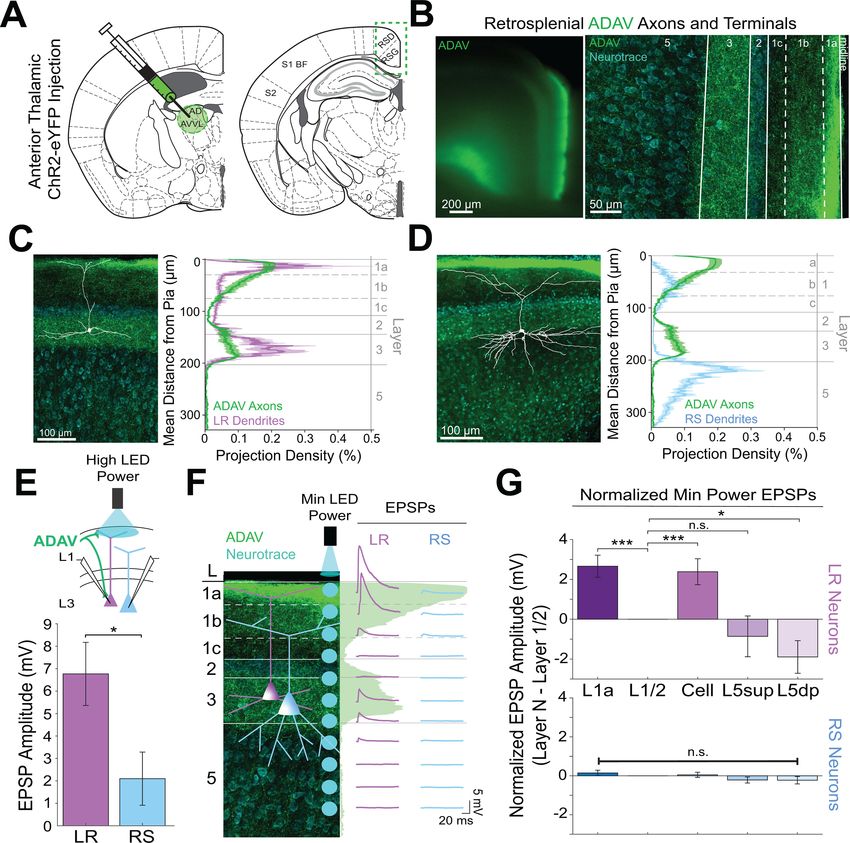
Research article                                                                                                    Neuroscience

                                    eLife digest Sitting in your car, about to drive home after a long day at work, you realize you
                                    have no idea which way to go: you recognize where you are right now, and you remember the name
                                    of the street your house is on, but you cannot figure out how to get there. This spatial disorientation
                                    happens to people with damage to a brain region called the retrosplenial cortex, whose role and
                                    inner workings remain poorly understood. Recent evidence has shown that this area contains ‘low-
                                    rheobase’ neurons which are not seen anywhere else in the brain, but what do these neurons do?
                                       Brennan, Jedrasiak-Cape, Kailasa et al. decided to explore the role of these neurons, focusing on
                                    the brain regions they are connected to. Experiments were conducted in mice using optogenetics, a
                                    technique that activates neurons using pulses of light. This revealed that brain areas involved in
                                    processing information about direction and position preferentially communicate with low-rheobase
                                    neurons rather than with nearby, more standard neurons in the retrosplenial cortex. The way these
                                    spatial signals are sent to the low-rheobase neurons allows these cells to ‘calculate’ how fast a
                                    mouse is turning its head using only information about which direction the mouse is facing.
                                    Essentially, this neuron can turn directional compass-like signals into a gyroscope signal that can
                                    track both direction and speed of head movement. These unique neurons may therefore be ideally
                                    suited to combine information about direction and space, suggesting that they may have evolved
                                    specifically to support spatial navigation.
                                       Individuals with Alzheimer’s disease show exactly the same type of spatial disorientation as
                                    individuals with direct damage to the retrosplenial cortex. This region is also one of the first to show
                                    altered activity in Alzheimer’s disease. Exploring whether these unique retrosplenial neurons and
                                    their communication patterns are altered in Alzheimer’s disease models could help to understand
                                    and potentially treat this debilitating condition.

                                    Thalamic matrix nuclei project predominantly to layer 1 of many cortical regions (Herkenham, 1986;
                                    Herkenham,        1980), resulting      in subtype-specific     activation    of cortical    inhibitory
                                    (Anastasiades et al., 2021; Cruikshank et al., 2012; Delevich et al., 2015) and excitatory neurons
                                    (Collins et al., 2018; Cruikshank et al., 2012; Guo et al., 2018; Rodriguez-Moreno et al., 2020;
                                    Rubio-Garrido et al., 2009; Van der Werf et al., 2002; Yamawaki et al., 2019b). Matrix thalamo-
                                    cortical (TC) inputs from the anterior thalamus, which contains the highest proportion of head direc-
                                    tion cells in the brain (Taube and Bassett, 2003), influence layer 5 pyramidal cells in RSG
                                    (Yamawaki et al., 2019b). However, potential subtype-specific responses and their functional
                                    impact on the encoding of directional information in RSG have yet to be examined.
                                       The cortex, including the RSG, also receives widespread inputs from the densely connected claus-
                                    trum (Brown et al., 2017; Crick and Koch, 2005; Goll et al., 2015; Jackson et al., 2018;
                                    Kim et al., 2016; Narikiyo et al., 2020; Wang et al., 2017; White and Mathur, 2018). As with TC
                                    signaling, the claustrum innervates both excitatory (da Costa et al., 2010; Narikiyo et al., 2020)
                                    and inhibitory (Jackson et al., 2018; Narikiyo et al., 2020; Salerno et al., 1984) neurons via precise
                                    laminar targeting (Wang et al., 2017) and projects to many of the same cortical regions as the thala-
                                    mus (Burman et al., 2011). Claustrocortical (ClaC) projections are thought to regulate complex func-
                                    tions (Crick and Koch, 2005; Goll et al., 2015; Jackson et al., 2018; Kitanishi and Matsuo, 2017;
                                    Narikiyo et al., 2020; Renouard et al., 2015; Smith et al., 2012; White and Mathur, 2018), includ-
                                    ing the coordination and amplification of correlated signals across cortical regions (Kim et al., 2016;
                                    Smith et al., 2012; Smythies et al., 2012). Surprisingly, the RSG is one of few regions that does not
                                    return reciprocal connections to the claustrum (Zingg et al., 2018). Despite the unique unidirectional
                                    nature of this connection, no studies have investigated the functional nature or subtype-specificity of
                                    ClaC inputs to RSG neurons.
                                       Each cortical region also receives inputs from select other cortical areas. The RSG receives direct
                                    innervation from the secondary motor cortex (Yamawaki et al., 2016a), contralateral RSG (Sem-
                                    pere-Ferràndez et al., 2018; Wyss et al., 1990), and anterior cingulate cortex (ACC; Van Groen
                                    and Wyss, 2003; van Groen and Wyss, 1990), among others. The RSG and ACC, in particular, have
                                    been implicated in several shared limbic and cognitive functions, including fear conditioning

Brennan, Jedrasiak-Cape, Kailasa, et al. eLife 2021;10:e62207. DOI: https://doi.org/10.7554/eLife.62207                              2 of 42
Research article                                                                                                    Neuroscience

                                    (Frankland et al., 2004; Han et al., 2003; Yamawaki et al., 2019a; Yamawaki et al., 2019b), but
                                    the cellular targets of ACC inputs to RSG have not been identified.
                                       Thalamic, claustral, and cortical inputs all converge in the RSG, but whether they do so via parallel
                                    or integrative control of target excitatory neurons remains unknown. Within the RSG, the superficial
                                    layers contain two subtypes of principal excitatory pyramidal neurons that have strikingly distinct
                                    physiology, morphology, and computational capabilities: the low-rheobase (LR) neuron and the reg-
                                    ular-spiking (RS) neuron (Brennan et al., 2020; Kurotani et al., 2013; Yousuf et al., 2020). Here,
                                    we use channelrhodopsin (ChR2)-assisted circuit mapping (CRACM) to study the subtype-specific cir-
                                    cuits formed by anterior thalamic, claustral, anterior cingulate, and dorsal subicular inputs to the
                                    RSG. Our results reveal a double dissociation in the precise organization of afferent axons and princi-
                                    pal cell dendrites that can support parallel processing in superficial RSG. Specifically, we find that
                                    anterior thalamus and dorsal subiculum preferentially control LR neurons, whereas claustrum and
                                    anterior cingulate control RS cells. We show that the synaptic dynamics of thalamic inputs allow for
                                    the robust encoding of angular speed by LR cell models, even though these inputs only explicitly
                                    contain information about head direction, not speed. Together, our results suggest that LR neurons
                                    are ideally positioned to contribute to the initial spatial orientation computations performed in
                                    superficial RSG.

                                    Results
                                    Cell-type-specific thalamic control of layer three pyramidal cells in
                                    granular retrosplenial cortex
                                    Layer 3 of the granular retrosplenial cortex (RSG) contains two types of principal pyramidal neurons:
                                    the low-rheobase (LR) neuron and the regular-spiking (RS) neuron (Brennan et al., 2020;
                                    Kurotani et al., 2013; Yousuf et al., 2020). Using whole-cell patch clamp recordings, we again dis-
                                    tinguished LR from RS neurons by their unique intrinsic properties, predominantly the low rheobase,
                                    high input resistance, lack of adaptation, and narrow spike width (Figure 1A–C, Figure 1—figure
                                    supplement 1, Supplementary file 1 - Table 1, and Supplementary file 1 - Table 2; Brennan et al.,
                                    2020). We used channelrhodopsin-assisted circuit mapping (CRACM) to interrogate inputs to these
                                    two cell types. Consistent with previous studies (Odagiri et al., 2011; Van Groen and Wyss, 2003;
                                    van Groen and Wyss, 1990; Yamawaki et al., 2019b), virus injections into the anterodorsal and
                                    anteroventral thalamic nuclei (ADAV) resulted in ChR2-eYFP expression in thalamocortical (TC) axons
                                    and terminals predominantly in layer 1a (L1a; the most superficial part of layer 1) and in layer 3 (L3)
                                    of superficial RSG (Figure 1D). To test whether these thalamocortical inputs target the LR and RS
                                    neurons in layer 3, we stimulated the thalamic axons and terminals with 1 ms LED pulses at a 10 Hz
                                    frequency for 1 s at high LED power over the cell body of the patched neurons (Figure 1E; see
                                    Materials and methods). From resting membrane potentials of approximately 65 mV, LR neurons
                                    were strongly driven past spike threshold by these thalamic inputs while RS neurons exhibited far
                                    smaller EPSPs (Figure 1F). To quantify the impact of TC inputs on LR and RS spike rates, we next
                                    depolarized the cells until they were spiking at 10–25 Hz and delivered a single LED pulse (see
                                    Materials and methods). To rule out effects of feed-forward inhibition in these experiments, the
                                    GABAA antagonist, picrotoxin (50 mM), was added to the bath. Compared to their baseline activity,
                                    this stimulation evoked a significant increase in spiking in LR neurons (p=0.002, Wilcoxon rank sum
                                    test) but not RS neurons (p=0.19, Wilcoxon rank sum test; Figure 1G). The LR neurons thus had a
                                    significantly larger increase in spike rate evoked by the optical pulse than RS neurons (p=0.0012, Wil-
                                    coxon rank sum test; Figure 1H). This suggests that LR neurons receive stronger activation from TC
                                    inputs than their neighboring L3 RS neurons.

                                    Precise overlap of anterior thalamic afferents with LR, but not RS,
                                    apical dendrites
                                    LR neurons are morphologically distinct from their neighboring RS neurons (Brennan et al., 2020;
                                    Kurotani et al., 2013; Yousuf et al., 2020). Given the precise laminar pattern of anterior thalamic
                                    inputs to RSG (Figure 1D and Figure 2B), we next investigated the overlap between anterior tha-
                                    lamic afferents and the dendritic morphologies of reconstructed LR (n = 10) and RS (n = 5) cells (see
                                    Materials and methods). Apical dendrites of LR neurons were most densely localized to L1a, with

Brennan, Jedrasiak-Cape, Kailasa, et al. eLife 2021;10:e62207. DOI: https://doi.org/10.7554/eLife.62207                              3 of 42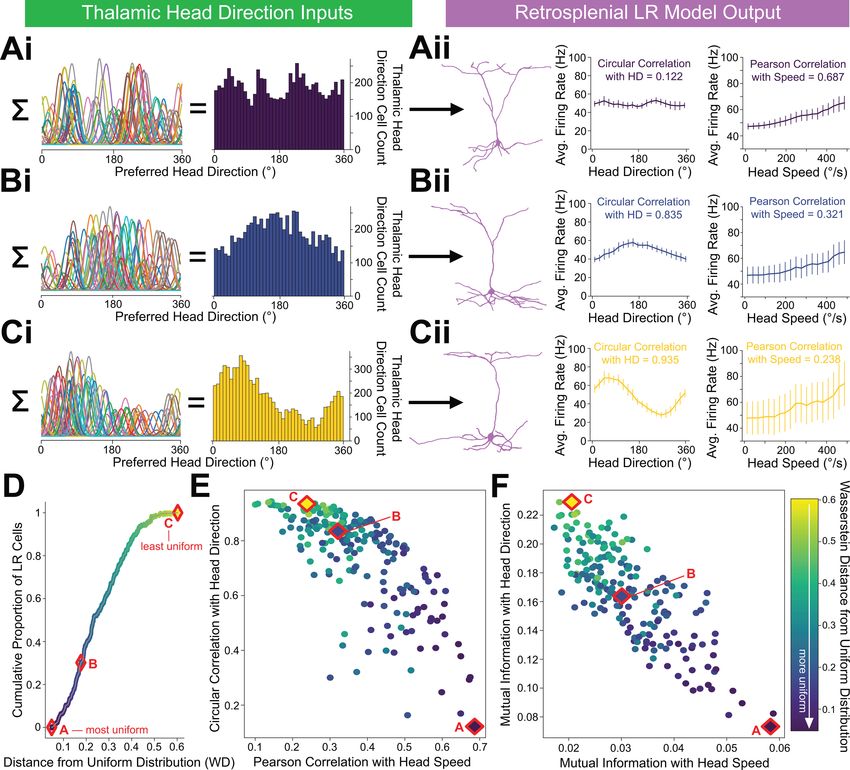
Research article                                                                                                                   Neuroscience

Figure 1. Anterior thalamic input controls LR, but not RS, neurons in superficial granular retrosplenial cortex. (A) Representative example of the firing
properties of LR neurons. Top trace: sustained high-frequency firing of action potentials with little spike frequency adaptation at high current inputs in
response to 200 pA current injection. Bottom trace: Delay to first spike at threshold current inputs (50 pA) and little to no sag when hyperpolarized
( 100 pA). Right inset is a zoomed in view of the first spike in response to a near-threshold current input. Cell is held at 65 mV resting potential. (B)
Figure 1 continued on next page

Brennan, Jedrasiak-Cape, Kailasa, et al. eLife 2021;10:e62207. DOI: https://doi.org/10.7554/eLife.62207                                             4 of 42
Research article                                                                                                                    Neuroscience

Figure 1 continued
Same as A, but for a representative RS neuron. Note the spike frequency adaptation with high current inputs, delay to first spike at near-threshold
current inputs, and sag potential seen with hyperpolarization. Cell is held at 65 mV resting potential. (C) Population data comparisons between LR
and RS neurons of the following intrinsic properties: input resistance (p=1.31e-26; Wilcoxon rank sum), rheobase (p=1.24e-17; Wilcoxon rank sum), and
adaptation ratio (p=2.94e-24; Wilcoxon rank sum). Error bars are standard error of the mean (SEM). (D) Left: Schematic showing the injection of
optogenetic viral construct into the anterodorsal/anteroventral (ADAV) nuclei of the anterior thalamus. Middle: DIC image of RSG. Right: EYFP
fluorescence image of RSG showing expressing anterior thalamic axons and terminal arbors. (E) Schematic of optogenetic stimulation of TC axons and
terminal arbors over the patched cell body in RSG L3. (F) LR (purple) and RS (blue) cell responses to 10 Hz light pulses (see Materials and methods) at
maximum LED power. LR cell shows spiking responses, while the RS cell has very small EPSPs. Both cells were held at 65 mV before stimulation. Blue
triangles indicate light pulses. (G) Optogenetic activation of thalamic axons in RSG increases the firing rate of the LR (purple) but not RS (blue) neuron
in a simultaneously patched pair. Neurons were held in ACSF +picrotoxin at a constant firing rate of 10–30 Hz via a 2 s current injection, and a 1 ms
LED pulse was delivered 500 ms into the spike train (see Materials and methods). Top: Raster plots for all sweeps of a representative LR (purple) and RS
(blue) example. Middle: Firing trace of one sweep for that same LR and RS pair. Bottom: PSTH plots evaluating all sweeps for the same LR and RS
example cells. (H) Population analysis of the spike ratio for all tested LR (n = 7) and RS (n = 6) cells showing a significant increase in firing rate post-LED
pulse in LR cells compared to RS cells (p=0.0012; Wilcoxon rank sum test). Error bars are SEM. See Figure 1—source code 1 and Figure 1—source
data 1 for MATLAB code and source data used to plot bar graphs in panel C and associated supplements.
The online version of this article includes the following source data, source code and figure supplement(s) for figure 1:
Source data 1. Cell-type specific intrinsic physiology.
Source code 1. Code to generate intrinsic physiology comparisons.
Figure supplement 1. Intrinsic properties of RSG layer 3 LR, layer 3 RS, and layer 5 RS neurons.

                                      basal dendrites remaining confined to L3 (Figure 2C). In contrast, RS apical dendrites rarely entered
                                      L1a, instead existing in the deeper subdivisions of layer 1 (L1b/c), with basal dendrites primarily in
                                      upper layer 5 (L5; Figure 2D). Projection density analysis showed localization of ADAV axons and
                                      terminal arbors in L1a and weakly in L3 (Figure 2C&D). Thus, dendrites of LR, but not RS, cells selec-
                                      tively co-localize within layers 1a and 3 with ADAV TC afferents (Figure 2C&D). This anatomical
                                      colocalization of LR, but not RS, dendrites with TC axons coupled with the increase in LR, but not
                                      RS, spiking in response to TC optical stimulation indicates that the anterior thalamic-retrosplenial cir-
                                      cuit at least partially obeys Peters’ rule, which states that neuronal populations with anatomically
                                      overlapping axonal and dendritic arbors are more likely to show functional connectivity Peters, 1979;
                                      Peters and Feldman, 1976.
                                         To further verify this, we examined the responses of L3 LR and RS neurons to ADAV input at L1a,
                                      where the highest projection density of ADAV inputs exist (see Methods). When delivering 1 ms
                                      high LED power light pulses, we indeed found that LR neurons had a significantly larger excitatory
                                      postsynaptic potential (EPSP) amplitude in response to the L1a LED stimulation compared to RS cell
                                      responses (p=0.0185, Wilcoxon rank sum test; Figure 2E). Notably, in response to layer one stimula-
                                      tion, LR cells also showed significantly larger EPSP amplitudes compared to L5 RS neurons (Fig-
                                      ure 2—figure supplement 1), which have been previously shown to respond to TC input
                                      (Yamawaki et al., 2019b). This suggests that LR neurons, rather than layer 3 or 5 RS neurons, are
                                      the predominant RSG cell type receiving and processing head direction inputs from the anterior
                                      thalamus.
                                         To further examine the effects of lamination of anterior thalamic inputs to LR and RS neurons on
                                      their resulting responses, we conducted a high-resolution protocol that used minimum thresholded
                                      LED power to optically stimulate every 20–30 mm along the neuron’s longitudinal axis (Figure 2F;
                                      see Materials and methods). We found that LR neurons have the largest EPSP amplitude when the
                                      LED pulse is targeting layer 1a, corresponding with the peak projection density of ADAV axons and
                                      terminal arbors at this lamina. LR response amplitude then decreases as the LED moves away from
                                      the pia before reaching no response at the layer 1/2 border. As LED stimulation entered layer 3, the
                                      LR EPSP amplitude increased, consistent with the increase in projection density of the ADAV axons
                                      and terminal arbors, before again decreasing until their response amplitude reached 0 mV in layer 5
                                      (Figure 2F). In contrast, the RS neuron showed much smaller EPSP amplitude with no significant vari-
                                      ation in response across the layers (Figure 2F&G). To verify this functional sublaminar correlation
                                      between thalamocortical axons and pyramidal cell dendrites, we ran a population analysis comparing
                                      the EPSP amplitudes within LR and RS cell groups from all layers relative to L1/2, which represents
                                      our minimum projection density of ADAV inputs in the superficial layers. We found that within the LR

Brennan, Jedrasiak-Cape, Kailasa, et al. eLife 2021;10:e62207. DOI: https://doi.org/10.7554/eLife.62207                                                 5 of 42
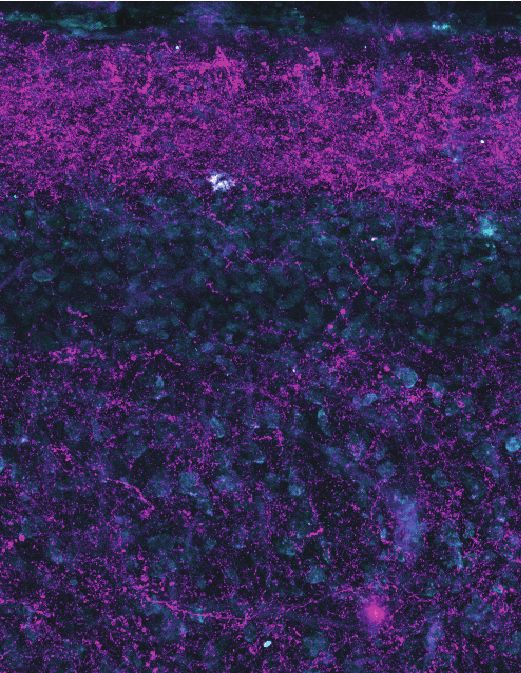
Research article                                                                                                                Neuroscience

Figure 2. Thalamic control of LR neurons is explained by precise convergence of LR dendrites and anterior thalamic axons in layer 1a of granular
retrosplenial cortex. (A) Schematic of channelrhodopsin injection into anterior thalamus (left) and RSG target recording region (right). (B) Left:
epifluorescent image of the retrosplenial cortex showing expression of anterior thalamic axons and terminal arbors in green. Right: confocal image of
layers 1–5 of RSG showing lamination of anterior thalamic axons and terminal arbors (green) and cell membrane marker, NeuroTrace (cyan). (C) Left: LR
reconstruction superimposed on patch location in an RSG slice with thalamic projections (green) and NeuroTrace (cyan). Right: Projection density plot
showing density of LR dendrites (n = 10; mean ± SEM shaded) in purple and density of ADAV axon expression (n = 5; mean ± SEM shaded) in green
plotted as distance from the pia (mm). (D) Same as C for RS cells with dendrites (n = 5) plotted in blue. (E) Top: Schematic of L1a-targeted optogenetic
stimulation. Bottom: Significantly larger EPSP amplitude at high LED power for LR (n = 15) cells compared to RS (n = 8) cells (p=0.0185; Wilcoxon rank
sum test). Error bars are SEM. (F) Left: Confocal image of RSG slice with anterior thalamic axons and terminal arbors (green). Layers are demarcated,
and schematic LR and RS neurons are placed in their representative locations within the superficial layers. Blue circles indicate targeting of minimum
Figure 2 continued on next page

Brennan, Jedrasiak-Cape, Kailasa, et al. eLife 2021;10:e62207. DOI: https://doi.org/10.7554/eLife.62207                                          6 of 42
Research article                                                                                                                   Neuroscience

Figure 2 continued
LED power stimulations, beginning at midline and extending into layer 5, stimulating every 20–30 mm (see Materials and methods). Right:
Representative trace examples of an LR (purple) and RS (blue) neurons’ responses to the LED stimulation at each location. Green shading is
representative of the projection density of thalamic axons and terminal arbors across the shown layers. (G) Population analysis for LR and RS cells’
normalized EPSP responses to minimum LED power optogenetic stimulations at L1a, L1/2 boundary, cell body in L3, superficial L5 (L5sup), and deep L5
(L5dp) locations. Top: LR cells have significantly larger responses at L1a (n = 58, p=0.00001, paired t-test) and cell body (n = 53, p=0.0006) compared to
L1/2 (n = 59). Responses at L5dp (n = 10, p=0.0462) are significantly smaller than L1/2, and responses at L5sup (n = 12, p=0.420) do not significantly differ
from L1/2. Bottom: EPSP amplitude in RS cells does not significantly differ at any stimulation location compared to L1/2 stimulation (L1a: n = 27,
p=0.289; cell body: n = 25, p=0.702; L5sup: n = 12, p=0.197; L5dp: n = 11, p=0.261; L1/2: n = 27). Error bars are SEM. The paired t-test was used for all
statistical comparisons. See Figure 2—source data 1 for source data.
The online version of this article includes the following source data and figure supplement(s) for figure 2:
Source data 1. Laminar-specific responses to ADAV input.
Figure supplement 1. LR neuron responses to anterior thalamic and claustral inputs differ significantly from those of L5 RS cells.

                                      cell population, LR cells have significantly larger responses at L1a (p=0.00001) and cell body
                                      (p=0.0006) compared to L1/2 (paired t-test; Figure 2G). This lamination of functional responses in
                                      the LR population precisely aligns with the lamination of ADAV axons and terminal arbors within
                                      these superficial layers. When stimulating in layer 5, there was no significant difference between
                                      EPSP amplitude at L1/2 and L5sup (p=0.420), while L5dp responses were significantly smaller than
                                      those at L1/2 (p=0.0462; Figure 2G), as would be expected given the complete lack of LR dendrites
                                      in L5. In contrast, RS EPSP amplitudes at layers 1a, cell body, L5sup, and L5dp did not differ from
                                      responses at L1/2 (p>0.05 for all; paired t-test), indicating that there is no significant lamination of
                                      functional responses to thalamic inputs in the RS population, likely due to their relative lack of
                                      response to these inputs in general (Figure 2G). These relationships persisted when inhibition
                                      blocker picrotoxin (50 mM) or sodium channel blocker TTX (1 mM)+4 AP (100 mM) were added to the
                                      bath (data not shown; see Materials and methods). Thus, the connectivity between anterior thalamic
                                      TC arbors and L3 principal neurons in RSG highlights a circuit that depends on the precise sublami-
                                      nar colocalization of both local principal cells’ dendrites and incoming thalamocortical axons. This
                                      demonstrates that LR neurons are uniquely anatomically adapted to respond to incoming inputs
                                      from the anterior thalamus, where ~ 60% of neurons are head direction cells (Taube, 1995;
                                      Taube and Bassett, 2003), due to a precise overlap of their apical dendrites with the dense thalamic
                                      axons and terminals in the uppermost sublamina of L1 (L1a).

                                      Claustrum and anterior cingulate selectively control retrosplenial RS
                                      cells while avoiding LR cells
                                      Two other main sources of input to RSG are the claustrum (CLA; Van Groen and Wyss, 2003;
                                      van Groen and Wyss, 1990) and anterior cingulate cortex (ACC; Shibata and Naito, 2008;
                                      Van Groen and Wyss, 2003; van Groen and Wyss, 1990). Both claustrocortical (ClaC) and ACC
                                      corticocortical (CC) projections have been anatomically shown to exhibit distinct laminar organiza-
                                      tion within its target cortical layers (Van Groen and Wyss, 2003; Vogt and Miller, 1983;
                                      Wang et al., 2017), but the precise functional targets of claustral and cingulate inputs to superficial
                                      RSG have, to our knowledge, never been examined. To address this, we next used CRACM, this
                                      time to examine CLA inputs to RSG LR and RS neurons and then compared these projections to
                                      RSG thalamic inputs. ChR2 injections into CLA (Figure 3A) resulted in expression of CLA axons and
                                      terminals in layers 1 c, 2, and 5 (Figure 3B). This expression pattern is distinct from the thalamic
                                      expression localized to layers 1a and 3 (Figure 2B–D). Dendritic lamination plots of LR and RS den-
                                      drites and projection density plots of CLA axons and terminal arbors show that RS, but not LR, apical
                                      dendrites anatomically overlap with CLA arbors in superficial layers 1 c and two and upper layer 5
                                      (Figure 3D). Using the same targeted optogenetic stimulation approach as previously described
                                      (see Materials and methods), we found that RS neurons have significantly larger responses to CLA
                                      input compared to LR neurons when stimulated at layer 1/2 (p=0.0000035, Wilcoxon rank sum test;
                                      Figure 3E), the area of the strongest superficial projection density of CLA arbors. Similarly, layer 5
                                      RS neurons exhibited significantly larger EPSP amplitudes in response to CLA inputs compared to LR
                                      cells (Figure 2—figure supplement 1). This again indicates that while LR neurons may be optimally

Brennan, Jedrasiak-Cape, Kailasa, et al. eLife 2021;10:e62207. DOI: https://doi.org/10.7554/eLife.62207                                               7 of 42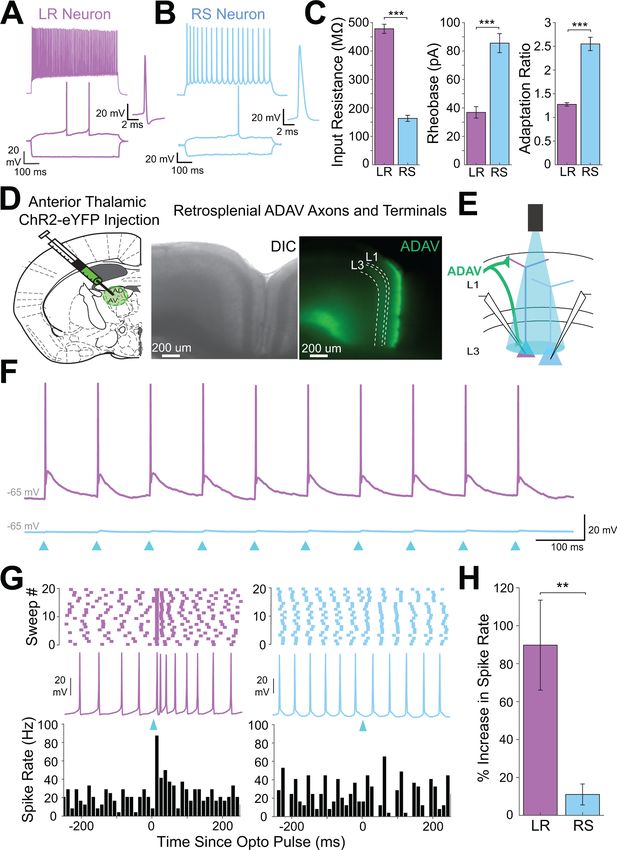
Research article                                                                                                                 Neuroscience

Figure 3. Claustral inputs to RSG selectively drive RS, not LR, neurons, consistent with stronger anatomical overlap of RS neuron dendrites with claustral
axons. (A) Schematic of channelrhodopsin injection into claustrum (CLA; left) and target recording region, RSG (right; see Materials and methods). (B)
Left: Epifluorescent image of the RSG brain slice showing expressing ClaC arbors in red. Right: confocal image of layers 1–5 of RSG showing lamination
of claustral axons and terminal arbors (red) and NeuroTrace (cyan). (C) Left: LR reconstruction superimposed on patch location in an RSG slice with
claustral projections (red) and NeuroTrace (cyan). Right: Projection density plot showing density of LR dendrites in purple (n = 10; mean ± SEM shaded)
and density of CLA axon expression in red (n = 6; mean ± SEM shaded) plotted as distance from pia (mm). (D) Same as C for RS cells with dendrites
(n = 5) plotted in blue. (E) Top: Schematic of L1/2-targeted optogenetic stimulation. Bottom: Significantly larger EPSP amplitude at high LED power for
the RS (n = 16) cells compared to LR (n = 26) cells (p=0.0000035; Wilcoxon rank sum test). Error bars are SEM. (F) Left: Confocal image of RSG slice with
CLA axons and terminal arbors (red) and NeuroTrace (cyan). Layers are demarcated, and schematic LR and RS neurons are placed in their
representative locations within the superficial layers. Blue circles indicate targeting of the minimum LED power stimulations, beginning at midline and
Figure 3 continued on next page

Brennan, Jedrasiak-Cape, Kailasa, et al. eLife 2021;10:e62207. DOI: https://doi.org/10.7554/eLife.62207                                           8 of 42
Research article                                                                                                                  Neuroscience

Figure 3 continued
extending into layer 5, stimulating every 20–30 mm (see Materials and methods). Right: Representative trace examples of an LR (purple) and RS (blue)
neurons’ responses to the LED stimulation at each location. Red shading is representative of the projection density of CLA axons and terminal arbors
across the layers. (G) Population analysis for LR and RS normalized EPSP responses to minimum LED power stimulations at L1a, L1/2, cell body, L5sup,
and L5dp locations. Top: EPSP amplitude in LR cells does not significantly differ at any stimulation location compared to L1a stimulation (L1/2: n = 24,
p=0.5151; L3: n = 23, p=0.3276; L5sup: n = 10, p=0.3434; L5dp: n = 7, p=0.4348; L1a: n = 24). Bottom: RS cells have significantly larger responses at L1/2
(n = 18, p=0.00725) and L5sup (n = 9, p=0.0301) compared to L1a (n = 18), while normalized response amplitudes at cell body (n = 17, p=0.1377) and
L5dp (n = 8, p=0.1355) did not differ from responses at L1a. The paired t-test was used for all statistical analyses. Error bars are SEM. See Figure 3—
source data 1 for source data.
The online version of this article includes the following source data for figure 3:
Source data 1. Laminar-specific responses to CLA input.

                                     positioned to receive thalamic input, RS neurons in both RSG L3 and L5 are instead the primary
                                     recipients of CLA inputs.
                                         To further examine the lamination of ClaC inputs to LR and RS neurons and their resulting
                                     responses, we again conducted the high-resolution CRACM protocol using minimum LED power
                                     (Figure 3F; see Materials and methods). We found that RS neurons have the largest EPSP amplitude
                                     when the LED pulse is stimulating both layer 1c and 5sup and weakest EPSP amplitude at layer 1a,
                                     corresponding with, respectively, the strongest and the weakest projection density of CLA afferents
                                     at these laminar locations. In contrast, the complementary LR cell had no response to LED stimula-
                                     tion at any of the laminar locations (Figure 3F). Population analysis showed that within the RS cell
                                     population, RS cells have significantly larger responses at L1/2 (p=0.00725) and L5sup (p=0.0301)
                                     compared to those at L1a (paired t-test; Figure 3G). This lamination of functional responses in the
                                     RS cell precisely aligns with the lamination of ClaC axons and terminal arbors within these layers. In
                                     contrast, LR EPSP amplitudes across all layers were much lower in magnitude and did not differ from
                                     responses at L1a (p>0.05 for all; paired t-test; Figure 3G), indicating no significant lamination of
                                     functional responses to ClaC inputs in the LR population. These relationships persisted when inhibi-
                                     tion blocker picrotoxin (50 mM) or sodium channel blocker TTX (1 mM)+4 AP (100 mM) were added to
                                     the bath (data not shown; see Materials and methods).
                                         Using the same CRACM approach to examine ACC inputs to RSG (Figure 4A), we found that cor-
                                     ticocortical inputs from the anterior cingulate target L1b/c and, to a lesser extent, L5 (Figure 4B),
                                     partially resembling the laminar pattern seen with CLA arbors (Figure 3B) and overlapping precisely
                                     with RS, but not LR, dendrites (Figure 3C&D). Indeed, when stimulating ACC arbors at L1/2, RS cells
                                     had significantly larger EPSP amplitudes compared to LR cells (p=0.0019). When examining the lami-
                                     nation of these inputs with higher spatial resolution, we found that RS cells have the largest EPSP
                                     response to ACC inputs at L1/2, while the same minimum LED stimulation power elicits no response
                                     in layer 1a (Figure 4F). Population analysis of RS cells revealed significantly larger responses to opto-
                                     genetic stimulation of ACC inputs at the L1/2 (p=0.000037) and cell body (p=0.000525) compared
                                     to L1a stimulation (Figure 4G), reflecting the precise overlap of ACC arbors and RS dendrites. In
                                     contrast, the much smaller LR EPSP amplitudes across all layers did not differ from responses at L1a
                                     (p>0.05 for all; paired t-test; Figure 4G). Again, the same results were seen when inhibition blocker
                                     picrotoxin (50 mM) or sodium channel blocker TTX (1 mM)+4 AP (100 mM) were added to the bath
                                     (data not shown; see Materials and methods). Thus, both claustrocortical and corticocortical inputs
                                     to RSG target RS apical dendrites at the lower divisions of L1 (L1c and L1b/c, respectively), whereas
                                     thalamocortical inputs preferentially target the apical dendrites of LR cells in upper L1 (L1a). This
                                     again indicates that parallel circuits in RSG process TC versus ClaC and CC information, and this par-
                                     allel processing is enabled by precise sublaminar organization of afferent axons and layer three prin-
                                     cipal cell apical dendrites.

                                     Dorsal subiculum selectively controls LR, but not RS, cells
                                     Previous work has shown that dorsal subiculum (DS), which serves to transmit allocentric spatial infor-
                                     mation such as axis cell and boundary vector signals (Lever et al., 2009; Derdikman, 2009;
                                     Olson et al., 2017; Simonnet and Brecht, 2019; Bicanski and Burgess, 2020), also precisely targets
                                     layer 2/3 principal neurons in RSG (Nitzan et al., 2020; Yamawaki et al., 2019a). These inputs over-
                                     lap with LR cell bodies and basal dendrites and have been shown to evoke larger excitatory

Brennan, Jedrasiak-Cape, Kailasa, et al. eLife 2021;10:e62207. DOI: https://doi.org/10.7554/eLife.62207                                            9 of 42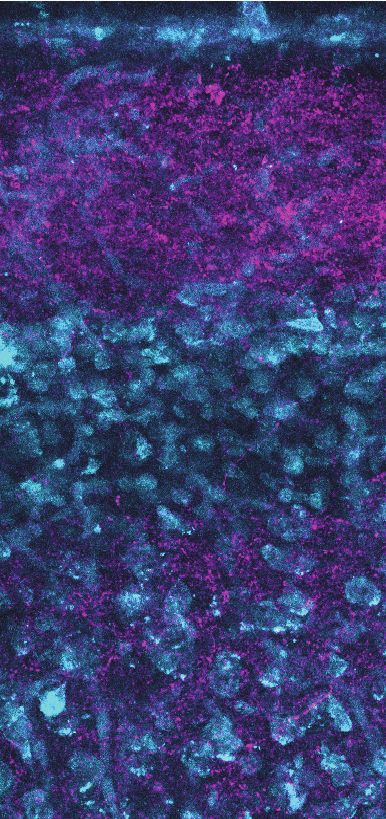
Research article Neuroscience
A B Retrosplenial ACC Axons and Terminals
ACC 5 3 2 1c 1b 1a
midline
D ACC
RS Neurotrace
SG
ChR2-mCherry Inj.
R
ACC
Ant. Cingulate
250 µm 100 µm
C D
Mean Distance from Pia (µm)
Mean Distance from Pia (µm)
0 0
1a a
1b b1
100 1c 100 c
2 2
Layer
Layer
3 3
200 200
5 5
ACC Axons ACC Axons
300 LR Dendrites 300
RS Dendrites
100 µm
0 0.1 0.2 0.3 0.4 0.5 100 µm 0 0.1 0.2 0.3 0.4 0.5
Projection Density (%) Projection Density (%)
E High LED
Power F Min LED
G 2
Normalized Min Power EPSPs
Power EPSPs
LR Neurons
1.5
Normalized EPSP Amplitude (mV)
ACC LR RS
L1
L Neurotrace 1
ACC
n.s.
1a
(Layer N - Layer 1a)
0.5
L3
1b 0
5 ***
1c -0.5
EPSP Amplitude (mV)
L1a L1/2 Cell L5sup L5dp
4 2 2 n.s.
RS Neurons
n.s.
3
3 1.5 **
***
1
2
5 0.5
1 mV
1 0
50 ms
0 -0.5
LR RS
Figure 4. Anterior cingulate inputs to RSG selectively drive RS, not LR, neurons, consistent with anatomical overlap of RS neuron dendrites with anterior
cingulate axons. (A) Schematic of channelrhodopsin injection into anterior cingulate (ACC; left) and target recording region, RSG (right; see
Materials and methods). (B) Left: Epifluorescent image of the RSG brain slice showing expressing ACC arbors in magenta. Right: confocal image of
layers 1–5 of RSG showing lamination of cingulate axons and terminal arbors (magenta) and NeuroTrace (cyan). (C) Left: LR reconstruction
superimposed on patch location in an RSG slice with ACC projections (magenta) and NeuroTrace (cyan). Right: Projection density plot showing density
of LR dendrites (n = 10; mean ± SEM shaded) in purple and density of ACC axon expression (n = 4; mean ± SEM shaded) in magenta plotted as
distance from the pia (mm). (D) Same as C for RS cells with dendrites (n = 5) plotted in blue. (E) Top: Schematic of L1/2-targeted optogenetic
stimulation. Bottom: Significantly larger EPSP amplitude at high LED power for the RS (n = 10) cells compared to LR (n = 16) cells (p=0.0019; Wilcoxon
rank sum test). Error bars are SEM. (F) Left: Confocal image of RSG slice with ACC axons and terminal arbors (magenta) and NeuroTrace (cyan). Layers
Figure 4 continued on next page
Brennan, Jedrasiak-Cape, Kailasa, et al. eLife 2021;10:e62207. DOI: https://doi.org/10.7554/eLife.62207 10 of 42Research article Neuroscience
Figure 4 continued
are demarcated, and schematic LR and RS neurons are placed in their representative locations within the superficial layers. Blue circles indicate
targeting of the minimum LED power stimulations, beginning at midline and extending into layer 5, stimulating every 20–30 mm (see
Materials and methods). Right: Representative trace examples of an LR (purple) and RS (blue) neurons’ responses to the LED stimulation at each
location. Magenta shading is representative of the projection density of ACC axons and terminal arbors across the layers. (G) Population analysis for LR
and RS normalized EPSP responses to minimum LED power stimulations at L1a, L1/2, cell body, L5sup, and L5dp locations. Top: EPSP amplitude in LR
cells does not significantly differ at any stimulation location compared to L1a stimulation (L1/2: n = 19, p=0.1126; cell body: n = 19, p=0.35; L5sup:
n = 13, p=0.3423; L5dp: n = 13, p=0.7166; L1a: n = 19). Bottom: RS cells have significantly larger responses at L1/2 (n = 14, p=0.000037) and cell body
(n = 14, p=0.000525) compared to L1a (n = 14) and did not significantly differ at L5sup (n = 11, p=0.0607) or L5dp (n = 10, p=0.1340) compared to L1a.
The paired t-test was used for all statistical analyses. Error bars are SEM. See Figure 4—source data 1 for source data.
The online version of this article includes the following source data for figure 4:
Source data 1. Laminar-specific responses to ACC input.
postsynaptic currents in superficial compared to layer 5 pyramidal neurons (Nitzan et al., 2020;
Yamawaki et al., 2019a). These results suggest that DS projections to RSC may be targeting LR
cells, potentially resulting in converging spatial information from both ADAV and DS onto LR cells.
However, it remains unknown whether LR or layer 3 RS cells are the predominant target of these DS
projections. To investigate this, we repeated our CRACM protocols and examined the functional
responses of LR and layer 3 RS cells to DS inputs (Figure 5A&B). We found that DS afferents to layer
3 of RSG precisely overlap with LR basal and, to a lesser degree, proximal apical dendrites
(Figure 5C) but not RS basal dendrites (Figure 5D). Correspondingly, LR neurons responded with
significantly larger EPSPs compared to RS neurons when DS inputs were stimulated at the cell body
in layer 3 (p=0.004; Figure 5E). Our high-resolution protocol and population analysis also confirmed
that LR cells had significantly larger responses at layers 1/2 and 3 compared to L1a (L1/2 p=0.0132,
L3 p=0.0135; Figure 5F&G), suggesting the possibility of integration of synchronous anterior tha-
lamic and dorsal subicular inputs by LR neurons. In contrast, RS cells showed no significant laminal
differences in response to DS input (p>0.05 for all; Figure 5G). Thus, inputs from both the dorsal
subiculum and anterior thalamus target LR cells, reflecting their precise overlap with LR dendrites,
while the claustrum and anterior cingulate cortex instead target RS cells.
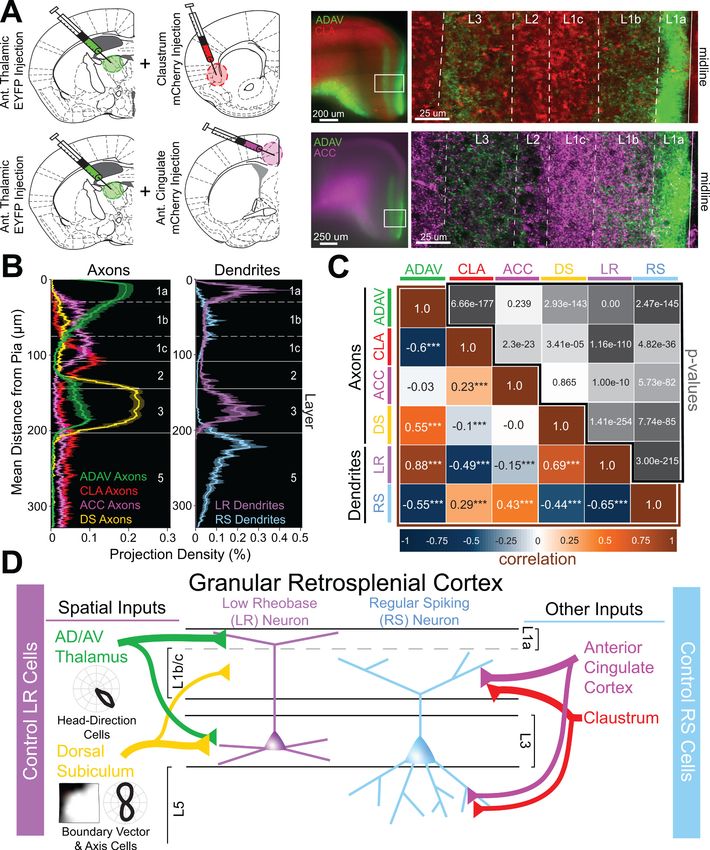
Precise anatomical overlap of LR versus RS dendrites with distinct
incoming axons facilitates parallel circuits in superficial RSG
We next extended our physiological examination of superficial RSG circuits to include correlational
analyses and dual injection experiments (Figure 6A). We found that LR dendrites are strongly and
significantly positively correlated with both ADAV (r = 0.88, pResearch article Neuroscience Figure 5. Dorsal subiculum inputs to RSG selectively drive LR, not RS, neurons, consistent with anatomical overlap of LR neuron dendrites with subicular axons. (A) Schematic of channelrhodopsin injection into dorsal subiculum (DS; left) and target recording region, RSG (right; see Materials and methods). (B) Left: Epifluorescent image of the RSG brain slice showing expressing DS arbors in yellow. Right: confocal image of layers 1–5 of RSG showing lamination of DS axons and terminal arbors (yellow) and NeuroTrace (cyan). (C) Left: LR reconstruction superimposed on patch location in an RSG slice with DS projections (yellow) and NeuroTrace (cyan). Right: Projection density plot showing density of LR dendrites (n = 10; mean ± SEM shaded) in purple and density of DS axon expression (n = 4; mean ± SEM shaded) in yellow plotted as distance from the pia (mm). (D) Same as C for RS cells with dendrites (n = 5) plotted in blue. (E) Top: Schematic of cell body-targeted optogenetic stimulation at high LED power (see Materials and methods) conducted in standard ACSF. Bottom: Bar graph showing significantly larger EPSP amplitude at high LED power for the LR (n = 9) cells compared to RS (n = 8) cells (p=0.004; Wilcoxon rank sum test). Error bars are SEM. (F) Left: Confocal image of RSG slice with DS axons and terminal arbors (yellow) and NeuroTrace (cyan). Layers are demarcated, and schematic LR and RS neurons are placed in their representative locations within the superficial layers. Blue circles indicate targeting of the minimum LED power stimulations, beginning at midline and extending into layer 5, stimulating every 20–30 mm Figure 5 continued on next page Brennan, Jedrasiak-Cape, Kailasa, et al. eLife 2021;10:e62207. DOI: https://doi.org/10.7554/eLife.62207 12 of 42
Research article Neuroscience
Figure 5 continued
(see Materials and methods). Right: Representative trace examples of an LR (purple) and RS (blue) neurons’ responses to the LED stimulation at each
location. Yellow shading is representative of the projection density of DS axons and terminal arbors across the layers. (G) Population analysis for LR and
RS normalized EPSP responses to minimum LED power stimulations at L1a, L1/2, cell body, L5sup, and L5dp locations. Top: LR cells have significantly
larger responses at L1/2 (n = 8, p=0.0132) and cell body (n = 8, p=0.0135) compared to responses at L1a (n = 8), while responses at L5sup (n = 8,
p=0.9146) and L5dp (n = 7, p=0.4902) do not differ from those at L1a. Bottom: EPSP amplitude in RS cells does not significantly differ at any stimulation
location compared to L1a stimulation (L1/2: n = 7, p=0.8811; cell body: n = 7, p=0.3304; L5sup: n = 7, p=0.2260; L5dp: n = 6, p=0.0816; L1a: n = 7). The
paired t-test was used for all statistical analyses. Error bars are SEM. See Figure 5—source data 1 for source data.
The online version of this article includes the following source data for figure 5:
Source data 1. Laminar-specific responses to DS input.
figure supplement 1). Specifically, cRSG inputs targeted L1c, L2, and L5, resulting in strong activa-
tion of RS cells, with almost no responses in LR cells (Figure 6—figure supplement 1). This again
suggests that inputs from CLA, ACC and cRSG follow a structured pattern by which these inputs
preferentially control RS cells, while ADAV and DS projections target LR cells. Importantly, laminar
dichotomies similar to those seen here in RSG also exist between TC and ClaC/corticocortical pro-
jections to other cortical regions such as the medial prefrontal cortex (Cruikshank et al., 2012), as
also revealed by our examination of anatomical datasets from the Allen Brain Institute (Figure 6—
figure supplement 2). Thus, our findings may also highlight a more universal framework by which
other cortical regions integrate and process thalamic versus claustral and cortical inputs.
Anterior thalamic input to LR neurons is uniquely depressing
To investigate the functional implications of these parallel circuits, we next examined the short-term
dynamics of each input onto the RSG principal cells. LR short-term dynamics were examined in
response to ADAV and DS inputs, while RS short-term dynamics were examined in response to CLA
and ACC inputs (see Materials and methods). In contrast to previously documented thalamocortical
matrix inputs to both superficial pyramidal cells and interneurons (Anastasiades et al., 2021;
Cruikshank et al., 2012), 10 Hz anterior thalamic inputs from ADAV to RSG LR neurons were
uniquely and significantly depressing (p=1.02e-5, Wilcoxon rank sum test; Figure 7A&B). In contrast,
10 Hz DS inputs to LR neurons were not depressing and exhibited weak facilitation (Figure 7A&B).
Both CLA and ACC inputs to RS cells were also weakly facilitating (Figure 7C&D). Thus, the synaptic
depression of anterior thalamic inputs to LR neurons is unique among the inputs examined here and
also distinct from anterior thalamic inputs to superficial principal neurons in PFC and ACC
(Cruikshank et al., 2012). As expected, we found that ADAV inputs to LR cells do not show synaptic
depression at the much slower stimulation frequency of 0.1 Hz (Figure 7—figure supplement 1
panel C), but 40 Hz inputs resulted in stronger depression than 10 Hz (p=0.0022, Wilcoxon rank sum
test; Figure 7—figure supplement 1 panel B).
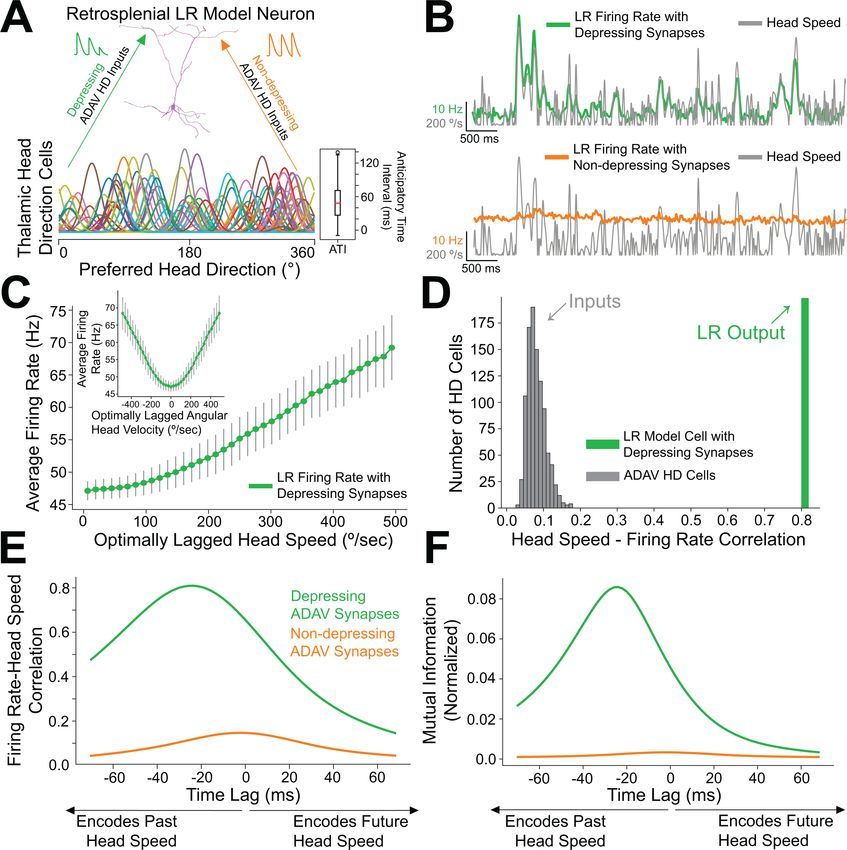
Short-term depression of anterior thalamic inputs enables encoding of
angular head speed by LR cells
We next used computational modeling to elucidate the functional role of synaptic depression in this
circuit, especially with respect to the processing of head direction input (Taube, 1995; Taube and
Bassett, 2003). Up to 60% of cells in the anterior thalamus are classical head direction (HD) cells
(Taube and Bassett, 2003). Each HD cell has a unique preferred direction at which its firing rate is
highest when the head is facing that direction. The preferred directions of all cells in the HD ensem-
ble span the full range of compass directions (Taube, 1998). Our modeling setup consisted of a
postsynaptic RSG LR cell receiving input from an ensemble of 7500 presynaptic HD cells via depress-
ing synapses (for full details, see Materials and methods). In the initial simulations shown in Figure 8,
the morphologically realistic model LR cell (Brennan et al., 2020) received uniform inputs (all HDs
being equally likely) via depressing synapses with Tsodyks-Markram short-term dynamics
(Tsodyks et al., 1998). The synaptic parameters were fit to match the experimentally observed
response of LR cells to optogenetic stimulation of thalamic afferents reported above (Figure 7).
We found that the firing rate of the postsynaptic LR cell receiving HD input via depressing synap-
ses was strongly correlated with angular head speed, giving rise to symmetrical angular head veloc-
ity tuning (Figure 8B&C). Identical HD inputs transmitted via non-depressing synapses resulted in LR
Brennan, Jedrasiak-Cape, Kailasa, et al. eLife 2021;10:e62207. DOI: https://doi.org/10.7554/eLife.62207 13 of 42Research article Neuroscience Figure 6. Two parallel circuits in superficial granular retrosplenial cortex. (A) Left: Schematics of dual injections into anterior thalamus (ADAV) and claustrum (CLA; top) or anterior cingulate (ACC; bottom). Right: Resulting dual expression of ADAV (green) and CLA (red; top) or ACC (magenta; bottom) axons with zoomed-in confocal view of layers, demarcated by white lines. (B) Left: Projection density of anterior thalamus (ADAV; green; n = 5), claustrum (CLA; red; n = 6), anterior cingulate (ACC: magenta; n = 4), and dorsal subiculum (DS; yellow; n = 4; mean ± SEM shaded for all) axons and Figure 6 continued on next page Brennan, Jedrasiak-Cape, Kailasa, et al. eLife 2021;10:e62207. DOI: https://doi.org/10.7554/eLife.62207 14 of 42
Research article                                                                                                               Neuroscience

Figure 6 continued
terminal arbors in RSG. Note distinct sublaminar distribution of axons from ADAV, ACC, and CLA in layer 1. Right: Projection density of LR (purple;
n = 10) and RS (blue; n = 5; mean ± SEM shaded for all) neurons. Note the distinct difference between LR and RS dendrite lamination across the layers.
(C) Correlation matrix of means for all axon-axon, axon-dendrite, and dendrite-dendrite comparisons. Note that LR dendrites are significantly positively
correlated with ADAV and DS axons but negatively correlated with CLA and ACC axons, while RS dendrites are significantly positively correlated with
CLA and ACC axons but negatively correlated with ADAV and DS axons. (D) Summary schematic showing selective control of LR neurons by inputs
from ADAV and DS, including head direction signals. In contrast, RS neurons are preferentially controlled by inputs from the CLA and ACC. This precise
organization of principal cell dendrites and afferent axons forms two parallel circuits in superficial RSG.
The online version of this article includes the following figure supplement(s) for figure 6:
Figure supplement 1. Contralateral RSG projections drive RS, but not LR, neurons.
Figure supplement 2. Sublaminar differences in thalamic vs claustral projections to medial prefrontal cortex.

                                     firing rates that were uncorrelated with angular head speed (Figure 8B,E–F). It is important to note
                                     that in our model, firing rates of input HD cells were not explicitly modulated by angular head veloc-
                                     ity; therefore, the observed speed tuning resulted strictly from the depressing synaptic dynamics.
                                     For the parameter set whose results are depicted, LR cell firing rate was optimally correlated with
                                     head speed 24 ms in the past, confirmed by both cross-correlation and mutual information analyses
                                     (Figure 8E&F). We obtained the same results when modeling an ensemble of only 2500 presynaptic
                                     HD cells, indicating that our results are robust to the size of the presynaptic population (Figure 8—
                                     figure supplement 1). Taken together, these results suggest that synaptic depression of HD ensem-
                                     ble inputs introduces an angular head speed signal into the LR population, producing neurons that
                                     are more responsive during faster head turns, and potentially supporting the spatial orientation
                                     encoding functions attributed to the RSG (Epstein, 2008; Ino et al., 2007; Milczarek et al., 2018;
                                     Miller et al., 2019).

                                     Anticipatory firing of thalamic head direction cells improves
                                     postsynaptic speed encoding by retrosplenial LR neurons
                                     Anterior thalamic HD cells display anticipatory firing (Blair et al., 1997), a phenomenon where an
                                     HD cell becomes most active at a fixed time interval before the animal is facing that cell’s preferred
                                     direction (Figure 9A). This temporal offset associated with each cell is called its anticipatory time
                                     interval (ATI). In anterior thalamus, the mean ATI has been reported as 25–50 ms (Taube, 2010). In
                                     our initial simulations, shown in Figure 8, we drew the ATI of each HD cell randomly from distribu-
                                     tions matching these known in vivo ranges. To more systematically understand if and how the ATI of
                                     HD cells influences angular head speed coding by LR neurons, we next performed a series of simula-
                                     tions using various fixed ATI values for the entire HD population (Figure 9A) and analyzed the result-
                                     ing postsynaptic LR response.
                                        Increasing ATI from 0 ms (no anticipation by the HD cell) to higher values (HD cell firing prior to
                                     facing the preferred HD) improved the lag between LR firing rate and angular head speed, with
                                     larger ATIs resulting in shorter latency between the head movement and LR coding of that angular
                                     head speed (Figure 9C). Remarkably, larger ATIs also improved the angular head speed tuning of
                                     LR neurons independent of lag, as quantified by the maximum value (over the full range of lags) of
                                     cross-correlation or cross-mutual information (Figure 9B). Thus, anticipatory firing of HD cells may
                                     constitute a powerful coding principle in the thalamo-retrosplenial circuit, helping LR cells to not
                                     only encode the current head speed with minimal lag, but also better encode the head speed inde-
                                     pendent of the lag.
                                        In order to better understand this surprising effect, as well as how speed tuning generally arises,
                                     we analytically studied a simplified mean-field model of this thalamo-retrosplenial circuit (Figure 9—
                                     figure supplement 1). Our analysis allowed us to mathematically derive that LR activity should
                                     encode head speed with depressing synapses from simplified HD cells (see Appendix). Moreover,
                                     the analysis showed that anticipatory firing compensates for the lag introduced by integration time,
                                     leading to a theoretical parameter regime for which postsynaptic speed coding can be essentially
                                     perfect (where LR firing rate reflects head speed exactly with minimal latency). The observed
                                     improvement in quality of speed coding with increases in ATI corresponds to moving closer to this
                                     regime. Finally, our analysis showed that postsynaptic activity, at least at lower rotational speeds, is
                                     proportional to the square of head speed, thereby explaining the concave-up, parabolic shape of

Brennan, Jedrasiak-Cape, Kailasa, et al. eLife 2021;10:e62207. DOI: https://doi.org/10.7554/eLife.62207                                        15 of 42
Research article Neuroscience
Figure 7. Anterior thalamic inputs to LR neurons evoke robust synaptic depression. (A) Top: Schematic showing anterior thalamic (ADAV) inputs to an
LR neuron being optically stimulated at L1a (left). Example trace from a representative LR cell in response to 10 Hz ADAV stimulation shows clear
synaptic depression (purple). Blue triangles represent light pulses (right). Bottom: As above, but now for dorsal subicular (DS) input to an LR cell
showing that LR responses to DS synaptic inputs are weakly facilitating. (B) Group synaptic dynamics for LR neurons in response to ADAV (green; n = 9)
and DS (yellow; n = 9) inputs. ADAV synapses are strongly depressing, while DS synapses are weakly facilitating. (C) Top: Schematic showing claustral
(CLA) inputs to an RS neuron being optically stimulated at L1/2 (left). Example trace from a representative RS cell in response to 10 Hz CLA stimulation
shows weak synaptic facilitation (blue). Blue triangles represent light pulses (right). Bottom: As above, but now for anterior cingulate (ACC) input to an
RS cell showing that RS responses to ACC synaptic inputs are weakly facilitating. (D) Group synaptic dynamics for RS neurons in response to CLA (red;
n = 8) and ACC (magenta; n = 7) inputs. Both CLA and ACC synapses are weakly facilitating. See Figure 7—source data 1 for source data.
The online version of this article includes the following source data and figure supplement(s) for figure 7:
Source data 1. Short-term dynamics of postsynaptic responses.
Figure supplement 1. Anterior thalamic inputs to LR neurons are strongly depressing at higher frequencies.
the speed-firing rate curve (Figure 8C and Figure 8—figure supplement 2). Thus, both the simula-
tions and the analytical theory show that synaptic depression of HD cell input onto LR cells should
result in angular speed coding in the LR cell firing rate, and that anticipatory firing improves both
the precision and quality of this coding.
Non-uniform HD inputs can allow LR cells to encode both head
direction and speed, with a tradeoff
In the simulations above, we utilized a uniform distribution of HD inputs to each LR cell, such that
each preferred direction was equally represented. However, in practice, it is likely that there will be
heterogeneity in the preferred HDs of the cells providing inputs to any given retrosplenial LR cell. To
study the extent to which speed coding persists under these conditions, we simulated a population
Brennan, Jedrasiak-Cape, Kailasa, et al. eLife 2021;10:e62207. DOI: https://doi.org/10.7554/eLife.62207 16 of 42Research article Neuroscience Figure 8. Depressing thalamocortical synapses allow LR cells to compute head speed from directional inputs. (A) We modeled a heterogeneous population of HD cells providing input to a single LR neuron via either depressing (green) or non-depressing (orange) synapses. Presynaptic HD cells varied in their tuning width, maximum firing rate, background firing rate, and anticipatory time interval (ATI). Tuning curves of a randomly selected subset of 100 (out of 7500) HD cells in the simulated ensemble are depicted here. Boxplot on the right depicts the empirical distribution of ATIs of all HD cells in the presynaptic population, with the mean ATI chosen as 50 ms in accordance with Taube, 2010. (B) Sample traces spanning ten seconds of simulation time. Green: firing rate of postsynaptic LR cell receiving HD input via depressing synapses; Orange: firing rate of postsynaptic LR cell receiving HD input via non-depressing synapses; Gray: head turning speed. Note that for the non-depressing inputs, the firing rate of the LR cell remains approximately constant throughout. In contrast, depressing synapses produce a firing rate whose fluctuations visibly reflect fluctuations in the angular head speed. (C) Firing rate of postsynaptic LR cell plotted against head speed 24 ms in the past shows a clear monotonic relationship. A similar relationship exists between firing rate and current angular head speed (see panels E, F). The inset shows firing rate as a function of angular head Figure 8 continued on next page Brennan, Jedrasiak-Cape, Kailasa, et al. eLife 2021;10:e62207. DOI: https://doi.org/10.7554/eLife.62207 17 of 42
You can also read