Characterisation and Manipulation of Polarisation Response in Plasmonic and Magneto-Plasmonic Nanostructures and Metamaterials - MDPI
←
→
Page content transcription
If your browser does not render page correctly, please read the page content below
SS symmetry
Review
Characterisation and Manipulation of Polarisation
Response in Plasmonic and Magneto-Plasmonic
Nanostructures and Metamaterials
Pritam Khan, Grace Brennan , James Lillis, Syed A. M. Tofail, Ning Liu                    and
Christophe Silien *
 Department of Physics and Bernal Institute, University of Limerick, V94 T9PX Limerick, Ireland;
 Pritam.Khan@ul.ie (P.K.); grace.brennan@ul.ie (G.B.); james.lillis@ul.ie (J.L.); tofail.syed@ul.ie (S.A.M.T.);
 ning.liu@ul.ie (N.L.)
 * Correspondence: christophe.silien@ul.ie

 Received: 9 July 2020; Accepted: 12 August 2020; Published: 17 August 2020

 Abstract: Optical properties of metal nanostructures, governed by the so-called localised surface
 plasmon resonance (LSPR) effects, have invoked intensive investigations in recent times owing to their
 fundamental nature and potential applications. LSPR scattering from metal nanostructures is expected
 to show the symmetry of the oscillation mode and the particle shape. Therefore, information on
 the polarisation properties of the LSPR scattering is crucial for identifying different oscillation
 modes within one particle and to distinguish differently shaped particles within one sample.
 On the contrary, the polarisation state of light itself can be arbitrarily manipulated by the inverse
 designed sample, known as metamaterials. Apart from polarisation state, external stimulus,
 e.g., magnetic field also controls the LSPR scattering from plasmonic nanostructures, giving rise
 to a new field of magneto-plasmonics. In this review, we pay special attention to polarisation and
 its effect in three contrasting aspects. First, tailoring between LSPR scattering and symmetry of
 plasmonic nanostructures, secondly, manipulating polarisation state through metamaterials and
 lastly, polarisation modulation in magneto-plasmonics. Finally, we will review recent progress in
 applications of plasmonic and magneto-plasmonic nanostructures and metamaterials in various fields.

 Keywords: plasmonics; LSPR scattering; polarisation manipulation; metamaterials; Faraday effect
 (rotation); magneto-optic Kerr effect (MOKE); magnetoplasmonics

1. Introduction
     Of late, thanks to their unique chemical, electrical and optical properties, nanomaterials have
been the subject of extensive research in the frame of nanoscience and nanotechnology from the point
of view of both fundamental science and practical applications. Among the family of nanomaterials,
metallic nanostructures are of particular interest because of their remarkable optical properties that
leads to a plethora of novel phenomena, mediated by elementary excitations, known as plasmons [1,2].
Localised surface plasmon resonance (LSPR) takes place from the collective oscillations of conduction
electrons near metallic nanoparticles following light excitation [3]. LSPR in metallic nanoparticles
allows to manipulate light at the nanoscale that gives rise to exotic phenomena, e.g., optical near-field
enhancement at resonant wavelength, hot-electron generation [4,5], etc. Likewise, such effects find
tremendous potential applications in photocarrier generators [6], optical holography [7], plasmonic
routers [8], biosensors [9,10], surface-enhanced Raman scattering (SERS) [11], etc. LSPR of the
plasmonic nanostructures can be readily tuned by the geometry, i.e., shape and size of the plasmonic
nanostructures which in turn can be correlated with the polarisation state of the incident light [1,12].

Symmetry 2020, 12, 1365; doi:10.3390/sym12081365                                    www.mdpi.com/journal/symmetry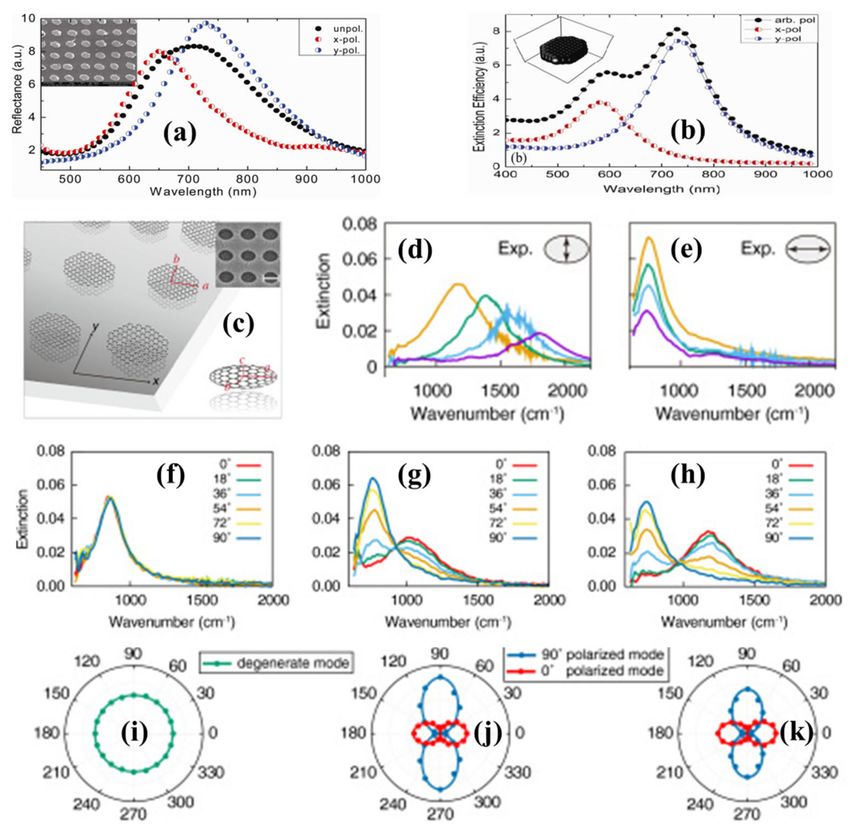
Symmetry 2020, 12, 1365                                                                                 2 of 57

It is well known that polarisation is a key attribute of light that describes the oscillation direction
of the electromagnetic wave, that plays an important role in the light–matter interactions [13,14].
In particular, the resonant light scattering from plasmonic nanostructures (Figure 1) is expected to
show the symmetry of the plasmon mode and the particle shape [15]. Therefore, detailed knowledge
of the scattered light polarisation from plasmonic nanostructures is very important to understand
the fundamental physics and practical applications of such nanostructures. At the same time, it also
helps to differentiate several oscillation modes within one particle as well as distinguish particles of
different shape within one nanostructure. For example, smallest unit of nanostructures like silver/gold
nanosphere (diameter less than 50 nm) or nanoparticle dimer has high symmetry with only one dipole
plasmon [16,17].

     Figure 1. Plasmonic nanostructures of various shape. The arrow indicates the axis of symmetry of the
     nanostructures for the excitation of LSPR.

     Moving on to nanoparticle trimer with broken symmetry in their geometry, they exhibit a
polarisation response that is altogether different from the dipolar response of a dimer [17,18].
Similarly, in nanorods, instead of one dipole, two dipolar peaks, transverse and longitudinal [19] appear.
Further complicated nanostructures like triangular Ag nanoparticles [20,21] or nanocrescents [22]
possess in- and out-of-plane dipole, quadrupole and even higher multipoles. Several techniques,
including dark-field (DF) extinction [17,23], SERS scattering [24,25], infrared absorption [22,26]
have been used to extract the optical response of plasmonic nanostructures to get information on the
polarisation state. In the first part of the review, we aim to tailor between LSPR scattering and symmetry
of plasmonic nanostructures by going through polarisation sensitive optical measurements in such
nanostructures. On the contrary, in another end of the spectrum, artificial plasmonic nanostructures are
inversed designed to control the polarisation state of the light wave [27,28]. This new set of artificial
materials are classified as metamaterials, that are composed of periodically arranged subwavelength
dielectric elements or structured metallic components [29,30]. The metamaterials can arbitrarily
manipulate the polarisation state of the electromagnetic waves with multiple degrees of freedom,
that has found tremendous potential application in nanophotonics [31,32]. We will discuss the
designing of such metamaterial strictures and their excellent application prospective in the second
part of the review. In the last section, we will discuss magneto-optics and magnetoplasmonics with
particular emphasis on the role of polarisation in a number of experiments including the Faraday
effect, inverse Faraday effect, magneto-optical Kerr effect, magnetic second-harmonic generation and
magnetic circular dichroism. Finally, we will explore a number of relevant applications.
Symmetry 2020, 12, 1365                                                                                          3 of 57

2. Tailoring between LSPR Scattering and Symmetry of Plasmonic Nanostructures
     In this section, we will discuss the polarisation dependent LSPR response of various plasmonic
nanostructures of different shape and size. It is well known that axis of symmetry of plasmonic
nanostructures plays an important role and by exciting along the favourable symmetry axis LSPR
response can be enhanced significantly. Below we will analyse several plasmonic nanostructures and
their LSPR response by polarisation sensitive measurements.

2.1. Single Nanosphere and Dimer
      The smallest unit of plasmonic nanostructure is a single nanoparticle or nanosphere. The scattering
spectra of a single Ag/Au nanosphere has one major peak, originated from the interaction of
electromagnetic waves with the free electrons of the nanospheres. For single nanoparticles, the LSPR
does not exhibit any marked polarisation dependence [33]. It can be seen from Figure 2a that LSPR of
two isolated Au nanoparticles occurs at 573 nm and it is indistinguishable for two orthogonal light
polarisations. However, if these two nanoparticles are brought closer, they get dimerised because of
plasmonic coupling and a strong polarisation anisotropy takes place. For polarisation perpendicular to
the long axis of the dimer, LSPR peak at 573 nm overlaps with that of a single particle [34], however,
for polarisation parallel to the long axis of the dimer, we observed a strongly red-shifted spectrum
with LSPR at 588 nm which is ascribed to the “long axis” mode of dimer. The position of the LSPR
of a dimer corresponding to both parallel and perpendicular polarisation depends strongly on the
interparticle distance (d) as well as their relative interaction [34]. In Figure 2b when d changes from
10 (1) to 25 nm (3), LSPR position of Ag dimer for parallel polarisation redshifts approximately by
100 nm. In contrast, for perpendicular polarisation LSPR exhibits very weak blueshift. It is important
to note that, for very large d ~ 250 nm, LSPR of the dimer (5) is comparable to that of an individual
particle (6). This observation indicates that when the separation is large between the pair of particles,
it becomes complicated to resolve the effects of particle interactions.

     Figure 2. (a) Alignment of a dimer composed of two ~80 nm gold nanoparticles. The upper graphs are
     spectra for the immobilised particle (left) and the optically trapped particle (right) before dimerisation.
     The lower spectra correspond to the case when the two particles have been brought into near-field
     coupling range. All the figures were reprinted (adapted) with permission from [33], Copyright 2010,
     American Chemical Society. (b) DF spectra and SEM micrographs from isolated particle pairs with
     varying separations in parallel and perpendicular polarisation, as indicated by arrows. The separations
     (gaps) between the particles are d ~ (1) 10, (2) 15, (3) 25, (4) 50, and (5) 250 nm. Spectrum 6 from a single
     particle is included for comparison. The vertical bars indicate the baselines for the different spectra.
     (c) DF images form an array of “identical” silver disks with a diameter of 80 nm and a height of 25 nm.
     The text “NANO” is written with pairs of such particles with an interparticle distance of approximately
     110 nm. In the top image, the array is illuminated with light polarised parallel to the particle pair axis.
     In the bottom image, the polarisation is perpendicular to the pair axis. All the figures were reprinted
     (adapted) with permission from [34], Copyright 2005, American Chemical Society.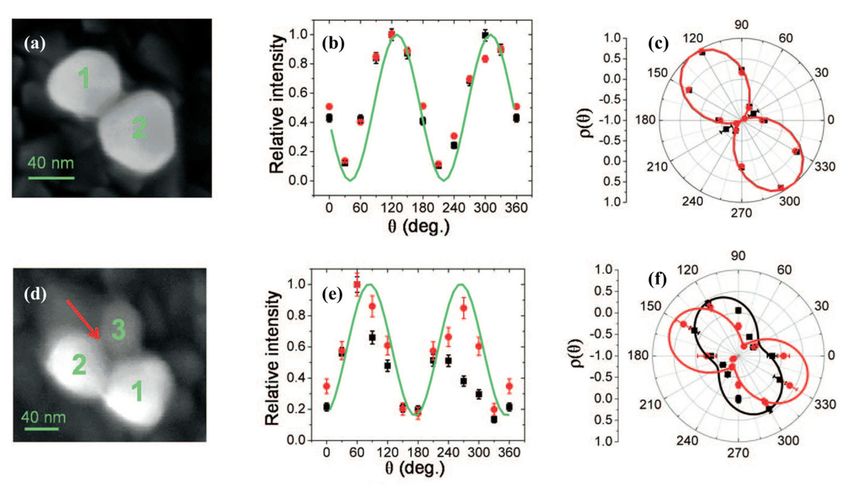
Symmetry 2020, 12, 1365                                                                                       4 of 57

     The effect of parallel and perpendicular polarisations on the dimer composed of Ag particles
array can be readily seen from the DF images shown in Figure 2c. For the top panel, under parallel
polarisation, the text “NANO” written with dimers appears red compared to green single particles.
In contrast, for perpendicular polarisation the text appears blue in the green single particle background.
Such observation is in line with the results shown in Figure 2b.
     Next, we discuss the detailed polarisation response of single Ag nanosphere dimer (Figure 3a).
The dimer is oriented at 40◦ with respect to the normal. In this regard, Figure 3b,c demonstrates the
polar plot of Raman scattering intensity profile and depolarisation ratio (ρ) of the dimer, respectively
against the polarisation angle at two dominant Raman bands of the dimer. Both the Raman scattering
intensity and depolarisation ratio varies between ±1, at parallel and perpendicular to the dimer axis,
respectively [18]. Therefore, clearly indicating that scattering from the dimer is linearly polarised in
line with the results from Tian et al. [17]. Figure 3c also reveals that the depolarisation ratio of a dimer
is wavelength independent.

     Figure 3. Polarisation response of a nanoparticle dimer and trimer. SEM image of the (a) dimer and (d)
     trimer of nanoparticles. The red arrow in (d) indicates the position of the molecule that leads to the
     best agreement between experiment and calculation. Normalised RS intensity at 555 (black squares)
     and 583 nm (red circles) as a function of the angle of rotation of the incident polarisation for (b) dimer
     and (e) trimer. Depolarisation ratio (ρ) measured at 555 (black squares) and 583 nm (red circles) for (c)
     dimer and (f) trimer. All the figures were reprinted (adapted) with permission from [18], Copyright
     2008, National Academy of Sciences, USA.

2.2. Nanosphere Trimer
     When an additional third particle (1) is added at the junction of a dimer formed by particles 2
and 3, it breaks the axial symmetry (Figure 3d) to form a trimer and the polarisation response of a
symmetry-broken trimer is altogether different from that of a dimer. Figure 3e represents the Raman
scattering profile of the trimer at the same wavelengths of that of the dimer, with varying incident
polarisation angle. The maximum signal is obtained at 75◦ which does not match with the alignment
of any of the pairs. The polar plot of the depolarisation ratio for a trimer shown in Figure 3f exhibits
strong wavelength dependence, i.e., for different wavelengths it is rotated at different angles from
the Raman intensity profile [18]. Unlike dimer, the scattered intensity in trimer never reaches ±1,
signifying elliptically polarised light scattering from a trimer, which could arise from the presence of
broken symmetry, after a third particle is added to a symmetric dimer to form a trimer. Apart from
the results above, there are several other studies which also represent similar polarisation dependent
optical response of plasmonic dimer [17,23,35] and trimer nanostructures [36,37].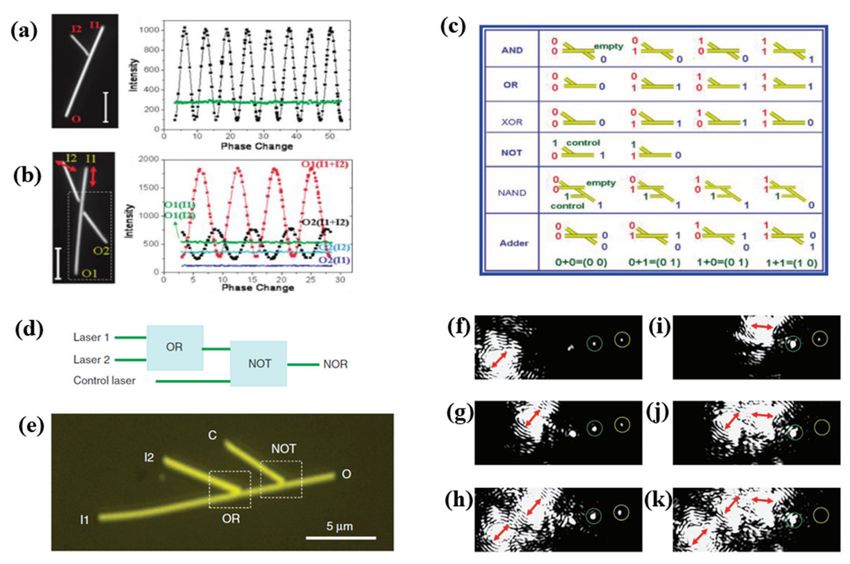
Symmetry 2020, 12, 1365                                                                                      5 of 57

2.3. Nanorod
      Nanorods are the perfect example of “antenna-like” plasmonic structures, therefore the polarisation
pattern of the scattered light holds paramount importance for practical applications [15]. Especially,
gold nanorods have shown extremely strong light scattering due to the combination of lightning
rod effect [38] and the suppression of interband damping [39]. In this regard, Figure 4a reveals the
comparison between the single-particle scattering spectra of a nanosphere and a nanorod which shows
that LSPR of the sphere at 2.19 eV and for the long-axis mode of the rod at 1.82 eV [39]. By extracting
the linewidth (Γ) of the LSPR of nanosphere and nanorod, it is evident that Γ for nanorod is significantly
lower than that of nanosphere which leads to lower plasmon damping for nanorods owing to their
small volume.

     Figure 4. (a) Light-scattering spectra from a gold nanorod and gold nanosphere measured under
     identical conditions (light polarised along the long rod axis). All the figures were reprinted (adapted)
     with permission from [39], Copyright 2002, American Physical Society. Scattering spectra of single
     AuNRs with (b) d = 32 nm, (c) d = 81 nm, and (d) d = 100 nm, all having AR of ~2.2 ± 0.1, and the
     corresponding DDA calculations (e–g), respectively. All the figures were reprinted (adapted) with
     permission from [40], Copyright 2010, American Chemical Society. The spectra were recorded for
     scattered light polarised parallel (red) and perpendicular (blue) to the orientation of the main rod
     axis. A fit to a sum of two Lorentzian curves is included as black lines in (g). In all images, the scale
     bar represents 100 nm. (h) The polarisation at the longitudinal plasmon resonance wavelength λres
     is shown as a function of the resonance wavelength for three different gold particle samples (blue
     dots, nominally spherical gold particles with 60 nm diameter; 87 nm diameter, teal dots; and red dots,
     gold nanorods). The dashed black line is a theoretical prediction from simulations of gold rods of
     different aspect ratios and sizes embedded in water. All the figures were reprinted (adapted) with
     permission from [15], Copyright 2008, American Chemical Society. (i) UC emission spectra obtained
     as the analyser angle varied from 0 to 2 π under excitation polarisation parallel to the long axis of
     the hybrid nanostructure. From these spectra, the polar plots were extracted for the green (j) and
     red (k) emissions. (l) UC emission spectra under perpendicular excitation and corresponding polar
     plots for green (m) and red (n) emissions. The lines in the polar plots are cosine-squared fits of the
     experimental data. All the figures were reprinted (adapted) with permission from [41], Copyright 2017,
     Springer Nature.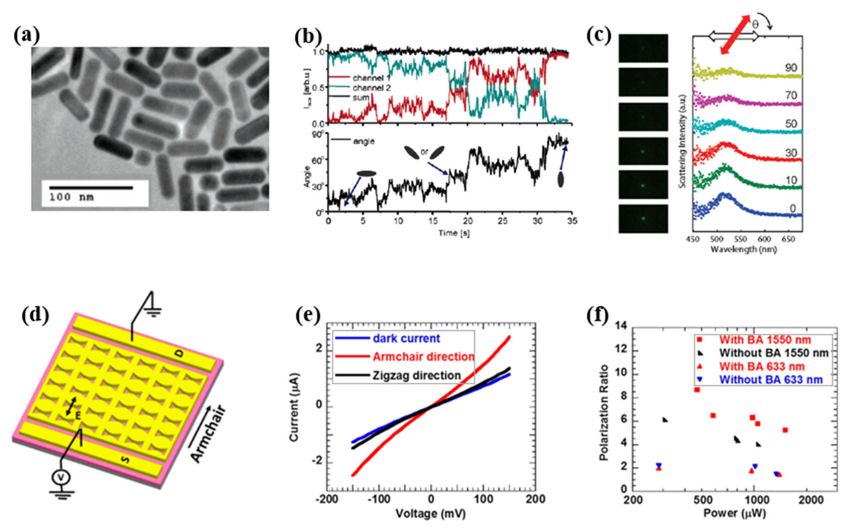
Symmetry 2020, 12, 1365                                                                               6 of 57

       It is well known that nanorods exhibit two LSPR modes, one that exhibits a strong polarisation
response along the long axis (length), known as longitudinal LSPR and the other one with very weak
polarisation response along the short axis (width) of nanorods, referred as transverse LSPR [40].
       Longitudinal LSPR is of particular interest because it is tunable across the whole visible and
near-infrared region by precisely tailoring the length (l), width (d), and/or aspect ratio (AR) of the
nanorod as demonstrated in [40]. Figure 4 depicts the scattering spectra of AuNR for different d and
l with fixed AR of 2.2 (±0.1). For the AuNR with (d, l) = 32 × 69 nm, a narrow longitudinal dipole
LSPR is observed at 620 nm with no transverse component. When the size of AuNR increases to
(d, l) = 84 × 174 nm and (d, l) = 100 × 227 nm, a clear redshift is observed in longitudinal LSPR to 740
and 900 nm, respectively as shown Figure 4c,d. Apart from that, a weak transverse LSPR peak appears
in Figure 4c,d at 600 and 660 nm, respectively, because of the larger width of the AuNR [42,43]. Till now,
the AuNRs discussed have a low AR of 2.2. Increasing the AR of a slim AuNR to 3.1 (24 × 74 nm) can
lead to the similar redshift of the longitudinal LSPR. Experimental scattering spectra of these AuNR
shows good agreement with the DDA calculations as depicted in Figure 4e–g. The longitudinal LSPR
is highly anisotropic, i.e., it only favourably gets excited for polarisation along the long axis of the rod,
and remains unexcited otherwise. Likewise, the scattered light from AuNR exhibits a dipolar response,
in line with a cosine-squared function [44].
       The strong polarisation dependent optical response in plasmonic nanosphere and nanorods in
turn can be exploited to reveal the nanoparticle symmetry. In this context, wavelength-dependent
polarisation anisotropy (PA(λ)) serves as an efficient parameter to distinguish nanoparticles with
different symmetry [15]. In general, PA(λ) = (Imajor − Iminor )/(Imajor + Iminor ), where Imajor and
Iminor are defined as the scattering intensity of light polarised parallel to the major and minor axes,
respectively [45]. For this purpose, PA is extracted at the resonance wavelength λres . Figure 4h
shows that for an AuNR of (d, l) = 28 × 57 nm shows a high degree of PA(λres ) ~ 0.84 [39], whereas
for spherical AuNP of diameters 60 and 87 nm had an average PA(λres ) ~ 0.35. It is important to
note that AuNP and AuNR exhibit contrasting PA(λ) spectra. For AuNR, it is strongly wavelength
dependent, i.e., the long-axis plasmon mode is only excited at the resonance wavelength, whereas for
AuNP, PA(λ) is independent of excitation wavelength. It is also found that LSPR linewidth scales
inversely with PA(λres ), i.e., linewidth is lower for particles with high PA(λres ). Likewise, we can
conclude from Figure 4a AuNR with lower linewidth has high PA(λres ) compared to AuNP at resonance
wavelength [15].
       AuNRs are an important plasmonic nanostructure which can strongly enhance as well as
influence the polarisation state of fluorescence from organic fluorophores or upconversion nanocrystals
(UCNC) [41]. It has been shown that, similar to bare AuNR, in hybrid nanostructures of AuNR-
fluorophore (oxazine 725), the fluorescent emission is also polarised along the long axis of the NR and
exhibits a dipolar pattern. However, the polarisation response of the emission pattern is bit compilated
for hybrid plasmonic UCNCs. By measuring the emission spectra of UCNC hybrid nanostructures
at polarisation angles from 0◦ to 360◦ , by keeping the excitation laser either parallel (Figure 4i) or
perpendicular (Figure 4l) to the long axis of the hybrid nanostructure, two dominant emission bands
are observed cantered at 540 (green) and 660 nm (red). In this regard, Figure 4j,k,m,n shows the polar
plot of red and green emission, respectively. Clearly, red emission is independent of the excitation
polarisation, i.e., for both parallel and perpendicular polarisation, red emission follows the scattering
pattern of AuNR. In stark contrast, green emission follows the excitation polarisation and oriented
along and perpendicular to the long axis of AuNR for parallel and perpendicular excitation polarisation,
respectively. The observed results are explained on the basis of Förster resonance energy transfer
(FRET) between the emission dipole of the UCNC and the plasmonic dipole of the AuNR [41].
       Similar polarisation sensitive measurements on the LSPR of plasmonic Au nanorods and their
arrays can be found in the following articles [46–49].
Symmetry 2020, 12, 1365 7 of 57
2.4. Nanowire
One-dimensional nanowires (NW) with length of tens of microns stand apart thanks to their easy
microscopic directionality [50,51] compared to other counterparts like dimer or NR, where because of
diffraction limit it is difficult to estimate the direction of the dimer axis or the long axis of the nanorod.
The LSPR response of a NW can be easily tuned by varying the polarisation angle between incident
polarisation and NW axis orientation. The excitation of LSPR in NW leads to well-known phenomenon
of surface-enhanced Raman scattering (SERS) [25,52,53] that has been explored extensively for chemical
and biological sensing. Mohanty et al. [54] demonstrated experimentally as well as from finite difference
time domain (FDTD) simulation that SERS signal in the AgNW system reached maximum when the
incident laser is perpendicular to NW axis. Similar results are also obtained by Li et al. [55] which
shows that when the SERS spectra of R6G is measured at one spot on a NW at different polarisation
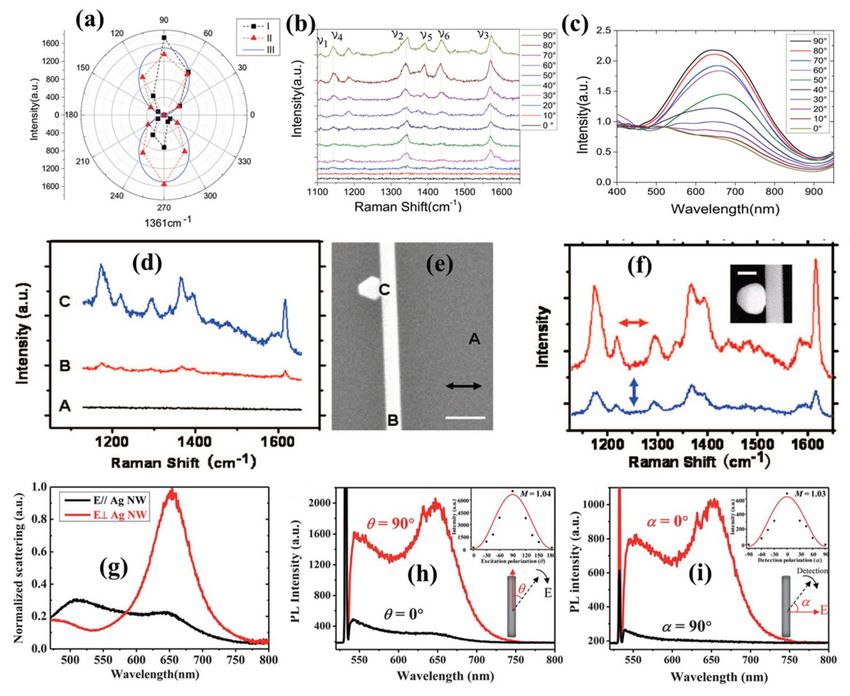
angles it exhibits maximum at θ = 90, i.e., for vertical polarisation as shown in the polar plot of Figure 5a.
The results remain consistent when measured at different spots of the sample. They also demonstrated
the dimerisation of 4-nitrobenzenethiol (4NBT) to p,p0 -dimercaptoazobenzene (DMAB), arising from
LSPR and monitored via SERS. It is shown in Figure 5b that when the polarisation angle θ changes
from 0 to 90, new peaks, e.g., ν4 , ν5 , ν6 gradually increase, indicating the catalytical transformation
of 4NBT to DMAB. The above results are further substantiated with DF measurements (Figure 5c)
which shows that LSPR scattering increases with increase in polarisation angle and becomes maximum
for vertical polarisation, i.e., θ = 90. In another study, Wei and co-workers [25] have shown that
SERS of AgNW can be further enhanced by the presence of another metallic nanoparticle (AuNP)
adjacent to the wire. The magnitude of this coupling is shown to be independent of the NP shape
following the theoretical prediction. However, a strong polarisation dependence is expected owing
to strong local and polarisation sensitive electric field enhancements at the NP-NW junctions [56] as
shown by the SERS spectra in Figure 5d for different probe positions (Figure 5e) using Malachite green
isothiocyanate (MGITC). SERS is inherently a plasmonic property, and therefore remains absent from
Si substrate without Ag nanostructures, although the probe molecule MGITC is strongly resonant at
633 nm excitation. When SERS is probed on the trunk of the AgNW, a weak SERS signal is observed.
Surprisingly, a remarkable enhancement is observed in the SERS signal when an AuNP is placed near
the NW, thanks to the coupling between the AuNP-AgNW plasmons. A polarisation dependent study
of the SERS signal in AuNP-AgNW system reveals that when the laser is polarised perpendicularly to
the NW, the SERS intensity increases and remains weak for parallel polarisation [56]. The polarisation
pattern of the composite system shown in Figure 5f exhibits a dipolar pattern similar to the observation
by Mohanty [54] and Li [55].
Apart from SERS, one-photon photoluminescence (PL) is also found to be enhanced significantly
by the plasmon coupling between Ag nanowire on top of an Au film in the presence of a ~6 nm dielectric
spacer (gap plasmon mode) that supports a localised resonance. In their work, Hu and colleagues [57]
further demonstrated that the PL associated with the gap plasmon mode depends strongly on the
polarisation angle between the incident laser polarisation and the nanowire orientation, thus exhibits a
dipolar emission profile. In this regard, Figure 5g depicts the DF scattering spectra peaking at 655
nm, which is attributed to the gap plasmon mode. Clearly, for perpendicular polarisation (red curve)
the peak is much stronger than parallel polarisation (black curve). Such observation confirms that
gap plasmon mode is associated with the transverse charge oscillations across nanowire-film junction.
PL spectra in Figure 5h follow similar trend like DF scattering, i.e., maximum for perpendicular
polarisation (θ = 90◦ ), which almost disappears under parallel polarisation (θ = 0◦ ). Like excitation
polarisation, analyser or detection polarisation also plays a significant role in PL or SERS signal. It is
found that when the analyser polarisation (Figure 5i) is parallel with excitation polarisation, the detected
signal becomes strongest and diminishes when they are perpendicular to each other. In short, LSPR in
nanowires can be favourably excited when the incident laser is directed perpendicular to the nanowire
axis thanks to the spatial confinement of the electrons at the nanowire and the neighbouring medium
interface. Such polarisation dependence is in strong contrary to the case of spherical nanoparticle,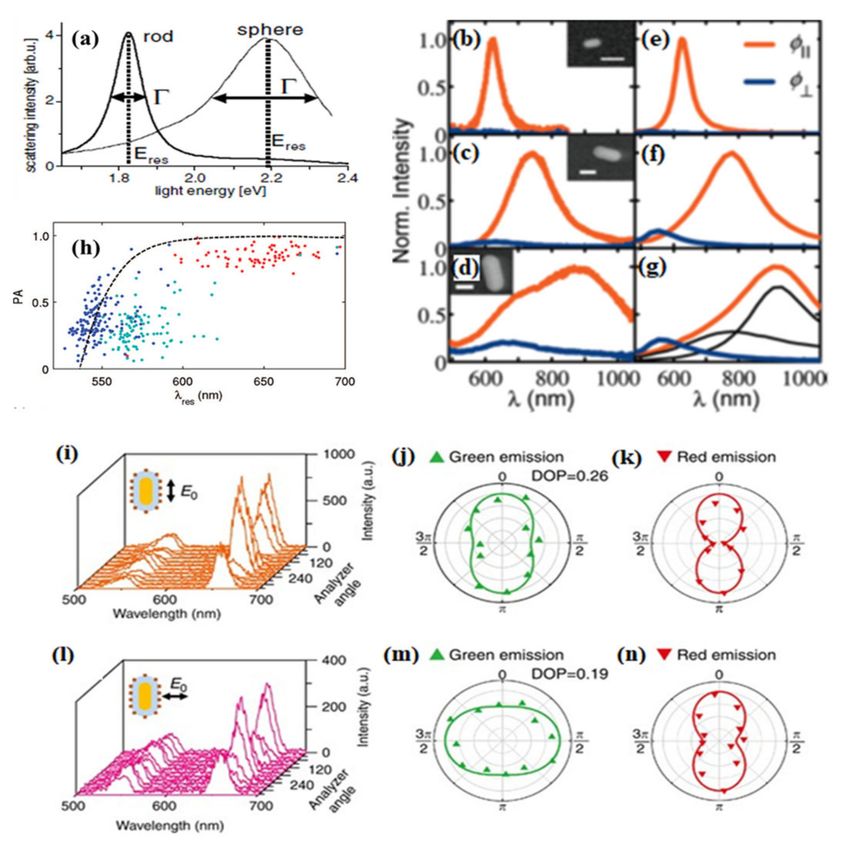
Symmetry 2020, 12, 1365                                                                                               8 of 57

where plasmon excitation is polarisation independent due to spherical geometry [58]. Apart from the
above-mentioned results, there are many other studies [59–62] which also discuss the polarisation
response LSPR response of plasmonic NWs.

     Figure 5. (a) Polar plot of SERS intensity at different polarisation angles (I), at different spots (II) and (III)
     Sin2 θ function for comparison. (b) SERS spectrum of 4NBT on the NW at different polarisation angles θ.
     (c) Experimentally measured DF scattering spectra with single NWs at different polarisation angles.
     All the figures were reprinted (adapted) with permission from [54], Copyright 2018, Royal Society
     of Chemistry. (d) Raman spectra of MGITC from different positions of the sample as shown in (e).
     The scale bar is 400 nm. The arrow in the SEM image shows the incident polarisation. (f) SERS spectra
     of MGITC at two different polarisations for the wire-particle shown in the inset. The scale bar in
     the inset is 200 nm. All the figures were reprinted (adapted) with permission from [25], Copyright
     2008, American Chemical Society. (g) The scattering spectra were obtained under horizontal (red)
     and perpendicular (black) conditions. The strong and sharp resonant peak at 653 nm is due to the
     gap plasmon resonance, which is barely present under parallel illumination. (h) and (i) represent the
     excitation and detection polarisation dependences of PL intensity under 532 nm lasers, respectively.
     The absolute peak intensities as a function of excitation and collection polarisation are shown in the
     insets in (h) and (i), respectively, exhibiting a good dipole behaviour in photon absorption and emission
     All the figures were reprinted (adapted) with permission from [57], Copyright 2013, Royal Society
     of Chemistry.

2.5. Nanohole and Nanoellipse
      Among the family of plasmonic nanostructures of different symmetry, elliptical geometry has
particular importance because of its inherent anisotropy [63,64]. Therefore, the LSPR of elliptical
plasmonic nanostructures is expected to be highly polarisation dependent. In this regard, Figure 6a
shows the reflectance spectra of Au ellipsoidal cylinders with axes 80 and 110 nm, inside an array with
a lattice constant of 200 nm under unpolarised and linearly polarised light parallel to two different
axes [65]. The inset depicts the SEM image of the nanoparticle array. The broad LSPR observed for
unpolarised excitation can be easily resolved by polarised illumination parallel to two axes, found to
be located near 630 and 730 nm. Experimental observations are further verified with DDA simulations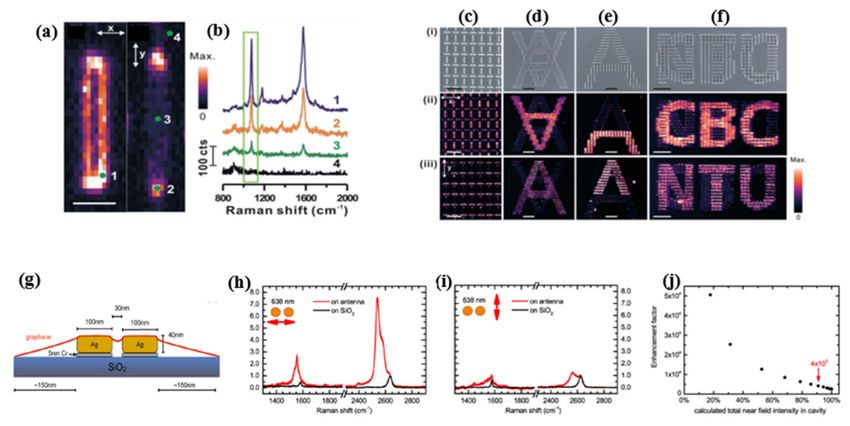
Symmetry 2020, 12, 1365                                                                                        9 of 57

in the sample with the same dimension, however, with a larger lattice constant of 300 nm. The DDA
simulations confirm the presence of two distinct resonance peaks even with unpolarised excitation
when there is no coupling between neighbouring particles due to a larger lattice constant. Nevertheless,
selective polarisation parallel to axes can lead to the excitation of the individual LSPR as evident from
Figure 6b. Of late, Xia and co-workers [66] exploited the inherent asymmetry of elliptical graphene
disks (Figure 6c) and showed that two orthogonal plasmonic modes along minor and major axes can
be excited together or separately by choosing the incident light polarisation. The polarisation response
is shown in Figure 6d,e for minor and major axis excitation, respectively, that reveals that resonant
high frequency modes are favourably excited for minor axis polarisation. Apart from that, with an
increase in AR, LSPR frequency for the eigenmode along the minor axis shows a blueshift, while it
remains almost unchanged for the eigenmode along the major axis. Such observation indicates that the
LSPR frequency of the mode along the minor axis is more sensitive to its length. To understand the
role of incident light polarisation, first, the results are shown for a round graphene disk in Figure 6f,i.
Expectedly, polarisation independent isotropic response is observed due to spherical symmetry of the
round disk. On the other hand, Figure 6g,h shows polarisation dependent scattering spectra of two
different sized ellipses by varying the polarisation direction from the minor axis (0◦ ) to the major axis
(90◦ ). The relative strength of minor and major axes modes is shown by the polar plots for two ellipses
in Figure 6j,k. They found that for both the ellipses, scattered intensity along the major axis (blue curve)
is larger than that along the minor axis (red curve), thereby suggesting that light–matter interaction
takes place predominantly along the major axis. Notably, the frequency difference between major and
minor axes plasmon modes increases with increase in size difference between them, therefore provides
more degrees of freedom for light manipulation. A similar kind of polarisation dependent response in
plasmonic elliptical nanoholes can also be found elsewhere [67–69].

       Figure 6. (a) The reflectance spectra of an array of ellipsoidal Au nanoparticles with axes of 80 and
Symmetry 2020, 12, 1365                                                                                       10 of 57

     110 nm, with a lattice constant of 200 nm over ITO coated glass under unpolarised illumination and
     linear polarisations parallel to short (x-pol) and large (y-pol) axes. The inset gives SEM images of the
     corresponding ellipsoid nanoparticle array. (b) DDA simulation results for the extinction efficiency of a
     single Au nanoparticle with 80 and 110 nm axes standing on ITO/Air interface. All the figures were
     reprinted (adapted) with permission from [65], Copyright 2010, The Optical Society. (c) The schematic
     diagram and the SEM image of periodic graphene ellipse arrays on BaF2 . The length of semi-major and
     semi-minor axes are a and b, respectively. Scale bar of the SEM image: 140 nm. Experimental extinction
     spectra at normal incidence with the polarisation along (d) minor and (e) major axes, respectively.
     From yellow line to purple line, the sizes of ellipse are a = 77:5 nm, b = 30 nm (orange); a = 72:5 nm,
     b = 25 nm (green); a = 67:5 nm, b = 20 nm (blue); a = 62:5 nm, b = 15 nm (purple), respectively.
     Polarisation-dependent extinction spectra of three different ellipticity structures. The extinction spectra
     of normal incident light with polarisations varied from 0◦ to 90◦ for (f) round graphene disk with
     45 nm radius. (g) Ellipse with a = 70 nm, b = 38 nm; (h) ellipse with a = 70 nm, b = 32 nm. (i–k) are
     polar plots showing the extinction intensities for all polarisation direction of the two resonant plasmonic
     modes corresponding to (f–h), respectively. All the figures were reprinted (adapted) with permission
     from [66], Copyright 2019, The Optical Society.

2.6. Nanoprism and Nanotriangle
      Triangular nanoprisms are a special type of plasmonic nanostructure where the combination
of LSPR excitation and lightning rod effects leads to strong field enhancement [70,71]. Triangular
Au and Ag nanoprisms hold advantages over flat and round surfaced nanostructures thanks to the
presence of the sharp tips and edges, known as “hot spots” which favours strong enhancement in
their LSPR [20,72] and allows high sensitivity to bulk and local dielectric changes. Several theoretical
calculations by DDA simulation have shown the excitation of multipolar (l = 1, 2 and 3) LSPR modes in
nanotriangles [20,73–75]. In their work, Félidj et al. [21] used far-field extinction spectroscopy to study
in-plane multipolar LSPR modes on regular arrays of Au triangular particles (Figure 7a). Figure 7b
depicts the extinction spectra corresponding to the arrays of different lateral size. For the array A with
smallest lateral size, the LSPR response consists of a single peak at 590 nm, which is redshifted to
665 nm with increasing intensity for array B. With an increase in lateral size to arrays C and D, the
first peak further redshifts with an additional weak peak appearing on the blue side of the spectrum.
The strong peak in the longer wavelength regime is assigned to dipolar resonance (l = 1) while the
weaker peak in the shorter wavelength regime is ascribed to quadrupolar mode (l = 2). It is shown that
the theoretically calculated extinction cross-sections match well with the experimental results within
± 10 nm. For further large triangle of edge length a = 360 nm and grating constant of 840 nm (array E),
l = 1 and l = 2 peak further redshifted to 974 and 672 nm while an additional new mode of l = 3 appears
at 615 nm. In a rather unconventional work, Gao at co-workers [74] theoretically demonstrated that
when the tips and edges, i.e., hotspots of lateral triangular nanoprisms are exposed to the environment
directly, their LSPR characteristics are predominantly controlled by the polarisation over propagation.
Symmetry 2020, 12, 1365 11 of 57
Figure 7. (a) Scanning electron microscopy image of the array A, constituted of gold nanotriangles
on ITO. (b) Experimental extinction spectra of gold nanotriangles. The spectra correspond to triangle
arrays with five different lateral sides. (A) 50 nm, (B) 100 nm, (C) 150 nm, (D) 200 nm, and (E) 260 nm.
All the figures were reprinted (adapted) with permission from [21], Copyright 2008, American Institute
of Physics.
2.7. Nanocrescent
Nanocrescents (NC) are a very special type of nanostructures which are fabricated using nanosphere
template lithography (NTL) [76,77]. Bukasov and Shumaker-Parry [22] demonstrated that Polystyrene
spheres (PS) of varying diameters can be exploited as templates to fabricate NCs with well-defined
shape and size using NTL, as shown in Figure 8a–e. The NCs have sharp corners that can induce
strong electromagnetic field enhancement. The LSPR of NCs is easily tunable by structural parameters
like thickness, tip sharpness, tip gap angle, orientation [22,78]. Apart from that, due to the asymmetry
of the crescent structure, LSPR is believed to be highly polarisation dependent. Figure 8f shows
the extinction spectra consists of several peaks of the NCs produced from PS templates of different
diameters [22]. For all the NCs the weakest peaks appeared in the visible range around 600 ± 50 nm
range which is ascribed to the out-of-plane LSPR mode that is less sensitive to the NC orientation as
well as to the incident polarisation. The dominating longitudinal LSPR peaks for all NCs appear in the
longer wavelength side, e.g., at 2640 and 2470 nm for 410 and 356 nm diameter templates when the
incident light is polarised along the long axis of the NC. On the other hand, transverse LSPR peak
dominates for polarisation along the short axis of NC, e.g., 1450 nm peak for the templates of diameter
356 nm. Notably, both the longitudinal and transverse LSPR peaks of the NCs redshift with an increase
in the template diameter as depicted in Figure 8g. The longitudinal LSPR peaks are found to be
very sensitive to the incident polarisation as it reduced by 300–500% with unfavourable polarisation,
while the transverse peaks are less sensitive which changes only by 10–30% against the variation of
incident polarisation. In this regard, Cooper et al. [79] studied the polarisation sensitive LSPR response
of open-structure NCs (Figure 8h). As shown in Figure 8i, LSPR extinction spectra of open-tip AuNCs
upon unpolarised light excitation, consists of four distinct peaks, each of which is associated with
particular mode.Symmetry 2020, 12, 1365 12 of 57
Figure 8. SEM images of nanocrescents template with PS beads with diameters of (a–c) 356 nm,
(d) 194 nm beads, and (e) nanorings template with 125 nm diameter PS beads. (f) Ensemble extinction
spectra with the PS bead template diameter shown near the longitudinal peaks. (g) The linear
dependence of nanocrescent LSPR peaks on the diameter of the PS template used to fabricate the
nanocrescents. All the figures were reprinted (adapted) with permission from [22], Copyright
2007, American Chemical Society. (h) Illustration of the direction of electric field polarisation with
respect to nanocrescent axes for distinct resonance modes. (i) Extinction spectra of 356 nm diameter
template AuNC. The varying polarisation angles (P) demonstrate selective excitation, co-excitation or
non-excitation of resonances at specific angles. Peak labels correspond to unique resonance modes
described in text: 1, long axis dipole; 2, short axis dipole; 3, long axis quadrupole; 4, out-of-plane dipole.
(j) Polar plot of normalised extinction values for the LA-D (red) and SA-D (purple) resonance modes,
demonstrating the anisotropy of 356 nm diameter AuNCs. (k) Experimental (solid) and calculated
(dashed) polarisation anisotropy values (A) for LA-D (red) and SA-D (purple) resonances of the same
AuNC sample. All the figures were reprinted (adapted) with permission from [79], Copyright 2013,
American Chemical Society.
The peaks shown in Figure 8f under different polarisation can be assigned to particular resonance
mode. The position of these peaks can be tuned by changing the angle between the incident light
polarisation and the nanostructure orientation. By setting the incident light polarisation along the long
and short axes of the nanocrescents, various resonance modes can be excited selectively and likewise
can be assigned to long axis dipole (LA-D), short axis dipole (SA-D), long axis quadrupole (LA-Q),
and out-of-plane dipole (OOPD) modes, as shown in Figure 8i. Both LA-D and LA-Q resonance modes
are selectively excited when the incident light polarisation is along the long axis of the nanocrescent
(0◦ ). Notably, LA-D resonance mode shows strong electric field enhancement and appears between
the near- to mid-infrared regime. On the other hand, the LA-Q mode is much weaker compared
to LA-D and likewise produces a weaker peak with lower field enhancement. On the other hand,
when light is polarised along the short axis (SA) of the nanocrescent (90◦ ), i.e., orthogonal to LA, SA-D
mode is excited, which is although strong, however less dominant than LA-D, thus not coupled with
incident light most efficiently. The last one, i.e., out-of-plane weak dipole (OOP-D) mode can be excited
irrespective of the incident polarisation, in a direction perpendicular to the plane of the nanocrescent
around the visible wavelength range. Notably, while LA-D and SA-D modes redshift with increasing
template diameter, OOP-D mode remains invariant against the variation of template diameter, similar
to observations by Bukasov et al. [22]. The polarisation dependence of the nanocrescent LSPR can
be visualised from the 360◦ polar plot as shown in Figure 8j. For LA-D mode maximum intensity is
obtained for 0◦ and 180◦ , whereas SA-D shows maxima for 90◦ and 270◦ , thus indicates that these two
modes are orthogonal to each other. Likewise, PA discussed before can be calculated for long axisSymmetry 2020, 12, 1365 13 of 57
as PALA = (ILA −ISA )/(ILA +ISA ) [80]. Here ILA and ISA are defined as the normalised intensities of the
LA-D and SA-D resonance modes, respectively, for any given angle. From Figure 8k it is apparent that
both calculated and measured normalised extinction for LA-D mode at 2278 nm and SA-D mode at
1284 nm become 1 at 0◦ and 90◦ for PALA and PASA , respectively. In addition, Goerlitzer et al. [81]
and Zhang et al. [82] also demonstrated that LSPR of NCs depends strongly on the polarisation of the
excitation light.
2.8. Hybrid Plasmonic Nanostructures
The quest for an enhanced electromagnetic field with superior signal-to-noise ratio from the
optical signal leads to the idea of engineered plasmonic nanostructures [83]. Two-dimensional (2D)
materials, thanks to their reduced symmetry provides ample controllability over physical properties,
thus become an ideal candidate in the field of optics, optoelectronics and nanophotonics [84–86].
The integration of a 2D material with a plasmonic nanomaterial leads to a new generation of hybrid
nanostructures which can efficiently manipulate the light through LSPR, that leads to exotic spectroscopy
enhancement phenomenon, including SERS, PL, enhanced transmission, etc. [87–89]. Among the
family of 2D materials/plasmonic hybrid nanostructures, black phosphorus (BP) [90,91] and GaSe
metal chalcogenides [92] need special mention thanks to their tunable optical, electrical and electronic
properties. In a recent theoretical framework, Deng and co-workers [26] demonstrated that excitation
of surface plasmon polaritons (SPP) at the metal/BP array interface leads to broadband enhanced
transmission which is found to be strongly polarisation dependent because of the inherent anisotropy
of BP structure, coming from x-(armchair) and y-(zigzag) directions. A schematic diagram of gold
patch arrays with a BP sheet hybrid structure is shown in Figure 9a. Clearly in both x-(armchair) and
y-(zigzag) directions, transmission enhanced significantly (Figure 9b) through gold slit arrays after the
BP incorporation, when LSPR at gold/BP interface couples with the SSP modes of BP. Interestingly,
enhancement of transmissions is strongly wavelength dependent and also occurs differently for
different polarisations, which leads to anisotropic polarisation response.
Figure 9. (a) Schematic of continuous BP sheet at the bottom of the gold patch arrays and (b)
transmission of the structure with and without the BP sheet. (c) Transmission spectra of the gold patch
arrays structures with BP under different polarisation angles. All the figures were reprinted (adapted)
with permission from [26], Copyright 2019, The Optical Society. (d) SEM image of the Ag nanoprism
gratings on GaSe layers. (e) Measured PL spectra with TM and TE polarisations for the normal GaSe/Ag
hybrid structure. (f) Measured PL spectra for the GaSe/Ag grating structure, along two detection
polarisation directions, TM and TE, with TM and TE excitation polarisations, respectively. The “TE−TE”
(“TM−TM”, “TE−TM”, and “TM−TE”) indicates the spectrum pumped with the TE (TM, TE, and TM)
polarised incidence and detected along the TE (TM, TM, and TE) polarisation direction. All the figures
were reprinted (adapted) with permission from [93], Copyright 2019, American Chemical Society.Symmetry 2020, 12, 1365 14 of 57
To obtain a clear picture, Figure 9c shows the polarisation dependent transmission spectra at
different wavelengths. It can be seen that for varying polarisation angle from 0◦ to 90◦ , at shorter
wavelengths transmission slightly decreases, while transmission gets higher at longer wavelengths [26].
Such observation can be understood from wavelength dependence of x- and y-polarisation transmission.
Below 15 µm, for both the x- and y-polarisation, the transmission with BP is almost indistinguishable.
However, for above 15 µm, as the excitation of the propagating SPPs is not possible in the x-direction,
transmission is reduced significantly. Nevertheless, transmission remains high in the y-direction
(Figure 9b). Hence, a strong polarisation-dependent wave transmission is observed in the proposed
hybrid nanostructures. In another similar work, Wan et al. [93] fabricated hybrid plasmonic
nanostructures by designing a periodic array of Ag metallic nanostructures on typical 2D GaSe
layers. Experimental results indicate that both SERS and PL signal enhanced significantly in the hybrid
nanostructures compared to pristine one and the effect is found to be strongest for thinnest GaSe layer.
Based on the plasmonic-enhanced optical response, they tried to manipulate the optical properties
on the GaSe/Ag hybrid nanostructure. To realise the optical anisotropy, it is desirable to have broken
structural symmetry in the x-y plane, which allows selective excitation of transverse and longitudinal
surface plasmons by varying incident polarisation. For practical application, Ag nanoprisms with
patterned gratings were imprinted on the GaSe layer, along the x axis with a periodicity of 1176 nm,
which can be clearly seen from the SEM image in Figure 9d. To experimentally observe the optical
anisotropy, PL spectra are recorded at TE (⊥ to x-axis)) and TM (k to x axis) polarisation as shown
in Figure 9e,f. We learnt from Figure 9e that PL spectra in normal GaSe/Ag hybrid structure is
polarisation-independent because of the presence of low anisotropy in geometric configuration.
In stark contrast, a strong polarisation dependent PL spectrum is obtained for the GaSe/Ag grating
structure. For example, under TM excitation polarisation, the PL at TM- and TE-polarised detections
show a 9.3% polarisation which remains 8.2% for TE polarised excitation. Both the excitation and
detection of PL signal show strong polarisation dependence which indicates anisotropic polarisation
response. Precisely, for both TE and TM excitations, PL signals are detected to be higher along the TM
polarisation [93]. On the other hand, when detected in two different polarisation directions, band edge
emissions are more favourably excited for TE polarised excitation compared to TM polarisation.
In short, polarisation sensitive, selective excitation and emission in GaSe/Ag grating structure confirms
the role of Ag nanoprism gratings in inducing anisotropic plasmonic pumping in GaSe luminescence,
which holds tremendous potential application in fabricating anisotropic 2D nanodevices.
2.9. Selected Applications
Manipulation of the polarisation state of light at the nanoscale by plasmonic nanostructures of
various shape and size discussed above has led to notable applications in photonics, optoelectronic
devices, plasmonic circuits and optical sensing techniques [94–98]. Of late, key functional elements of
optoelectronic devices and nanophotonic circuitry have been realised utilising plasmonic structures,
providing proof of principle devices at scales, which is otherwise not achievable with conventional
photonics [95,99,100]. Plasmonics also continues to demonstrate progressing utility in biological and
chemical fields, with plasmonic sensing methods providing single-molecule sensitivity at nanoscale
dimensions [101–103]. The unique structural orientation and favourable polarisation direction
of individual nanostructures have given rise to many diverse applications. For example, LSPRs in
nanoparticles have been utilised to locally enhance Raman scattering, with dimer, trimer and quadrumer
nanoparticle arrangements demonstrating confined Raman enhancement hot-spots, with marked
polarisation dependence [104–106]. Nanorods, due to their polarisation dependent longitudinal LSPR
modes, have been employed as orientation sensors, also allowing for precise alignment and rotation
using polarised laser tweezer techniques [33,107]. Recently, one-dimensional nanowires have found
wide-ranging applications, most notably in the development of novel plasmonic circuitry as plasmonic
waveguides, routers, multiplexers and logic gates, etc. [60,100,108,109].Symmetry 2020, 12, 1365 15 of 57
Photonic devices have been proposed as the foundation for the next generation of
semiconductor-based computing thanks to their remarkable speed, bandwidth and energy efficiency as
compared to their electronic counterparts. Plasmonic analogues of optical components can be replicated
at nanoscale dimensions, and many of the functional elements required for plasmon-based integrated
circuits have been developed recently, including Plasmonic waveguides, multiplexers, de-multiplexers,
emitters, detectors, gain media and Boolean logic gates, etc. [60,100,108,109]. Among the variety
of plasmonic nanostructures, Ag nanowires (NWs) are of particular interest because of the low
loss propagation of surface plasmons (SPs) along the wire in the visible to near-infrared spectral
range [110,111]. The coupling of far-field light to propagating SPs can be achieved when light is
incident on metal NW terminals, allowing for subwavelength confinement as the SP travels along
the NW before being emitted as a photon at the distal end. This in/out coupling process requires a
scattering mechanism to take place and, as such, is found to occur only at areas of symmetry breaking
within the wire, such as wire ends or sharp discontinuities [112]. Coupling of light to the AgNW in
Figure 10a(i) by focused laser illumination is illustrated in Figure 10a(ii), launching a propagating SP
that is re-emitted as scattered light from the NW terminal. These propagating SP distributions can be
successfully imaged by coating the NWs with fluorescent quantum dots (QDs), which are excited by
energy transfer from the propagating SPs [8]. Unique near-field distribution patterns are observed as a
result of the superposition of different SP modes within the NW. It can be seen that these distributions
change as the polarisation of the incident light is varied, with Figure 10a(iii,iv) demonstrating the
patterns obtained for orthogonal polarisations using QD imaging.
Figure 10. (a) (i) SEM image of an AgNW, scale bar is 5 µm. (ii) Scattering image during focused laser
illumination of the NW terminal. (iii,iv) Quantum dot fluorescence imaging of the NW’s propagating
SP field distribution for different incident polarisations indicated by the green arrows. (b) (i) White
light image, (ii) scattering image, and (iii) QD fluorescence image of a branched NW structure during
polarised illumination. θ indicates the angle of polarisation of the incident light. (c) Output intensity of
branch terminals A and B as the incident polarisation angle θ is varied. Selective routing into either
branch can be achieved by tuning of the incident polarisation. All the figures were reprinted (adapted)
with permission from [8], Copyright 2015, Royal Society of Chemistry.
Coupling of light to NWs at regions other than terminals or discontinuities is observed only
as a result of near-field interactions and cannot occur through far-field illumination [61]. However,
these near-field interactions were shown to facilitate the transfer of propagating SPs from one NW
to an adjacent NW due to near-field coupling, allowing SPs to propagate through branched NW
networks [60]. The successful coupling of propagating SPs from one NW to another depends on the
near-field intensity at the junction between the two, with the SP either being routed into the adjacent
wire or continuing in the original wire. The near-field patterns observed in these NWs are found to
be strongly dependent on the polarisation of incident light. For example, the simple branched NW
network shown in Figure 10b(i,ii) allows selective routing of propagating SPs into either branch A or B
by tuning the incident polarisation. The near-field coupling to branch A from the main wire occurs due
to the large near-field intensity at the junction between the two (marked by the upper white arrow in
Figure 10b(iii)), while the weak near-field intensity at the junction with branch B (lower white arrow)Symmetry 2020, 12, 1365 16 of 57
does not lead to successful coupling. Figure 10c shows the output intensity from both A and B as the
polarisation is rotated. A polarisation angle of θ ≈ 150◦ exhibits a maximum scattering intensity from
A and a minimum from B, while an angle of θ ≈ 230◦ exhibits a maximum from B and minimum from
A, demonstrating the polarisation selective routing behaviour. The routing process is also found to
be dependent on the incident wavelength, leading to light at different frequencies being routed into
different branches within the network, allowing for de-multiplexing of multi-wavelength signals [60].
In another pioneer work, Wei and co-workers demonstrated that, in simple AgNW networks,
interference of plasmons between primary and secondary/branched NWs modulates the near-field
distribution to control the output optical signal, which can be exploited to realise the complete family
of Boolean logic gates [108,113]. NW networks with two input terminals (I1 and I2) were used to
combine propagating SPs within the main wire, where both the phase difference and polarisation angle
led to interference that dictated the output (O) of the NW network as shown in Figure 11a. Polarisation
control allows coupling between wires to be maximised while tuning the relative phase difference
between the propagating SPs allows their interaction to lead to constructive or destructive interference.
Specific input phase and polarisations demonstrate a maximum to minimum intensity ratio larger
than 10, allowing for simple binary classification of ‘ON’ and ‘OFF’ states, and the performance of
basic logical functions (Figure 11a). For example, when inputs I1 and I2, separately or together, leads
to maximum output at O, an “OR” gate is realised. On the other hand, when the output signal is
obtained only for individual inputs and disappears (OFF) when two SPs propagate together owing to
destructive interference between them, the NW network behaves as XOR gate. Further complicated
NW networks with two inputs, I1 and I2, and two output terminals, O1 and O2, (Figure 11b) are also
exploited to realise the additional logic gates. It can be seen from Figure 11b that for simultaneous
inputs from I1 and I2, the outputs O1 and O2 are complementary to each other. An “AND” gate can
be realised by considering O2 as the gate output, setting the output intensity threshold for the ‘ON’
state to 450 au, and tuning the relative phase delay so that simultaneous inputs at I1 and I2 lead to a
maximum output at O2. In this case, inputs at I1 and I2 individually lead to a sub-threshold output at
O2 (~100 and ~350 au, respectively) yielding a ‘low’ output, but simultaneous inputs at I1 and I2 leads
to an output at O2 that exceeds the threshold (~800 au) yielding a ‘high’ output. Similar four-terminal
NW networks are also proposed to demonstrate other logical functionalities like ‘NOT’, ‘NAND’ and
binary ‘Adder’ operations as illustrated in Figure 11c.
Wei et al. further demonstrated the ability of AgNW networks to cascade basic logic functions to
create more complex logic functions [109]. In their work, a four-terminal branched AgNW network
was exploited to realise a universal logical ‘NOR’ gate by cascading ‘OR’ and ‘NOT’ gates as illustrated
in Figure 11d. Operation of both the ‘OR’ and ‘NOT’ gates can be tuned by varying the intensity,
polarisation and phase of I1 and I2. The ‘NOR’ gate is illustrated by considering terminals I1 and I2 as
inputs where C serves as control terminal which inverts the signal, resulting in the binary ‘high/low’
states. The first section of the network consists of a primary and branched NW, with inputs I1 and I2
that operate as an ‘OR’ gate (as before), with inputs from I1 and I2 separately or together leading to a
‘high’ output from the gate. The second section takes the output from the first and, using a control
input C from the second NW branch, uses destructive interference to realise a logical ‘NOT’ gate,
inverting the output of the ‘OR’ gate. The realisation of the ‘NOR’ gate can be understood clearly by
looking into the scattering images of the NW network with different combination of the inputs I1, I2,
and C as shown in Figure 11f–k. For example, following inputs from I1 and I2 separately or together,
the output is ‘high’ (as depicted by the yellow circle), indicating the ‘OR’ functionality (Figure 11f–h).
Alternatively, when I1 and I2 are ‘low’ and C is enabled, the network output is ‘high’, thus depicting
the ‘NOT’ operation (i). Finally, the ‘NOR’ gate is demonstrated when the ‘NOT’ gate acts upon the
‘OR’ gate, i.e., when the output is inverted to ‘low’ with both or either I1 and I2 being ‘high’, due to the
control input C (j,k).You can also read