Mitigation Actions and Opportunities to Address Community Flood Risk Summary Report - ResilientAmerica Program The National Academies of Sciences ...
←
→
Page content transcription
If your browser does not render page correctly, please read the page content below

Mitigation Actions and Opportunities to
    Address Community Flood Risk

               Summary Report
                 December 10-11, 2019

                                      ResilientAmerica Program
 The National Academies of Sciences, Engineering, and Medicine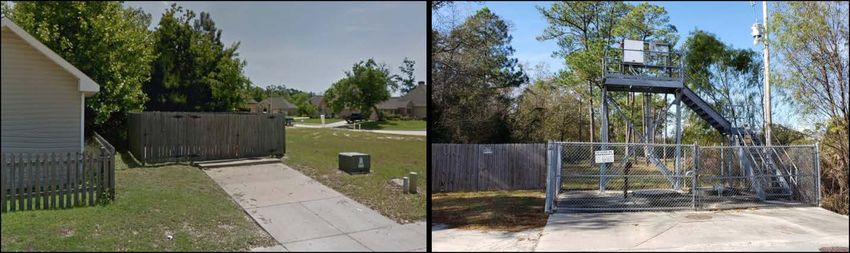
CONTENTS
Introduction .................................................................................................................................... 1
Urban Flooding: How Flooding has Evolved and is Impacting Communities ................................. 2
Panel 1 – Addressing Mitigation Challenges: Living with Flood Risk .............................................. 5
   City of Charleston Sea Level Rise Strategy .................................................................................. 5
   Norfolk: Resilient Coastal Community of the Future.................................................................. 9
Financing Resilience ...................................................................................................................... 12
   Introduction to Environmental Impact Bonds .......................................................................... 12
Panel 2 – Using Science and Data to Inform Decision-Making ..................................................... 16
   A Vision for a More Resilient Iowa: The Iowa Watershed Approach ....................................... 16
   Validating Operational Flood Forecast Hydro Models Using Sensors and Citizen Science ...... 18
   Open-Storm............................................................................................................................... 20
   Using Science and Data to Inform Decision Making ................................................................. 22
Resilient America Program: Flood Mitigation and Community Engagement Project .................. 24
Panel 3 – Community Actions for Mitigation................................................................................ 27
   Ellicott City, MD ........................................................................................................................ 27
   Hazard Mitigation Challenges – Biloxi, MS ............................................................................... 29
   Where Coast & River Meet – Tybee Island, GA ........................................................................ 31
   Roanoke, VA .............................................................................................................................. 34
Panel 4 – State Mitigation Programs and Resources .................................................................... 37
   Georgia Hazard Mitigation Assistance (HMA) Programs Overview.......................................... 37
   Mitigation Actions and Opportunities to Address Community Flood Risk ............................... 38
   Maryland’s Disaster Risk Reduction Efforts: Mitigation Actions & Opportunities to Address
   Community Flood Risk .............................................................................................................. 40
Panel 5 – Federal Mitigation Resources, Funding, and Technical Assistance .............................. 43
   FEMA Hazard Mitigation Assistance Grants ............................................................................. 43
   Supporting Risk Reduction through the National Disaster Recovery Framework.................... 46
   USGS Flood Resiliency Resources ............................................................................................. 50
   National Weather Service (NWS).............................................................................................. 52
Appendix 1. Agenda ...................................................................................................................... 54
Appendix 2. Speaker & Moderator Biographies ........................................................................... 57
INTRODUCTION
The Resilient America Program (RAP) of The National
Academies of Sciences, Engineering, and Medicine
visited select communities in the southeastern
region of United States that recently
experienced flood-related disasters to learn
about mitigation efforts at the local level.
Specifically, this project investigated the range
of mitigation actions and investments taking
place in communities, the challenges
communities face mitigating floods, and what
communities need that will enable them to make
investments in mitigation.
The RAP facilitated discussions (July-September 2019) with diverse stakeholders in four
communities—Biloxi, MS; Ellicott City, MD; Roanoke and Vinton, VA; and Savannah and Tybee
Island, GA—about their flood mitigation efforts, successes, and challenges.
Specific project goals were to better understand:
• the risks and impacts of floods on communities,
• actions communities are taking to mitigate future floods,
• flood mitigation success stories, best practices, and lessons learned in communities,
• challenges communities continue to face related to flood mitigation,
• what communities need in order to enable them to make informed decisions about
flood mitigation, and
• how communities are funding their flood mitigation activities.
The RAP convened a two-day flood mitigation event in Atlanta, GA (December 10-11, 2019),
which brought together stakeholders from the four communities that participated in Resilient
America’s community dialogues on flood mitigation, experts and community practitioners, and
representatives from local, state, and federal agencies to engage in an interactive discussion
focused on solutions and actions for mitigating and building resilience to flood risk. The
objectives of this event were to: (1) share information learned during the community meetings
and provide opportunities for peer-to-peer learning among community stakeholders; (2)
explore ways communities are addressing some of their flood mitigation challenges; and (3)
learn about federal and state resources available to communities for mitigation. This report
provides a summary of the event.
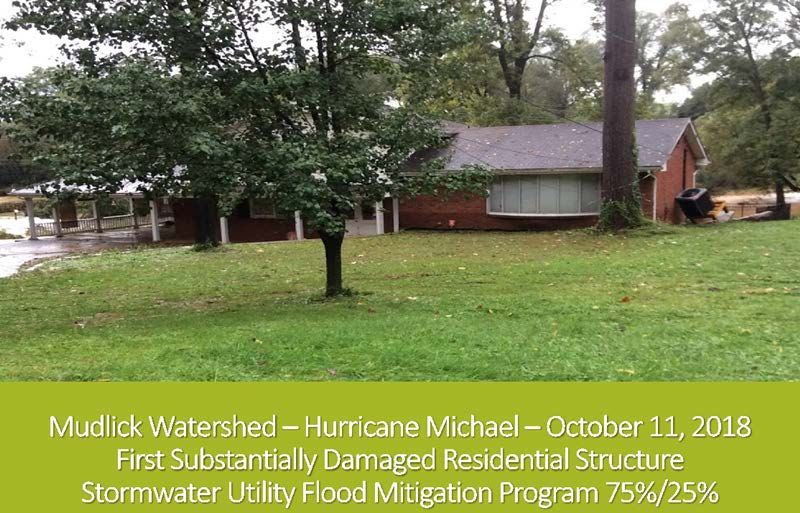
All images that appear in this report are from presenter PowerPoint presentations.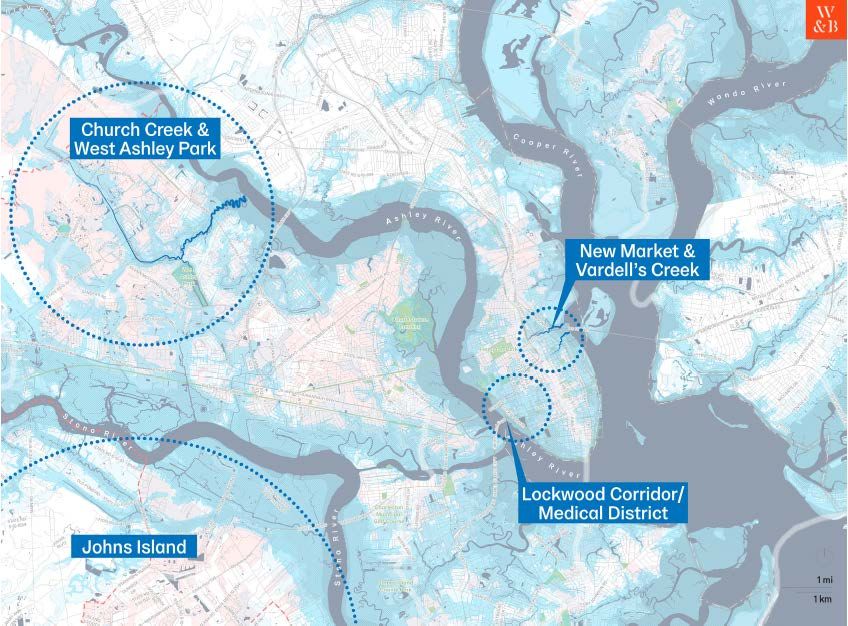
URBAN FLOODING: HOW FLOODING HAS EVOLVED AND IS IMPACTING
COMMUNITIES
Dr. Lauren Alexander Augustine, Executive Director, Gulf Research Program, National
   Academies of Sciences, Engineering, and Medicine
Dr. Gerald E. Galloway, Glenn L. Martin Institute Professor of Engineering, University of
   Maryland

Dr. Lauren Alexander Augustine discussed some of the findings of the National Academies of
Sciences, Engineering, and Medicine’s recent report Framing the Challenge of Urban Flooding in
the United States. 1 There are four dimensions of urban flooding:
    1. The physical dimension represents the built and natural environments.
    2. The social dimension represents the people, where they live, who in the community is
       impacted, what those impacts look like, etc.
    3. The information dimension looks at a variety of issues such as what data are needed to
       understand the flood risk, how to communicate risk, how people interpret information
       about risk, etc.
    4. The actions and decisions dimension considers what needs to be done about urban
       flooding, how decisions are made, how flooding is managed, etc.

A lot of flood risk markers are starting to converge. More and more people are moving to flood-
prone areas like the coast, weather patterns are changing, and infrastructure is aging.
Infrastructure is an especially daunting problem, but there is no political will or funding to fix
aging infrastructure. Planning to address urban flooding is challenging especially since the data
needed to understand it are lacking.

Dr. Gerald Galloway co-authored a recently published report The Growing Threat of Urban
Flooding: A National Challenge 2 that considered several questions including: What is urban
flooding? Where is it occurring? What are the consequences of urban flooding? What do we
need to do about it?

This report was based on a national survey of municipal flood and stormwater managers and
professionals, and found:
    • 83% of respondents experienced urban flooding in their communities.
    • 65% of respondents indicated that most of the damages from these floods were not
        covered by the National Flood Insurance Program (NFIP) because the community was
        located well outside the areas of the FEMA floodplains and located in areas that were
        not considered at risk for floods.
    • 41% of respondents indicated that their communities do not have funding to address
        their urban flooding problem.

1
  National Academies of Sciences, Engineering, and Medicine. 2019. Framing the Challenge of Urban Flooding in
the United States. Washington, DC: The National Academies Press. https://doi.org/10.17226/25381.
2
  Galloway, G. and Brody, S. 2018. The Growing Threat of Urban Flooding: A National Challenge. University of
Maryland, College Park and Texas A&M University, Galveston Campus. Accessed February 3, 2020.
https://cdr.umd.edu/sites/cdr.umd.edu/files/urban-flooding-report-online.pdf.

Mitigation Actions and Opportunities to Address Community Flood Risk                                Page 2 of 66
•   32% of respondents stated that there is a lack of political will to address the urban
        flooding problem.
    •   Respondents believed only 34% of elected officials and 28% of the public were
        concerned about urban flooding in their communities.

Some of the report’s conclusions include:
   • Urban flooding is a local government issue, but it is everyone’s problem. How do we put
      communities in a better position to be able to deal with urban flooding?
   • The division of responsibility for urban flooding is fragmented. There is too much stove-
      piping within government and between agencies and organizations. There is no
      coordinated approach for dealing with urban flooding.
   • Infrastructure is aging and inadequate, and it is getting worse.
   • There is no federal agency charged with coordinating the federal support of urban
      flooding.
   • The economic and social impacts of urban flooding are immense. The lowest income
      groups are being hit hardest.
   • Government is not communicating the urban flooding risk very well, but the data
      needed to understand the risk are lacking.

One problem that exacerbates urban flooding is a lack of affordable housing. There is not
enough, if any, affordable housing outside of high-risk areas for a good portion of the
population. The people least able to deal with and recover from flooding are living in the areas
most at risk for flooding.

Q&A

Who is responsible for solving the urban flooding problem?

Dr. Galloway reiterated that within the federal government, there is no single agency in charge
of urban flooding. The Federal Emergency Management Agency (FEMA), U.S. Army Corps of
Engineers (USACE), and U.S. Department of Housing and Urban Development (HUD) each have
a role, for example. What do we need to do to get all these agencies together to share
information and work together on this issue? How do we establish a linkage between
communities that are dealing with the problem and the federal government that has the money
to address the problem? During the Obama Administration, there was concern about what to
do about climate change. Governors, tribal leaders, and mayors were brought together to
develop recommendations on what the Administration should do. 3 4 This kind of initiative is
needed to bring the importance of the urban flooding problem to the attention of decision
makers. Community stakeholders need to come together and tell their mayors and governors

3
  The White House. November 2014. President’s State, Local, and Tribal Leaders Task Force on Climate
Preparedness and Resilience: Recommendations to the President. Accessed February 3, 2020.
https://obamawhitehouse.archives.gov/sites/default/files/docs/task_force_report_0.pdf.
4
  “State, Local, and Tribal Leaders Task Force on Climate Preparedness and Resilience.” The White House. Accessed
February 1, 2020. https://obamawhitehouse.archives.gov/administration/eop/ceq/initiatives/resilience/taskforce.

Mitigation Actions and Opportunities to Address Community Flood Risk                                 Page 3 of 66
how difficult the urban flooding problem is and request that these decision makers address this
problem in their annual budgets.

What is the status of political involvement and engagement on the urban flooding problem?

Based on the communities she has visited, Dr. Augustine stated that there is political will in
many communities to deal with urban flooding. Dr. Galloway asked, “Political will for whom?”
In many communities, the wealthier neighborhoods are repaired and fixed, but lower-income
neighborhoods continue to be neglected. Inequity is a factor when it comes to political will.

There is often a lot of political will to move vulnerable populations out of flood-prone areas. But
these vulnerable populations may not want to relocate or cannot afford to relocate. How do we
solve this issue?

Dr. Augustine stated that people are attached to where they live and where they are from. The
need to displace large groups of people is becoming more and more a reality. Figuring out this
displacement issue is a big challenge and needs to be addressed. Dr. Galloway added that HUD
has a role and needs to step in and be a partner. And communities need to start making better
decisions about where they build.

Communities are already funding projects (e.g., repairing stream infrastructure, cleaning debris
from storm drains) that help manage flooding for lesser storms (e.g., 10- or 25-year storms)
which can help create more resilient watersheds and slowly build resilience toward bigger
storms. Are there communities across the country that are working on strategies to manage
lesser storms to create more resilient watersheds?

Dr. Augustine stated that a lot of coastal communities are doing this, especially those that
experience frequent nuisance flooding. Maricopa County, AZ is an example of a community that
is starting to approach flooding this way. In Snohomish County, WA, the County Commissioner
once said, “Don’t bring me a $2 million solution when I only have a $250,000 budget.” This
highlights the importance of management. Communities need to effectively manage their
budgets to start chipping away at the problem.

Dr. Galloway concluded that true resilience is knowing what your risk is and recognizing that
even if you do not currently have resources to mitigate that risk, you can make sure you know
what you can do to prepare for it.

Other Resources
   − Urban Flood Hazards: Challenges and Opportunities. Discussion Paper (draft) 5

5
 Association of State Floodplain Managers, Inc. 2019. “Urban Flood Hazards: Challenges and Opportunities.”
Discussion Paper (draft). Accessed January 31, 2020. https://www.floods.org/ace-
images/UrbanFloodHazardAreasDiscussionPaperDRAFT6_19_2019.pdf.

Mitigation Actions and Opportunities to Address Community Flood Risk                                Page 4 of 66
PANEL 1 – ADDRESSING MITIGATION CHALLENGES: LIVING WITH FLOOD
RISK
Moderated by Arrietta Chakos, Principal, Policy Advisor, Urban Resilience Strategies

CITY OF CHARLESTON SEA LEVEL RISE STRATEGY
Mr. Mark Wilbert, Chief Resilience Officer, City of Charleston

Charleston is a world-renowned destination known for its friendly locals, beautiful coastal
setting, thriving culinary scene, rich architecture, and unique history. The city has about
150,000 people in a region of one million people. The region is growing rapidly, with a lot of
newcomers moving into the region.

Many cities along the coast are dealing with three interrelated challenges: affordable housing,
transportation, and flooding. In Charleston, these three challenges are colliding, but the city’s
number one challenge is flooding.

Founded 350 years ago, Charleston is situated on a peninsula along the coast and is built on top
of centuries of fill. Some of the city’s major critical infrastructure and its four major hospitals
are built on top of this fill and are located in areas that flood frequently.

The city is focused on finding solutions that address the threats posed by rising seas, increased
coastal flooding, and extreme weather events. Some efforts include major infrastructure
drainage projects, including check valves,6 and the restoration of 19th century underground
tunnels to manage stormwater (see Figure 1).

           Figure 1. 19th century underground tunnels that manage stormwater in Charleston.

6
 More information about Charleston’s Check Valve Program is available at: “Check Valve Program,” Charleston SC,
Accessed February 3, 2020, https://www.charleston-sc.gov/1995/Check-Valve-Program.

Mitigation Actions and Opportunities to Address Community Flood Risk                               Page 5 of 66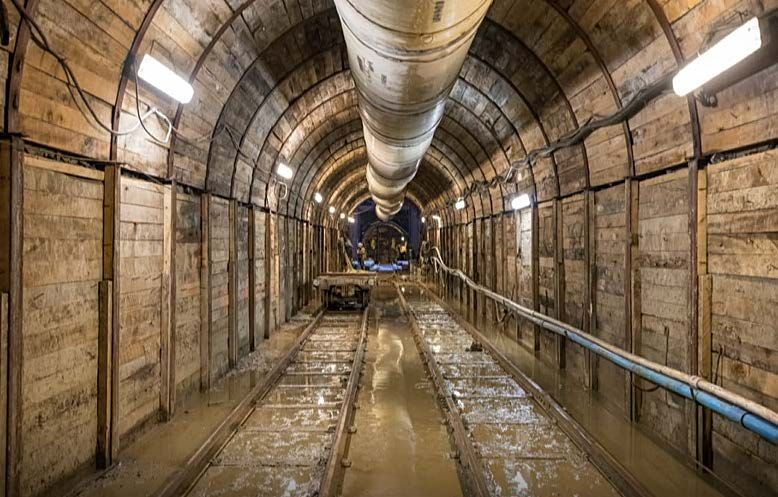
Charleston has numerous flood initiatives underway. The city is focusing significant efforts
toward improving the drainage system. 7 It received a Bloomberg Philanthropies grant to work
on flood adaptation measures. 8 TIDE eye 9 is a web and mobile-friendly tool for keeping an eye
on local Charleston weather and tides, as well as their impact on traffic and road closures. And
Sea Level Rise Viewer 10 is an interactive map that helps users better visualize the lasting
impacts of rising tides. Since 1980, the number of high tides that reached or exceeded 7 feet
has been increasing:
    • 1980s – 9.3 events/year
    • 1990s – 18.8 events/year
    • 2000s – 21.4 events/year
    • 2010s – 41.0 events/year

In 2019, the city experienced over 80 of these high tide events (the previous highest number in
a year was 52 events). Sea level rise is causing regular, high tide, “sunny day” flooding to
become more common in the city.

One challenge Charleston is facing is how to keep its critical infrastructure operational in the
face of frequent flooding. Living with water requires Charleston to make difficult choices and
thoughtful planning decisions, and take bold action. For example, 20 historic homes have been
elevated—this would never have been considered just a few years ago—with over 100
additional historic homes on the list to be raised.

Charleston is providing opportunities for community members to help the city become
resilient. 11 Though local government is committed to addressing flood mitigation and
adaptation, the city is trying to get greater community buy-in. Local residents are becoming
more educated about flooding and how they can better adapt to the increasing frequency of
flood events. Addressing the city’s flood challenges is going to take the entire community.

The City of Charleston’s Flooding and Sea Level Rise Strategy 12 is focused on flood mitigation
and adaptation, and is informed by the latest science-based findings and data from National
Oceanic and Atmospheric Administration (NOAA). The strategy targets long-term solutions
through five critical components (see Figure 2). Land use is one of the biggest challenges of the
future for cities.

7
  “Stormwater Management.” Charleston, SC. Accessed January 31, 2020. https://www.charleston-
sc.gov/2144/Stormwater-Management.
8
  “Tailored Alerts on Tidal Flooding.” Bloomberg Philanthropies. Accessed January 31, 2020.
https://mayorschallenge.bloomberg.org/ideas/charleston/.
9
  “TIDEeye.” Charleston IT/GIS Division. Accessed January 31, 2020. https://gis.charleston-sc.gov/tideeye/.
10
   “Charleston Sea Level Rise Viewer.” Accessed January 31, 2020. https://gis.charleston-sc.gov/interactive/slr/.
11
   “You Can Help!” Charleston SC. Accessed January 31, 2020. https://www.charleston-sc.gov/1978/You-Can-Help.
12
   Charleston, South Carolina. 2019. Flooding and Sea Level Rise Strategy. Second Edition. Accessed January 31,
2020. https://www.charleston-sc.gov/DocumentCenter/View/20299/Flooding-and-Sea-Level-Rise-Strategy-2019-
web-viewing?bidId.

Mitigation Actions and Opportunities to Address Community Flood Risk                                  Page 6 of 66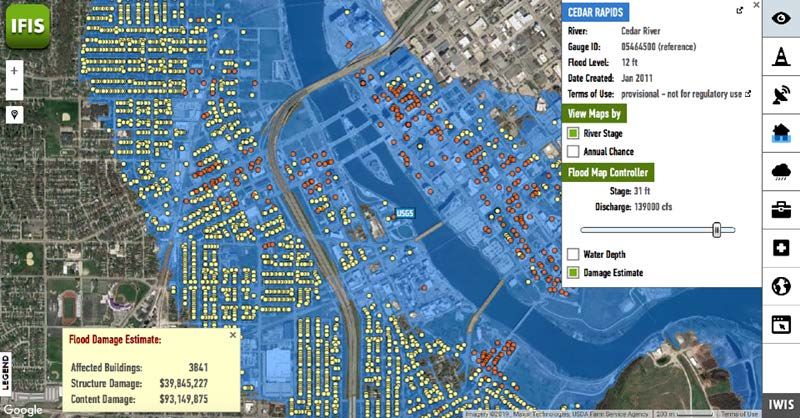
Figure 2. The five critical components of the Charleston Flooding and Sea Level Rise Strategy. 13

Charleston recently completed several planning projects. It participated in the Dutch
Dialogues™ 14 process in 2018 and 2019; 15 the final report Dutch Dialogues™ Charleston 16 was
recently published. This study brought together water experts and Charleston stakeholders to
conceptualize a way for the city to live with water. The study focused on four areas in the city
(see Figure 3) and identified three main challenges:
    1. Increasingly severe and frequent flooding from intense rainfall, rising sea levels, and
        storm surge.
    2. Development pressure in low-lying, risky, and ecologically sensitive areas.
    3. The historic character and identity of the region are threatened by water.

13
   Ibid., p. 3.
14
   “Dutch Dialogues,” Waggonner & Ball, Accessed February 3, 2020, https://wbae.com/projects/dutch_dialogues.
15
   “Dutch Dialogues,” Charleston, SC. Accessed January 31, 2020. https://www.charleston-sc.gov/1974/Dutch-
Dialogues.
16
   Waggonner & Ball, The Water Institute of the Gulf, Kingdom of the Netherlands. Dutch Dialogues™ Charleston.
Accessed January 31, 2020. https://www.dutchdialoguescharleston.org/.

Mitigation Actions and Opportunities to Address Community Flood Risk                               Page 7 of 66
Figure 3. The Dutch Dialogues™ focused on four areas in the City of Charleston. 17

Several recommendations came out of the Dutch Dialogues™ process including:
   • Natural systems matter.
   • Safety first and topography matters: multiple lines of defense, redundancy, risk
       assessments, sustainable inhabitation, multi-benefit infrastructure (green and grey).
   • Preparedness—not reaction; humility—not hubris to reduce risks, impacts, and costs.
   • Adapt development to water systems; avoid adapting water systems to development.
   • Embrace uncertainty. Projects must be adaptable.
   • Property at risk of flooding is a depreciating asset for the owner, the community, and
       the city.
   • Costs come before benefits.

Since 1990, Charleston has spent $235 million on flood mitigation projects. The city is
committed to keeping itself accountable to achieving the initiatives that are outlined in its sea
level rise strategy. Department heads have been put in charge of each of the five critical
components (i.e., infrastructure, governance, resources, land use, and outreach) and are
responsible for reporting on their status along key performance indicators once a month to the
mayor. Progress on each initiative can be tracked online. 18

17
   Image source: Waggonner & Ball, The Water Institute of the Gulf, Kingdom of the Netherlands. Dutch
Dialogues™ Charleston, p. 20. Accessed January 31, 2020. https://www.dutchdialoguescharleston.org/.
18
   “Champions of the Five Critical Components: Track Progress on Our Initiatives!” City of Charleston. Accessed
January 31, 2020. http://bit.ly/TrackOurProgress.

Mitigation Actions and Opportunities to Address Community Flood Risk                                   Page 8 of 66
Charleston’s other recently completed projects include:
• All Hazards Vulnerability & Risk Assessment 19
• Hazard Mitigation Plan 20
• U.S. Army Corps of Engineers Charleston Peninsula Flood Risk Management Study21
• Stormwater Program Management Team and update of the city’s 1984 Master Drainage
and Floodplain Management Plan 22
• Comprehensive Plan 23 update and zoning update
NORFOLK: RESILIENT COASTAL COMMUNITY OF THE FUTURE
Ms. Christine Morris, Resilience Consultant (former Chief Resilience Officer for the City of
Norfolk)
“Resilience is the capacity of individuals, communities and systems to survive, adapt and grow in the
face of stress and shocks and even transform when conditions require it.”
- From 100 Resilient Cities
Creating a resilient Norfolk means reorienting the city toward becoming a coastal community of
the future. The City of Norfolk was part of the Rockefeller 100 Resilient Cities (100RC) program.
24 25 Each 100RC city developed a resilience strategy. Through an extensive community
engagement process, the city identified three main resilience challenges:
1. Coastal resilience (the city faces increasing sea level rise and flood risks)
2. Economic resilience (the city has an overreliance on two industries)
3. Neighborhood resilience (there are concentrations of poverty across the city and
communities are disconnected from one another)
19
“All Hazards Vulnerability & Risk Assessment.” Charleston SC. Accessed January 31, 2020.
https://www.charleston-sc.gov/1975/All-Hazards-Vulnerability-Risk-Assessmen.
20
“Hazard Mitigation Plan.” Charleston SC. Accessed January 31, 2020. https://www.charleston-
sc.gov/1976/Hazard-Mitigation-Plan.
21
“Charleston Peninsula, South Carolina: A Coastal Flood Risk Management Study.” U.S. Army Corps of Engineers.
Accessed January 31, 2020. https://www.sac.usace.army.mil/Missions/Civil-Works/Supplemental-
Funding/Charleston-Peninsula-Study/.
22
“Storm Drainage Mapping,” Charleston, SC, accessed February 3, 2020, https://www.charleston-
sc.gov/1513/Storm-Drainage-Mapping
23
“Comprehensive Plan.” Charleston SC. Accessed January 31, 2020.
https://www.charlestoncounty.org/departments/zoning-planning/comp-plan.php.
24
“About Us,” 100 Resilient Cities, Accessed February 3, 2020, http://www.100resilientcities.org/
25
“Norfolk’s Resilience Challenge.” 100 Resilient Cities. Accessed January 31, 2020.
https://100resilientcities.org/cities/norfolk/.
Mitigation Actions and Opportunities to Address Community Flood Risk Page 9 of 66From these challenges, Norfolk developed three major resilience goals that are highlighted in its
resilience strategy: 26
• Goal 1: Design the coastal community of the future
• Goal 2: Create economic opportunities by advancing efforts to grow existing and new
industry sectors
• Goal 3: Advance initiatives to connect communities, deconcentrate poverty, and
strengthen neighborhoods
To create its coastal community of the future, Norfolk engaged community stakeholders to
develop Vision 2100,27 a strategy to ensure Norfolk’s success as a water-based community into
the future. This strategy identified four areas of the city: economic engines, adaptation areas,
new urban centers, and neighborhoods of the future (see Figure 4). Vision 2100 has been
incorporated into the city’s comprehensive plan 28 to guide land use decisions.
Figure 4. The four key areas of the City of Norfolk.
The city used these four areas to design a resilient zoning ordinance. 29 All development within
the city has to meet a resilience quotient, which is measured on a point system. 30
26
“Office of Resilience: Norfolk Resilient City.” City of Norfolk. Accessed January 31, 2020.
https://www.norfolk.gov/3612/Office-of-Resilience.
27
City of Norfolk. Norfolk Vision 2100. Accessed January 31, 2020.
https://www.norfolk.gov/DocumentCenter/View/27768/Vision-2100---FINAL?bidId=.
28
City of Norfolk. plaNorfolk2030: The General Plan of the City of Norfolk. Accessed January 31, 2020.
https://www.norfolk.gov/DocumentCenter/View/2483/plaNorfolk2030?bidId=.
29
“Norfolk’s Zoning Ordinance.” The City of Norfolk. Accessed January 31, 2020.
https://www.norfolk.gov/3910/Zoning-Ordinance-Rewrite.
30
City of Norfolk. Norfolk’s Zoning Ordinance Executive Summary. Accessed January 31, 2020.
https://www.norfolk.gov/DocumentCenter/View/36605/Zoning-Ordinance-Executive-Summary?bidId=.
Mitigation Actions and Opportunities to Address Community Flood Risk Page 10 of 66In 2014, Norfolk participated in the Dutch Dialogues™ process.31 The city learned that it has to be able to hold the water where it falls; the vision was to create spaces in the city to hold water. One way the city will achieve this is by daylighting its creeks. In 2016, the Commonwealth of Virginia won a $121 million HUD National Disaster Resilience Competition grant; 32 $115 million is going to the Ohio Creek Watershed Project 33 in Norfolk (construction began in December 2019). This project will design a coastal community of the future. For example, every property in certain areas must have a rain barrel, every public space (including the streets and intersections) will be designed to hold water, and the wetlands will be cleaned up so they can hold more water. In 2019, Norfolk received a $30 million HUD Choice Neighborhoods Initiative Implementation grant 34 to fund the city’s St. Paul’s Initiative.35 36 This project will redevelop a public housing area that has about 2,000 units. This area is located at the bottom of a watershed and floods heavily. It is also located across from downtown Norfolk but is completely cut off from the downtown by a six lane road. These neighborhoods will be reconnected to the city and redesigned to handle water (e.g., the creek will be daylighted). The project will also incorporate mixed income housing (one-third at market rate, one-third workforce housing, and one-third highly subsidized housing). Families in St. Paul’s will receive assistance in job training, education, housing, and health and wellness. Families have been given housing choice vouchers (i.e., to stay or leave the neighborhood); 70% of people are opting to leave. Norfolk and Virginia Beach partnered with the U.S. Navy on a joint land use study 37 that focused on sea level rise impacts. This study was recently completed and identified two priority areas impacted by sea level rise: the Chesapeake Bay side and an area around Hampton Roads that accesses the naval station from Norfolk. The city will work with the U.S. Navy to find funding for this project. 31 “Dutch Dialogues.” Hampton VA. Accessed January 31, 2020. https://hampton.gov/3466/Dutch-Dialogues. 32 “Virginia to receive more than $120.5 million from National Disaster Resilience Competition.” 2016. Mark R. Warner. Accessed January 31, 2020. https://www.warner.senate.gov/public/index.cfm/pressreleases?ID=00E5BB28-7149-4D4F-9713-D3295A87D0B3. 33 “Ohio Creek Watershed Project.” The City of Norfolk. Accessed January 31, 2020. https://www.norfolk.gov/3867/Ohio-Creek-Watershed-Project. 34 “Norfolk Awarded $30 Million Choice Neighborhoods Initiative Implementation Grant.” Norfolk Redevelopment Housing Authority. May 13, 2019. http://www.nrha.us/newsandevents/pressreleases/norfolk-awarded-30-million- choice-neighborhoods-initiative-implementatio. 35 “St. Paul’s Initiative.” The City of Norfolk. Accessed January 31, 2020. https://www.norfolk.gov/4379/St-Pauls- Initiative. 36 “St Paul’s Area Transformation.” The City of Norfolk. Accessed January 31, 2020. https://www.stpaulsdistrict.org/. 37 “Norfolk-VA Beach Joint Land Use Study.” Hampton Roads Planning District Commission. Accessed January 31, 2020. https://www.hrpdcva.gov/departments/joint-land-use-studies/norfolk-va-beach-joint-land-use-study/. Mitigation Actions and Opportunities to Address Community Flood Risk Page 11 of 66
Norfolk just completed a U.S. Army Corps of Engineers study. 38 Though the city wanted green
infrastructure, these types of projects do not meet the benefit-cost ratio requirement. The
recommended project includes pumps, floodwalls, tide gates, and a levee.

Norfolk’s Retain Your Rain initiative provides homeowners with an app that calculates how
much rainwater runoff is generated by their house’s roof. 39 The city hosts several kinds of
events to teach people how to manage flooding, for example, how to install rain gardens and
rain barrels. The city also has an entrepreneurial ecosystem initiative that is focused on enticing
companies that have innovations related to flood water retention and flood management to
start businesses in the city.

FINANCING RESILIENCE
Moderated by Dr. Janice Barnes, Founder, Climate Adaptation Partners

Dr. Janice Barnes suggested looking at the problem of flooding differently. When cities put
financing first, the overall approach to solving the problem changes. This is a new way of
thinking about how to pay for flood mitigation. The types of questions asked are different: How
does flooding interrupt city services or revenue? Where does the money come from? How does
that impact my annual budget? Environmental impact bonds are one way to structure this
approach.

INTRODUCTION TO ENVIRONMENTAL IMPACT BONDS
Mr. Benjamin Cohen, Director of Urban and Coastal Resilience, Quantified Ventures

Quantified Ventures40 is an outcomes-based capital firm that drives transformational health,
social, and environmental impact. Outcomes-based financing is repayment on a bond, loan, or
other type of investment based on achievement of environmental, social, or economic
outcomes. It can help make existing funding more efficient because funding is tied to
performance and outcomes of projects. Outcomes-based financing can also tap into a broader
set of beneficiaries (i.e., stakeholders) who have a vested interest in the project’s outcomes.

Local governments find it challenging to fund all their priority projects, and need to find more
and new sources to pay for these projects. At the same time, there is a growing base of ESG
(environmental, social, and governance) investors who want to align their financial returns with
environmental and social returns.

38
   “Norfolk Coastal Storm Risk Management.” US Army Corps of Engineers. March 21, 2018. Accessed January 31,
2020. https://www.nao.usace.army.mil/NCSRM/.
39
   “Retain Your Rain.” The City of Norfolk. Accessed January 31, 2020. https://www.norfolk.gov/3700/Retain-Your-
Rain.
40
   More information about Quantified Ventures is available at: “Home,” Qualified Ventures, Accessed February 3,
2020, https://www.quantifiedventures.com/.

Mitigation Actions and Opportunities to Address Community Flood Risk                               Page 12 of 66
The local government municipal green bond market totaled $25 billion in the first half of 2019.
This was almost twice what it was the first half of 2018. Thus, there is a growing base of impact
capital that can be leveraged by structuring outcomes-based solutions.

Local government should think about its community’s challenges from a systems-based, holistic
view. For example, when considering projects to fund, local government should think about all
the potential stakeholders who could be involved and how to best leverage existing sources of
funding, plans, or initiatives. Identifying a range of stakeholders who could benefit from a
project as well as other initiatives that could be linked to the project are examples of how
environmental impact bonds (EIBs) are innovative and can support a more holistic approach to
project financing.

EIBs are a type of outcomes-based investment. They are municipal bonds that are issued by
local governments, but instead of having a set interest rate, part of the repayment is based on
how successfully the project achieves a predefined environmental, social, or economic outcome
(see Figure 5).

                     Figure 5. High level view of how Quantified Ventures’ EIB works.

There are several benefits of outcomes-based financing such as EIBs (see Box 1). For example, it
transfers performance risk of innovative projects to investors. If a project achieves a higher
than expected performance, investors receive an additional payment; if a project does not
perform as expected, the investors are essentially subsidizing the issuer (i.e., the local
government), taking a risk, and innovating.

Mitigation Actions and Opportunities to Address Community Flood Risk                    Page 13 of 66
Box 1
Benefits of Outcomes-based Financing
• Transfer performance risk of innovative projects to investors
• Access new sources of investment capital
• Showcase partners and their projects, attracting internal and external support
• Engage diverse and new stakeholders benefitting from projects, potentially to contribute
financing for them
• Measure and track outcomes through embedded performance evaluation
• Build an evidence base to inform future project planning
EIBs differ from green bonds in a few key ways. With green bonds, investments do not vary
based on the outcomes, but with EIBs outcome performance is measured and can be tied to
investment terms. In addition, green bonds focus on certification of environmental purposes
under recognized standards whereas EIBs focus on measurement, reporting, and valuation of
an actual environmental benefit produced. A lot of investors want more than investing in a
project that was labeled as a green project; they want to see the actual impacts of their
investments.
Mr. Cohen provided case studies of some of Quantified Ventures EIB projects including green
stormwater infrastructure in Atlanta, 41 coastal wetland restoration in Louisiana, 42 recreation
infrastructure (a bike trail) in Ohio, 43 and wildfire mitigation in Colorado.44
For example, in Atlanta, the EIB project financed six green infrastructure projects in
underserved neighborhoods. These communities are located downstream from the city center
and experience a lot of flooding and water quality challenges. The projects were designed to
help the city manage stormwater, reduce local flooding, alleviate water quality impacts,
increase community access to greenspace, minimize the impact of gentrification, and provide
workforce development opportunities. Quantified Ventures worked with the Atlanta
Department of Watershed Management to identify the different types of benefits that could
come from these projects—to the local neighborhoods, to the Department of Watershed
Management, and to city government—and assign economic value to those benefits; an
economic analysis was undertaken on flood risk reduction and water quality.
Quantified Ventures has been advising the State of Louisiana Coastal Protection and
Restoration Authority on how to use EIB financing to help fill capital gaps for projects in their
Coastal Master Plan. The plan has about $15 billion worth of projects, most are wetlands or
marsh restoration projects along the coast. But the state only has $9 billion to $12 billion of
41
For more information about the Atlanta Green Stormwater Infrastructure Project, visit
https://www.quantifiedventures.com/atlanta-eib.
42
For more information about the Lafourche Parish Wetlands Environmental Impact Bond, visit
https://www.quantifiedventures.com/wetlands-environmental-impact-bond.
43
For more information about the Athens, OH Outdoor Recreation Environmental Impact Bond, visit
https://www.quantifiedventures.com/outdoor-recreation-environmental-impact-bond.
44
For more information about the Southwest Colorado Wildfire Mitigation Environmental Impact Fund, visit
https://www.quantifiedventures.com/wildfire-mitigation-environmental-impact-fund.
Mitigation Actions and Opportunities to Address Community Flood Risk Page 14 of 66publically available funding for these projects (mostly from Deepwater Horizon settlement funds). The EIB project is trying to tap into a broader set of beneficiaries to help pay for these projects (e.g., oil, shipping, and fishing industries), and identify ways these beneficiaries can help finance these projects based on project outcomes they would benefit from. Several of these large companies already have grant programs for coastal and wetland restoration, so part of the planning is to identify how to be more strategic with these funds and instead divert them to support bond financing. EIB financing can also work in rural areas by leveraging payments from other beneficiaries of a project. For example, Quantified Ventures is working with stakeholders in Athens, OH to construct an 88-mile mountain biking trail in a national forest. This area is located in the Appalachian region in one of the poorest parts of Ohio where there is a lot of economic distress. The project is located on U.S. Forest Service (USFS) land, but the USFS cannot finance the project since existing funds are being diverted for wildfires. The project is designed to benefit the local community by helping this area become a destination for mountain bikers all over the country. An outcomes-based approach has enabled multiple stakeholders to come together to help support the financing of this project. The total project cost is about $11 million; $3.6 million will be supported through an EIB that is backed by the City of Athens and Athens County. The remaining funds will be leveraged from the USFS, smaller villages near the trailheads (e.g., they will forego their parking revenue to support payment of the bond), and the mountain biking industry. Project benefits include increased tourism, increased tax revenues, job development, and environmental restoration. In southwest Colorado, Quantified Ventures is supporting a regional wildfire mitigation program around the San Juan National Forest through forest health treatments. Though the USFS conducts wildfire mitigation efforts in the San Juan National Forest, nonfederal lands adjacent to the park boundaries are not being treated and are at high risk for wildfires; thus, the entire region is still at risk. Because the region experienced a wildfire in 2018 and local communities suffered an economic impact, local stakeholders (e.g., city and county governments, electric and water utilities, local tribes) recognize the importance of this project. Rather than an EIB, this project will create an environmental impact fund (EIF). The EIF is issued to capitalize a fund that will disperse revolving loans to pay for forest health treatments. These loans will be repaid by local entities based on the risk reduction outcomes of the project. Thus, money will recycle back into the fund and provide an ongoing source of capital to fund these types of forest treatments into perpetuity and potentially expand to other areas of the region where needed. EIFs are a way to create self-sustaining funds. Mitigation Actions and Opportunities to Address Community Flood Risk Page 15 of 66
PANEL 2 – USING SCIENCE AND DATA TO INFORM DECISION-MAKING
Moderated by Dr. Lauren Alexander Augustine, Executive Director, Gulf Research Program,
  National Academies of Sciences, Engineering, and Medicine

A VISION FOR A MORE RESILIENT IOWA: THE IOWA WATERSHED APPROACH
Dr. Larry Weber, Professor, Civil and Environmental Engineering and Edwin B. Green Chair in
   Hydraulics, University of Iowa

Formed in 2009, the purpose of the Iowa Flood Center 45 (IFC) is to give Iowans access to the
latest technology and resources to help them prepare for floods and become more resilient.
The IFC does this through a number of activities, including providing accurate, science-based
information to help Iowans better understand flood risks; developing hydrologic models for
physically-based frequency estimates and real-time flood forecasting; establishing community
programs to improve flood monitoring; developing strategies to mitigate and prevent future
flood damage; and developing Iowa’s workforce in flood-related fields.

In addition to the 140 USGS sensors, the IFC has deployed over 250 stream sensors across the
state that monitor river levels every 15 minutes. One hundred more sensors have been
requested. The IFC also deployed 20 hydrologic stations that measure rainfall, soil moisture,
and soil temperature.46 Though the National Weather Service provides forecasting at about 100
locations throughout the state, the IFC runs its own streamflow forecast model—a real-time,
spatially explicit, hydrologic model that describes Iowa as 600,000 hillslopes and stream
segments. Thus, the IFC calculates streamflow at 600,000 locations with a 10-minute update
based on Next Generation Weather Radar (NEXRAD) 47 rainfall estimates.

One way the IFC provides accurate, science-based information is through the Iowa Flood
Information System 48 (IFIS) (see Figure 6). The IFIS is a web-platform to access community-
based flood conditions, forecasts, visualizations, community inundation maps (see Figure 7),
and flood-related information and applications. IFIS is open to the public and widely used by
residents, business owners, emergency managers, and other state and federal agencies
responsible for flood-related programs.

45
   More information about the Iowa Flood Center is available at https://iowafloodcenter.org/.
46
   Sara Steussy, May 22, 2013. “Iowa Flood Center Deploys Rain Gauges,” Iowa Flood Center, Accessed February
12, 2020, https://iowafloodcenter.org/iowa-flood-center-deploys-rain-gauges/.
47
   More information about NEXRAD is available at: “NEXRAD Products,” NOAA’s NCEI, Accessed February 3, 2020,
https://www.ncdc.noaa.gov/data-access/radar-data/nexrad-products.
48
   More information about the Iowa Flood Information System is available at http://ifis.iowafloodcenter.org/ifis/.

Mitigation Actions and Opportunities to Address Community Flood Risk                                  Page 16 of 66
Figure 6. Homepage of the Iowa Flood Information System (http://ifis.iowafloodcenter.org/ifis/).

              Figure 7. Example of a community flood scenario map for damage estimates.

Mitigation Actions and Opportunities to Address Community Flood Risk                       Page 17 of 66
Data from the IFIS was leveraged by the State of Iowa and the Iowa Economic Development Authority in their grant application for the National Disaster Resilience Competition (2016 – 2021), for which they were awarded over $96 million for the Iowa Watershed Approach 49 (IWA) program, of which $40 million will support the design and construction of urban flood mitigation projects and another $40 million will support the design and construction of conservation practices (e.g., wetlands, ponds, storm water detention, re-connected floodplains) on rural private lands for the benefit of communities downstream. The IWA has about 600 projects under design. The IWA program hosts its own information system, which joins water quantity and quality measurements to inform decisions on best management practices and community flood resilience. Other Resources − Iowa Water Quality Information System 50 (IWQIS) − Iowa Nutrient Center 51 VALIDATING OPERATIONAL FLOOD FORECAST HYDRO MODELS USING SENSORS AND CITIZEN SCIENCE Dr. Jon Derek Loftis, Assistant Research Scientist, Lead, StormSense Project, Virginia Institute of Marine Science Sponsored by the Virginia Institute of Marine Science (VIMS), 52 the StormSense 53 Project works to advance the field of emergency preparedness by providing forecast flooding from storm surge, rain, and tides to the public. In order to collect data for forecast flooding, over 40 water level sensors have been installed in Newport News, Norfolk, and Virginia Beach, VA, as well as the lower Chesapeake Bay. Each sensor transmits data on water conditions to the StormSense cloud via the Internet of Things (IoT),54 instead of satellite uplink or mobile broadband. As a result, datasets are transmitted not only at a faster rate, but also at a lower cost. StormSense sensors cost approximately $3,000 in comparison to USGS sensors, which cost about $33,000. To test their accuracy, some StormSense ultrasonic sensors (sound-based measurement) were co-located with USGS radar sensors (electromagnetic wave-based measurement). Over a period of twelve months, data collected by four separate StormSense sensors were compared with data collected from their corresponding USGS sensors. On average, the relative difference between the two different types of sensors (i.e., ultrasonic versus radar) was 1.18 cm. 49 More information about the Iowa Watershed Approach is available at https://iowawatershedapproach.org/. 50 More information about the Iowa Water Quality Information System is available at https://iwqis.iowawis.org/. 51 More information about the Iowa Nutrient Center is available at https://www.cals.iastate.edu/inrc/. 52 “Homepage,” VIMS, Accessed February 3, 2020, https://www.vims.edu/ 53 More information about StormSense is available at https://www.vims.edu/people/loftis_jd/StormSense/index.php. 54 The Internet of things (IoT) is “a system of interrelated computing devices, mechanical and digital machines, objects, animals or people that are provided with unique identifiers (UIDs) and the ability to transfer data over a network without requiring human-to-human or human-to-computer interaction.” “Internet of things,” Wikipedia 2020, last updates February 1, 2020, Accessed February 3, 2020, https://en.wikipedia.org/wiki/Internet_of_things. Mitigation Actions and Opportunities to Address Community Flood Risk Page 18 of 66
Funding for sensors was made possible through a combination of grants and local capital
improvement programs. Grant awards totaling $284,000 were used to purchase sensors;
whereas, CIP budgets paid $337,500 to install and maintain them.

VIMS integrated StormSense’s measurements into Tidewatch Charts 55(a 36-hour tidal
forecasting system), which is translated into the Tidewatch Forecast Map. 56 Forecast efforts of
the StormSense Project go beyond fluvial systems to take into account the multi-directional
flow from tides and storm surge that compound the flooding impacts of rainfall. Instead of
using hydrologic transport models, Tidewatch forecasts are driven by a hydro-dynamic model
called SCHISM 57 (Semi-implicit Cross-scale Hydroscience Integrated System Model). Tidewatch
Map covers all the coastal ocean along with the Gulf of Mexico since many of Virginia’s
substantial flood events and wind events have come from the Gulf. It incorporates atmospheric
data, surge data, building elevations, sea level rise, and land subsidence. Tidewatch Map ingests
2.4 GB of atmospheric data (e.g., wind direction, wind magnitude, and relative air pressure
fluctuations) at 3-km spatial resolution and 1-hour temporal resolution to predict storm surge-
induced flooding through coastal Virginia up to 36 hours in advance. Each 36-hour run takes
1.25 hours using a high performance computing platform and an additional three hours to
process the data for web display.

Tidewatch models were validated using citizen science. Using social media and the Sea-Level
Rise app, citizens captured and shared photos of flooding conditions (i.e., geospatial data).
Geospatial data were then input into a GIS database and converted into contours so that it
could be compared to the Tidewatch models for vertical and horizontal accuracy. The
forecasted models compared well with citizen science geospatial data (horizontal accuracy), as
well as StormSense sensor data (vertical accuracy).

Citizens can subscribe to the StormSense Project to receive SMS, emails, and/or text alerts
when water levels reach a pre-established, critical threshold. In this way, project data can help
the public make more informed decisions related to flood preparedness.

Other Resources
   − Embracing the Salt and Adapting to Sea Level Rise 58
   − Reporters, Scientists, and Citizens Team to Map Virginia’s Highest Tide 59

55
   More information about Tidewatch Charts is available at https://www.vims.edu/bayinfo/tidewatch/index.php.
56
   More information about the Tidewatch Forecast Map is available at
http://cmap2.vims.edu/SCHISM/TidewatchViewer.html.
57
   More information about SCHISM is available at http://ccrm.vims.edu/schismweb/.
58
   “Embracing The Salt And Adapting To Sea Level Rise,” Science Friday, May 17, 2019, Accessed February 12, 2020,
https://www.sciencefriday.com/segments/embracing-the-salt-and-adapting-to-sea-level-rise/.
59
   Wright, D. December 13, 2017. “Reporters, Scientists, and Citizens Team to Map Virginia’s Highest Tide.” Esri.
https://www.esri.com/about/newsroom/blog/mapping-virginias-highest-tide/.

Mitigation Actions and Opportunities to Address Community Flood Risk                                Page 19 of 66
− National Disaster Resilience Competition 60
     − King Tides: Using an app to measure rising sea levels 61

OPEN-STORM
Dr. Brandon P. Wong, Postdoctoral Research Fellow, Department of Civil and Environmental
   Engineering, University of Michigan

The State of Michigan faces several water-related challenges from impaired water quality (e.g.,
polluted stormwater runoff, combined sewer overflows, and extreme riverbank erosion) to
severe flooding. When Detroit flooded in 2014, it was the most expensive flood event that year,
totaling over $1 billion in damages. Despite being one of the most intense rainfalls on record,
the areas that were most impacted were located outside the 100-year floodplain. 62 Our
understanding of localized flooding in urbanized areas stands to be improved by data. Today,
the USGS maintains the largest monitoring network nationwide and serves as the gold standard
for collecting consistent and reliable flood-related data. However, despite the network of over
8,000 USGS river and stream gages across the country, some communities and counties do not
have enough gages to monitor water levels, especially in urbanized areas where river and
stream gages may not always be nearby.

Started by Professor Branko Kerkez and the Real-Time Water Systems Lab 63 at the University of
Michigan, Open-Storm 64 is an open-source platform for real-time monitoring and control of
urban watersheds. 65 Open-Storm serves as a blueprint to measure and control urban water
systems in real-time using a variety of sensors placed in community-identified, flood-prone
areas in the Great Lakes region. For example, the Open-Storm platform combines online
weather forecasts with wireless sensors to detect the rise and fall of water levels in stormwater
basins and to automatically activate the valves of each basin to collectively optimize the storage
and treatment capacities of the watershed as a whole (see Figure 8).

60
   “National Disaster Resilience,” HUD Exchange, Accessed February 3, 2020,
https://www.hudexchange.info/programs/cdbg-dr/resilient-recovery/
61
   “King Tides: Using an app to measure rising sea levels,” CBS This Morning, January 4, 2020, Accessed February
12, 2020, https://www.youtube.com/watch?time_continue=5&v=CTZKK1jM2i8&feature=emb_logo.
62
   For more information about the 2014 Detroit flood, see: “Story to remember, 2014: August flooding in metro
Detroit,” Crain’s Detroit Business, December 2014, Accessed February 3, 2020,
https://www.crainsdetroit.com/article/20141222/NEWS/141229993/aftermath-of-august-flooding-10-billion-
gallons-of-sewer-overflows.
63
   More information about the Real-Time Water Systems Lab is available at: “Home,” Real-Time Water Systems
Lab,” Accessed January 29, 2020, http://www-personal.umich.edu/~bkerkez/.
64
   “About,” Open-Storm, Accessed January 29, 2020, http://open-storm.org/.
65
   Matthew Bartos, Brandon Wong, and Branko Kerkez, 2018. “Open storm: a complete framework for sensing and
control of urban watershed.” Environmental Science: Water Research & Technology, 4(3):346-358.
https://doi.org/10.1039/C7EW00374A.

Mitigation Actions and Opportunities to Address Community Flood Risk                               Page 20 of 66
Figure 8. A graphic that depicts the variety of smart sensors and their uses in the Open-Storm project.
The technologies that underpin Open-Storm follow an “Internet of Things” approach. The same
electronics found in today’s smart phones are combined with solar panels, a variety of sensors,
and weather forecasts to deliver data to the web instantaneously. Data streams can then be
pushed to devices like smart phones in real-time, enabling on-the-ground decision making. For
example, automatic flood alerts can help emergency responders coordinate where to go during
flood events and determine what resources are required (see Figure 9).
Figure 9. Automatic flood alert data displayed on a smart phone.
Mitigation Actions and Opportunities to Address Community Flood Risk Page 21 of 66Last summer, the Real-Time Water Systems Lab received funding from the state to pursue
instrumenting over an additional 750 square miles. Leveraging the lessons learned and the
technologies developed through Open-Storm, a small team of students and county engineers
installed fifty sensors at critical locations that were identified by community members and
watershed managers (see Figure 10). This high-resolution data enables watershed managers to
see how storm runoff pulses throughout the watershed and adapt their management strategies
accordingly.
Figure 10. The locations of Open-Storm sensors (left); a screenshot of the water level at each sensor
during a rainstorm (right).
In combination with the network of USGS gages along streams and rivers, Open-Storm
technologies are helpful in monitoring local flood risk in urbanized areas like parking lots and
commercial centers. The team behind Open-Storm is also broadening out to the regional scale
to conduct pilot programs in areas such as upstate New York and northern Ohio to explore how
these technologies might benefit local communities throughout the Great Lakes.
USING SCIENCE AND DATA TO INFORM DECISION MAKING
Dr. Jeffrey Warren, North Carolina Policy Collaboratory, University of North Carolina, Chapel Hill
The North Carolina Policy Collaboratory66 is an environmental research collaborative that was
established by the state legislature to conduct research on natural resources management and
provide policy recommendations to the North Carolina General Assembly. The Collaboratory is
a statewide initiative that outsources to and manages the policy and research initiatives of the
66
More information about the Collaboratory is available at: “About,” The North Carolina Policy Collaboratory,
Accessed January 29, 2020, https://collaboratory.unc.edu/about/.
Mitigation Actions and Opportunities to Address Community Flood Risk Page 22 of 66You can also read