An Analysis of Homelessness & Affordable Housing Multnomah County, 2018 - Oregon Harbor of Hope
←
→
Page content transcription
If your browser does not render page correctly, please read the page content below
An Analysis of
Homelessness & Affordable Housing
    Multnomah County, 2018

                          Prepared for
              Oregon Harbor of Hope

      School of Business MBA Capstone Project
                      (Revised July 31, 2018)

                       Capstone Team:
 Jessica Chanay, Nishant Desai, Yuxuan Luo, Davaadorj Purvee
Table of Contents
Acknowledgements ..................................................................................................................................... 1
Executive Summary..................................................................................................................................... 2
Introduction ................................................................................................................................................. 3
   How did Homelessness get so Bad? A Brief History ........................................................................... 4
Homelessness in Multnomah County........................................................................................................ 5
   An Overview of the Point in Time Count .............................................................................................. 5
   Cost of Homelessness: Human Impact ................................................................................................. 8
   Cost of Homelessness: For Communities ............................................................................................. 9
   Cost of Homelessness: In Dollars .......................................................................................................... 9
Economic Forces at Work ........................................................................................................................ 10
   Future Trends & Economic Outlook................................................................................................... 13
Affordable Housing Crisis Worsens ......................................................................................................... 14
Market Forces Alone Won’t Solve this Problem ...................................................................................... 18
   Case Study .............................................................................................................................................. 21
Recommendations..................................................................................................................................... 23
   1.      Reduce Barriers to Affordable Housing Development ............................................................... 23
   2.      Improve Accuracy of Homeless Count and Include Future Projections .................................. 23
   3.      Develop a Model to Estimate the Full Cost of Homelessness ................................................... 24
   4.      Promote Home-Sharing among Baby Boomers and Retirees ................................................... 24
Conclusion ................................................................................................................................................. 25
References .................................................................................................................................................. 26
Appendices................................................................................................................................................. 32
   International Research .......................................................................................................................... 44

Acknowledgements

The Portland State University School of Business Capstone Team would like to thank the following
individuals for generously sharing their time and for helping us think critically about the issues of
homelessness and the lack of affordable housing in Portland and Multnomah County.

                 Cliff Allen                                          Bobby Lee
                 Alexandra Appleton                                   Sheila Martin
                 David Bangsberg                                      Ed McNamara
                 Michael Buonocore                                    Sharon Nielson
                 Jamey Duhamel                                        Tony Salvador
                 Will Harris                                          Bandana Shrestha
                 Sean Hubert                                          Catherine Suchs
                 Marc Jolin                                           Greg Townley
                 Rob Justus                                           Staff at Dignity Village
                 Phil Keisling                                        Marisa Zapata
                 Uma Krishnan

Special thanks to our advisor, Josh Hinerfeld, for his support and encouragement throughout the project, and
for helping us strive for excellence.

Gratitude goes to Oregon Harbor of Hope and to our client contact, Don Mazziotti, for providing our team
with this capstone project. It has been a unique opportunity to better understand a critical issue that is
significantly impacting community health. We hope our research adds value to the ongoing and evolving
conversation about homelessness and the need for affordable housing in Multnomah County.

An Analysis of Homelessness & Affordable Housing in Multnomah County 2018 (Revised July 31, 2018)            1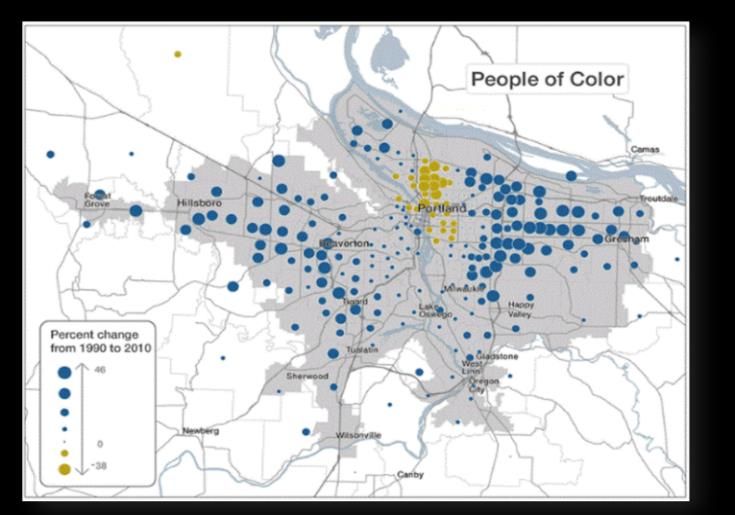
Executive Summary

The current homeless crisis has been in the making for decades.
Macroeconomic changes, deinstitutionalization, and massive cuts to
public housing during the 1970s and 1980s laid the groundwork for
growing numbers of homeless people. The housing crisis during the
Great Recession worsened the situation significantly and in 2015 the
City of Portland declared a state of emergency.
Homelessness affects entire communities.
                                                                                     Recommendations
Homelessness takes a huge toll on the health and wellbeing of
individuals and families and can have a detrimental effect on                    •    Reduce barriers to
neighborhoods and businesses. A full accounting of the cost of                        affordable housing
homelessness in dollars is unknown, affecting the community’s ability                 development
to fully evaluate current investments and plan for the future.
                                                                                 •    Improve the accuracy
The number of people experiencing homelessness is unknown.                            of the homeless count
The Point-in-Time Street Count provides a snapshot of homelessness               •    Conduct a cost of
on one night every other year, leaving out thousands of people who                    homelessness study for
are doubled-up with family and friends or in hospitals or jails.                      Multnomah County
Multnomah County lacks 29,000 units of affordable housing.                       •    Promote home-sharing
                                                                                      among baby boomers
Multnomah County has a shortfall of 29,000 units of affordable                        and retirees
housing for households earning 50% or below of the area median
income. These families are housing burdened, often spending more
than half their income on rent.
Macroeconomic forces contributed to the current housing and homeless crisis.
Several factors have contributed to the affordable housing shortage starting with an influx of
newcomers attracted to higher paying jobs as the economy recovered after the Great Recession.
Limited housing units drove up home prices and rents, pricing many people out of their own
neighborhoods. Stagnant wages did not keep up with the cost of living, forcing many to choose
between paying for housing, food, and healthcare. Some populations have been disproportionately
affected, including people of color, seniors, and people with disabilities. The situation could worsen
as advances in technology potentially eliminate thousands of jobs that low-wage earners rely upon.
Structural barriers can impede the scaling of affordable housing construction.
Building affordable housing can be a juggling act as developers reconcile low revenues with high
construction and maintenance costs, compliance issues, and limited land for development.
Assembling a financing package can be difficult and time-consuming. A case study in this report
shows how one private developer is navigating these challenges in Multnomah County.

An Analysis of Homelessness & Affordable Housing in Multnomah County 2018 (Revised July 31, 2018)          2
Introduction
The community of Multnomah County is experiencing a homeless and housing crisis. Thousands of people
live in temporary shelters or outside, and there is a deficit of more than 29,000 units of affordable housing. A
confluence of factors has contributed to this situation, including a high influx of newcomers as the economy
improved after the Great Recession, coupled with lagging home construction rates. As more people with
higher wages competed for scarce housing units, rents rapidly increased and thousands of low-income
residents became “housing burdened.” Many people doubled-up with family and friends, and thousands
asked for help from government and nonprofit service providers. However, resources were limited, and as
evictions increased, some ended up homeless. The situation was so acute that in 2015 a “housing emergency”
was declared in Portland. The declaration was renewed in 2016 and 2017 as community leaders continued to
grapple with these issues.

Oregon Harbor of Hope, a nonprofit organization formed to “create safe harbors and a path to stability for
Oregon’s homeless population,” approached the Portland State University (PSU) School of Business to
research the issues and help articulate the challenges surrounding this crisis. Since this is one of the biggest
problems the region has faced, many people and groups from the public, nonprofit, and private sectors are
focused on it. This report is not intended to duplicate these efforts, but to contribute to the community
conversation by highlighting a few key issues and drawing attention to demographic and economic changes
that could exacerbate these problems if not addressed.

                                Research Design and Geographic Focus

Over the course of six months (Jan. – Jun. 2018), a PSU School of Business Capstone Team (“Team”)
reviewed a diversity of reports and articles and interviewed 20+ people to gain a broader understanding about
homelessness and affordable housing needs in this region and elsewhere. The intent was to understand how
the issues have emerged and changed over the years. The Team utilized the Stages of Homelessness and
Housing Continuum Framework (see below) to help understand how and why people become homeless and
to consider ideas for potential interventions.
                                              Framework
                            Stages of Homelessness & Continuum of Housing

The geographic focus of this report is primarily Multnomah County. Data from the City of Portland and
wider Metro Region were used when County data were unavailable or to further explain the issues.

Understanding the extent and nature of these problems is important for aligning efforts and cultivating the
resources needed to address these issues on a much larger scale. Part I of this report provides a general
overview of homelessness, how it is measured, who experiences it, and the cost to individuals and communities.
Part II provides an overview of a few economic challenges as contributing factors. Part III describes how the
issues have worsened over time and highlights several populations who are disproportionately impacted. Part
IV delves into some of the challenges developers face when building affordable housing units and examines a
case study. Appendix J provides an international perspective, examining how several countries are facing the
same issues. Several recommendations are provided for consideration at the end of the report.
An Analysis of Homelessness & Affordable Housing in Multnomah County 2018 (Revised July 31, 2018)            3
How did Homelessness get so Bad? A Brief History

Several macro factors contributed to the current homeless crisis1 starting with deinstitutionalization efforts in
the 1950s and 1960s. The goal was to treat people with mental health challenges more humanely and to
reduce costs; however, it left many people with few options for housing. There were 558,000 people in
mental health hospitals in 1955 but just 60,000 in 1998.2 Community-based mental health centers were
intended to take the place of institutions but did not materialize at the level needed. Without adequate care,
thousands ended up homeless or in jail. Nationwide, an estimated 33% of homeless people and 16% of
inmates have a severe mental illness.3

Prior to the 1960s, America had a thriving middle class when one parent could work full time as a teacher or
manufacturer and earn a sufficient income that would cover household expenses. During the 1970s, the
economy began to change in ways that gradually eroded middle-income employment and led to a growing
number of low wage jobs, mainly in the service and retail industry.4 5 6

During the 1970s, public housing prevented many people from becoming homeless by helping them bridge
the gap between low wages and the cost of living. However, political and ideological changes during the
1970s and 1980s led to the removal of 4.5 million affordable housing units through demolition or
conversion.7,8 Section 8 rental subsidies were designed to replace public housing projects but were not
funded sufficiently to address the growing need. The efforts of local governments, nonprofits, and religious
organizations have been insufficient in the face of such a large problem. As a result, homelessness has
become ubiquitous in communities across the U.S.

                                The Great Recession and its Aftermath

Throughout the 1990s and early 2000s, homelessness was a growing problem; however, the Great Recession
worsened the situation significantly. An estimated 3.2 million jobs were eliminated9 and 1.2 million homes
foreclosed upon10 between 2007 – 2009; millions more were lost during the post-recessionary period. More
homeowners became renters, driving vacancy rates downward. As the economy began to recover, housing
affordability became a bigger concern as popular places like Portland, Seattle, and San Francisco attracted
newcomers with high incomes. Competition heated up for scarce rental units, contributing to double-digit
rent increases. Low wage workers struggled the most, spending well over 30% of their income on housing.
                            2015: Portland Declares a State of Emergency
In Portland, the crisis became acute after rents spiked with double-digit increases between 2011 and 2015.
Evictions increased as apartment owners sold buildings to investors and landlords sought renters with higher
incomes.11 Those with few options or family supports became homeless. With more people living on the
streets than in shelters, the City of Portland declared a State of Emergency in 2015. The declaration allowed
the City to do several things: 1). expedite permitting and siting of homeless shelters and affordable housing
units, 2). waive certain procurement processes, zoning, and building codes, and, 3) assess the barriers that
might be preventing people from moving from homelessness into housing.12 The Joint Office of Homeless
Services was also created during this time to help coordinate homeless services in the City of Portland,
Gresham, and Multnomah County.
                        New Challenges Contributing to Housing Instability
The U.S. has a substantial aging population with about 3.5 million people reaching age 65 per year. More than
40% have a household income of less than $14,000/year.13 In 2017, the average monthly Social Security
check in Oregon was about $1,300/mo.,14 yet it is difficult to find a rental unit under $1,000/mo. in
Multnomah County. Workers over 55 did not grow up with computer technology, putting many at a
competitive disadvantage in today’s tech-dependent economy. Many will need to work later in life due to low
retirement savings and higher debt than previous generations. On a per capita basis, debt among retirees 65
and older increased by 48% between 2003 and 2015.15

An Analysis of Homelessness & Affordable Housing in Multnomah County 2018 (Revised July 31, 2018)               4
Homelessness in Multnomah County
Addressing homelessness requires an understanding of how many people are experiencing it, their living
situations and demographic characteristics. Knowing how the problem is emerging and changing over time
allows communities to assess progress and plan for the future. The following section draws highlights from
the Point in Time (PIT) Count of homeless people in Multnomah County. It includes those who were living
in shelters, transitional housing, and outdoor spaces not intended for human habitation during one night in
February 2017. The study is a snapshot; thus, is not a comprehensive measurement of homelessness in
Multnomah County, although it does provide some insight into what some people are experiencing. The PIT
methodology is considered in the next section.

                                  An Overview of the Point in Time Count
The federal Housing and Urban Development (HUD) department operates the national Continuum of Care
program (CoC)16 that is designed to support communities in the goal of ending homelessness. HUD requires
CoC participants to use a specific methodology that provides a snapshot of the number of homeless people
who are staying in emergency shelters, transitional housing, and places not meant for human habitation,
collectively known as the “HUD-Homeless.” The PIT Count is conducted on a specific night in January and
includes two types of counts during alternating years: On even-numbered years, the count includes homeless
people who are residing in emergency shelters, transitional housing, and Safe Havens.17 During odd-
numbered years, a more comprehensive count is conducted to include unsheltered families and individuals,
aka the “Street Count.”18

PIT Count data serves several purposes: It allows communities in Oregon to maintain eligibility for state and
federal funding19 and is used by service providers to assess progress. Local governments use the data to
inform policy and planning efforts, allocate resources, and increase awareness about homelessness.
Nationwide, PIT Counts are compiled in the Annual Homeless Assessment Report (AHAR) to Congress.20
The most recent PIT Count in Multnomah County that included both sheltered and unsheltered homeless
people was conducted winter 2017.
                                               Figure 1:
                             Number of Homeless People in Multnomah County
                                         PIT Count 2009-2017
         5,000                      4,655          4,441
                    4,145                                                           4,177
         4,000                                                     3,801
                                     1,928           1,572                           757
                     1,690                                           1,042
         3,000                                                                                         Transitional housing
                                                      974                           1,752
                                     1,009                            872
         2,000        864                                                                              Emergency shelter
                                                                                                       Unsheltered
         1,000       1,591           1,718           1,895           1,887          1,668

            -
                    2009            2011            2013            2015            2017
                  Source: PSU 2017 Point-In-Time Count of Homelessness in Portland/Gresham/Multnomah County

According to the 2017 Point-In-Time Count, there were 4,177 homeless people in Portland, Gresham, and
Multnomah County, a 9.9% increase over the 2015 report. Figure 1 shows the number of homeless people
increased after the Great Recession but declined as the economy improved. However, the numbers appear to
be increasing again. Two notable improvements over the last report include the number of homeless people
who were unsheltered decreased by 11.6% from 2015 to the lowest amount since 2009, and the number of
homeless people accessing shelters increased by 31%.
An Analysis of Homelessness & Affordable Housing in Multnomah County 2018 (Revised July 31, 2018)                             5
People with disabilities: In 2017, nearly two out of three homeless people (60.5%) in Multnomah County
had one or more disabling conditions such as a mental illness, chronic physical condition, or substance-use
disorder. This represents a 16.1% increase over the 2015 report.21 The percentage was higher among those
who were unsheltered (71.6%) or living in transitional housing (67.1%) and lower among those staying in
emergency shelters (47.0%).

Having a disability and being unsheltered can be particularly difficult. Table 1 shows the percentages and
types of disabilities among those who were unsheltered in 2017.22 Nearly half of those who were unsheltered
had a serious mental illness and about one out of three had a physical disability. Another third had a
substance use disorder. Percentages do not add up to 100% because some people had multiple disabilities.
There is a relationship between mental illness and homelessness. Having a mental illness can contribute to
homelessness such as when symptoms affect a person’s ability to maintain employment. The experience of
being homeless itself can be traumatic enough to cause mental illnesses such as PTSD and depression.23
                                               Table 1
                          Disabling Conditions Among Unsheltered Homeless
                                      Multnomah County, 2017
                        Unsheltered: Disabling Conditions                                   Percentage
                        Adults with serious mental illness                                            44.8%
                        Physical disability                                                           38.0%
                        Adults with a substance use disorder                                          37.5%
                        Chronic health condition                                                      26.3%
                        Developmental disability                                                       7.8%
                        Adults with HIV/AIDS                                                           1.4%
                      Source: PSU 2017 Point-In-Time Count of Homelessness in Portland/Gresham/Multnomah County

Domestic violence: Domestic violence (DV) survivors often turn to homeless service providers when
fleeing a DV situation.24 One out of three homeless people (33.7% or 1,261 people) who was 18 years or
older reported experiencing domestic violence in a current or past relationship during the 2017 PIT Count in
Multnomah County. Women reporting higher rates (54.8%).25 Among the unsheltered population, the
numbers were higher. Nearly half (46.6%) of adults reported experiencing domestic violence at some point
and about one in five (21.0%) was fleeing a domestic violence situation on the night of the count.26

Gender: Gender differences among the homeless have been narrowing over the years. Figure 2 shows that
about 37% of the homeless population in Multnomah County was female in 2017, up from 26% in 2009.
                                                Figure 2
                            Gender Distribution Among Homeless Population
                                    Multnomah County, 2009 - 2017
                           72%
                                         62%            61%           64%            60%
                                                                                                       Male
                                         37%            38%           36%            37%
                                                                                                       Female
                           26%

                           2009          2011          2013           2015          2017
                               Source: Point-In-Time Count of Homelessness in Multnomah County, 2009 - 2017

The number of transgender people who are homeless has been increasing in Multnomah County. In 2017, 44
transgender people were homeless compared to 20 people in 2015. Although they represent a small fraction
of the overall count (1.1%), the increase could be a trend. According to a survey conducted by the National
An Analysis of Homelessness & Affordable Housing in Multnomah County 2018 (Revised July 31, 2018)           6
Center for Transgender Equality, one in ten transgender people who came out to immediate family members
reported experiencing violence and 8% were kicked out. About one-third (30%) had been homeless at some
point in their life with 12% being homeless during the year prior to taking the survey.27

Age: The average age of the homeless in Multnomah County was 40 years in 2017.28 Those who were
between 25-44 years made up the largest single group of the homeless population at 39.2%, followed by 45-
54 years (22.9%). The 2017 Point in Time report revealed a 46.7% jump in homelessness among people 55
years and older between 2015 and 2017. Although it was a relatively small number (14 people) it could be a
trend. The National Homeless Research Center estimated that homeless people over 62 would double
between 2010-2050.29 According to Dr. Margot Kushel at the University of California San Francisco, people
who are homeless are aging faster than the general population, and those born during the second half of the
baby boom (1955-1964) have an increased risk of homelessness when compared to other age groups.30 See
page 18 for more information about the housing burden among senior citizens and retirees.

Children under 18 decreased as a percentage of homeless people in the PIT Count in Multnomah County,
which could be due to a concerted effort among local government and service providers to prioritize shelter
beds for families with children.31 In 2015, there were 374 (9.8%) children and youth under 18 years compared
to 382 (9.1%) in 2017.32

People of color: People of color were disproportionately represented in the PIT Count: 36.5% of the
homeless population was a person of color compared to 28.7% in Multnomah County. See page 17 for more
information about disproportionality among people of color who are housing burdened.

Chronically homeless: About one out of three (31%) homeless people in Multnomah County were
considered “chronically homeless” in 2017 (1,290 people). According to the HUD definition, a chronically
homeless person has been living in a place not meant for human habitation, a Safe Haven, or emergency
shelter for at least 1 year or on at least four separate occasions over the last 3 years that cumulatively add up
to 1 year, and can be diagnosed with one or more of the following conditions: substance use disorder, serious
mental illness, developmental disability, post-traumatic stress disorder, cognitive impairments resulting from
brain injury, or chronic physical illness or disability.33 See Appendix A for more details.

There was a 24.9% increase in the number of chronically homeless people in Multnomah County in 2017
compared to 2015 (257 additional people), and they represented slightly more than half (55.0%) of those who
were unsheltered on the night of the count; however, a significantly higher percentage of them were staying in
emergency shelters compared to 2015 (136.1% increase).

                      Point-In-Time Count Leaves Out Thousands of People
The PIT Count is helpful for providing a baseline that can be evaluated over time; however, it also has
significant shortcomings. The homeless street count is a snapshot conducted on a specific night every other
year, thus it is likely to miss some homeless people. The 2017 PIT report acknowledges the shortcomings of
the HUD methodology by listing populations who were not be included, such as those who are sleeping in
hard to reach or unknown locations, those with language barriers or who refuse to participate, those who may
not be using mainstream homeless services, and people who are doubled-up with friends and family.34

Section 4 of the Multnomah County PIT report attempts to account for a portion of those who were not
counted by including an estimate of the number people likely to be “doubled up” (i.e., living with friends and
families for economic reasons).35 In 2017, the estimated doubled-up population was 9,522 people. This
number was derived by multiplying the number of homeless children enrolled in public school by the average
family size in in their school districts. The combined total was 13,699 homeless people (4,177 + 9,522).36
Children who were too young for school or not enrolled in public school were not included.
An Analysis of Homelessness & Affordable Housing in Multnomah County 2018 (Revised July 31, 2018)               7
There is a large disparity in the numbers of children counted during the PIT report and those captured by the
Oregon Department of Education. For example, the PIT report counted 382 homeless children in
Multnomah County under 18 on one night in 2017; whereas, the Oregon Department of Education (ODE)
counted 4,427 homeless children enrolled in classes in Multnomah County during the 2016-17 school year.
These are different methodologies and there is likely to be some overlap within ODE; however, both
measurements are attempting to account for the number of homeless children. This disparity points to the
need for a more comprehensive accounting of the number of homeless people in Multnomah County.
The National Law Center on Homelessness and Poverty (NLC) analyzed the HUD PIT methodology and
concluded “the count produces a significant undercount of the homeless population at a given point in
time.”37 The NLC estimated the actual number of homeless individuals could be 2.5 to 10.2 times greater
than official PIT results.38 This is mainly based on HUD’s narrow definition of homelessness that leaves out
people living with friends or family due to economic hardship and those who were homeless before entering
institutions such as jails or hospitals. Additionally, people who have transitioned in and out of homelessness
between PIT counts would be omitted using a biennial snapshot approach. Other uncounted people include
those who were unsheltered yet not visible during the count and homeless people who fear interactions with
authorities and thus intentionally avoid being counted. Homeless people who travel for work to places such
as the Amazon CamperForce Program39 have been called “nomads” and “van-dwellers,”40 and would be
missed if they were outside Multnomah County during the night of the count.
Cost of Homelessness: Human Impact
The impact of homelessness can be severe, causing trauma that may linger for years. A range of support
services using a trauma-informed care approach helps those who have been homeless maintain housing after
being homeless. Homelessness is particularly hard on children and youth who move frequently and change
schools more often. Each time they move, they lose connections with friends, teachers, and mentors, which
could disrupt their ability to form attachments. Homeless children can also suffer from physical,
psychological, and emotional issues. According to a survey from the Family Housing Fund, being poor and
homeless may cause toxic stress41 which interrupts normal brain development.42 Figure 3 shows the number
of homeless children increased 38.6% between 2012-2017 in Multnomah County. Many of them could be at
risk for dropping out of school. According to the U.S. Department of Education, more than 40% of formerly
homeless youth reported they had dropped out in middle and high school.43
Figure 3
Number of Homeless Students (K-12) Multnomah County, 2012-2017
4,427
4,059 4,064
3,797
3,194
2012-13 2013-14 2014-15 2015-16 2016-17
School Year
Source: Oregon Department of Education, Homeless Student Percentages by District
An Analysis of Homelessness & Affordable Housing in Multnomah County 2018 (Revised July 31, 2018) 8The impact of homelessness on adults can be significant, particularly if they have been unsheltered for a long
period. It’s difficult to eat nutritious food, get enough sleep, and access needed health care.44 Maintaining a
job is difficult without a regular shower and opportunity to wash clothes. It can be stressful to constantly
move around, looking for a place to sit or sleep. Unsafe conditions can cause feelings of insecurity and some
may start using drugs to help numb their feelings or help them cope. Research shows the longer a person is
homeless the risk becomes higher they will remain homeless. The worst possible outcome of homelessness is
death. Figure 4 shows that between 2011 and 2016, there were 359 homeless deaths recorded in Multnomah
County.45 In 2016, nearly half (40%) were found outdoors with the remaining dying in hospitals (15%),
hotel/motel/shelters (14%), RV/campers/vehicles (11%) and other locations. Half the deaths involved a
substance such as opioids or alcohol as a primary or contributing cause.46
Figure 4
Homeless Deaths in Multnomah County, 2011-2016
88
80
56 56
47
32
2011 2012 2013 2014 2015 2016
Source: Multnomah County Report: Domicile Unknown
Cost of Homelessness: For Communities
Homelessness has a considerable impact on neighborhoods and community livability. People who lack homes
often travel with all their belongings and do not have regular access to bathrooms or garbage receptacles. In
2016, Buckman and Montavilla neighbors complained about human waste and garbage, and a petition was
circulated to initiate cleanup efforts and increase law enforcement in Montavilla Park.47 It can be challenging
for leaders to balance the interests of all community members. People with homes want clean and safe
environments, yet those without homes often have few places to go. Some advocates believe the visibility of
the problem helps increase awareness, leading to additional action.48 While difficult to put a dollar on
livability, homelessness is costing local communities in many ways.
Business Climate: The homeless crisis is most conspicuous in the downtown Portland area. The Portland
Business Alliance has responded by contracting with the Clean & Safe program to keep the downtown area
clean for visitors, workers, and residents.49 However, a 2016 survey by the city auditor revealed the percentage
of Portlanders who felt safe walking alone at night downtown had decline from 2012.50 51 In November 2017,
Columbia Sportswear considered closing its downtown office a year after it had opened. Employees reported
aggressive panhandlers and complained about garbage and human waste near their office. Columbia
Sportwear CEO Tim Boyle decided to remain downtown and support efforts to help address homelessness
by donating $1.5 million for the construction of a “navigation center” expected to open fall 2018 under the
Broadway Bridge.52
Cost of Homelessness: In Dollars
The Joint Office of Homeless Services (JOHS) administers contracts for homeless services in Portland,
Gresham, and Multnomah County. In 2018, the joint office allocated $58 million to more than 20 service
providers to prevent and address homelessness through housing assistance, shelters, employment training,
DV assistance, and mental health support, among other services. See Appendix B, Figures 23, 24, and 25 for
information on specific vendors and expenditures.
An Analysis of Homelessness & Affordable Housing in Multnomah County 2018 (Revised July 31, 2018) 9Communities in the U.S. and Canada have taken steps to quantify the full costs of homelessness to assess
how much each homeless person costs to make effective investments in homeless services and prevention
efforts, and to examine the trade-offs between different approaches. The JOHS budget is one source of funds
that addresses homelessness. Other government expenditures include healthcare and law enforcement. Local
nonprofit organizations that focus primarily on serving the homeless population such as Central City
Concern, Transitions Projects Inc. and JOIN receive support through JOHS; however, they also collectively
raise millions of dollars through grant-writing and donor development activities. Local businesses also
contribute through efforts such as the Clean and Safe program and through other targeted donations.
People who experience homelessness are diverse and have unique needs. Arriving at cost per person can be a
“broad brush” exercise. Table 2 shows a range of estimated costs per person, per year after aggregating
different cost models in the U.S. and Canada. (See Appendix C for information on specific cost models).
Estimates range from $10,000 to $150,000 per person, per year. The wide range primarily reflects various
levels of service use. For example, a person who has been chronically homeless with severe medical needs
may access the emergency room more often, thus costing more than someone who was briefly homeless. The
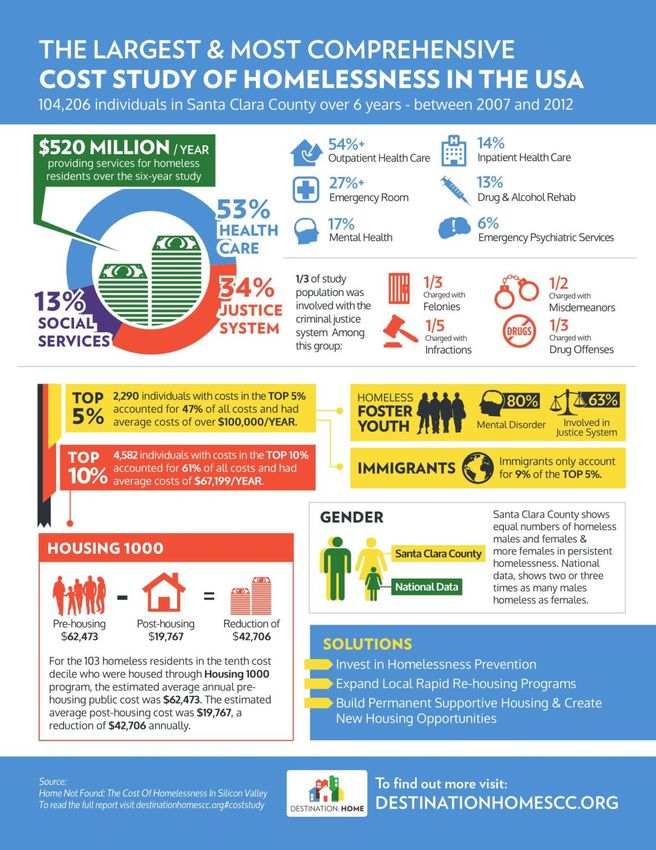
cost of homelessness can be significant. A study conducted in the Puget Sound area in Washington estimated
more than $1 billion was spent every year on homelessness; a study in Santa Clara County in California
estimated more than $3 billion between 2007 and 2012. See Appendices D & E.
Table 2
Cost of Homelessness Models & Range of Costs Per Person, Per year
Cost Models Range
• Phil Mangano “Homelessness Czar” LOW: $10,000
• Santa Clara County, CA (2007-2012) Per Person, Per Year
• Washington County, OR (NERC, 2012)
• State of Homelessness in Canada (2013) HIGH: $150,000
• Portland Nonprofit Per Person, Per Year
Homelessness is costly for both the individuals who experience it and the communities that must respond to
it. Several economic forces are at work that may be contributing to the homeless problem in Multnomah
County, raising the need for more attention on causal factors and preventive efforts.
Economic Forces at Work
Like other fast-growing metropolitan areas, Portland is experiencing what some economists call a “Housing
Trilemma.” A strong economy and high quality of life often arrive at the expense of housing affordability.
According to Josh Lehner at the Oregon Office of Economic Development, “Every city wants to have a
strong local economy, high quality of life and housing affordability”; however, most cities will find it hard to
achieve all three.53 Portland, Seattle, and San Francisco are experiencing similar challenges. See Appendix F.
Macroeconomics plays a key role in housing affordability. Many jobs in Multnomah County have not
provided sufficient wages to cover high housing costs. According to Christian Kaylor, an Economist with the
Oregon Economic Department “[i]t’s a classic tale of economic divide.”54 Figure 5 shows after the Great
Recession, there was an increase in job polarization in Oregon when many middle-wage jobs disappeared.55.
High and low wage jobs quickly recovered, but the number of middle income jobs (paying roughly $35,000 -
$50,000/year for a typical worker in 2017) were still not back to pre-recession levels nearly 10 years later.
An Analysis of Homelessness & Affordable Housing in Multnomah County 2018 (Revised July 31, 2018) 10Figure 5
Oregon Job Polarization
Number of Jobs Lost and Gained after Pre-Recession Peak
Source: BLS, Oregon Office of Economic Analysis. Occupational Data, Grouped Median Wages.
Poverty Rate vs. Self Sufficiency Standard
The poverty rate in Multnomah County was 14.2% in 2017, representing about 114,000 people;56 however,
the Federal Poverty Level has been criticized as an inadequate measurement of true need.57 The cut-off is low,
leaving out many people who struggle financially. In 2018, a family of three at 100% of the poverty level
earned $20,780/year before taxes.58 More communities are using the self-sufficiency standard to better
understand what local households need to cover their basics needs.59 Figure 6 shows the self-sufficiency wage
in Multnomah County for a family of three (one adult, two children) was $31.57 in 2017.60 A parent earning a
minimum wage of $11.25 would need to work 95 hrs./week to cover the family’s basic needs, a gap of more
than $20/hr. Of the top 10 occupations in the Portland OR-WA MSA, just two of them (RNs and
general/operational managers) offered a self-sufficiency wage for an adult with two children.
Figure 6
Hourly Wages of Top 10 Largest Occupations, Portland-Vancouver-Hillsboro, OR-WA MSA. 2017
Total Jobs, 2016
22,690
21,130
1,133,350
15,880
19.150
20,200
15,000
35,690
25,730
22,340
19,340
Self-Sufficiency Wage: For One Adult, One Preschooler & One School-age Child: Multnomah County, OR 2017
Source: Portland Minimum Wage, 2017. The Self-Sufficiency Standard for Oregon, 2017
The federal minimum wage was created to provide a basic living wage for workers61 but has not kept up with
the cost of living. The minimum wage in Portland is $11.25/hr., one dollar higher than surrounding areas at
$10.25/hr.,62 yet many families still need help.
An Analysis of Homelessness & Affordable Housing in Multnomah County 2018 (Revised July 31, 2018) 11Requests for help: Without adequate wages, families are forced to make hard choices such as eating less,
going without medication, or putting off important bills. Even though rent is often prioritized over other
expenses, some families cannot keep up with household bills and lose their housing. 211info is a resource and
referral network that provides information to people who need assistance with rent, food, childcare and other
needs in Oregon and SW Washington. Figure 7 shows 10,733 requests for housing assistance in Multnomah
County were logged between January-March 2018 (calls, texts, etc.).63 The next requests by volume were
utility assistance (2,652) and healthcare (1,646). (Note: some requests may have originated from the same
person or household).
Figure 7
Requests for Housing Assistance in Multnomah County, 2016-2018
14,528
11,850 12,326 11,779
10,775 10,773
6,397
Q3 Q4 Q1 Q2 Q3 Q4 Q1
2016 2016 2017 2017 2017 2017 2018
Source: Oregon 211info Quarterly Reports, Multnomah County 2016 – 2018.
Assistance Programs Help Prevent Homelessness
Without sufficient income, many people turn to government programs and local nonprofits for help. This
support can mean the difference between being housed or homeless and can provide critical support for
those coming out of homelessness. Below are a few government programs that help people stay housed:
Supplemental Nutrition Assistance Program (SNAP): SNAP is considered the most important anti-
hunger safety net in the U.S.64 In Multnomah County, an average of 75,000 households representing about
125,000 people received SNAP each month in 2017.65 The average monthly SNAP benefit was $215.00 per
household, providing an annual benefit of $2,580, about 11% of a household budget for a family working full
time at minimum wage in Portland.
Employment Related Day Care (ERDC): According to a report prepared by Child Care Aware, the annual
cost of child care in Oregon is $12,249/yr. and can be as high as $21,645 for an infant and 4-year old.66 It can
exceed the cost of monthly rent. The Employment Related Day Care program (ERDC)67 helps low-income
working families afford childcare. To be eligible, a family’s income must be less than 185% of the Federal
Poverty Level and payments are made directly to care providers. Families receiving ERDC in Portland can
receive up to $595/mo. - $928/mo. for a toddler, depending on the type of childcare (home care vs. childcare
centers),68 a significant resource for low-wage working families.
Earned Income Tax Credit (EITC): The federal EITC helps low- to moderate-income working people
reduce their taxes and have more disposable income. More than 27 million people received nearly $65 billion
in federal EITC during 2017. The average federal EITC amount received per tax-filer in 2017 was $2,455.69
This once-a-year boost allows low-wage workers to catch up on bills or purchase a car for work.70
Housing Choice Vouchers/Section 8: Housing subsidies are the federal government's primary avenue for
helping low-income families, the elderly, and people with disabilities afford decent, safe, and sanitary housing
in the private market. Household income may not exceed 50% of the area median income (AMI) and 75% of
vouchers go to applicants with incomes at or below 30% AMI.71 Qualified families are expected to pay a
minimum of 28.5% of their income on rent; the remaining amount is subsidized unless the rent exceeds the
An Analysis of Homelessness & Affordable Housing in Multnomah County 2018 (Revised July 31, 2018) 12HUD payment standard in which case the tenant pays the additional amount (up to a limit).72 In June 2018,
5,709 households in Multnomah County received an average $776/mo. in HCVs support.73
Even though government programs can make the difference between having a home or being homeless,
several are at risk for cuts. Congress is currently proposing changes to SNAP that could reduce benefits for
thousands of people74 and HUD may reduce the HCV program.75 Additionally, not all who are eligible
receive assistance due to limited government resources. Without sufficient wages or an adequate safety net,
more people could become homeless.
Economic changes also pose a risk for increasing housing instability. Advances such as automation could
potentially eliminate thousands of low-wage jobs in Multnomah County, as discussed in the next section.
Future Trends & Economic Outlook
Advances in technology such as machine learning algorithms, big data, and artificial intelligence are changing
the employment landscape. A 2017 report by the McKinsey Global Institute reported 60% of all occupations
have at least 30% of constituent activities that could be automated. The activities most susceptible to
automation represent $2.7 trillion in wages in the U.S.76
The Portland Business Alliance and ECONorthwest collected data showing the risk of automation in
Oregon.77 The 2017 report revealed that nearly all jobs in “Food preparation and Service Related” (93%) and
“Sales and Related” (82%) industries were at high risk for automation. These jobs paid a median annual wage
of between $22,830 and $27,980/year. Higher paying jobs ($47,860/year or more) were at the lower risk.78
Figure 8 shows the number of jobs in Oregon (360,000) at high risk for automation.79
Figure 8
Jobs at High Risk for Automation in Oregon
Source: Portland Business Alliance. Adapted from ECONorthwest analysis of Frey et. al. and Bureau of Labor Statistics data
Economic Outlook: The Northwest Economic Research Center (NERC) 2018 Population Outlook report
forecasts a strong economy and high quality of life in the Portland Metro area, although job growth rates are
beginning to slow (2.69% yoy in 2018 compared to 3.00+% in 2014-2016) as the economy reaches full
employment.80 After experiencing high-growth rates, Leisure and Hospitality is considered a slow-growth
industry and Retail is settling into a medium-growth industry through 2027. This could present an issue with an
additional 137,000 people projected in Multnomah County by 2035. As shown in the next section, population
and economic growth together can have a significant impact on housing affordability.
An Analysis of Homelessness & Affordable Housing in Multnomah County 2018 (Revised July 31, 2018) 13Affordable Housing Crisis Worsens
Several factors have worsened the affordable housing crisis, starting with domestic in-migration. Metro areas
with healthy economies attract younger people with higher incomes and education than out-migrants. Figure
9 shows Multnomah County grew by 67,666 people between 2010 - 2017, about 10,000 people per year. Two-
thirds (40,290) was due to net in-migration.81 In coastal areas such as Portland, Seattle, and San Francisco,
new home construction was limited, fueling competition for scarce housing and driving up home prices.82
Many chose to rent rather than own. The number of renter households in Portland increased by 9.6%
between 2011-2015 while owners declined by 0.3%.83 Housing developers responded by building high-end
multi-unit apartment buildings to serve the influx of high-income renters but failed to keep up with the
demand for affordable housing. Consequently, rental prices rose faster than incomes, worsening the crisis.
Figure 9
Multnomah County Population Change, 2010 - 2017
803,000
Total Growth 40,290 Net Migration
67,666 People 27,376 Natural Increase
Base
735,334
Source: PSU, Population Research Center, Oregon Annual Population Report, 2017
Figure 10 shows a dramatic change in incomes among new renter households between 2011 – 2015.84
Portland renters earning $75,000 and above increased by 96%. These households could afford to pay more
for housing than low-wage earners and landlords responded by raising rents. In contrast, renter households
earning $49,999 and under decreased by about 6% (2,855 households).85 Some of these households may have
moved to areas surrounding Portland, such as Gresham, in search of more affordable options.
Figure 10
Change in Renter Households by Income, 2011-2015
110.0%
Metro Portland
90.0%
70.0%
50.0%
30.0%
10.0%
-10.0%
Earned Less Earned Earned Earned Earned
than $25,000 to $50,000 to $75,000 to More than
$25,000 $49,999 $74,999 $99,999 $100,000
Metro -0.1% -0.6% 15.5% 48.2% 85.6%
Portland -5.1% -1.3% 19.9% 63.9% 101.8%
Source: Adapted from PSU Preserving Housing Choice and Opportunity Report, 2017, Figure 4
An Analysis of Homelessness & Affordable Housing in Multnomah County 2018 (Revised July 31, 2018) 14Figure 11 shows that housing construction slowed significantly after the Great Recession just as more people
were moving into the community, compounding the scarcity of housing. Multi-unit construction rates began
to rebound in 2014, but not fast enough to address the need.
Figure 11
Multi-Unit and Single-Family Unit Construction, Portland, 2002-2016
Source: State of Housing in Portland Report, 2017. Adapted from Multnomah County Tax Lot Data, 2016
Increasing Rents & Low Vacancy Rates
According to Zillow, median rental prices for vacant units rose rapidly in Multnomah County starting in 2011,
particularly for 2-bedroom units, which increased 50% between 2011 and 2018. Median rental prices slowed
in 2017; however, average rents in some neighborhoods continued to experience double-digit increases,
particularly in East Portland; Parkrose-Argay and Pleasant Hill are notable examples.86 This demonstrates
that as affordable neighborhoods become more attractive, rents go up, and affordability declines.
Figure 12 Figure 13
Median Rental Prices for Vacant Units Metro Area Vacancy Rates
Multnomah County, 2011-2018 2009-2018
$2,000
$1,873
6.0%
$1,654
$1,500 $1,318 5.0%
$1,354
$1,126
4.0%
$1,000 $1,103
3.0%
$500 2.0%
2011 2012 2013 2014 2015 2016 2017 2018
All Homes Studio 2-Bedroom Vacancy Rates: Metro Area
Source: Data acquired by Zillow.com/data on July 22,2018 Source: MultiFamily Northwest
Figure 13 shows the inverse relationship between what the market is asking renters to pay for vacant units
and vacancy rates, which were declining as rents were increasing. During this time, wages at the lower end
remained largely stagnant, putting two out of seven people in Multnomah County at risk of paying more than
50% of their income on housing.87
Rents in Portland compared to the Area Median Income
Figure 14 shows that average rents in Portland in 2017 Q4 (blue bars) were out of reach for most households
earning below 100% of the AMI ($67,230/year or $5,602/month).88 Households earning 60% AMI and
below could not afford any units without exceeding 30% of their income. An extremely low-income single
An Analysis of Homelessness & Affordable Housing in Multnomah County 2018 (Revised July 31, 2018) 15mother with two children at 30% AMI would have spent nearly all her monthly income ($1,680/mo.) to rent
an average 1-bedroom apartment at $1,350/mo.
Figure 14
Average Rents in Portland vs. Average Median Income Percentages, 2017
Source: State of Housing in Portland Report, Fall 2017 (Avg. Rents)
AMI: HUD Monthly Maximum Rent at 30% Housing Burden, 2017
Populations Impacted by the Housing Crisis
Some populations have been disproportionately affected by the high cost of housing in Multnomah County.
The next section provides information unique to people of color, senior citizens, and people with disabilities.
People of Color
Figure 15 shows people of color are more likely to be renters vs. home owners in Multnomah County. They
are also more likely to have low wage jobs89; thus, have been disproportionately affected by the housing crisis.
Figure 15
Renters vs. Homeowners, Multnomah County, 2015
Renters Homeowners
Black
Latino
Hawaiian-Pacific Islander
Native American
Caucasian
Asian
0% 20% 40% 60% 80% 100%
Source: Home Ownership Rates by Race & Ethnicity
US Census Bureau, 2011-2015 American Community Survey
Gentrification made the situation worse by displacing many people from traditional neighborhoods. As
locations such as the Alberta district attracted more people with higher incomes, home prices and rents
increased, driving people of color outward toward more affordable areas such as East Portland. However,
rents in those areas have become less affordable as more people have moved eastward.
Figure 16 shows the displacement of people of color between 1990-2010. The gold circles indicate
neighborhoods experiencing a net loss in people of color and the blue circles highlight areas where there has
been a gain. High rents have contributed to this displacement. The North/Northeast Affordable Housing Strategy
was developed to help households affected by gentrification remain in their neighborhoods or return if
already displaced.90 As more people of color moved to areas like East Portland and Gresham in search of
more affordable options, poverty became more concentrated91 and neighborhoods more segregated.
An Analysis of Homelessness & Affordable Housing in Multnomah County 2018 (Revised July 31, 2018) 16Figure 16
Displacement of People of Color 1990-2010
People of Color
Portland
Source: Oregon Metro. You Are Here: A Snapshot of Portland-area Housing Costs, 2016
Baby Boomers & Retirees
Baby boomers aged 54-72 years (as of 2018) have been changing the demographic landscape since they began
retiring in 2011. Every day, 10,000 reach age 65 in the U.S. Additionally, more people are living longer,
contributing to an overall older population.92 (See Appendix G). The average lifespan for baby boomers is 80
years; millennials will live an average 95 years and their children 104 years.93 Figure 17 shows an additional
88,260 people aged 50 and above are expected in Multnomah County by 2035, a 37% increase over 2017.
Figure 17
Population Growth and Projections, Age 50 and Up
Multnomah County, 2010 - 2035
21,466
12,221 11,928
128,628 85+ Years
88,201 65-84 Years
66,375
50-64 Years
178,860
142,548 140,565
2010 2015 2017 2020 2025 2030 2035
Source: Population Research Center, Portland State University, July 1, 2017
A larger population of older people means more of them will need assistance later in life, particularly since many
will lack sufficient retirement income. Figure 18 shows median retirement savings amassed among different age
groups before and after the Great Recession.94 Nearly half of working-age households (45%) do not own any
retirement account assets, including an employer-sponsored 401(k) or IRA. Half of those households are headed
by someone between the age of 45 to 65 years.95
Today’s seniors have fewer assets and children to rely upon than in the past.96 With longer lives, they could
outlive what savings they’ve accumulated. Some will choose to work while others will have no choice.97 Without
support, some may become homeless. In Portland, a senior earning a median income of $39,328 could afford
$938/month in rent. However, according to the 2018 State of Housing Report in Portland, no neighborhoods
were considered affordable for seniors at that level. The reality is that many seniors (61%) are relying on social
An Analysis of Homelessness & Affordable Housing in Multnomah County 2018 (Revised July 31, 2018) 17security for half their income with one third relying on it for 90% of their income.98 Of those, about 70% spend
more than 30% on housing.99 Reliance upon social security increases as people get older.
Figure 18
Median Retirement Account Savings by Age, 1995-2013
$40,000
$30,000 32–37 years
38–43 years
$20,000
44–49 years
$10,000 50–55 years
56–61 years
$0
1995 1998 2001 2004 2007 2010 2013
Source: Economic Policy Institute, 2016
People with Disabilities
According the National Coalition on Homelessness, having a disability can be both a cause and condition of
homelessness. People with disabilities make up about 16% of the U.S. population (not institutionalized);
however, more than 40% of the homeless are considered disabled.100 According to the 2017 PIT Report in
Multnomah County, two out of three people who were homeless had some type of disabling condition.
Supplemental Security Income (SSI) is an important resource for people with disabilities who are very low
income but have not worked enough hours to quality for Social Security Disability Insurance (SSDI). Figure
19 shows that SSI provided a maximum monthly benefit of $735 in 2017 for an individual. This would not
cover the rent for a studio apartment at median rent prices in Multnomah County. Housing Choice Vouchers
can be a critical resource to combine with SSI to maintain stable housing; however, the waiting list in
Multnomah County has been closed since 2016.101 According the Center on Disability, about 29% of
households who received a HCV voucher in Portland had a member who was disabled in 2017.102
Figure 19
Maximum Monthly SSI Benefits for Individuals
1000
800 710 721 733 733 735
674 698
600
400
2011 2012 2013 2014 2015 2016 2017
Source: Social Security Administration, SSI Federal Payment Amounts
Market Forces Alone Won’t Solve this Problem
Affordable Housing Shortfall
Figure 20 shows that Multnomah County has a current shortage of 29,000 units for families that are earning
50% AMI ($53,000/year and below). Multnomah County has a current supply of 24,326 units of regulated
affordable housing.103 With so many people lacking affordable housing, the question of housing supply is
raised. If the demand is so high, why is the supply so low?
An Analysis of Homelessness & Affordable Housing in Multnomah County 2018 (Revised July 31, 2018) 18Figure 20
Affordable Housing Needs among Households Earning
30-50% AMI, Multnomah County
60,000
60,000
50,000
40,000 31,000
30,000 + Need
20,000
10,000 - Supply
-
= Shortage
(10,000)
(20,000)
(30,000)
-29,000
Source: Oregon Metro Report, you Are Here, 2018
*50% AMI (based on 2011 – 2015 figures)
The market normally responds to such high demand. However, affordable housing will not scale up without
significant government intervention due to many players with differing and sometimes conflicting interests:
● Renters want to earn a livable wage and pay affordable rent for a home in a safe and convenient location.
However, many do not earn sufficient wages and are housing burdened.
● Landlords hope to maximize earning potential by asking for the highest rents possible.104 They prefer
low vacancy rates and tenants with good credit and rental histories. Low-income renters, particularly
those receiving Section 8 vouchers, are often not the first choice for many landlords.
● Nonprofit housing developers are dedicated to their mission and aim to serve vulnerable renters but
must also break even to stay afloat. They have limited capacity to serve those earning the lowest AMI.
● For-profit developers seek to maximize income potential. They want to do well and do good but find it
hard to earn expected returns on affordable housing projects. They tend to target households earning
60% - 80% AMI; however, even those projects may not pencil out.
● Governments seek to balance different constituent interests. Public policies, regulations, and funding are
used in combination to encourage, and, in some cases, require construction of new affordable housing;
however, public resources are limited, and construction is both expensive and time-consuming. Less than
1,200 units of affordable housing are in the construction pipeline for 2018-2021 in Portland.
Addressing the Affordable Housing Shortfall
Real estate investment decisions boil down to considerations of time and money. Figure 21 provides four
scenarios for addressing the 29,000 unit shortfall. (See Appendix H for more information about this model’s
assumptions and limitations).
Figure 21
Four Time Scenarios to Address the 29,000 Affordable Housing Shortfall
An Analysis of Homelessness & Affordable Housing in Multnomah County 2018 (Revised July 31, 2018) 19You can also read