Source apportionment of atmospheric PM10 oxidative potential: synthesis of 15 year-round urban datasets in France
←
→
Page content transcription
If your browser does not render page correctly, please read the page content below
Atmos. Chem. Phys., 21, 11353–11378, 2021
https://doi.org/10.5194/acp-21-11353-2021
© Author(s) 2021. This work is distributed under
the Creative Commons Attribution 4.0 License.

Source apportionment of atmospheric PM10 oxidative potential:
synthesis of 15 year-round urban datasets in France
Samuël Weber1 , Gaëlle Uzu1 , Olivier Favez2,3 , Lucille Joanna S. Borlaza1 , Aude Calas1 , Dalia Salameh1 ,
Florie Chevrier1,4,8 , Julie Allard1 , Jean-Luc Besombes4 , Alexandre Albinet2,3 , Sabrina Pontet5 , Boualem Mesbah6 ,
Grégory Gille6 , Shouwen Zhang7 , Cyril Pallares9 , Eva Leoz-Garziandia2,3 , and Jean-Luc Jaffrezo1
1 Univ.Grenoble Alpes, CNRS, IRD, IGE (UMR 5001), 38000 Grenoble, France
2 INERIS, Parc Technologique Alata, BP 2, 60550 Verneuil-en-Halatte, France
3 Laboratoire Central de Surveillance de la Qualité de l’air, 60550 Verneuil-en-Halatte, France
4 Univ-Savoie Mont Blanc, CNRS, EDYTEM, 73000 Chambéry, France
5 Atmo Auvergne-Rhône-Alpes, 69500 Bron, France
6 Atmo Sud, 13294 Marseille, France
7 Atmo Hauts de France, 59044 Lille, France
8 Atmo Nouvelle Aquitaine, 33692 Mérignac, France
9 Atmo Grand Est, 67300 Schiltigheim, France

Correspondence: Gaëlle Uzu (gaelle.uzu@ird.fr) and Samuël Weber (samuel.weber@univ-grenoble-alpes.fr)

Received: 27 January 2021 – Discussion started: 26 February 2021
Revised: 31 May 2021 – Accepted: 30 June 2021 – Published: 28 July 2021

Abstract. Reactive oxygen species (ROS) carried or induced        highlighted the dominant influence of the primary road traffic
by particulate matter (PM) are suspected of inducing oxida-       source. Both the biomass burning and the road traffic sources
tive stress in vivo, leading to adverse health impacts such       contributed evenly to the observed OPAA . Therefore, it ap-
as respiratory or cardiovascular diseases. The oxidative po-      pears clear that residential wood burning and road traffic are
tential (OP) of PM, displaying the ability of PM to oxidize       the two main target sources to be prioritized in order to de-
the lung environment, is gaining strong interest in examin-       crease significantly the OP in western Europe and, if the OP
ing health risks associated with PM exposure. In this study,      is a good proxy of human health impact, to lower the health
OP was measured by two different acellular assays (dithio-        risks from PM exposure.
threitol, DTT, and ascorbic acid, AA) on PM10 filter samples
from 15 yearly time series of filters collected at 14 different
locations in France between 2013 and 2018, including urban,
traffic and Alpine valley site typologies. A detailed chemical    1   Introduction
speciation was also performed on the same samples, allowing
the source apportionment of PM using positive matrix factor-      Air quality has become a major public health issue, being
ization (PMF) for each series, for a total number of more than    considered the fourth largest global cause of mortality, with
1700 samples. This study then provides a large-scale synthe-      7 million premature deaths worldwide per year due to both
sis of the source apportionment of OP using coupled PMF           indoor and outdoor exposure (World Health Organization,
and multiple linear regression (MLR) models. The primary          2016). Possibly driving 90 % of this health impact (Lelieveld
road traffic, biomass burning, dust, MSA-rich, and primary        et al., 2015), particulate matter (PM) is one of the key pol-
biogenic sources had distinct positive redox activity towards     lutants in the air linked to health outcomes, although the ex-
the OPDTT assay, whereas biomass burning and road traf-           act mechanism leading to toxicity is not yet fully understood
fic sources only display significant activity for the OPAA as-    (Barraza-Villarreal et al., 2008; Beck-Speier et al., 2012;
say. The daily median source contribution to the total OPDTT      Brauer et al., 2012; Goix et al., 2014; Goldberg, 2011; Saleh
                                                                  et al., 2019). Many urbanized areas, mainly located in low- or

Published by Copernicus Publications on behalf of the European Geosciences Union.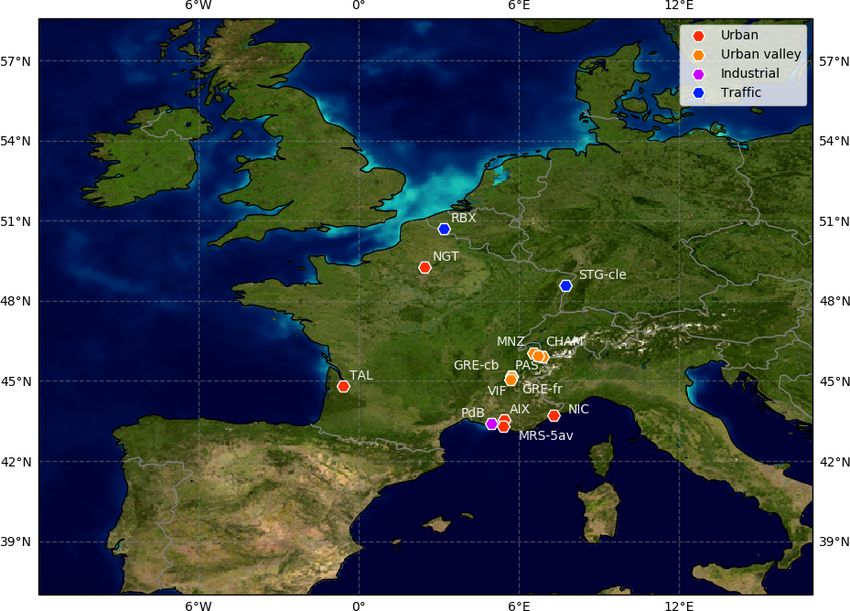
11354                                                      S. Weber et al.: Harmonized source apportionment of OP in 15 sites

middle-income countries, are exposed to PM concentrations             2009; Sauvain et al., 2008) has been proposed as a potential
far higher than the recommendation guideline of the WHO.              proxy of the health impacts of atmospheric PM exposure. In-
   Although PM is now monitored in most countries and                 deed, even if the clear demonstration of the OP as a good
large efforts are observed to document ambient concentra-             proxy of health impact is still needed, some recent studies
tions, the underlying processes leading to the observed con-          already established associations between OPs and different
centrations in the atmosphere, and particularly the under-            possible health outcomes (Costabile et al., 2019; Karavalakis
standing of emission sources, are still active fields of re-          et al., 2017; Steenhof et al., 2011; Strak et al., 2017b; Tuet
search (Diémoz et al., 2019; El Haddad et al., 2011; Golly            et al., 2017a; Weichenthal et al., 2016) or cellular stress in
et al., 2019; Hodshire et al., 2019; Jaffrezo et al., 2005; Jiang     vitro (Leni et al., 2020).
et al., 2019; Marconi et al., 2014; Moreno et al., 2010; Piot            However, there is also no consensus on a standardized
et al., 2012; Salameh et al., 2015; Samaké et al., 2019a;             method to measure the OP of PM, and many assays and pro-
Waked et al., 2014). In recent years, strong focus has been           tocols co-exist (DTT, GSH, AA, ESR, ◦ OH or H2 O2 , among
put worldwide on source-apportionment methods in order to             others), with samples extracted with different methods (wa-
better understand the processes leading to the airborne con-          ter, methanol, simulated lung fluid (SLF), etc.) and not al-
centrations and the accumulation of PM in the atmosphere.             ways with a constant mass of PM. The dithiothreitol (DTT)
This includes direct modeling approaches such as chemistry            and ascorbic-acid (AA) assays are widely used in association
transport models (CTMs) using tagged species (Brandt et al.,          with health endpoints (Abrams et al., 2017; Atkinson et al.,
2013; Kranenburg et al., 2013; Mircea et al., 2020; Wagstrom          2016; Bates et al., 2015; Canova et al., 2014; Fang et al.,
et al., 2008; Wang et al., 2009) or field studies coupled with        2016; Janssen et al., 2015; Strak et al., 2017a; Weichenthal
receptor models (RMs) (Belis et al., 2020; Pernigotti et al.,         et al., 2016; Yang et al., 2016; Zhang et al., 2016), even if
2016; Simon et al., 2010), notably positive matrix factoriza-         the exact methodologies differ from one study to the other.
tion (PMF). PMF can be based either on an aerosol mass                Results can also differ for the seasonality of OP based on
spectrometer (AMS) time-resolved spectrum (Bozzetti et al.,           these two assays, and some studies report strong seasonal-
2017; Petit et al., 2014; Zhang et al., 2019) or on filter anal-      ity of OP, whereas others do not (Bates et al., 2015; Calas
ysis (Amato et al., 2016; Bressi et al., 2014; Fang et al.,           et al., 2019; Cesari et al., 2019; Fang et al., 2016; Ma et al.,
2015; Jain et al., 2018, 2020; Liu et al., 2016; Petit et al.,        2018; Paraskevopoulou et al., 2019; Perrone et al., 2016;
2019; Salameh et al., 2018; Srivastava et al., 2018; Waked            Pietrogrande et al., 2018; Verma et al., 2014; Fang et al.,
et al., 2014) or a mix of these different measurement tech-           2015; Weber et al., 2018; Borlaza et al., 2018; Zhou et al.,
niques (Costabile et al., 2017; Vlachou et al., 2018, 2019).          2019). Finally, several studies have already shown that dif-
Results of these studies indicate that PM originates from a           ferent sources of PM have different reactivities to OP tests
wide variety of sources, not only natural (volcano, sea spray,        (Verma et al., 2014; Bates et al., 2015; Fang et al., 2016; We-
soil dust, vegetation, bacteria, pollen, etc.) or anthropogenic       ber et al., 2018; Paraskevopoulou et al., 2019; Cesari et al.,
(road traffic, residential heating, industry, etc.) sources, but it   2019; Zhou et al., 2019; Daellenbach et al., 2020). In par-
is also formed as a secondary product and condensed from              ticular, sources with high concentrations of transition met-
the gaseous phase (ammonium nitrate and ammonium sul-                 als, such as road traffic, appear to have a higher intrinsic ox-
fate, etc.). As a result, the chemistry, size distribution or reac-   idative potential (i.e., OP per microgram of PM) than other
tivity of PM widely vary from location to location and season         sources of PM. However, the number of these studies is still
to season, which induces large changes in the health impacts          limited, and they do not always take into account complete
depending on all of these parameters (Kelly and Fussell,              seasonal cycles and therefore may not encompass the vari-
2012).                                                                ety of sources for a given site, possibly omitting some im-
   Furthermore, the mass of PM is not the most relevant met-          portant sources. Also, spatial variability at a country scale is
ric when dealing with health impacts of airborne particles            currently unknown and requires homogeneous sampling and
since major properties (chemistry, shape, size distribution,          analysis methodologies for all filters and time series.
solubility, speciation) driving PM toxicity are not taken into           For a comprehensive investigation of the intrinsic OPs of
account within this single mass metric. It is now believed            various PM sources, we built up an extensive dataset of about
that the measurement of the reactive oxygen species (ROS)             1700 samples from 14 sites consisting of 15 year-round time
issued from PM may be more closely linked to the poten-               series of observations over continental France, collected dur-
tial adverse health effects of atmospheric PM, since oxidative        ing research programs conducted between 2013 and 2018.
stress is a key factor in the inflammatory response of the or-        In each of these samples, we concurrently measured the
ganism, leading for instance to respiratory diseases or when          OP with the DTT and AA assays together with an exten-
exposed for a long period of time, cardiovascular diseases or         sive chemical characterization allowing PM source appor-
even cancer (Lelieveld et al., 2015; Li et al., 2003). There-         tionment using a harmonized PMF approach (Weber et al.,
fore, the oxidative potential (OP) of PM being an indirect            2019). Then, we apportioned the OP measured by the DTT
measure of the ability of the particles to induce ROS in a bio-       and AA assays to the emission sources using a multilinear re-
logical medium (Ayres et al., 2008; Cho et al., 2005; Li et al.,      gression approach following Weber et al. (2018). In this way,

Atmos. Chem. Phys., 21, 11353–11378, 2021                                             https://doi.org/10.5194/acp-21-11353-2021
S. Weber et al.: Harmonized source apportionment of OP in 15 sites 11355
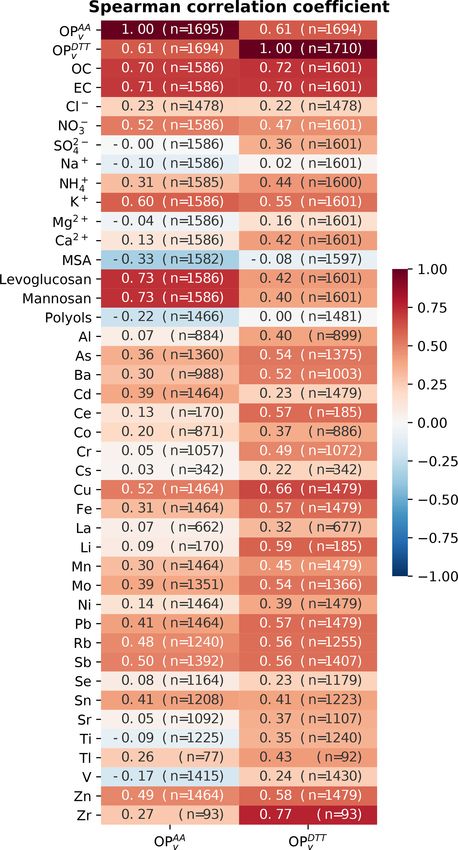
Figure 1. Locations of the 14 sampling sites. Color codes denote the typologies of the sites: red, urban; orange, urban valley; magenta,
industrial; blue, traffic. Background photography from NASA’s Earth Observatory.
we can estimate the oxidizing capacity of each microgram and Atmo Hauts de France), and most of them are part of
of PM from the different identified emission sources but also the so-called CARA program (Favez et al., 2021).
the relative contribution of the different sources to the OPDTT
and OPAA on seasonal and daily bases. These results are pre- 2.2 Sample analysis
sented in this paper.
Even if it has been shown that mainly PM2.5 is deposited in
lung alveoli (Fang et al., 2017), PM10 is still a public health
concern and under regulation in the EU and France (Directive
2 Materials and methods Official Journal of the European Union, 2008). Moreover, re-
cent studies also highlight the role of the coarse fraction of
2.1 Site descriptions PM in health impacts (Keet et al., 2018; Wang et al., 2018;
Chen Renjie et al., 2019). PM10 has the advantage of en-
The selected sites had to fulfill three conditions: (1) a yearly compassing all parts of PM potentially reaching the lower
sampling period, (2) the required chemical analysis to per- respiratory tract.
form a harmonized PMF analysis and (3) enough filter sur-
face left to assess the OP measurements. A total of 14 sites 2.2.1 Chemical speciation
were included in this study (one being sampled twice at a 5-
year interval) taken from different research programs. These The PM10 concentrations were measured at each site
sites reflect the diversity of typology we could encounter in by means of an automatic analyzer, according to EN
western Europe: urban (NGT, TAL, AIX, MRS-5av, NIC), 16450:2017 (CEN, 2017b), and daily (24 h) filter samples
urban Alpine valley (GRE-cb, GRE-fr, VIF, CHAM, MNZ, were collected every third day. Samplings were achieved
PAS), industrial (PdB) and traffic (RBX, STG-cle) (see Ta- on pre-heated quartz fiber filters using a high-volume sam-
ble S1 in the Supplement) covering different areas of France pler (DA80, Digitel), following EN 12341:2014 procedures
(Fig. 1). We can note, however, the absence of remote or ru- (CEN, 2014). Offline chemical analysis performed on these
ral sites in our current dataset. The air quality at all of these filters has been fully described previously (Weber et al.,
sites is operated by the local air quality agencies (Atmo Sud, 2019). Briefly, the elemental and organic carbon fractions
Atmo Auvergne Rhône-Alpes, Atmo Nouvelle Aquitaine, (EC and OC) were measured via thermo-optical analysis
https://doi.org/10.5194/acp-21-11353-2021 Atmos. Chem. Phys., 21, 11353–11378, 2021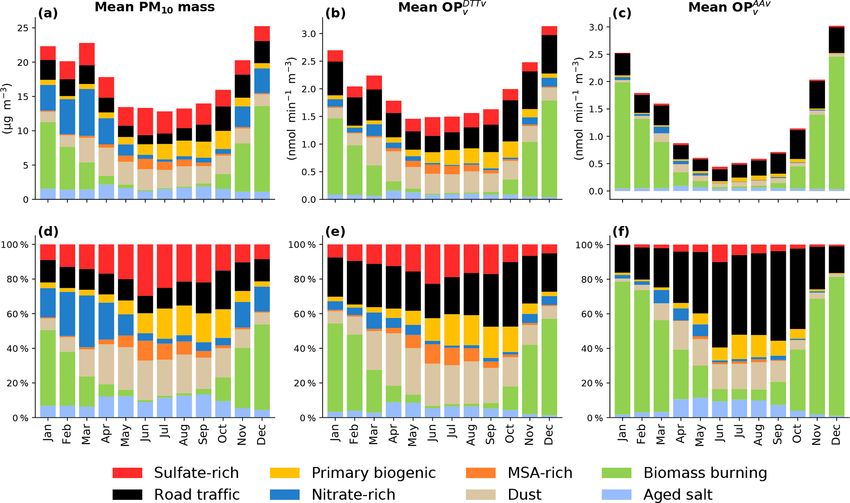
11356                                                   S. Weber et al.: Harmonized source apportionment of OP in 15 sites

(Sunset Lab. Analyzer Birch and Cary, 1996) using the              in each plate (OPAA and OPDTT ) of the protocol. The average
EUSAAR-2 protocol (Cavalli et al., 2010; CEN, 2017a).              values of these blanks were then subtracted from the sample
                                                          2−
Major water-soluble inorganic contents (Cl− , NO−  3 , SO4 ,       measurements of the given plate. The detection limit (DL)
    +      +   +      2+          2+
NH4 , Na , K , Mg , and Ca ) and methanesulfonic acid              value was defined as 3 times the standard deviation of labo-
(MSA) were determined using ion chromatography (CEN,               ratory blank measurements (laboratory blank filters in Gam-
2017b; Jaffrezo et al., 2005). Metals or trace elements (e.g.,     ble + DPPC solution).
Al, Ca, Fe, K, As, Ba, Cd, Co, Cu, La, Mn, Mo, Ni, Pb,                Hereafter, the OPDTT and OPAA normalized by air vol-
Rb, Sb, Sr, V, and Zn) were measured by inductively coupled        ume are denoted OPDTTv   and OPAAv , respectively, with unit
                                                                             −1 −3
plasma atomic emission spectroscopy or mass spectrometry           nmol min m .
(ICP-AES or ICP-MS) (Alleman et al., 2010; Mbengue et al.,
2014; CEN, 2005). Finally, anhydrosugars and sugar alco-           2.3     Source apportionment
hols (including levoglucosan, mannosan, arabitol, sorbitol,
and mannitol) were analyzed using liquid chromatography            The source apportionment of the OP can be performed in two
followed by pulsed amperometric detection (LC-PAD) (Verl-          main ways: (1) by including the OP as an input variable for
hac et al., 2013; Yttri et al., 2015).                             the RM (Verma et al., 2014; Fang et al., 2016; Ma et al., 2018;
                                                                   Cesari et al., 2019) or (2) by conducting source attribution to
2.2.2   OP assays                                                  the PM mass and then, using a multilinear regression (MLR)
                                                                   model, assigning OP to each of the sources from the source–
Identical methodologies were applied for all the OP measure-       receptor model (Bates et al., 2015; Verma et al., 2015b; We-
ments of the collected filters (Calas et al., 2017, 2018, 2019).   ber et al., 2018; Cesari et al., 2019; Paraskevopoulou et al.,
The extraction of PM was performed using a simulated               2019; Zhou et al., 2019; Daellenbach et al., 2020). We de-
lung fluid (SLF: Gamble + DPPC) to simulate the bio-               cided to use the second approach since adding the OP vari-
accessibility of PM and to closely simulate exposure con-          able to the PMF may change the source-apportionment solu-
ditions. In order to take into account the nonlinearity of the     tion. Further, the first method would imply that the intrinsic
OP with PM mass and to have comparable results between             OP would be positive by construction and not due to relevant
sites, the extraction has been carried out at the iso-mass con-    physical properties (see below). Moreover, the OP apportion-
centration (10 or 25 µg mL−1 of PM, depending on the site,         ment in a two-step process (PM mass source apportionment
both values being in the low mass range of linear dose re-         and then OP apportionment) allowed us to potentially use
sponse), by adjusting the surface of the filter extracted. The     different model types for the OP apportionment and re-use
filter extraction method allowed us to include both soluble        results of the PMF for other OP assays later on.
and insoluble particles in the extracts. After the SLF extrac-
                                                                   2.3.1    PM mass apportionment: positive matrix
tion, particles removed from the filter were not filtrated, and
                                                                            factorization
the whole extract was injected in a 96-well plate for analysis.
Samples were processed using the AA and DTT assays, as             Methodological background
described below.
    DTT depletion when in contact with PM extracts was             The PM mass source apportionment for the 15 yearly se-
determined by dosing the remaining amount of DTT with              ries was conducted using the U.S. Environmental Protection
DTNB (dithionitrobenzoic acid) at different reaction times         Agency (US-EPA) EPA PMF 5.0 software (US EPA, 2017)
(0, 15 and 30 min), and absorbency was measured at 412 nm          with the ME-2 solver from Paatero (1999). Briefly, the PMF
using a plate spectrophotometer (Tecan, M200 Infinite). An         was introduced by Paatero and Tapper (1994) and is now
initial concentration of 12.5 nmol of DTT is used (50 µL of        one of the most common approaches used for PM source-
0.25 mM DTT solution in phosphate buffer) to react with            apportionment studies (Hopke et al., 2020; Karagulian et al.,
205 µL of phosphate buffer and 40 µL of PM suspension.             2015; Belis et al., 2020). It aims at solving the receptor model
    The AA assay is a simplified version of the synthetic res-     equation
piratory tract lining fluid (RTFL) assay (Kelly and Mudway,
2003), where only AA is used. A mix of 80 µL of PM suspen-         X = G · F,                                                  (1)
sion with 24 nmol of AA (100 µL of 0.24 mM AA solution in
Milli-Q water) is used, and AA depletion was read continu-         where X is the n × m observation matrix, G is the n × p
ously for 30 min by absorbency at 265 nm (TECAN, M1000             contribution matrix and F is the p × m factor profile matrix
Infinite). The depletion rate of AA was determined by linear       (or source, despite some factors not being proper emission
regression of the linear section data. For both assays, the 96-    sources but possibly reflecting secondary processes), with n
well plate was auto-shaken for 3 s before each measurement         the number of samples, m the number of measured chemical
and kept at 37 ◦ C.                                                species and p the number of profiles. Hereafter, the G matrix
    Three filter blanks (laboratory blanks) and three positive     is expressed in µg m−3 and the F matrix in µg µg−1 of PM.
controls (1,4-naphthoquinone, 24.7 µmol L−1 ) were included

Atmos. Chem. Phys., 21, 11353–11378, 2021                                          https://doi.org/10.5194/acp-21-11353-2021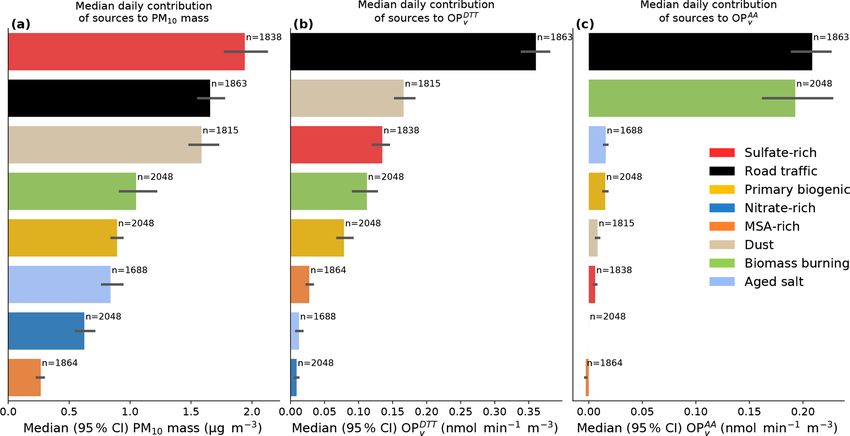
S. Weber et al.: Harmonized source apportionment of OP in 15 sites                                                        11357

PMF setup                                                         of factor profiles based on their mass-normalized chemical
                                                                  compounds using two different metrics, namely, the Pearson
Some of the PMF analyses included in this paper have been         distance (PD) and the standardized identity distance (SID)
performed during previous programs, namely, SOURCES               (Belis et al., 2015). The first one is defined as
(http://pmsources.u-ga.fr, last access: 27 July 2021, Weber
et al., 2019), DECOMBIO (Chevrier, 2016; Chevrier et al.,         PD = 1 − r 2 ,                                             (2)
2016), or MobilAir (https://mobilair.univ-grenoble-alpes.fr/,
last access: 27 July 2021, Borlaza et al., 2021a). In order       with r 2 the Pearson correlation coefficient, and might be
to get comparable PM source profiles from a common set            strongly influenced by individual extreme points. The second
of input species and constraints in the model, PMF analy-         one, SID, can expressed as follows:
ses have been run with a harmonized methodology, as previ-                √ m
ously reported (Weber et al., 2019). Then, the PMF of MNZ                   2 X xj − yj
                                                                  SID =                    ,                                (3)
and PAS were run specifically for this study, and the ones of             m j =1 xj + yj
MobilAir (GRE-fr_2017, GRE-cb and VIF) are the “classic”
runs in Borlaza et al. (2021a). The other ones (AIX, CHAM,        where x and y are two different factor profiles expressed in
GRE-fr_2013, MRS-5av, NGT, NIC, PdB, RBX, STG-cle                 relative mass, and m, the number of common species in x
and TAL) directly come from the SOURCES program (We-              and y, is evenly sensitive to every species since it includes a
ber et al., 2019).                                                normalization term.
    The input species were slightly different from one study to
another but always included carbonaceous compounds (OC            2.4     OP apportionment
and EC), ions (SO2−            −     −     +     +     2+
                       4 , NO3 , Cl , NH4 , K , Mg , and
    2+
Ca ), organic compounds (levoglucosan, mannosan, ara-             The computation was done thanks to the statsmodels 0.12
bitol and mannitol – the latter two summed and referred to        python package (Seabold and Perktold, 2010), and the graph-
as polyols) and MSA – and a set of trace metals for a total       ics were produced with matplotlib 3.3.1 (Hunter, 2007;
of about 30 species. The list of metals used within the PMF       Caswell et al., 2020) and seaborn 0.11 (Waskom, 2021).
analysis was not the same for each of the sites due to overly
                                                                  2.4.1    Apportionment using multilinear regression
low concentrations (lower than the quantification limit) on
                                                                           (MLR)
some filters leading to a very low signal-to-noise ratio (see
Table S2). The uncertainties were estimated following the         MLR was conducted independently at each site, with results
method proposed by Gianini et al. (2012) and were tripled         from the two (DTT and AA) OP assays being the depen-
if the signal-to-noise ratio was below 2 (classified as “weak”    dent variables and the source contributions obtained from the
in the PMF software). Between 8 and 10 factors were identi-       PMF being the explanatory variables, following the equation
fied at the different sites and are summarized in Table S3. For   (Eq. 4), similarly to Weber et al. (2018):
each of the PMF analyses, the possibility of using constraints
to refine some of the chemical profiles of factors was consid-    OPobs = G × β + ε,                                         (4)
ered in order to better disentangle possible mixing between
factors and reduce the rotational ambiguity, based on a pri-      where OPobs is a vector of size n × 1 of the observed OPDTTv
ori expert knowledge of the geochemistry of the sources. A        or OPAAv in nmol min
                                                                                         −1 −3
                                                                                            m , G is the matrix (n × (p + 1))
PMF solution was considered valid if it followed the recom-       of the mass contribution of PM sources obtained from the
mendation of the “European guide on air pollution source ap-      PMF in µg m−3 and a constant unit term for the intercept (no
portionment with receptor models” (Belis et al., 2019), also      unit), β are the coefficients (i.e., intrinsic OP of the source
requiring a proper geochemical identification of the various      and the intercept) of size ((p + 1) × 1) in nmol min−1 µg−1
factors. Estimation of the uncertainties of the PMF was ob-       for the intrinsic OP and in nmol min−1 m−3 for the intercept.
tained on both the base and constrained runs using the boot-      The residual term ε (n × 1) accounts for the misfit between
strap (BS) and displacement (DISP) functions of the EPA           the observations and the model.
PMF5.0 (Brown et al., 2015).                                          The intercept was not forced to zero on purpose. Indeed,
                                                                  if the system is well constrained, the intercept should sponta-
2.3.2   Similarity assessment of the PMF factors                  neously be close to zero, and conversely a non-zero intercept
                                                                  would point out missing explanatory variables.
Since PMF resolved site-specific PM factors, we checked               A weighted least-square regression (WLS) was finally
whether a given factor had a consistent chemical profile over     used to consider the uncertainties of the OP measurements.
the different sites. For this purpose, as presented in We-        The uncertainties of the coefficients β given by the MLR
ber et al. (2019), a similarity assessment of all PMF factor      were estimated by bootstrapping the solutions 500 times, ran-
profiles was run following the DeltaTool approach (Pernig-        domly selecting 70 % of the samples each time to account for
otti and Belis, 2018). Using this tool, we compared pairs         possible remaining extreme events or seasonal variations of

https://doi.org/10.5194/acp-21-11353-2021                                          Atmos. Chem. Phys., 21, 11353–11378, 2021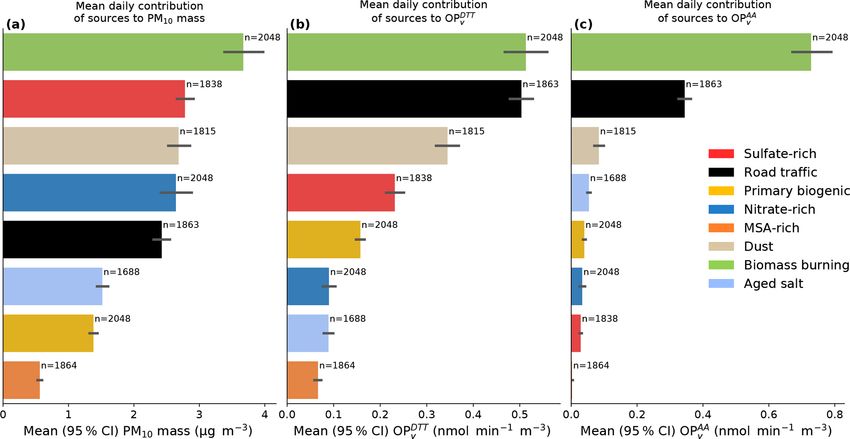
11358                                                     S. Weber et al.: Harmonized source apportionment of OP in 15 sites

the intrinsic OP per source. The uncertainty of the PMF re-          3.1     PMF results
sult G was however not considered because the EPA PMF
software only returns to the user the uncertainties associated       In this section, we summarize the main results acquired from
with the profile matrix F (see Weber et al., 2019, for a first-      the harmonized PMF approach conducted for the present pa-
order estimation of the G uncertainties).                            per, but we invite the reader to refer to the previous study
                                                                     (Weber et al., 2019) and to the website to have a more com-
2.4.2    Contribution of the sources to the OP                       plete view of the results.

The contribution GOP in nmol min−1 m−3 of the sources to             3.1.1    PMF source apportionment
the OP was computed at each site independently and was
calculated following Eq. (5):                                        The list of the identified factors at each site is given in Ta-
                                                                     ble S3, and individual profiles and time series together with
GOP
 k = Gk × βk ,                                                (5)    uncertainties can be found at http://getopstandop.u-ga.fr/
                                                                     results?component=pmf_profile_and_contribution (last ac-
where k is the source considered, G the PMF sources’ con-            cess: 27 July 2021). Table 1 summarizes the main PMF
tribution in mass concentration (µg m−3 ) and β the intrinsic        factors found at least at 10 out of the 15 series. Shortly,
OP of the sources in nmol min−1 µg−1 . The uncertainties of          we obtained PMF factors corresponding to biomass burning
GOP were computed using the uncertainties of β estimated             (mainly from residential heating), primary road traffic, min-
from the 500 bootstraps.                                             eral dust, secondary inorganic nitrate-rich and sulfate-rich,
                                                                     salt (fresh and aged) as well as primary biogenic and MSA-
2.5     Focus on the main PMF factors                                rich. Some other local sources were also identified at some
                                                                     sites, targeting some local heavy-loaded metal sources with
This study focuses on the main drivers of OP at the regional
                                                                     a very low contribution to the total PM mass – supposedly
scale. For this reason, we decided to include in the main
                                                                     linked to the industrial process – which contained a wide va-
discussion only the PMF factors identified in at least two-
                                                                     riety of chemicals but shared a common set of metals (Al, As,
thirds of the series (i.e., 10 out of 15 series), namely, the aged
                                                                     Cd, Mn, Mo, Pb, Rb, Zn). Finally, a factor related to shipping
salt, biomass burning, dust, MSA-rich, nitrate-rich, primary
                                                                     emission (namely, HFO) was obtained at some coastal sites.
biogenic, primary road traffic and sulfate-rich factors. How-
ever, the remaining sources, often local, barely contributed         3.1.2    PMF similarities between sites
to the total PM mass, and important uncertainties were of-
ten attached to them. The only notable exception is the HFO          The similarities between chemical profile composition esti-
(heavy fuel oil) profile identified at some coastal sites, dis-      mated by the PD and SID metrics are presented in Fig. S2.
cussed hereafter in its own section.                                 We observed a strong similarity for the main sources of
                                                                     PM, namely, biomass burning, nitrate-rich, primary biogenic,
                                                                     sulfate-rich and to a lesser extent road traffic. The dust, aged
3     Results and discussion
                                                                     salt and MSA-rich were often identified and presented ac-
As a large set of results has been obtained in the present           ceptable SID but also showed large values for the PD met-
study and cannot be exhaustively presented here, an interac-         ric. As the PD is sensitive to “extreme points”, this trans-
tive visualization tool providing details on PM and OP source        lates in our case to different contributions for the chemical
time series and apportionment outputs is available online at         species contributing most to the PM mass (mainly OC and
http://getopstandop.u-ga.fr/ (last access: 27 July 2021, and         EC). MSA-rich is the most variable factor, and a detailed
also http://pmsources.u-ga.fr, last access: 27 July 2021, for        analysis of its chemistry profile indicated many differences
the chemical part of the SOURCES ones) and is proposed               from site to site for the concentrations of EC but also NO−    3
as the Supplement of this paper including all factors for all        and NH+  4 . This factor being essentially a secondary organic
series.                                                              factor, this variability may be explained by different forma-
   Note that, since there are more samples where PMF has             tion or evolution pathways or different levels of aging. We
been run compared to available OP measurements (around               can also point out that the industrial source had a very diverse
1700 concomitant OP and PMF samples compared to 2048                 chemical composition since it is related to different local in-
samples with a PMF solution), the discussion hereafter on the        dustrial processes.
source contributions to the OP takes into account the whole             Nevertheless, the geochemical stability of the majority of
PMF analysis, including days when models were not trained            PMF factors on a regional scale allows us to consider that
but predicted by the above-mentioned approach.                       these emission sources are rather homogeneous over France.

Atmos. Chem. Phys., 21, 11353–11378, 2021                                            https://doi.org/10.5194/acp-21-11353-2021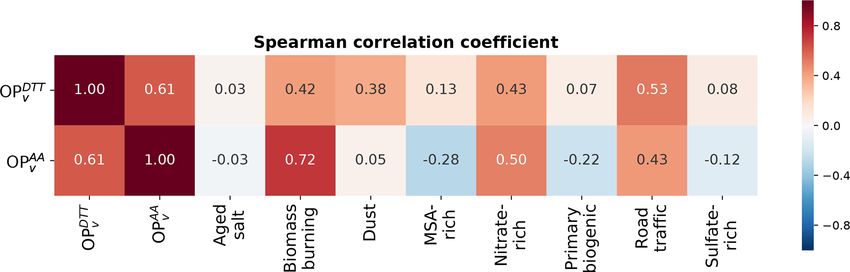
S. Weber et al.: Harmonized source apportionment of OP in 15 sites                                                                        11359

Table 1. Main PMF factors identified (at least at two-thirds of the series, i.e., 10 out of 15) and species used as proxies for the determination.

            Factor name             Number of        Main species used as tracers         General remarks
                                  sites identified
            Biomass burning             15           Levoglucosan, OC, EC, K+ , Rb        High in Alpine valley, strong seasonality
            Nitrate-rich                15           NO− 3 , NH4
                                                                +
                                                                                          Mostly in spring
            Primary biogenic            15           Polyols (arabitol, mannitol), OC     Strong seasonality
            Road traffic                14           OC, EC, Cu, Fe, Sb, Sn               Mixed exhaust and non-exhaust emission
            MSA-rich                    14           MSA                                  Strong seasonality
            Dust                        13           Al, Ti, Ca2+                         Episodic, some OC is present
            Sulfate-rich                13           SO2−       +
                                                        4 , NH4 , Se                      Some OC is present
            Aged salt                   12           Na , Mg , SO2−
                                                        +      2+
                                                                      4 , NO3
                                                                             −
                                                                                          Some OC is present

Figure 2. Box plot of OPDTT
                         v   and OPAAv seasonal values. The numbers in the x axis indicate the number of observations. Each box represents
one decile, and the black horizontal lines indicate the median of the distributions. Some values greater than 15.5 nmol min−1 m−3 are not
displayed for graphical purposes.

3.2   OP results and seasonality                                           with drastic increase or decrease within the time frame of a
                                                                           few days, similarly to the PM10 mass concentration. This be-
The 15 time series for both OPDTT and OPAA at each                         havior may be related to the formation of thermal inversion
site are presented on the website (http://getopstandop.u-ga.               layers in such valleys, leading to the accumulation of pollu-
fr/results?component=rd_ts, last access: 27 July 2021). A                  tants and the promotion of the secondary processes inducing
monthly aggregated view is given in Fig. 2 for OPDTT  v    and             increased formation of secondary organic aerosol (SOA) and
OPAAv  , respectively. As the  dataset  covered  complete  full            of key organic species, like polyaromatic quinones (Albinet
years, including the influence of different PM sources with                et al., 2008; Tomaz et al., 2017; Srivastava et al., 2018) or
different seasonal activities, the results obtained are repre-             humic-like substances (HULIS) (Baduel et al., 2010) with a
sentative of spatio-temporal patterns of the OPs at least over             significant impact on the OP.
France and probably over large parts of western Europe.                       Several sites exhibit much lower seasonality in the OP val-
   As reported previously by Calas et al. (2018, 2019), we ob-             ues, especially traffic sites (RBX and STG-cle), the urban
served a seasonality of both OPDTTv    and OPAA
                                              v , with higher              traffic site (NIC), or the industrial one (PdB). The lack of sea-
OP values during the colder months (October–March) com-                    sonality for some sites excludes the hypothesis of the OP be-
pared to the warmer months (April–September). We also                      ing driven only by synoptic meteorological parameters such
noted that during the winter period, the statistical distribu-             as sunshine or temperature, as it would impact all the sites
tion of OP values did not follow a normal distribution, and                similarly. It is clearly the difference in PM chemical com-
a significant variability was observed. This was especially                pounds and reactivity, together with the timing of emission,
the case for the sites located in the Alpine area (GRE-fr,                 that induces the seasonality of OP values when it is observed.
GRE-cb, VIF, CHAM, MNZ, PAS) showing stronger sea-                            For comparison with previous studies, the Spearman cor-
sonality compared to the other locations. Such specificity                 relation between chemical species, source contributions and
was already reported previously by Calas et al. (2019) to-                 OPs is also reported in Appendix A of this paper.
gether with some rapid variation of the OPDTT and OPAA ,

https://doi.org/10.5194/acp-21-11353-2021                                                   Atmos. Chem. Phys., 21, 11353–11378, 2021
11360 S. Weber et al.: Harmonized source apportionment of OP in 15 sites
3.3 Results of OP models for the main PMF sources We also observed a clear distinction between the intrin-
sic OP values for the different PM sources, with the median
3.3.1 Model accuracy and linear limitation ranging from 0.04 to 0.21 nmol min−1 µg−1 for the OPDTT
and from −0.00 to 0.17 nmol min−1 µg−1 for the OPAA . Such
The MLR statistical validation was carried out by a resid- results agree with previous studies reporting different re-
ual analysis between the OP observed and the OP recon- activities (or intrinsic OPs) for different sources based on
structed by the model. For this evaluation, the intrinsic OP receptor-model techniques (Ayres et al., 2008; Bates et al.,
of the sources was set to the mean of the 500 bootstrap val- 2015; Cesari et al., 2019; Costabile et al., 2019; Fang et al.,
ues. All but two sites present a very good correlation between 2016; Paraskevopoulou et al., 2019; Perrone et al., 2019;
observed and reconstructed OP (r 2 > 0.7) and a regression Verma et al., 2014; Weber et al., 2018; Zhou et al., 2019;
line close to unity (see Table S4; details and individual Daellenbach et al., 2020).
scatter plots are given at http://getopstandop.u-ga.fr/results? Concerning the difference between the two tests, a
component=op_obsvsmodel, last access: 27 July 2021). We road traffic source is the most reactive source towards
therefore consider our models valid, and each intrinsic OP OPDTT , with a value of about 0.21 nmol min−1 µg−1 . Such
(i.e., coefficient of the regression) may be explored individu- a value is almost twice as high as the ones observed for
ally to geochemically explain the observed OP. other significantly reactive sources, namely, primary bio-
However, despite our models being able to reproduce most genic sources (0.13 nmol min−1 µg−1 ), biomass burning
of the observations with normally distributed residuals, it (0.13 nmol min−1 µg−1 ), MSA-rich (0.12 nmol min−1 µg−1 ),
also tends to underestimate the highest values, and the resid- mineral dust (0.11 nmol min−1 µg−1 ) and sulfate-rich
uals are often heteroscedastics (i.e., the higher the values, (0.09 nmol min−1 µg−1 ). Based on the intrinsic OPAA
the higher the uncertainties). Then, the underlying hypoth- results, a small number of PM sources shows significant
esis of linearity between endogenous variables (PM concen- redox activity, as already pointed out in previous studies
tration of the sources) and exogenous variables (OPs) may (Bates et al., 2019, and references therein). Only the biomass
be deemed invalid. It is also important to note that nonlinear burning and road traffic sources show intrinsic OP values
processes are strongly suspected of the source apportionment significantly higher than 0 (0.17 and 0.14 nmol min−1 µg−1 ,
of OP, as already noted by Charrier et al. (2016) or Calas respectively). Overall, the OPDTT is sensitive to more
et al. (2018) and Samaké et al. (2017). As a result, future sources than the OPAA , as already pointed out by Fang
development on OP apportionment models should focus on et al. (2016) and Weber et al. (2018), and seems to target
this suspected nonlinearity, either by introducing covariation all the sources containing either metals or organic species.
terms or using nonlinear models such as neural networks, for However, it is not sensitive to the nitrate-rich source.
instance (Borlaza et al., 2021b). We then confirm what previous studies found for these
two assays, either by direct OP measurements at the emis-
3.3.2 Intrinsic OP of the main PMF sources
sion source or by source apportionment. It is however hard to
Even if the models reproduce the observations correctly, this directly compare the absolute values from our results to the
does not guarantee that the geochemical meaning extracted is literature since the measurement protocols used are highly
the same for each of the models; i.e., the intrinsic OPs of the variable from one study to another.
sources may completely differ from site to site. The question
3.3.3 Profile of intrinsic OP sources
is then to identify whether a given source contributes sim-
ilarly to the OP at all the sites. In other words, do all the The coefficients of variation (CVs, standard deviation over
models extract any general geochemical information relative the mean) of the intrinsic OPs are lowest for the biomass
to the OP? burning and primary road traffic for the DTT assay, with val-
Figure 3 presents the intrinsic OPDTT and OPAA for the ues of 0.50 and 0.38, respectively, as well as for the AA assay
selected subset of sources in terms of median and interquar- with values of 0.52 and 0.67, respectively. However, since
tile range (Q1 and Q3) to investigate the general information several intrinsic OPs are close to 0, the interquartile range
given by the different model. The values of mean and stan- (IQR) is also used to quantify the variability of intrinsic OP.
dard deviation and details per station for all sources are given
in Tables S5–S7. Biomass burning
For most of the sources identified, positive intrinsic OP
values were observed considering the whole dataset. Small The variability of the biomass burning intrinsic OP is some-
negative median values were only observed for the MSA- what site-dependent, with a low uncertainty within a given
rich factor for the AA assay associated with large variance. site but with slightly different intrinsic OPs between sites.
Such results highlighted again that airborne particles, what- This suggests that the variability is not linked to uncertain-
ever their sources of origin, have significant oxidative prop- ties of the MLR but may be due to actual local variations of
erties. the chemical composition of this profile.
Atmos. Chem. Phys., 21, 11353–11378, 2021 https://doi.org/10.5194/acp-21-11353-2021S. Weber et al.: Harmonized source apportionment of OP in 15 sites 11361
Figure 3. Median and interquartile range (solid bars and values in the figure) and mean (cross) of intrinsic OPDTT and OPAA values for the
sources identified for at least two-thirds of the site (i.e., 10 series). The number of data considered are n × N , with n the number of series
where the source was identified and N = 500 bootstraps: Road traffic: 7000, biomass burning: 7500, dust: 6500, primary biogenic: 7500,
nitrate-rich: 7500, sulfate-rich: 7500, MSA-rich: 7000, aged salt: 6000. The values of means and standard deviations for each site are given
in the Supplement.
This result contrasts with the fact that the biomass burn- with regard to the OPDTT and represent the most redox-active
ing was identified as displaying relatively homogeneous source.
chemical profiles between site profiles, with PD < 0.1 and For the OPAA , even if the CV is one of the lowest due
SID < 0.7 (Fig. S2). Actually, the variability of OP-intrinsic to the high intrinsic OP of this source on average, the
values may be related to species that are not directly mea- IQR is high. The different MLR models do not agree on
sured in our dataset. That is, polycyclic aromatic hydrocar- a common intrinsic OP, with values ranging from 0.02 to
bons (PAHs), oxy-PAHs, OH-PAHs, nitro-PAHs and espe- 0.35 nmol min−1 µg−1 , without clear distinction by typology
cially polyaromatic quinones could not be measured at each or groups of sites.
of the sites used in the present study. These compounds are The chemical profile of the road traffic presents noticeable
known to generate ROS and to contribute to the OP (Bolton variability between sites, and no distinction between exhaust
et al., 2000; Charrier and Anastasio, 2012; Chung et al., and non-exhaust emission is available with the current PMF
2006; McWhinney et al., 2013; Lakey et al., 2016; Jiang analysis. Although all the profiles agree with a high loading
et al., 2016; Tuet et al., 2019; Gao et al., 2020; Bates et al., of metals (notably Cd, Cu, Fe, Mo, Sb, and Sn) and organic
2019), have short lifetimes and are heavily influenced by carbon, the exact amount per microgram of PM differs from
the climatic condition (Miersch et al., 2019). Similarly, the site to site (http://getopstandop.u-ga.fr/results?component=
importance of the HULIS fraction within different biomass pmf_profiles, last access: 27 July 2021).
burning emissions might play a role in OP variability. Also, the higher variability of the AA test outputs, com-
pared to the DTT, suggests that some chemical species that
are not measured here may influence more the OPAA than
Road traffic the OPDTT of vehicular emissions, as for biomass burning
aerosols. These unmeasured species might vary in terms
For the DTT assay, the uncertainty of the road-traffic- of loading between sites due to the different traffic-related
intrinsic OP at each site lies in the uncertainties of the other sources, notably the extent of SOA or that of exhaust and
sites (but one, CHAM). Then, even if known with some un- non-exhaust emissions, which could have a high impact on
certainties, these sources behave similarly at a large scale OP, as shown by Daellenbach et al. (2020).
https://doi.org/10.5194/acp-21-11353-2021 Atmos. Chem. Phys., 21, 11353–11378, 202111362 S. Weber et al.: Harmonized source apportionment of OP in 15 sites
Nitrate-rich species appear to present intrinsic redox activity for the AA
assay. It is not clear however whether the DTT is reacting
The nitrate-rich factor, one of the most stable factors in with the organic species, with the metals, or both.
terms of chemical fingerprint, is mainly composed of nitrate The differences between the two groups of sites may be
and ammonium, and very low amounts of OC or metals are further explained by difference in the chemical profile of the
present. At some sites, sulfate is also partly apportioned in PMF factors. Indeed, since the dust factor at VIF highly dif-
this factor. Since nothing of this species is known to con- fers from the other dust factors with PD > 0.75 (mostly due
tribute to the OP, this factor presents logically almost null to a very low amount of OC∗ ) when compared to the other
intrinsic OP for both assays. sites, we expect to have different intrinsic OPs. The biggest
Interestingly, this factor correlates fairly well with difference between VIF and other sites for the dust factor
OPDTTv (r = 0.43) but is associated with the lowest intrin- relies on the very low amount of PM apportioned in this fac-
sic OPDTT value (0.04 nmol min−1 µg−1 ). This emphasizes tor, linked with important uncertainties. It is then expected
the need to apply a relevant technique for OP source appor- that this factor will present an uncertain intrinsic OP for this
tionment, beyond simple correlation. source at this site.
We then confirm previous analysis of the low impact of For the sites of VIF, AIX and RBX, it appears that they
secondary inorganic aerosols (SIA), at least for the nitrate also have higher loading in metals compared to other sites.
part, on OP measurement (Daellenbach et al., 2020) in favor Also, all three sites have important uncertainties associ-
of the subsequent moderate role of SIA in human toxicity ated with different metals (notably Cu, Sn or V; see http:
(Cassee et al., 2013). //getopstandop.u-ga.fr/results?component=pmf_unc, last ac-
cess: 27 July 2021). Finally, it is also hypothesized that un-
Sulfate-rich measured trace species might be responsible for these differ-
ences, possibly coming from road dust resuspension and/or
Similarly to the nitrate-rich factor, this secondary inorganic secondary processes leading to oxy-PAHs (Ringuet et al.,
factor displays rather stable chemical composition at all the 2012a, b) or HULIS (Srivastava et al., 2018).
sites. It is mainly composed of sulfate and ammonium but
also organic carbon (between 5 % and 33 % of total OC∗ ) and MSA-rich (secondary organic aerosols)
Se. The latter two species present some site-to-site discrep-
ancies, and it should be mentioned that, when adding com- It has been shown that biogenic SOA species generally con-
plementary organic markers such as 3-MBTCA to some sets tribute to the OPDTT or to the generation of ROS (Jiang et al.,
of PMF input data, the sulfate-rich factor has been shown to 2016; Tuet et al., 2017b; Park et al., 2018; Kramer et al.,
split into two factors, revealing a biogenic SOA factor (Bor- 2016; Manfrin et al., 2019). In our study, the MSA-rich fac-
laza et al., 2021a). Without these molecular markers, such tor is the only one strictly included in this category. However,
mixing in the present study might explain a fraction of the the intrinsic OP of the MSA-rich source presents high vari-
variability of the OC apportioned and then of the intrinsic ability between sites, with CVs of 3.1 and 7.8 for the DTT
OP. and AA assays, respectively, and the highest IQR, all sites
Interestingly, this factor does present an intrinsic OP for combined, with no consistent similarity by typology or prox-
the DTT assay but almost none for the AA assay. Then, most imity. For instance, GRE-cb and VIF are within 15 km with
probably the OC∗ apportioned in this factor affects only the similar sampling periods but present, respectively, the high-
DTT assay and not the AA one, which contrasts with the est and lower intrinsic OPDTT for this factor. We also observe
biomass burning and road traffic sources (see above). important variability within each MLR model result at every
site. This secondary organic source appears to be the most
Mineral dust variable source in terms of intrinsic OPs, notably for the DTT
assay.
The mineral dust displays a rather low variability when The MSA-rich factor is identified thanks to a single marker
considering all datasets, but a deeper analysis showed two (MSA), and very few studies only have reported it so far (Sri-
groups of sites: AIX-RBX-VIF vs. all other sites. The first vastava et al., 2019; Lanzafame et al., 2020; Borlaza et al.,
group presents a high intrinsic OP for both assays (around 2021a). As a result, we do not know for instance the load-
0.25 nmol min−1 µg−1 OPDTT and 0.16 nmol min−1 µg−1 ing of HULIS, quinone or isoprene-derived compounds con-
from OPAA ), whereas sites from the second group display tained in this factor nor the amount of aging it presents at
halved (around 0.1 nmol min−1 µg−1 for OPDTT ) or almost each site. The exact primary sources or processes leading to
null (OPAA ) intrinsic OPs. this factor are still under discussion for non-Arctic regions
A first conclusion is that 80 % of the sites present a com- (Golly et al., 2019). Hence, these uncertainties in the addi-
mon intrinsic OP for the dust source, hence the low IQR ob- tional chemical compounds included in this factor, despite
served for this source. This factor apportions some OC∗ but the excellent tracer capability of the MSA itself, might ex-
most of the Ca2+ , Al, Co, Cs, Mn and Sr. Then, none of these plain the diversity of its observed intrinsic OPs.
Atmos. Chem. Phys., 21, 11353–11378, 2021 https://doi.org/10.5194/acp-21-11353-2021S. Weber et al.: Harmonized source apportionment of OP in 15 sites 11363
Moreover, this factor represents a low amount of PM mass. two sites presented an HFO factor, and similarly to previous
Its important uncertainties apportioned by the different PMF studies (Hu et al., 2008; Kuang et al., 2017; Moldanová et al.,
for this factor (between 0.7 % and 5.5 % of the total PM10 2013; Mousavi et al., 2019; Wang et al., 2020), it suggests
mass) make it unclear whether the variability is mainly due to that the PM that originated from this source may significantly
the sources’ chemical component variability or to the inver- contribute to the total OP in and around harbor cities.
sion method used. Hence, we prefer not to conclude a clear For the industrial factor, and as already stated, the chemi-
effect of this source on the OP. cal composition profile highly varies from site to site for the
six sites where it is determined. As a matter of fact, the intrin-
Primary biogenic organic aerosols sic OPs of this profile are also highly variable. The intrinsic
OPDTT are high for GRE-cb and GRE-fr_2017 (0.52 ± 0.30
The primary biogenic source, mainly traced by polyols, and 0.37±0.27 nmol min−1 µg−1 , respectively), as are the in-
presents some variability for the OPDTT . Samaké et al. (2017) trinsic OPAA (0.82 ± 0.29 and 0.61 ± 0.17 nmol min−1 µg−1 ,
highlighted that spores or bacteria do contribute to the OPDTT respectively). However, both are close to 0 for the other sites
and OPAA activities, even when the microbial cells are dead. where this factor is found (PdB, AIX, TAL and VIF). The
However, the authors also present the inhibition of the DTT high intrinsic OP again suggests the role of metals in the OP
loss rate in the presence of 1,4-naphthoquinone or Cu. The of PM; however, since this factor has strong uncertainties as-
presence of both synergistic and antagonistic effects between sociated with the PMF results and then with the intrinsic OP,
species and microbiota might explain the variability of in- further work on the source profiles is needed to draw firmer
trinsic OPDTT observed in Fig. 3, reflecting the different lo- conclusions.
cal microbiology carried by the PM, or covariations of the
primary biogenic source with other metals or quinone-rich Overall geochemical agreement
sources for instance.
Another hypothesis to explain the variability of the intrin- Finally, despite the differences within PMF solutions from
sic OPs might be the “aging” of this factor, since Samaké one site to another, including the slightly different number
et al. (2019b) pointed out that some secondary species may of source factors and the different OP signals, the rather low
be incorporated in this factor at some sites, possibly mak- variability of the intrinsic OP determined for a given source
ing it a mix of primary biogenic and SOA (see also Waked suggests that most of the sources of PM behave coherently
et al., 2014). SOA mixed in the primary biogenic factor may with regards to the OP over a large geographical area in
then influence the intrinsic OP of this factor in different ways, France. It then supports the idea that, at the national scale,
similarly to our hypothesis for the MSA-rich factor. the sources described above have a rather stable intrinsic OP.
We also stressed the importance of the underlying source ap-
Aged salt portionment method (here the PMF) and the investigation of
2− its uncertainties in order to interpret the variabilities of the
Being mostly composed of Cl− , NO− 3 , SO4 , Na
+ and
intrinsic OP.
Mg2+ , this factor barely reacts with anti-oxidants (in both
the DTT and AA assays). However, the variability observed 3.4 Contribution of the sources to the OPs
for this factor is suspected of coming from the aging process,
leading to the aggregation of organic compounds (between The relative importance of the contributions of the sources
0 % and 9 % of the total OC∗ apportioned in this factor). to the total PM10 OPs is weighted by their different intrinsic
OPs. The question, therefore, is to what extent the contribu-
Local PMF factors tions of the sources to the OPs differ from their contributions
to the PM mass concentration. In this part, we present an ag-
Some other factors were obtained in a limited set of PMF gregated view of the seasonal contribution of the sources to
outputs, and their chemical profiles are somewhat variable. It the OP in Fig. 4 and the daily contribution in Figs. 5 and 6,
is however interesting to discuss their local impact on OP. considering all sites. Details per sites are presented in the
The HFO source is identified at MRS-5av and PdB, both website provided herewith as the Supplement.
sites being located close to harboring activities in large We would like to stress here that our dataset included an
ports on the Mediterranean coast. It presents an intrinsic important proportion of Alpine sites as well as urban sites.
OPDTT of 0.51 ± 0.14 and 0.21 ± 0.04 nmol min−1 µg−1 , re- Then, the extrapolation to the whole of France or to other
spectively, and an intrinsic OPAA of 0.04 ± 0.02 and 0.11 ± regions of western Europe should be done cautiously.
0.03 nmol min−1 µg−1 , respectively. The intrinsic OPDTT is
then on average higher than the road traffic one, making HFO 3.4.1 Seasonality of the contribution by mass or OPs
the second contributor of the daily mean and median source
contribution at MRS-5av for the OPDTT contribution and the As already shown by some previous studies in France (Petit
fourth one for the OPAA contribution (see the website). For et al., 2019; Srivastava et al., 2018; Waked et al., 2014; Weber
the PdB site, the contributions are a bit lower. Although only et al., 2019; Favez et al., 2021), the seasonal mean contribu-
https://doi.org/10.5194/acp-21-11353-2021 Atmos. Chem. Phys., 21, 11353–11378, 202111364 S. Weber et al.: Harmonized source apportionment of OP in 15 sites
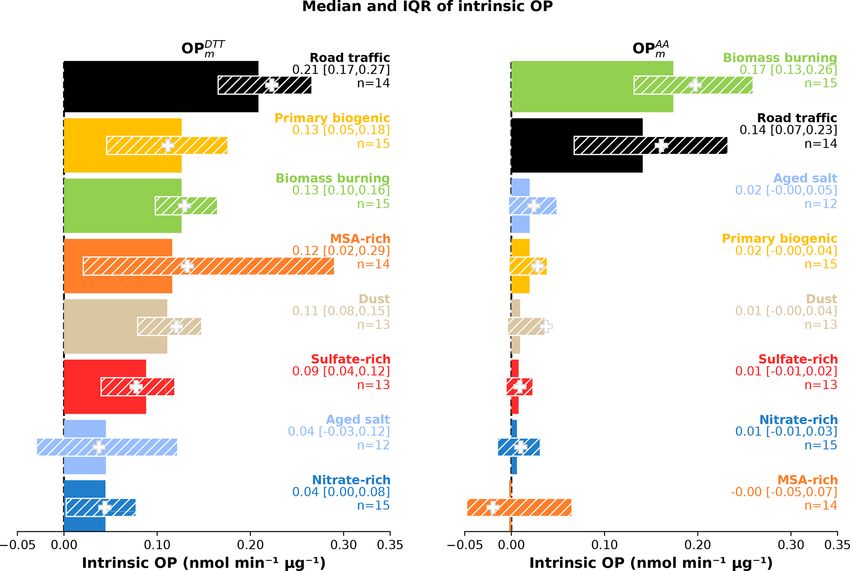
Figure 4. Mean monthly contribution of the eight main sources to the (a) PM10 mass, (b) OPDTT v and (c) OPAA
v , taking into account each
source contribution of every site; their respective normalized contributions are presented in (d) PM10 mass, (e) OPDTT
v and (f) OPAA
v .
Figure 5. Averaged daily contribution of the sources to (a) the PM10 mass, (b) the OPDTT
v and (c) the OPAA
v . The bars represent the mean,
and the error bars represent the 95 % confidence interval of the mean.
Atmos. Chem. Phys., 21, 11353–11378, 2021 https://doi.org/10.5194/acp-21-11353-2021S. Weber et al.: Harmonized source apportionment of OP in 15 sites 11365
Figure 6. Median daily contribution of the sources to (a) the PM mass, (b) the OPDTT
v and (c) the OPAA
v . The bars represent the mean and
the error bars represent the 95 % confidence interval of the median.
tions to the PM10 mass show the importance of the biomass 3.4.2 Daily mean and median contribution: insights for
burning source, followed by secondary inorganic (sulfate- exposure
rich and nitrate-rich), dust and road traffic. As a direct conse-
quence of the different intrinsic OPs for these sources, we do A concise view of the same results, this time on the daily-
observe a redistribution of their relative importance for the aggregated basis, is provided in Figs. 5 and 6, presenting the
total OP. That is, the nitrate-rich source that may contribute contributors to PM10 mass and OPs, ranked in decreasing or-
a significant amount to the PM10 mass, notably in spring, der. Figure 5 reports the typical “mean” daily value, a pa-
barely contributes to the OPDTT
v or to the OPAAv , in agreement rameter generally used in the atmospheric community, while
with Daellenbach et al. (2020). Conversely, the road traffic Fig. 6 reports the “median” daily value, often used in epi-
contributes about 15 % during summer to the mean PM10 demiological studies in order to discuss the chronic exposure
mass but represents more than 50 % of the mean OPAA v in of the population and avoid the high impact of infrequent low
the same period (Fig. 4d–f). However, the biomass burning or high events that highly influence the mean value.
sources are still major contributors to both the OPDTT v and Due to the non-normality of the contribution and the high
OPAA
v during the winter months. We note that the primary contributions of some sources at some sites (for instance, the
biogenic source also contributes to the OPDTT v but to a lesser biomass burning source in Alpine valleys), the results highly
extent to the OPAAv . Finally, the dust source is an important differ when considering the mean or the median contribu-
contributor to the OPDTT
v but not to the OP AA
v . These results tions, and the two statistical indicators may not address the
confirm and extend what previous studies have already found same questions (the mean is more related to the identifica-
(Cesari et al., 2019; Daellenbach et al., 2020; Weber et al., tion of the major source contributors and the median to the
2018). Overall, the main contributors to OPs are the three exposure of the population). The skewness of the distribu-
factors suspected of including anthropogenic SOA (biomass tion is not surprising as some high-PM10 events (i.e., a short
burning, road traffic and dust, including possible resuspen- time event in the dataset) were present in our measurements.
sion of road dust for the latter one). It follows that, consid- This is also specifically anticipated in Alpine areas (CHAM,
ering the seasonality of OPs, regulations should target the PAS, MNZ, VIF, GRE-cb, GRE-fr_2013 and GRE-fr_2017),
biomass burning emission in order to decrease the PM10 OPs where the frequent development of atmospheric thermal in-
during winter by a large amount but also the road traffic that version layers in winter is causing increased pollutant con-
contributes homogeneously to both OPs around the whole centrations.
year. We observed (Fig. 5) a redistribution of the daily mean
contribution sources’ rank between the PM10 mass, OPDTT v
https://doi.org/10.5194/acp-21-11353-2021 Atmos. Chem. Phys., 21, 11353–11378, 2021You can also read