BAP1 constrains pervasive H2AK119ub1 to control the transcriptional potential of the genome
←
→
Page content transcription
If your browser does not render page correctly, please read the page content below
Downloaded from genesdev.cshlp.org on October 22, 2021 - Published by Cold Spring Harbor Laboratory Press

BAP1 constrains pervasive H2AK119ub1
to control the transcriptional potential
of the genome
Nadezda A. Fursova, Anne H. Turberfield, Neil P. Blackledge, Emma L. Findlater, Anna Lastuvkova,
Miles K. Huseyin, Paula Dobrinić, and Robert J. Klose
Department of Biochemistry, University of Oxford, Oxford OX1 3QU, United Kingdom

Histone-modifying systems play fundamental roles in gene regulation and the development of multicellular
organisms. Histone modifications that are enriched at gene regulatory elements have been heavily studied, but the
function of modifications found more broadly throughout the genome remains poorly understood. This is exem-
plified by histone H2A monoubiquitylation (H2AK119ub1), which is enriched at Polycomb-repressed gene pro-
moters but also covers the genome at lower levels. Here, using inducible genetic perturbations and quantitative
genomics, we found that the BAP1 deubiquitylase plays an essential role in constraining H2AK119ub1 throughout
the genome. Removal of BAP1 leads to pervasive genome-wide accumulation of H2AK119ub1, which causes
widespread reductions in gene expression. We show that elevated H2AK119ub1 preferentially counteracts Ser5
phosphorylation on the C-terminal domain of RNA polymerase II at gene regulatory elements and causes reductions
in transcription and transcription-associated histone modifications. Furthermore, failure to constrain pervasive
H2AK119ub1 compromises Polycomb complex occupancy at a subset of Polycomb target genes, which leads to their
derepression, providing a potential molecular rationale for why the BAP1 ortholog in Drosophila has been charac-
terized as a Polycomb group gene. Together, these observations reveal that the transcriptional potential of the
genome can be modulated by regulating the levels of a pervasive histone modification.
[Keywords: chromatin; epigenetics; histone modification; gene expression; transcription; BAP1; deubiquitylase;
histone monoubiquitylation; H2AK119ub1; Polycomb]
Supplemental material is available for this article.
Received November 13, 2020; revised version accepted March 2, 2021.

In eukaryotes, DNA is wrapped around histones to form                          Genome-wide profiling has revealed that some histone
nucleosomes and chromatin, which packages the genome                        modifications are specifically enriched at gene promoters
inside the nucleus. In addition to their structural role, his-              and distal regulatory elements (Barski et al. 2007; Ernst
tones are subject to a variety of posttranslational modifi-                 and Kellis 2010; Kharchenko et al. 2011; Zhou et al.
cations (PTMs), which have been proposed to play                            2011; Ho et al. 2014), where they have been proposed to
important roles in regulation of gene expression and other                  regulate chromatin accessibility and work with the tran-
chromosomal processes (Groth et al. 2007; Kouzarides                        scriptional machinery to control gene expression (Lee
2007; Bannister and Kouzarides 2011; Zhao and Garcia                        et al. 1993; Vettese-Dadey et al. 1996; Pray-Grant et al.
2015; Hauer and Gasser 2017). If chromatin-modifying                        2005; Wysocka et al. 2006; Vermeulen et al. 2007; Lau-
systems are perturbed, this can lead to profound alter-                     berth et al. 2013; Zhang et al. 2017a). However, it has
ations in gene expression, resulting in severe developmen-                  also emerged that there are other histone modifications
tal disorders and cancer (Audia and Campbell 2016; Atlasi                   that are extremely abundant and cover broad regions of
and Stunnenberg 2017; Bracken et al. 2019; Zhao and                         the genome, extending far beyond genes and gene regulato-
Shilatifard 2019). However, for many histone modifica-                      ry elements (Kharchenko et al. 2011; Ferrari et al. 2014; Lee
tions, the mechanisms that control their levels through-                    et al. 2015; Kahn et al. 2016; Zheng et al. 2016; Carelli et al.
out the genome and ultimately how this influences gene                      2017; Fursova et al. 2019). Much less effort has been placed
expression remain poorly understood.                                        on studying these more pervasive histone modifications,
                                                                            raising the possibility that they could also have important
                                                                            and previously underappreciated roles in gene regulation.
Corresponding author: rob.klose@bioch.ox.ac.uk
Article published online ahead of print. Article and publication date are
online at http://www.genesdev.org/cgi/doi/10.1101/gad.347005.120. Free-     © 2021 Fursova et al. This article, published in Genes & Development, is
ly available online through the Genes & Development Open Access             available under a Creative Commons License (Attribution 4.0 Internation-
Option.                                                                     al), as described at http://creativecommons.org/licenses/by/4.0/.

                  GENES & DEVELOPMENT 35:1–22 Published by Cold Spring Harbor Laboratory Press; ISSN 0890-9369/21; www.genesdev.org               1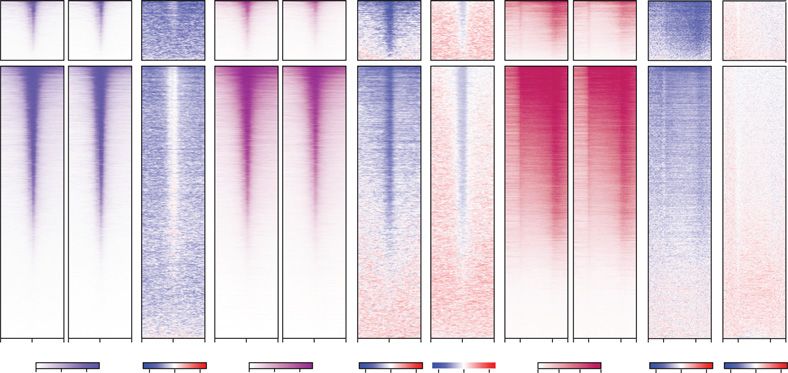
Downloaded from genesdev.cshlp.org on October 22, 2021 - Published by Cold Spring Harbor Laboratory Press

Fursova et al.

   The Polycomb repressive complex 1 (PRC1) is an E3                    To dissect how BAP1 controls H2AK119ub1 levels and
ubiquitin ligase that catalyzes monoubiquitylation of his-            gene expression, here, we integrate genome editing, in-
tone H2A (H2AK119ub1) (de Napoles et al. 2004; Wang                   ducible genetic perturbations, and quantitative genomics.
et al. 2004; Buchwald et al. 2006). PRC1 is targeted to               We found that BAP1 functions to constrain pervasive
CpG island-associated gene promoters where it can                     H2AK119ub1 throughout the genome, with no preference
deposit high levels of H2AK119ub1 (Ku et al. 2008; Farcas             for gene promoters or distal regulatory elements. We dem-
et al. 2012; He et al. 2013; Wu et al. 2013; Bauer et al.             onstrate that by counteracting pervasive H2AK119ub1,
2016), and this is central to Polycomb-mediated gene re-              BAP1 plays a fundamental role in facilitating gene expres-
pression (Endoh et al. 2012; Blackledge et al. 2014, 2020;            sion. In the absence of BAP1, elevated H2AK119ub1
Tsuboi et al. 2018; Fursova et al. 2019; Tamburri et al.              broadly inhibits Serine 5 phosphorylation (Ser5P) on the
2020). A second Polycomb repressive complex, PRC2, is                 C-terminal domain (CTD) of RNA polymerase II at gene
recruited to the same sites (Boyer et al. 2006; Bracken               regulatory elements and causes widespread reductions
2006; Li et al. 2017a; Perino et al. 2018), where it deposits         in transcription and transcription-associated histone
histone H3 lysine 27 methylation (H3K27me3) (Cao et al.               modifications, without limiting chromatin accessibility.
2002; Czermin et al. 2002; Kuzmichev 2002; Müller et al.              Finally, we discover that a subset of Polycomb target
2002), leading to the formation of transcriptionally repres-          genes rely on BAP1 for their silencing and provide a mech-
sive Polycomb chromatin domains that have high levels of              anistic rationale for how BAP1 can indirectly support Pol-
PRC1, PRC2, and their respective histone modifications                ycomb-mediated gene repression. Together, these
(Mikkelsen et al. 2007; Ku et al. 2008). In addition to               observations demonstrate how the levels of a pervasive
this punctate high-level enrichment of H2AK119ub1 at                  histone modification must be appropriately controlled to
Polycomb target gene promoters, we and others have re-                enable the transcriptional potential of the genome.
cently demonstrated that H2AK119ub1 is also found
broadly throughout the genome, albeit at much lower
levels (Lee et al. 2015; Kahn et al. 2016; Fursova et al.             Results
2019). However, whether this genome-wide pool of
                                                                      BAP1 functions pervasively throughout the genome
H2AK119ub1 influences gene expression has remained
                                                                      to constrain H2AK119ub1
enigmatic.
   Interestingly, H2AK119ub1 is highly dynamic (Seale                 Given our recent discovery that H2AK119ub1 is deposited
1981), and a number of deubiquitylating enzymes                       more broadly throughout the genome than previously ap-
(DUBs) have been proposed to regulate its levels (for re-             preciated (Fursova et al. 2019), we set out to determine
view, see Belle and Nijnik 2014; Aquila and Atanassov                 where in the genome BAP1 functions to control the levels
2020). The most extensively characterized and evolution-              of H2AK119ub1 and how this influences gene expression.
arily conserved of these DUBs is BAP1, which interacts                To address these important questions, we developed a
with ASXL proteins to form the Polycomb repressive deu-               BAP1 conditional knockout mouse embryonic stem cell
biquitinase complex (PR-DUB) (Scheuermann et al. 2010;                (ESC) line (Bap1fl/fl) in which addition of tamoxifen
Wu et al. 2015; Hauri et al. 2016; Kloet et al. 2016; Sahtoe          (OHT) enables inducible removal of BAP1, allowing us to
et al. 2016; Campagne et al. 2019). Previous attempts to              capture the primary effects that BAP1 loss has on
understand how BAP1 regulates gene expression and                     H2AK119ub1 and gene expression. Importantly, tamoxi-
whether this relies on its H2AK119ub1 deubiquitylase ac-              fen treatment of Bap1fl/fl cells resulted in a complete loss
tivity have primarily focused on examining how the PR-                of BAP1 protein, while the levels of BAP1-interacting part-
DUB complex is targeted to gene promoters and distal reg-             ners were largely unchanged (Fig. 1A). In line with previous
ulatory elements and how this regulates binding and/or                observations in BAP1 knockout mouse ESCs and human
activity of chromatin-modifying transcriptional coactiva-             cancer cell lines (Wang et al. 2018; Campagne et al. 2019;
tors (Li et al. 2017b; Wang et al. 2018; Campagne et al.              He et al. 2019; Kolovos et al. 2020), Western blot analysis
2019; Kuznetsov et al. 2019; Kolovos et al. 2020; Szcze-              showed that H2AK119ub1 levels were markedly increased
panski et al. 2020). While this has revealed that BAP1                following BAP1 removal, whereas H2BK120ub1 was unaf-
can remove H2AK119ub1 at specific loci, its primary                   fected (Fig. 1B).
site of action in the genome and the mechanisms by                       Having shown that conditional knockout of BAP1 leads
which it controls gene expression have appeared to be con-            to an increase in H2AK119ub1 (Fig. 1B), we set out to
text-dependent and in some cases difficult to reconcile               define where in the genome H2AK119ub1 was elevated
with the known roles of H2AK119ub1 in gene regulation.                using an unbiased quantitative genomic approach. To
Therefore, how H2AK119ub1 levels in the genome are                    achieve this, we carried out calibrated ChIP-seq (cChIP-
modulated by BAP1 and how this influences transcription               seq) for H2AK119ub1 before and after removal of BAP1.
remains poorly defined. Addressing these questions is par-            Remarkably, this revealed a major and widespread accu-
ticularly important in the light of the essential role                mulation of H2AK119ub1, which was evident when we
that BAP1 plays as a tumor suppressor (Ventii et al.                  visualized changes in H2AK119ub1 across an entire chro-
2008; Dey et al. 2012; Carbone et al. 2013; Murali et al.             mosome and also when we focused on individual regions
2013; Daou et al. 2015) and could provide important                   of chromosomes (Fig. 1C; Supplemental Figs. S1A, S2D).
new insight into how BAP1 dysfunction causes cellular                 Importantly, the magnitude of H2AK119ub1 accumula-
transformation.                                                       tion appeared to be largely uniform throughout the

2       GENES & DEVELOPMENT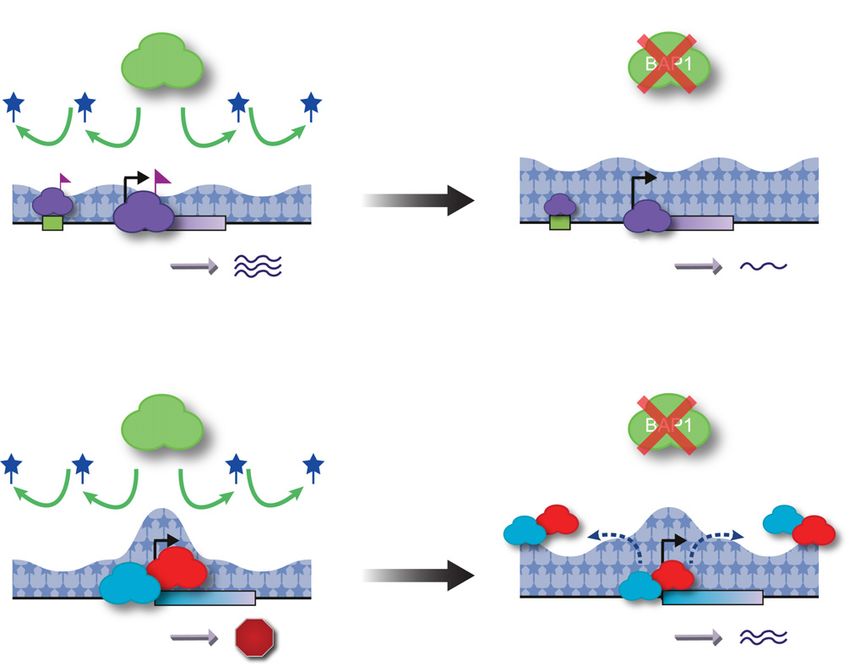
Downloaded from genesdev.cshlp.org on October 22, 2021 - Published by Cold Spring Harbor Laboratory Press

                                                                                                  BAP1 counteracts pervasive H2AK119ub1

           A                      B                                                      D

           C                                                                     E

Figure 1. BAP1 functions pervasively throughout the genome to constrain H2AK119ub1. (A) Western blot analysis for BAP1 and other
subunits of the PR-DUB complex (ASXL1 and FOXK1) in untreated (UNT) and OHT-treated (OHT) Bap1fl/fl ESCs. BRG1 is shown as a
loading control. (B) Western blot analysis (left panel) and quantification (right panel) of H2AK119ub1 and H2BK120ub1 levels relative
to histone H3 in untreated and OHT-treated Bap1fl/fl ESCs. Error bars represent SEM (n = 3). P-values denote the result of a paired two-
tailed Student’s t-test. (C ) A chromosome density plot showing H2AK119ub1 cChIP-seq signal across chromosome 18 in Bap1fl/fl
ESCs (untreated and OHT-treated) with an expanded snapshot of a region on chromosome 18 shown below. BioCAP-seq and RING1B
cChIP-seq in wild-type ESCs are also shown to indicate the location of CGIs that are occupied by PRC1. (D) Box plots comparing log2
fold changes in H2AK119ub1 cChIP-seq signal at gene regulatory elements (enhancers and promoters), gene bodies, and intergenic regions
in Bap1fl/fl ESCs following OHT treatment. (E) Box plots comparing log2 fold changes in H2AK119ub1 cChIP-seq signal following OHT
treatment in Bap1fl/fl ESCs across different chromatin states derived from unsupervised genome segmentation using ChromHMM. Chro-
matin states are grouped based on the underlying gene regulatory elements (GREs) and transcriptional activity. The dashed gray line in-
dicates the overall change in H2AK119ub1 levels in the genome as determined by its median value in intergenic regions.

genome (Fig. 1C), showing no preference for gene regulato-             affected and displayed similar increases in H2AK119ub1
ry elements, including promoters and enhancers (Fig. 1D;               (Fig. 1E; Supplemental Fig. S2C,D). Interestingly, these ef-
Supplemental Fig. S2A), where BAP1 has been previously                 fects appeared to be less pronounced at Polycomb-en-
proposed to function (Wang et al. 2018; Campagne et al.                riched chromatin states (Fig. 1E). However, a closer
2019; Kuznetsov et al. 2019). To characterize the effect of            examination revealed that these regions gained similar
BAP1 removal on H2AK119ub1 in more detail, we em-                      amounts of H2AK119ub1 to the rest of the genome (Sup-
ployed an unsupervised ChromHMM classification ap-                     plemental Fig. S2C), with higher initial levels of
proach (Ernst and Kellis 2012) to segment the genome                   H2AK119ub1 likely accounting for the smaller apparent
into 13 chromatin states encompassing all major function-              fold changes following BAP1 removal (Fig. 1E). Further-
al genomic annotations (Supplemental Fig. S2B) and exam-               more, states encompassing actively transcribed genes
ined changes in H2AK119ub1 across these distinct states.               also showed a less pronounced increase in H2AK119ub1
This revealed that all chromatin states were significantly             (Fig. 1E; Supplemental Fig. S2C), possibly due to the

                                                                                                        GENES & DEVELOPMENT           3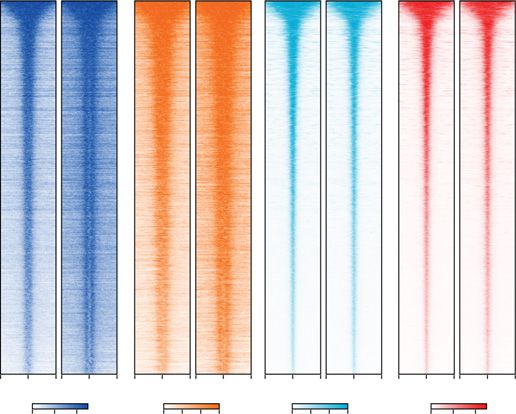
Downloaded from genesdev.cshlp.org on October 22, 2021 - Published by Cold Spring Harbor Laboratory Press

Fursova et al.

previously proposed antagonism between the Polycomb                   genes were derepressed following catalytic inactivation
system and transcription (Klose et al. 2013; Riising et al.           of PRC1 regardless of whether BAP1 was disrupted (Fig.
2014; Beltran et al. 2016). Together, these observations              2A; Supplemental Fig. S3K). Therefore, we conclude that
demonstrate that BAP1 functions pervasively and in-                   BAP1 counteracts accumulation of H2AK119ub1
discriminately throughout the genome to constrain                     throughout the genome, and in its absence elevated
H2AK119ub1.                                                           H2AK119ub1 causes widespread inhibition of gene
                                                                      expression.
Pervasive accumulation of H2AK119ub1 in the absence
of BAP1 causes widespread reductions in gene expression               BAP1 counteracts pervasive H2AK119ub1 to promote
                                                                      Ser5 phosphorylation on the CTD of RNA polymerase II
Given that H2AK119ub1 plays a central role in PRC1-me-
                                                                      at gene regulatory elements
diated gene repression (Endoh et al. 2012; Blackledge et al.
2020; Tamburri et al. 2020), we were curious to determine             To understand how accumulation of H2AK119ub1 coun-
what effect BAP1 removal and the resulting accumulation               teracts gene expression, we examined how RNA polymer-
of H2AK119ub1 throughout the genome would have on                     ase II (Pol II) was affected after BAP1 removal. To achieve
gene expression. Therefore, we carried out calibrated nu-             this, we carried out cChIP-seq to quantitate total Pol II
clear RNA sequencing (cnRNA-seq) in our conditional                   levels and also examined its phosphorylation states,
BAP1 knockout cells. This revealed that removal of                    which are associated with transcription initiation
BAP1 caused widespread changes in gene expression,                    (Ser5P) and elongation (Ser2P) (Buratowski 2009; Harlen
with the majority of genes exhibiting reduced expression              and Churchman 2017). When we inspected genes whose
(Fig. 2A). Remarkably, we found that 6440 genes (∼44%                 expression was significantly reduced following BAP1 re-
of all expressed genes) (Supplemental Fig. S3A) showed                moval, we found that levels of Pol II and its phosphorylat-
at least a 20% reduction in expression. Of these, 2828                ed forms were decreased at promoters and over gene
genes (∼20% of all expressed genes) were significantly re-            bodies (Fig. 3A,C; Supplemental Fig. S4A–C). The reduc-
duced by at least 1.5-fold, indicating that BAP1 plays a              tion in Ser2P in gene bodies was similar in magnitude to
broad role in promoting gene expression.                              the decrease in total Pol II levels (Fig. 3A,C,D), indicating
   Although reductions in gene expression following BAP1              that elongation-associated phosphorylation was not spe-
removal were widespread, expression of some genes was                 cifically disrupted, despite reduced transcription. In con-
more severely affected than others. Importantly, the ma-              trast, the reduction in Ser5P at the promoters of these
jority of genes showing significantly reduced expression              genes was larger in magnitude than the decrease in Pol II
were not classical Polycomb target genes (Fig. 2B; Supple-            occupancy (Fig. 3A,C,D; Supplemental Fig. S4A–C), sug-
mental Fig. S3B). However, interestingly, these genes were            gesting that elevated H2AK119ub1 limits Ser5 phosphor-
often found in regions of the genome that had higher lev-             ylation on the CTD of Pol II, and this may lead to reduced
els of H2AK119ub1 in wild-type cells and, in the absence              transcription and gene expression.
of BAP1, also acquired higher levels of H2AK119ub1 than                  Given that removal of BAP1 caused pervasive accumu-
genes that were not significantly affected (Fig. 2C–E; Sup-           lation of H2AK119ub1 throughout the genome (Fig. 1), we
plemental Fig. S3C–F). Importantly, the increase in                   wondered whether the repressive effects of this histone
H2AK119ub1 was not specific to the promoters or en-                   modification on transcription may in fact extend beyond
hancers of these genes but was evident across the entire              the subset of genes that showed significant reductions in
gene and flanking regions (Fig. 2D,E; Supplemental Fig.               gene expression. When we examined genes whose expres-
S3C–F). Together, these observations suggest that wide-               sion did not change significantly after BAP1 removal, we
spread reductions in gene expression following BAP1 re-               found that the occupancy of Pol II at their promoters
moval likely result from pervasive accumulation of                    was only marginally affected, but there were widespread
H2AK119ub1, with some genes being more susceptible                    reductions in the levels of Pol II and Ser2P over gene bod-
to these effects than others.                                         ies (Fig. 3A; Supplemental Fig. S4A,B,D), which were sim-
   To directly test whether elevated H2AK119ub1                       ilar in magnitude (Fig. 3A; Supplemental Fig. S4E).
was responsible for gene repression in the absence of                 Importantly, these effects on Pol II in the gene body corre-
BAP1, we developed an inducible mouse ES cell line                    lated well with changes in transcript levels (Supplemental
(PRC1CPM;Bap1fl/fl) in which we could simultaneously                  Fig. S4F), indicating that elevated H2AK119ub1 causes
disrupt BAP1 and inactivate PRC1 catalysis to remove                  widespread reductions in transcription and gene expres-
H2AK119ub1 (Supplemental Fig. S3G,H; Blackledge                       sion (Supplemental Fig. S4G), despite only a subset of
et al. 2020). We then carried out cnRNA-seq and com-                  genes being captured as having significantly reduced ex-
pared the effects on gene expression caused by concurrent             pression in cnRNA-seq analysis. Importantly, in contrast
removal of BAP1 and H2AK119ub1 with the effects                       to Pol II occupancy, which was only modestly affected,
caused by removing BAP1 or H2AK119ub1 individually                    Ser5P was markedly reduced at the promoters of all genes,
(Fig. 2A; Supplemental Fig. S3I). Strikingly, in the absence          including those whose expression did not change signifi-
of H2AK119ub1, removal of BAP1 no longer caused wide-                 cantly after BAP1 removal (Fig. 3A,E,F; Supplemental
spread reductions in gene expression (Fig. 2A,C,F,G; Sup-             Fig. S4A–E,H). This suggests that the widespread reduc-
plemental Fig. S3J), indicating that H2AK119ub1 was                   tions in transcription following BAP1 removal are likely
required for these effects. In contrast, Polycomb target              linked to the observed reductions in Ser5P. Since the

4       GENES & DEVELOPMENT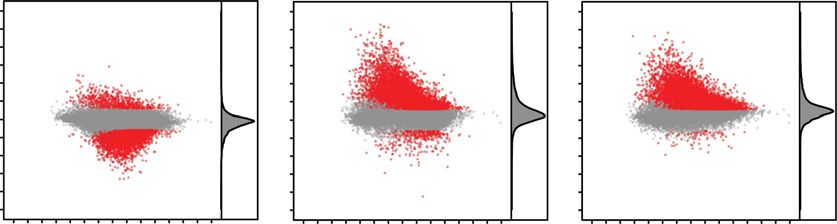
Downloaded from genesdev.cshlp.org on October 22, 2021 - Published by Cold Spring Harbor Laboratory Press

                                                                                                         BAP1 counteracts pervasive H2AK119ub1

       A                                                                                                    B

       C                                                             E

       D                                                                 F                       G

Figure 2. Pervasive accumulation of H2AK119ub1 in the absence of BAP1 causes widespread reductions in gene expression. (A) MA plots
showing log2 fold changes in gene expression (cnRNA-seq) in Bap1fl/fl, PRC1CPM;Bap1fl/fl, and PRC1 CPM ESCs following OHT treatment.
Significant gene expression changes (P-adj < 0.05 and >1.5-fold) for a custom nonredundant set of refGene genes (n = 20,633) are shown in red.
The density of gene expression changes is shown at the right. (B) A bar plot illustrating the distribution of different gene classes among
genes showing significantly reduced expression following OHT treatment in Bap1fl/fl ESCs based on cnRNA-seq analysis (P-adj < 0.05
and >1.5-fold). (PcG) Polycomb-occupied genes, (Non-PcG) non-Polycomb-occupied genes, (Non-NMI) genes lacking a nonmethylated
CGI (NMI) at their promoter. (C) Snapshots of genes whose expression is significantly reduced (P-adj < 0.05 and >1.5-fold) following removal
of BAP1, showing gene expression (cnRNA-seq) in Bap1fl/fl, PRC1CPM;Bap1fl/fl, and PRC1 CPM ESCs (untreated and OHT-treated). (D) Snap-
shots of genes whose expression is significantly reduced (P-adj < 0.05 and >1.5-fold) following removal of BAP1, showing H2AK119ub1
cChIP-seq in Bap1fl/fl ESCs (untreated and OHT-treated). Also shown is cChIP-seq for H3K27ac and H3K4me3 in untreated Bap1fl/fl
ESCs to highlight the position of promoters (H3K27ac-high, H3K4me3-high) and nearest putative enhancers (H3K27ac-high, H3K4me3-
low) for these genes. (E) Metaplots of H2AK119ub1 cChIP-seq signal in Bap1fl/fl ESCs (untreated and OHT-treated) across genes that
show a significant reduction (Down, n = 2828) or no change (No Change, n = 17,203) in expression following BAP1 removal based on
cnRNA-seq analysis (P-adj < 0.05 and >1.5-fold). (F ) Box plots comparing log2 fold changes in expression (cnRNA-seq) following OHT treat-
ment in Bap1fl/fl (green), PRC1CPM;Bap1fl/fl (red), and PRC1 CPM (blue) ESCs for genes whose expression is significantly reduced (P-adj < 0.05
and >1.5-fold) in the absence of BAP1. P-values denote the result of a two-tailed Student’s t-test. (∗∗∗∗ ) P < 10−100. (G) A Venn diagram of the
overlap between genes that show a significant reduction in expression based on cnRNA-seq analysis (P-adj < 0.05 and >1.5-fold) following
OHT treatment in Bap1fl/fl (green), PRC1CPM;Bap1fl/fl (red), and PRC1 CPM (blue) ESCs. P-values denote the result of a Fisher’s exact test for
the pairwise overlaps between genes showing reduced expression in PRC1CPM;Bap1fl/fl and PRC1 CPM, Bap1fl/fl and PRC1CPM;Bap1fl/fl, as
well as Bap1fl/fl and PRC1 CPM ESCs. (∗∗∗∗ ) P < 10−100 for PRC1CPM;Bap1fl/fl and PRC1 CPM, (∗∗ ) P < 10−5 for Bap1fl/fl and PRC1CPM;Bap1fl/fl,
(∗ ) P < 0.05 for Bap1fl/fl and PRC1 CPM.

accumulation of H2AK119ub1 in the absence of BAP1 is                         hancers, which have been also reported to bind Pol II
not restricted to genes or their promoters (Fig. 1D), we                     and initiate transcription (Li et al. 2016; Andersson and
wondered whether the observed effects on Pol II may in                       Sandelin 2020; Sartorelli and Lauberth 2020). This re-
fact extend to other gene regulatory elements, like en-                      vealed that there was also a pronounced decrease in total

                                                                                                                GENES & DEVELOPMENT            5
Downloaded from genesdev.cshlp.org on October 22, 2021 - Published by Cold Spring Harbor Laboratory Press
Fursova et al.
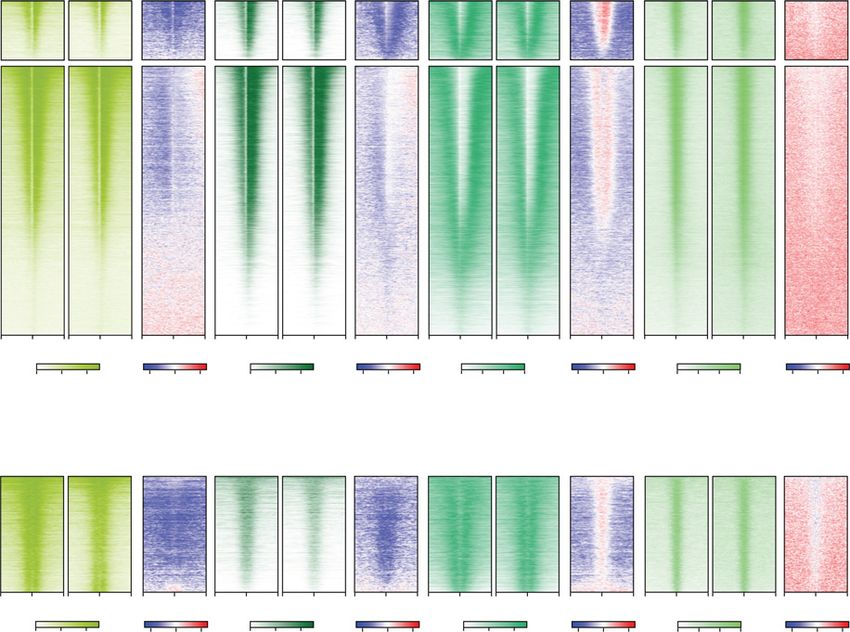
A Figure 3. BAP1 counteracts pervasive
H2AK119ub1 to promote Ser5 phosphoryla-
tion on the CTD of RNA Pol II at gene regu-
latory elements. (A) Heat maps illustrating
cChIP-seq signal for total Pol II occupancy
and its Ser5 phosphorylation (S5P) at gene
promoters, as well as Pol II Ser2 phosphory-
lation (S2P) over gene bodies in Bap1fl/fl
ESCs (untreated and OHT-treated). Also
shown are the log2 fold changes in cChIP-
seq signal after BAP1 removal (LFC OHT/
UNT) and the log2 fold changes in the abun-
dance of Ser5P and Ser2P relative to total Pol
II levels (S5P/Total and S2P/Total). Genes
were segregated into those that show a sig-
nificant reduction (Down, n = 2828) or no
change (No Change, n = 17,203) in expres-
B sion following BAP1 removal based on
cnRNA-seq analysis (P-adj < 0.05 and >1.5-
fold). Intervals were sorted by total Pol II
cChIP-seq signal in untreated Bap1fl/fl
ESCs. (B) Heat maps illustrating cChIP-seq
signal for total Pol II occupancy, as well as
its Ser5P and Ser2P forms, at active enhanc-
ers in Bap1fl/fl ESCs (untreated and OHT-
treated). As in A, the log2 fold changes in
C D cChIP-seq signal after BAP1 removal (LFC
OHT/UNT) are shown together with the
log2 fold changes in the abundance of Ser5P
and Ser2P relative to total Pol II levels
(S5P/Total and S2P/Total). Intervals were
sorted by total Pol II cChIP-seq signal in un-
treated Bap1fl/fl ESCs. (C) Violin plots com-
paring log2 fold changes in cChIP-seq signal
for total Pol II, as well as its Ser5P and
Ser2P forms, following OHT treatment in
E F Bap1fl/fl ESCs at the promoters and over the
bodies of genes that show a significant reduc-
tion (Down, n = 2828) in expression after
BAP1 removal based on cnRNA-seq analysis
(P-adj < 0.05 and >1.5-fold). P-values denote
the result of a one-tailed Student’s t-test.
(∗∗∗ ) P < 10−10, (∗∗ ) P < 10−5, (ns) P > 0.05. For
comparisons of Ser5P/Ser2P with total Pol
G H II, the alternative hypothesis was that the
log2 fold change in Ser5P/Ser2P was smaller.
For the comparison of Ser5P with Ser2P, the
alternative hypothesis was that the log2 fold
change in Ser5P was smaller. (D) Violin plots
comparing log2 fold changes in the abun-
dance of Ser5P and Ser2P relative to total
Pol II levels (S5P/Total and S2P/Total) fol-
lowing OHT treatment in Bap1fl/fl ESCs at
the promoters and over the bodies of genes defined in C. P-values denote the result of a one-sample one-tailed Student’s t-test to determine
whether the log2 fold changes were significantly smaller than 0. (∗∗ ) P < 10−5, (ns) P > 0.05. (E) Metaplots of total and Ser5P Pol II cChIP-seq
signal at active gene promoters in Bap1fl/fl ESCs (untreated and OHT-treated). (F) Violin plots comparing log2 fold changes in total and Ser5P
Pol II cChIP-seq signal at active gene promoters in Bap1fl/fl ESCs following OHT treatment. P-value denotes the result of a one-tailed Stu-
dent’s t-test with the alternative hypothesis that the log2 fold change in Ser5P was smaller. (∗∗∗∗ ) P < 10−100. (G) As in E but for active en-
hancers. (H) As in F but for active enhancers. P-value denotes the result of a one-tailed Student’s t-test with the alternative hypothesis that
the log2 fold change in Ser5P was smaller. (∗∗∗ ) P < 10−10.
Pol II occupancy and an even larger reduction in Ser5P at functions broadly throughout the genome to support tran-
enhancers as well (Fig. 3B,G,H; Supplemental Fig. S4A,H). scription from gene regulatory elements by constraining
Together, these observations demonstrate that BAP1 pervasive H2AK119ub1.
6 GENES & DEVELOPMENTDownloaded from genesdev.cshlp.org on October 22, 2021 - Published by Cold Spring Harbor Laboratory Press
BAP1 counteracts pervasive H2AK119ub1
Aberrant accumulation of H2AK119ub1 compromises nome, in a similar manner to the pervasive accumulation
transcription-associated histone modifications but does of H2AK119ub1 (Fig. 4A,B,E,F; Supplemental Fig. S6D).
not limit chromatin accessibility Importantly, this demonstrates that H2AK119ub1 does
not counteract transcription simply by limiting the access
Having established that elevated H2AK119ub1 in the ab- of regulatory factors to promoters and enhancers. Instead,
sence of BAP1 broadly inhibits transcription from promot- pervasive accumulation of H2AK119ub1 in the absence of
ers and enhancers (Fig. 3), we wanted to investigate BAP1 broadly counteracts Ser5 phosphorylation of the Pol
whether chromatin features associated with transcription II CTD, resulting in widespread reductions in transcrip-
were also affected. To address this question, we carried out tion and its associated histone modifications. Together,
cChIP-seq for histone modifications that are typically en- our findings illustrate how a pervasive histone modifica-
riched at active promoters (H3K27ac and H3K4me3) or en- tion that can inhibit transcription must be appropriately
hancers (H3K27ac and H3K4me1) (Calo and Wysocka controlled to support the transcriptional potential of the
2013; Andersson and Sandelin 2020). Interestingly, we ob- genome.
served a widespread decrease in H3K27ac at both types of
gene regulatory elements in the absence of BAP1, with en-
hancers showing more pronounced reductions (Fig. 4A–D; BAP1 indirectly supports repression of a subset
Supplemental Fig. S5A–C,E,F). Removal of BAP1 also com- of Polycomb target genes
promised H3K4me3 at gene promoters, but this effect was Our finding that BAP1 constrains pervasive H2AK119ub1
on average much more modest and mostly limited to genes to facilitate gene expression is conceptually at odds with
that showed significant reductions in expression (Fig. 4A, genetic characterisation of the Drosophila orthologs of
C; Supplemental Fig. S5A–C,E). In contrast, H3K4me3 at BAP1 (Calypso) and other PR-DUB components as Poly-
enhancers was markedly reduced, despite the starting lev- comb group (PcG) transcriptional repressors (Jürgens
els of this modification being considerably lower than at 1985; Soto et al. 1995; de Ayala Alonso et al. 2007;
promoters (Fig. 4A,B,D; Supplemental Fig. S5A,E,F). Final- Scheuermann et al. 2010). Intriguingly, despite the major-
ly, we also observed a modest but widespread decrease in ity of genes showing reduced expression in BAP1-deficient
H3K4me1 around promoters and enhancers, which was cells, we also identified 602 genes whose expression was
accompanied by a slight increase at the center of these reg- significantly increased in the absence of BAP1 (Fig. 2A).
ulatory elements (Fig. 4A–D; Supplemental Fig. S5A–C,E, Remarkably, when we examined these genes in more de-
F). Therefore, we found that BAP1 removal leads to moder- tail, we found that the majority were Polycomb target
ate and seemingly indiscriminate effects on transcription- genes enriched in GO categories related to regulation of
associated histone modifications at both promoters and developmental processes, which are characteristic of
enhancers, which correlate with the effects on gene ex- PRC1-repressed genes in mouse ESCs (Fig. 5A–D). There-
pression (Supplemental Fig. S5D). This observation differs fore, we show that BAP1 is required to repress a subset of
from previous studies that have implicated BAP1 and other Polycomb target genes, consistent with its genetic desig-
PR-DUB subunits in directly recruiting chromatin-modi- nation as a PcG gene.
fying transcriptional coactivators to either promoters or To better understand the interplay between BAP1 and
enhancers to specifically affect histone modifications at the Polycomb system, we investigated the effect that
these sites (Li et al. 2017b; Wang et al. 2018; Szczepanski BAP1 removal has on Polycomb chromatin domains by
et al. 2020). Instead, our new findings are more consistent examining the binding of PRC1 (RING1B), PRC2
with a model in which, in the absence of BAP1, elevated (SUZ12), and levels of their respective histone modifica-
H2AK119ub1 inhibits early stages of transcription, which tions (H2AK119ub1 and H3K27me3) by cChIP-seq. This
then leads to modest but broad effects on transcription-as- showed that, in the absence of BAP1, H2AK119ub1 in-
sociated histone modifications. creased across Polycomb chromatin domains at target
Given that some chromatin modifications have been gene promoters (Fig. 5E), although the magnitude of this
proposed to function through making chromatin less ac- effect was slightly smaller than at other regions of the
cessible to gene regulatory factors (Francis et al. 2001, genome, in agreement with ChromHMM analysis
2004; Danzer and Wallrath 2004; Soufi et al. 2012; Becker (Fig. 1E). Furthermore, H3K27me3 was also modestly ele-
et al. 2016; Fyodorov et al. 2018), we sought to determine vated (Fig. 5E), consistent with an essential role for
whether elevated H2AK119ub1 could elicit its wide- H2AK119ub1 in shaping H3K27me3 at Polycomb target
spread effects on transcription by limiting chromatin ac- gene promoters (Blackledge et al. 2014, 2020; Cooper
cessibility. To test this possibility, we performed et al. 2014; Kalb et al. 2014; Illingworth et al. 2015; Tam-
calibrated ATAC-seq (cATAC-seq) that measures chroma- burri et al. 2020). In contrast, at the subset of Polycomb tar-
tin accessibility by its susceptibility to tagmentation by get genes that become derepressed in the absence of BAP1,
Tn5 transposase (Buenrostro et al. 2015). Importantly, the levels of H2AK119ub1 and H3K27me3 at their promot-
we found that accumulation of H2AK119ub1 in the ab- ers remained largely unchanged (Fig. 5D,F,G; Supplemen-
sence of BAP1 did not cause major reductions in chroma- tal Fig. S7A,D), suggesting that reactivation of these genes
tin accessibility at gene promoters and enhancers (Fig. 4A, following BAP1 removal is not due to reductions in these
B,F; Supplemental Figs. S5A, S6A–C). Instead, to our sur- histone modifications. We then examined PRC1 and
prise, we found that, following BAP1 removal, chromatin PRC2 occupancy at Polycomb target gene promoters and
accessibility was modestly increased throughout the ge- found that it was modestly reduced, despite the observed
GENES & DEVELOPMENT 7Downloaded from genesdev.cshlp.org on October 22, 2021 - Published by Cold Spring Harbor Laboratory Press
Fursova et al.
A
B
C D
E F
Figure 4. Aberrant accumulation of H2AK119ub1 compromises transcription-associated histone modifications but not chromatin acces-
sibility at gene regulatory elements. (A) Heat maps illustrating H3K27ac, H3K4me3, and H3K4me1 cChIP-seq signal at gene promoters in
Bap1fl/fl ESCs (untreated and OHT-treated). cATAC-seq is shown as a measure of chromatin accessibility. Also shown are the log2 fold
changes in cChIP-seq and cATAC-seq signal after BAP1 removal (LFC OHT/UNT). Genes were segregated into those that show a signifi-
cant reduction (Down, n = 2828) or no change (No Change, n = 17,203) in expression following BAP1 removal based on cnRNA-seq analysis
(P-adj < 0.05 and >1.5-fold). Intervals were sorted by total Pol II cChIP-seq signal in untreated Bap1fl/fl ESCs. (B) As in A but for active en-
hancers. (C ) Violin plots comparing log2 fold changes in cChIP-seq signal for H3K27ac, H3K4me3, and H3K4me1 at active gene promoters
in Bap1fl/fl ESCs following OHT treatment. P-values denote the result of a one-sample one-tailed Student’s t-test to determine whether the
log2 fold changes were significantly smaller than 0. (∗∗∗∗ ) P < 10−100, (ns) P > 0.05. (D) As in C but for active enhancers. P-values denote the
result of a one-sample one-tailed Student’s t-test to determine whether the log2 fold changes were significantly smaller than 0. (∗∗∗∗ ) P <
10−100, (∗ ) P < 0.05. (E) A chromosome density plot showing chromatin accessibility across chromosome 18 as measured by cATAC-seq in
Bap1fl/fl ESCs (untreated and OHT-treated). This illustrates a widespread increase in cATAC-seq signal throughout the genome following
BAP1 removal. (F) Box plots comparing log2 fold changes in cATAC-seq signal at gene regulatory elements (enhancers and promoters),
gene bodies, and intergenic regions in Bap1fl/fl ESCs following OHT treatment.
8 GENES & DEVELOPMENTDownloaded from genesdev.cshlp.org on October 22, 2021 - Published by Cold Spring Harbor Laboratory Press
BAP1 counteracts pervasive H2AK119ub1
A B C
D E
F H
G I
Figure 5. BAP1 indirectly supports repression of a subset of Polycomb target genes by counteracting pervasive H2AK119ub1 to focus
Polycomb complex occupancy at target sites. (A) A bar plot illustrating the distribution of different gene classes among genes that become
significantly derepressed (P-adj < 0.05 and >1.5-fold) following OHT treatment in Bap1fl/fl ESCs. (PcG) Polycomb-occupied genes, (Non-
PcG) non-Polycomb-occupied genes, (Non-NMI) genes lacking a nonmethylated CGI (NMI) at their promoter. (B) A Venn diagram show-
ing the overlap between genes that become significantly derepressed (P-adj < 0.05 and >1.5-fold) following OHT treatment in Bap1fl/fl (red)
or PRC1 CKO (blue) ESCs. P-value denotes the result of a Fisher’s exact test. (∗∗∗∗ ) P < 10−100. (C ) A gene ontology (GO) analysis of biological
process term enrichment for genes that become significantly derepressed (P-adj < 0.05 and >1.5-fold) in Bap1fl/fl cells following OHT treat-
ment. (D) Snapshots of Polycomb target genes that become significantly derepressed (P-adj < 0.05 and >1.5-fold) following BAP1 removal,
showing gene expression (cnRNA-seq) and cChIP-seq for H2AK119ub1, H3K27me3, RING1B (PRC1), and SUZ12 (PRC2) in Bap1fl/fl ESCs
(untreated and OHT-treated). (E) Heat maps of cChIP-seq signal for H2AK119ub1, H3K27me3, RING1B (PRC1), and SUZ12 (PRC2) across
Polycomb chromatin domains at the promoters of Polycomb-occupied genes in Bap1fl/fl ESCs (untreated and OHT-treated). Intervals were
sorted by RING1B occupancy in untreated Bap1fl/fl ESCs. (F ) Metaplots of H2AK119ub1 cChIP-seq signal in Bap1fl/fl ESCs (untreated and
OHT-treated) at the promoters of Polycomb-occupied genes that become significantly derepressed (Up, n = 421) or do not change in expres-
sion (No Change, n = 4075) following BAP1 removal based on cnRNA-seq analysis (P-adj < 0.05 and >1.5-fold). (G) As in F for H3K27me3
cChIP-seq. (H) As in F for RING1B cChIP-seq. (I) As in F for SUZ12 cChIP-seq.
GENES & DEVELOPMENT 9Downloaded from genesdev.cshlp.org on October 22, 2021 - Published by Cold Spring Harbor Laboratory Press
Fursova et al.
increases in H2AK119ub1 and H3K27me3 (Fig. 5E), and without the need for elaborate site-specific targeting
this was not due to reductions in RING1B and SUZ12 pro- mechanisms.
tein levels (Supplemental Fig. S7B). However, strikingly, We envisage that this generic mode of gene regulation
when we focused on the promoters of Polycomb target could be particularly relevant during cellular differentia-
genes that were derepressed in the absence of BAP1, we tion and development when the transcriptional activity
found that they were on average occupied by much higher of the genome or large genomic regions needs to be coordi-
levels of PRC1 and PRC2 in untreated cells and showed nately modulated to support acquisition and maintenance
much more dramatic reductions in their occupancy after of cell type-specific transcriptional states. In fact, support
BAP1 removal (Fig. 5D,H,I; Supplemental Fig. S7A,C,D). for this concept has recently emerged from studies of X in-
Based on these observations, we conclude that this subset activation where H2AK119ub1 was shown to accumulate
of Polycomb target genes are particularly reliant on high- across the entire silenced X chromosome to drive tran-
level occupancy of PRC1 and PRC2 for their silencing scriptional repression and enable dosage compensation
and that the major decrease in Polycomb complex binding (Bousard et al. 2019; Fursova et al. 2019; Nesterova et al.
at their promoters caused by removal of BAP1 leads to their 2019; Ż ylicz et al. 2019). Furthermore, our discoveries
derepression. Given that both Polycomb repressive com- also indicate that there exists an important balance be-
plexes can directly bind to H2AK119ub1 (Arrigoni et al. tween the enzymes that place and remove pervasive
2006; Kalb et al. 2014; Cooper et al. 2016; Zhao et al. H2AK119ub1, with the levels of this histone modification
2020; Kasinath et al. 2021), we envisage that the reduc- regulating the capacity of the genome to be transcribed.
tions in PRC1 and PRC2 occupancy at this subset of genes Given that the composition and expression of PRC1 and
are likely caused by elevated H2AK119ub1 elsewhere in BAP1 complexes changes extensively during development
the genome competing for their binding. Together, these (Fisher et al. 2006; Morey et al. 2012, 2015; O’Loghlen et al.
findings provide a potential molecular rationale for the 2012; Kloet et al. 2016), in future work, it will be interest-
counterintuitive observation that disruption of the BAP1 ing to investigate how the balance between these two op-
ortholog in Drosophila (Calypso) gives rise to PcG pheno- posing activities is regulated at different developmental
types in genetic assays, despite its role in counteracting stages and how cell type-specific H2AK119ub1 levels in-
H2AK119ub1. Furthermore, it reveals that limiting perva- fluence the transcriptional potential of the genome. Given
sive H2AK119ub1 throughout the genome is important for that BAP1 and other PR-DUB subunits are frequently mu-
focusing Polycomb repressive complexes at target gene tated in a variety of cancers with diverse origins (Wiesner
promoters, while enabling transcription elsewhere in the et al. 2011; Dey et al. 2012; Carbone et al. 2013; Katoh
genome. 2013; Murali et al. 2013; Masoomian et al. 2018; Zhang
et al. 2020), our findings also suggest that maintaining
the cell type-specific balance between the activities that
Discussion control H2AK119ub1 levels could play an important role
in protecting cells from transformation.
Chromatin-modifying enzymes can function at defined BAP1 has previously been proposed to regulate gene ex-
gene regulatory elements to support cell type-specific pression through diverse mechanisms, some of which are
gene expression patterns (Atlasi and Stunnenberg thought to function independently of H2AK119ub1 (Yu
2017; Yadav et al. 2018). Their recruitment to these sites et al. 2010; Dey et al. 2012; Li et al. 2017b; Wang et al.
often relies on DNA- and chromatin-binding activities 2018; Campagne et al. 2019; Kuznetsov et al. 2019). We
(Smith and Shilatifard 2010), and these mechanisms un- now discover that BAP1 plays a widespread role in sup-
derpin how PRC1 creates high-level enrichment of porting gene expression and show that this relies on
H2AK119ub1 at Polycomb target gene promoters to en- BAP1 counteracting H2AK119ub1, as catalytic inactiva-
able repression (Endoh et al. 2012; Blackledge et al. 2015, tion of PRC1 reverts the effects of BAP1 removal on
2020; Fursova et al. 2019; Scelfo et al. 2019; Cohen et al. gene expression, consistent with previous reports of epis-
2020; Tamburri et al. 2020). In addition to this punctate tasis between BAP1 and PRC1 (Campagne et al. 2019; He
pool of H2AK119ub1, we and others have recently discov- et al. 2019). This raises the important question of how per-
ered that PRC1 also places low levels of H2AK119ub1 vasive H2AK119ub1 can function at such a broad scale to
broadly throughout the genome (Lee et al. 2015; Kahn constrain gene expression. Many histone modifications
et al. 2016; Fursova et al. 2019). However, whether perva- are thought to regulate gene expression through reader
sive H2AK119ub1 contributes to gene regulation or other proteins that bind to modified nucleosomes and directly
chromosomal processes has remained unclear. Here, we affect transcription (Musselman et al. 2012; Patel and
found that BAP1 plays a central role in counteracting per- Wang 2013). This is particularly relevant for histone mod-
vasive H2AK119ub1, and in its absence, accumulation of ifications that are of low abundance yet highly enriched at
H2AK119ub1 throughout the genome leads to widespread gene regulatory elements. However, we estimate that
reductions in transcription that are likely related to defects ∼5.9 × 10⁶ H2AK119ub1 molecules decorate the genome
in Ser5 phosphorylation on the CTD of Pol II at gene regu- of ES cells (Huseyin and Klose 2021), and this number in-
latory elements. This reveals an important and previously creases ∼1.5-fold to twofold after conditional removal of
underappreciated mechanism for chromatin-based gene BAP1 (Fig. 1), which is comparable with the at least two-
regulation, whereby a pervasive histone modification can fold increase in H2AK119ub1 levels reported previously
broadly control the function of gene regulatory elements in constitutive BAP1 knockout cells (Campagne et al.
10 GENES & DEVELOPMENTDownloaded from genesdev.cshlp.org on October 22, 2021 - Published by Cold Spring Harbor Laboratory Press
BAP1 counteracts pervasive H2AK119ub1
2019; Kolovos et al. 2020). If a reader protein was required known to maintain Polycomb target gene repression dur-
for the widespread repressive effects of H2AK119ub1, ing development, it was puzzling why BAP1, which re-
we envisage that it would also need to be immensely moves H2AK119ub1, would be required for this process.
abundant, a requirement that none of the proposed Initially, it was proposed that BAP1 functioned at
H2AK119ub1-binding proteins fulfill (Arrigoni et al. Polycomb target gene promoters to appropriately balance
2006; Richly et al. 2010; Beck et al. 2011; Schwanhäusser H2AK119ub1 levels by enabling its dynamic turnover and
et al. 2011; Kalb et al. 2014; Wisn ́ iewski et al. 2014; Qin that this would somehow facilitate repression of these
et al. 2015; Cooper et al. 2016; Zhang et al. 2017b). Alter- genes (Scheuermann et al. 2010; Schuettengruber and
natively, addition of a bulky ubiquitin moiety to histone Cavalli 2010). While alternative and less direct mecha-
H2A could simply restrict access of the transcriptional nisms have also been previously considered (Schue-
machinery to gene regulatory elements. However, in ttengruber and Cavalli 2010; Gutiérrez et al. 2012;
agreement with previous work (Hodges et al. 2018; Scheuermann et al. 2012), here, we demonstrate that
King et al. 2018), we found that accumulation of BAP1 indirectly supports repression of a subset of Poly-
H2AK119ub1 does not limit chromatin accessibility, comb target genes by limiting pervasive H2AK119ub1
and if anything, the genome becomes slightly more acces- elsewhere in the genome to promote high-level occupancy
sible when H2AK119ub1 levels are increased. Based on of Polycomb complexes at target gene promoters. This
these observations, we favor the possibility that mechanism has conceptual similarities to regulation of
H2AK119ub1 controls gene expression by counteracting telomeric gene silencing in budding yeast where the
the process of transcription more directly, which is in Dot1 histone methyltransferase has been proposed to de-
agreement with previous work showing that PRC1 and posit H3K79me pervasively throughout the genome to
H2AK119ub1 can inhibit various aspects of transcription, counteract promiscuous binding of SIR proteins and focus
including initiation, pause release, and elongation (Del- their repressive activity at telomeric regions (van Leeu-
lino et al. 2004; Stock et al. 2007; Nakagawa et al. 2008; wen and Gottschling 2002; van Leeuwen et al. 2002; Ver-
Zhou et al. 2008; Lehmann et al. 2012; Aihara et al. 2016). zijlbergen et al. 2009). Interestingly, mutations in the
To investigate how H2AK119ub1 might regulate the BAP1 and ASXL components of the PR-DUB complex
process of transcription, we examined Pol II and its phos- can also lead to phenotypes that are reminiscent of muta-
phorylated forms by cChIP-seq. This revealed that elevat- tions in Trithorax group (TrxG) genes, which are known to
ed H2AK119ub1 preferentially compromised Ser5 oppose PcG gene activity and facilitate gene expression
phosphorylation on the CTD of Pol II at gene regulatory (Sinclair et al. 1992; Milne et al. 1999; Gildea et al. 2000;
elements, which is primarily carried out by the CDK7 Baskind et al. 2009; Fisher et al. 2010; Scheuermann
subunit of the general transcription factor TFIIH (Phat- et al. 2010). In line with these observations, we demon-
nani and Greenleaf 2006; Buratowski 2009; Harlen and strate at the molecular level that, by counteracting
Churchman 2017). It is thought that during transcription pervasive H2AK119ub1, BAP1 directly promotes gene ex-
initiation, CDK7 catalyzes Ser5 phosphorylation of the pression, akin to a TrxG gene (Fig. 6A), while also indirect-
Pol II CTD to promote the transition of Pol II into ly supporting repression of a subset of Polycomb target
early elongation (Larochelle et al. 2012). Therefore, given genes, akin to a PcG gene (Fig. 6B). Together, these new
the disproportionate effect of elevated H2AK119ub1 discoveries provide a potential mechanistic rationale for
on Ser5 phosphorylation, we speculate that pervasive the dual role that BAP1 has in gene regulation based on ge-
H2AK119ub1 may regulate the function of gene regulato- netic assays and reveal that the balance between activities
ry elements by limiting productive transcription initia- that place and remove pervasive H2AK119ub1 is essential
tion or the transition from initiation to early elongation. for supporting the expression of some genes, while main-
Consistent with this, we have recently shown that rapid taining the repression of others.
depletion of H2AK119ub1 leads to increased Polycomb
target gene expression, which results from a higher rate
of transcription initiation, as suggested by elevated burst Materials and methods
frequency (Dobrinić et al. 2020). These findings are also
in agreement with observations from in vitro studies Cell culture conditions and treatments
where installation of H2AK119ub1 into chromatin tem- E14TG2a mouse embryonic stem cells (ESCs) were grown on gel-
plates was sufficient to impede transcription initiation atin-coated plates at 37°C and 5% CO2 in Dulbecco’s modified
(Nakagawa et al. 2008). In future work, examining how Eagle medium (DMEM) supplemented with 15% fetal bovine se-
BAP1 removal affects transcriptionally engaged Pol II us- rum (Labtech), 2 mM L-glutamine (Life Technologies), 1× penicil-
ing high-resolution techniques (Wissink et al. 2019) will lin/streptomycin (Life Technologies), 1× nonessential amino
help to pinpoint the step of transcription that is disrupted acids (Life Technologies), 0.5 mM β-mercaptoethanol (Life Tech-
by elevated H2AK119ub1. nologies), and 10 ng/mL leukemia inhibitory factor (in-house). To
induce conditional removal of BAP1, on its own or in combina-
Our molecular understanding of how BAP1 and its
tion with PRC1 catalytic activity, Bap1fl/fl and PRC1CPM;Bap1fl/fl
H2AK119ub1 deubiquitylase activity contribute to gene cells were treated with 800 nM 4-hydroxytamoxifen (OHT) for
regulation has been complicated by the initial characteri- 96 h. To induce conditional removal of PRC1 catalytic
zation of the Drosophila ortholog of BAP1 as a PcG gene activity on its own, PRC1 CPM cells were treated with 800 nM
in genetic experiments (de Ayala Alonso et al. 2007; OHT for 72 h. Cells were regularly tested for the presence of
Scheuermann et al. 2010). Given that PcG genes are mycoplasma.
GENES & DEVELOPMENT 11Downloaded from genesdev.cshlp.org on October 22, 2021 - Published by Cold Spring Harbor Laboratory Press
Fursova et al.
A
B
Figure 6. A model illustrating how BAP1 can regulate gene expression by constraining pervasive H2AK119ub1. (A) BAP1 facilitates gene
expression by constraining the pervasive sea of H2AK119ub1 that covers the genome. Inducible removal of BAP1 (+OHT) results in a broad
accumulation of H2AK119ub1 throughout the genome. Elevated H2AK119ub1 indiscriminately counteracts Ser5 phosphorylation (S5P)
on the CTD of Pol II at gene regulatory elements ([P] promoters, [E] enhancers), and causes widespread reductions in transcription and gene
expression. This explains why disruption of BAP1 and other PR-DUB subunits can lead to Trithorax group (TrxG)-like phenotypes. (B)
BAP1 also indirectly supports repression of a subset of Polycomb target genes by counteracting pervasive H2AK119ub1 and focusing
high levels of Polycomb complexes at target gene promoters. In the absence of BAP1, PRC1/PRC2 occupancy at Polycomb target sites
is reduced, presumably due to the increased binding of these complexes to elevated H2AK119ub1 elsewhere in the genome. This leads
to derepression of a subset of Polycomb target genes that appear to rely on high-level Polycomb complex occupancy for their silencing,
providing a potential molecular rationale for why the BAP1 ortholog in Drosophila has been originally characterized as a Polycomb group
(PcG) gene.
Human HEK293T cells used for spike-in calibration of cChIP- construct and Cas9 guides were used to generate PRC1CPM;
seq were grown at 37°C and 5% CO2 in Dulbecco’s modified Eagle Bap1fl/fl cells from a PRC1 CPM parental cell line. Loss of BAP1
medium (DMEM) supplemented with 10% fetal bovine serum in response to OHT treatment in Bap1fl/fl and PRC1CPM;Bap1fl/fl
(Labtech), 2 mM L-glutamine (Life Technologies), 1× penicillin/ ESCs was confirmed using RT-qPCR and Western blot analysis.
streptomycin (Life Technologies), and 0.5 mM β-mercaptoetha- PRC1 CPM cells were generated and characterized in a previous
nol (Life Technologies). Drosophila S2 (SG4) cells used for study (Blackledge et al. 2020). Briefly, a targeting construct for
spike-in calibration of native cChIP-seq, cnRNA-seq, and this cell line comprised exon 3 of Ring1b in forward orientation
cATAC-seq were grown adhesively at 25°C in Schneider’s Droso- (flanked by 100 bp of Ring1b intron 2/intron 3), followed by a mu-
phila medium (Life Technologies), supplemented with 1× penicil- tant copy of exon 3 (encoding I53A and D56K mutations) in re-
lin/streptomycin (Life Technologies) and 10% heat-inactivated verse orientation (flanked by splice donor and acceptor sites
fetal bovine serum (Labtech). from mouse IgE gene). Both the wild-type and mutant versions
of exon 3 were codon-optimized at wobble positions to minimize
sequence similarity. The wild-type/mutant exon 3 pair was
Cell line generation
flanked by doubly inverted LoxP/Lox2272 sites and ∼1-kb ho-
Bap1fl/fl cells were derived from E14TG2a ESCs by a two-step pro- mology arms. The targeting construct was transfected into
cess. First, parallel loxP sites flanking exon 4 of the Bap1 gene E14TG2a ESCs in combination with three different Cas9 guides
were inserted using a targeting construct with homology arms specific for the Ring1b gene. Correctly targeted homozygous
of ∼1 kb and three different Cas9 guides specific for the Bap1 lo- clones were identified by PCR screening, followed by RT-PCR
cus (sgRNA target sequences: TCAAATGGATCGAAGAGCGC, and sequencing to check for splicing defects. Using a similar ap-
CAAGGTAGGGACACAATAAA, TAAAACACCACCAACTA proach, the I50A/D53K mutation was constitutively knocked-in
CAG). Second, CreERT2 was inserted into the Rosa26 locus using into both copies of the endogenous Ring1a gene. Finally,
a Rosa26-specific Cas9 guide (sgRNA target sequence: CGCC CreERT2 was inserted into the Rosa26 locus using a Rosa26-spe-
CATCTTCTAGAAAGAC). The same BAP1-specific targeting cific Cas9 guide.
12 GENES & DEVELOPMENTDownloaded from genesdev.cshlp.org on October 22, 2021 - Published by Cold Spring Harbor Laboratory Press
BAP1 counteracts pervasive H2AK119ub1
Genome engineering by CRISPR/homology-directed repair (HDR) stopped by quenching with 125 mM glycine. Cross-linked ESCs
were mixed with 2 × 10⁶ human HEK293T cells, which have
The pSptCas9(BB)-2A-Puro(PX459)-V2.0 vector was obtained
been similarly double-cross-linked, and incubated in lysis buffer
from Addgene (62988), and sgRNAs were designed using the
(50 mM HEPES at pH 7.9, 140 mM NaCl, 1 mM EDTA, 10% glyc-
CRISPOR online tool (http://crispor.tefor.net/crispor.py). Target-
erol, 0.5% NP40, 0.25% Triton X-100, 1× PIC [Roche]) for 10 min
ing constructs with appropriate homology arms were generated
at 4°C. Released nuclei were washed (10 mM Tris-HCl at pH 8,
by Gibson assembly using the Gibson Assembly Master Mix kit
200 mM NaCl, 1 mM EDTA, 0.5 mM EGTA, 1× PIC [Roche])
(NEB). Targeting constructs were designed such that Cas9 recog-
for 5 min at 4°C. Chromatin was then resuspended in 1 mL of son-
nition sites were disrupted by the presence of the LoxP sites. ESCs
ication buffer (10 mM Tris-HCl at pH 8, 100 mM NaCl, 1 mM
(one well of a six-well plate) were transfected with 0.5 μg of each
EDTA, 0.5 mM EGTA, 0.1% Na deoxycholate, 0.5% N-lauroyl-
Cas9 guide and 2 μg of targeting construct using Lipofectamine
sarcosine, 1× PIC [Roche]) and sonicated for 30 min using the Bio-
3000 (ThermoFisher) according to the manufacturer’s guidelines.
Ruptor Pico (Diagenode), shearing genomic DNA to an average
The day after transfection, cells were passaged at a range of den-
size of 0.5 kb. Following sonication, Triton X-100 was added to
sities and subjected to selection with 1 μg/mL puromycin for
a final concentration of 1%, followed by centrifugation at
48 h to eliminate nontransfected cells. Approximately 1 wk later,
20,000g for 10 min at 4°C to collect the clear supernatant fraction.
individual clones were isolated, expanded and PCR-screened for
For Pol II and its phosphorylated forms, cChIP-seq was done as
the desired genomic modifications.
described previously (Turberfield et al. 2019). Briefly, 5 × 10⁷
ESCs (untreated and OHT-treated) were cross-linked in 10 mL
Preparation of nuclear and histone extracts of 1× PBS with 1% formaldehyde (methanol-free; Thermo Scien-
for immunoblotting analysis tific) for 10 min at 25°C and then quenched by addition of
125 mM glycine. Cross-linked ESCs were mixed with 2 × 10⁶ hu-
For nuclear extraction, ESCs were washed with 1× PBS and resus- man HEK293T cells, which have been similarly single-cross-
pended in 10 volumes of buffer A (10 mM HEPES at pH 7.9, 1.5 mM linked, and then incubated in FA-lysis buffer (50 mM HEPES at
MgCl2, 10 mM KCl, 0.5 mM DTT, 0.5 mM PMSF, 1× protease in- pH 7.9, 150 mM NaCl, 2 mM EDTA, 0.5 mM EGTA, 0.5%
hibitor cocktail [PIC] [Roche]). After 10 min incubation on ice, NP40, 0.1% sodium deoxycholate, 0.1% SDS, 10 mM NaF, 1
cells were recovered by centrifugation at 1500g for 5 min and re- mM AEBSF, 1× PIC) for 10 min at 4°C. Chromatin was sonicated
suspended in 3 vol of buffer A supplemented with 0.1% NP-40. for 30 min using the BioRuptor Pico (Diagenode), followed by
The released nuclei were pelleted by centrifugation at 1500g for centrifugation at 20,000g for 10 min at 4°C to collect the clear su-
5 min, followed by resuspension in 1 vol of buffer C (5 mM HEPES pernatant fraction.
at pH 7.9, 26% glycerol, 1.5 mM MgCl2, 0.2 mM EDTA, 1× PIC For RING1B and SUZ12 ChIP, sonicated chromatin was dilut-
[Roche], and 0.5 mM DTT) supplemented with 400 mM NaCl. ed 10-fold with ChIP dilution buffer (1% Triton X-100, 1 mM
The extraction was allowed to proceed on ice for 1 h with occa- EDTA, 20 mM Tris-HCl at pH 8, 150 mM NaCl, 1× PIC). For
sional agitation, then the nuclei were pelleted by centrifugation Pol II ChIP, 300 ug of chromatin per one IP was diluted in FA-ly-
at 16,000g for 20 min at 4°C. The supernatant was taken as the nu- sis buffer up to a final volume of 1 mL. Diluted chromatin was
clear extract. The Bradford protein assay (Bio-Rad) was used to precleared for 1 h using Protein A agarose beads (Repligen) that
compare protein concentrations across samples. were preblocked with 1 mg/mL BSA and 1 mg/mL yeast tRNA.
For histone extraction, ESCs were washed in RSB (10 mM Tris For each ChIP reaction, 1 mL of diluted and precleared chroma-
HCl at pH 8, 10 mM NaCl, 3 mM MgCl2) supplemented with tin was incubated overnight with the appropriate antibody, anti-
20 mM N-ethylmaleimide (NEM), incubated for 10 min on ice RING1B (3 μL; CST D22F2), anti-SUZ12 (3 μL; CST D39F6),
in RSB with 0.5% NP-40 and 20 mM NEM, pelleted by centrifu- anti-Rpb1-NTD (15 μL; CST D8L4Y) as a measure of total Pol
gation at 800g for 5 min, and incubated in 2.5 mM MgCl2, 0.4 M II occupancy, anti-Rpb1-CTD-Ser5P (12.5 μL; CST D9N5I), and
HCl, and 20 mM NEM for 30 min on ice. After that, cells were anti-Rpb1-CTD-Ser2P (12.5 μL; CST E1Z3G) as a measure of
pelleted by centrifugation at 16,000g for 20 min at 4°C, the super- Pol II phosphorylation levels. To capture antibody-bound chro-
natant recovered and precipitated on ice with 25% TCA for matin, ChIP reactions were incubated with preblocked protein
30 min, followed by centrifugation at 16,000g for 15 min at 4°C A agarose beads (Repligen) for 2 h (RING1B and SUZ12) or 3 h
to recover histones. Following two acetone washes, the histones (Pol II) at 4°C. For RING1B and SUZ12, ChIP washes were per-
were resuspended in 1× SDS loading buffer (2% SDS, 100 mM formed as described previously (Farcas et al. 2012). For Pol II,
Tris at pH 6.8, 100 mM DTT, 10% glycerol, 0.1% bromophenol washes were performed with FA-lysis buffer, FA-lysis buffer con-
blue) and boiled for 5 min at 95°C. Finally, any insoluble precip- taining 500 mM NaCl, DOC buffer (250 mM LiCl, 0.5% NP-40,
itate was pelleted by centrifugation at 16,000g for 10 min and 0.5% sodium deoxycholate, 2 mM EDTA, 10 mM Tris-HCl at
the soluble fraction retained as the histone extract. Histone con- pH 8), followed by two washes with TE buffer (pH 8). ChIP
centrations across samples were compared using SDS-PAGE fol- DNA was eluted in elution buffer (1% SDS, 0.1 M NaHCO3)
lowed by Coomassie blue staining. Western blot analysis of and cross-linking was reversed overnight at 65oC with 200
nuclear and histone extracts was performed using LI-COR IRDye mM NaCl and 2 μL of RNase A (Sigma). Matched input samples
secondary antibodies, and imaging was done using the LI-COR (10% of original ChIP reaction) were treated identically. The fol-
Odyssey Fc system. The list of antibodies used in this study for lowing day, ChIP samples and inputs were incubated with Pro-
Western blot and cChIP-seq analysis is in Supplemental Table S1. teinase K (Sigma) for at least 1.5 h at 56oC and purified using
a ChIP DNA Clean and Concentrator kit (Zymo Research).
cChIP-seq libraries for both ChIP and Input samples were pre-
Calibrated ChIP sequencing (cChIP-seq)
pared using a NEBNext Ultra II DNA library preparation kit for
For RING1B and SUZ12, cChIP-seq was performed as described Illumina, following the manufacturer’s guidelines. Samples
previously (Fursova et al. 2019; Blackledge et al. 2020). Briefly, 5 were indexed using NEBNext Multiplex oligos. The average
× 107 mouse ESCs (untreated and OHT-treated) were cross-linked size and concentration of all libraries were analysed using the
in 10 mL of 1× PBS with 2 mM DSG (Thermo Scientific) for 45 2100 Bioanalyzer high-sensitivity DNA kit (Agilent) followed
min at 25°C, and then with 1% formaldehyde (methanol-free; by qPCR quantification using SensiMix SYBR (Bioline) and
Thermo Scientific) for a further 15 min. Cross-linking was KAPA Illumina DNA standards (Roche). Libraries were
GENES & DEVELOPMENT 13You can also read