A functional LSD1 coregulator screen reveals a novel transcriptional regulatory cascade connecting R-loop homeostasis with epigenetic regulation
←
→
Page content transcription
If your browser does not render page correctly, please read the page content below
4350–4370 Nucleic Acids Research, 2021, Vol. 49, No. 8                                                                Published online 6 April 2021
doi: 10.1093/nar/gkab180

A functional LSD1 coregulator screen reveals a novel
transcriptional regulatory cascade connecting R-loop
homeostasis with epigenetic regulation
Sabine Pinter1 , Franziska Knodel1 , Michel Choudalakis1 , Philipp Schnee1 , Carolin Kroll1 ,
Marina Fuchs1 , Alexander Broehm1 , Sara Weirich1 , Mareike Roth2 , Stephan A. Eisler3 ,
Johannes Zuber2,4 , Albert Jeltsch1 and Philipp Rathert 1,*
1

                                                                                                                                                              Downloaded from https://academic.oup.com/nar/article/49/8/4350/6212757 by guest on 24 September 2021
 Department of Biochemistry, Institute of Biochemistry and Technical Biochemistry, University of Stuttgart, 70569
Stuttgart, Germany, 2 Research Institute of Molecular Pathology, Vienna BioCenter, Vienna, Austria, 3 Stuttgart
Research Center Systems Biology (SRCSB), University of Stuttgart, 70569 Stuttgart, Germany and 4 Medical
University of Vienna, Vienna BioCenter (VBC), Vienna, Austria

Received February 12, 2021; Editorial Decision March 02, 2021; Accepted March 04, 2021

ABSTRACT                                                                        GRAPHICAL ABSTRACT
The lysine specific demethylase 1 (LSD1) plays a
pivotal role in cellular differentiation by regulating
the expression of key developmental genes in con-
cert with different coregulatory proteins. This pro-
cess is impaired in different cancer types and in-
completely understood. To comprehensively identify
functional coregulators of LSD1, we established a
novel tractable fluorescent reporter system to mon-
itor LSD1 activity in living cells. Combining this
reporter system with a state-of-the-art multiplexed
RNAi screen, we identify the DEAD-box helicase 19A                              INTRODUCTION
(DDX19A) as a novel coregulator and demonstrate
                                                                                The lysine specific demethylase 1 (LSD1, also known as
that suppression of Ddx19a results in an increase of                            KDM1A) has emerged as a critical regulator of essen-
R-loops and reduced LSD1-mediated gene silencing.                               tial physiological processes including the regulation of hor-
We further show that DDX19A binds to tri-methylated                             mone receptor–mediated transcription (1), pluripotency
lysine 27 of histone 3 (H3K27me3) and it regulates                              and stem cell differentiation (2–5), cell cycle control (6) and
gene expression through the removal of transcription                            DNA damage response (7). In agreement with the central
promoting R-loops. Our results uncover a novel tran-                            role of LSD1 in such essential regulatory programs, LSD1
scriptional regulatory cascade where the downregu-                              has been implicated in malignant transformation and main-
lation of genes is dependent on the LSD1 mediated                               tenance of tumour pathogenesis in various ways. Overex-
demethylation of histone H3 lysine 4 (H3K4). This                               pression of LSD1 has been observed in various tumour
allows the polycomb repressive complex 2 (PRC2)                                 types (8–14) and imbalanced histone modifications, due
                                                                                to elevated LSD1 expression, are significantly associated
to methylate H3K27, which serves as a binding site
                                                                                with increased cellular growth and suppression of cell cy-
for DDX19A. Finally, the binding of DDX19A leads to                             cle regulatory proteins in a broad array of tissues. High
the efficient removal of R-loops at active promoters,                           levels of LSD1 have been shown to promote epithelial-to-
which further de-represses LSD1 and PRC2, estab-                                mesenchymal transition (EMT) in breast cancer (BC) (15–
lishing a positive feedback loop leading to a robust                            17) and neuroblastoma (18), thereby contributing to can-
repression of the target gene.                                                  cer progression. Knockdown (KD) or inhibition of LSD1
                                                                                reduces both the invasiveness and proliferative capacity of
                                                                                BC cells in vitro (19,20) and small molecules targeting LSD1
                                                                                induce terminal differentiation of leukaemia cells (21,22).

* To   whom correspondence should be addressed. Tel: +49 711 685 64388; Fax: +49 711 685 64392; Email: philipp.rathert@ibtb.uni-stuttgart.de


C The Author(s) 2021. Published by Oxford University Press on behalf of Nucleic Acids Research.
This is an Open Access article distributed under the terms of the Creative Commons Attribution License (http://creativecommons.org/licenses/by/4.0/), which
permits unrestricted reuse, distribution, and reproduction in any medium, provided the original work is properly cited.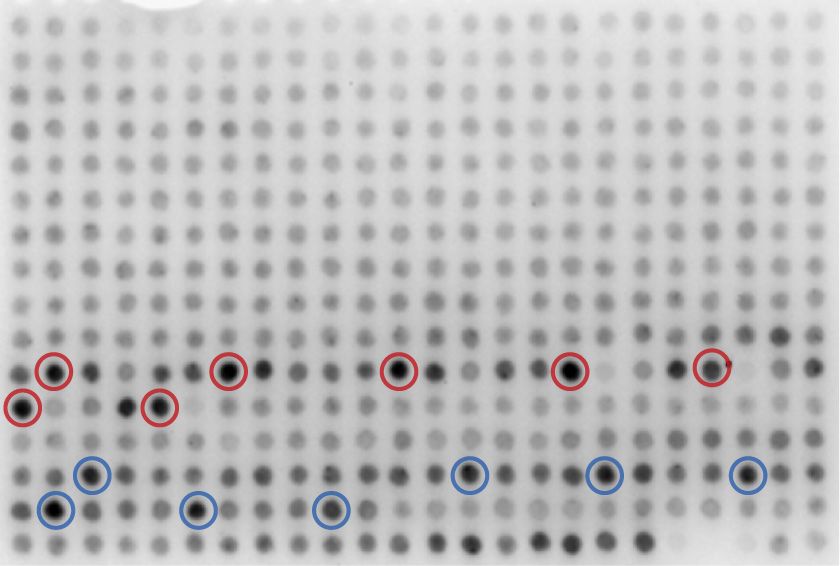
Nucleic Acids Research, 2021, Vol. 49, No. 8 4351

Thus, LSD1 represents a critical oncogene and potential           vestigate the opposing effect of the BAF complex on PRC-
therapeutic target in different cancer subtypes.                  induced heterochromatin formation, leading to the forma-
   Most biological functions of LSD1 are associated with          tion of accessible chromatin (47,48).
its activity to regulate the lysine methylation state of his-        We aimed to identify and characterize functional coreg-
tones and non-histone proteins. LSD1 has been highlighted         ulators that are required for LSD1 activity and adopted
for its dual ability to stimulate or suppress gene expression     the CiA concept to generate a time-resolved fluorescent re-
(23–25) and was reported to demethylate lysine residues on        porter system to monitor the activity of LSD1 in cells. To
histones as well as non-histone substrates such as p53 and        identify essential and novel coregulators of LSD1, we com-
DNMT1 (26,27). LSD1 mediates the demethylation of his-            bined our fluorescent reporter system with a microRNA-
tone H3K4me1 and H3K4me2, thereby conducting a tran-              embedded short hairpin RNA (shRNAmir) library focused
scriptional repression (28–30), in part through downregu-         on epigenetic effectors to perform a chromatin effector
lation of enhancer function (22). Contradictory to its core-      coregulator screen (ChECS). Our results provide a de-
pressor function, LSD1 can directly activate the expression       tailed functional view on the coregulator network of LSD1

                                                                                                                                 Downloaded from https://academic.oup.com/nar/article/49/8/4350/6212757 by guest on 24 September 2021
of target genes through demethylation of histone H3K9me2          in a multiplexed manner. Deeper characterization of one
(29–32). The exact molecular mechanism of its dual sub-           of the top hits from the screen, the DEAD-box helicase
strate specificity remains unclear, but recent publications       19A (DDX19A) showed that RNA:DNA hybrid structures
support the hypothesis that a newly discovered alterna-           (also called R-loops) strongly interfered with the activ-
tive LSD1 splice variant (LSD1+8a) restricted to neuronal         ity of LSD1. Our data reveal a novel regulatory cascade,
tissues is responsible for demethylation of H3K9 (33–35).         which enables LSD1 induced transcriptional repression via
LSD1 has been shown to be associated with actively tran-          a three-step mechanism. The decrease of H3K4 methyla-
scribed genes in many cell types (22,23,28), which suggests       tion at a particular genomic region induced by the activ-
that its H3K4 demethylation activity is blocked at these loci.    ity of LSD1 leads to the recruitment of PRC2 to introduce
In fact, the activity of LSD1 is tightly controlled and coun-     H3K27 methylation. This modification serves as a signal for
terbalanced by associated coregulators and the interaction        DDX19A, which binds to H3K27me3 via a yet unknown
of LSD1 with coregulatory complexes, e.g. CoREST or the           motif and removes R-loops. This de-represses LSD1 and
NuRD histone deacetylase (HDAC) transcription corepres-           PRC2 establishing a positive feedback loop leading to a
sor complexes, represents an important regulatory feature         strong repression of transcription at the targeted region.
(1,32,36,37). Additionally, LSD1 activity was shown to be
negatively regulated by the interaction with specific RNA         MATERIALS AND METHODS
structures (38), a feature also shown for other coregulator
complexes, e.g. PRC2 (39,40). Finally, LSD1 can be subject        Plasmids
to post-translational modifications (PTMs) which regulate         The fluorescent reporter expressing mCherry from a syn-
its transcriptional activity (41).                                thetic promoter (synP), consisting of six tetO binding sites
   This highlights the immense complexity of LSD1 regu-           upstream of an EF1a promoter, was cloned into pMSCV
lation on different levels, which creates highly specific and     vector, on which expression of mCherry was driven by the
tightly controlled LSD1 transcriptional outputs regulated         synP promoter element and coupled to Blasticidin resis-
by coordinated fine-tuning of the binding affinity of LSD1        tance via a P2A (pMSCV-tetO-EF1a-mCherry-2A-Blasti).
to target loci and complex partners. Understanding the de-        The rTetR-LSD1 fusion construct was cloned into a pRRL
pendence of LSD1 function on accessory proteins will shed         backbone by standard cloning methods. The LSD1 con-
light on several signaling pathways and provide new ther-         struct was kindly provided by Tim Somervaille. Expres-
apeutic avenues by targeting factors that modulate LSD1           sion was driven from an SFFV promoter and coupled to
activity instead of or additionally to targeting LSD1 itself      Hygromycin resistance via a P2A sequence (pRRL-rTetR-
(42). Understanding how LSD1 evokes specific transcrip-           LSD1-P2A-Hygro). shRNA guides were cloned into the
tional profiles depending on its association with defined         SGEN vector (49).
coregulators in distinct cellular contexts will be critical for
the development of novel and more efficient LSD1-focused
                                                                  Antibodies
therapies. To date no comprehensive strategy to identify
LSD1 coregulators and unravel their molecular function            Antibodies used for ChIP were H3K9me3 (ab8898, Ab-
has been devised.                                                 cam), H3K4me2 (ab7766, Abcam and #39141, Active
   Recent methodologic advances introduced the chromatin          Motif), H3K27me3 (#39155, Active Motif), H3K27Ac
in vivo assay (CiA) system, a variation of chemical induced       (ab4729, Abcam) and KDM1/LSD1 (ab17721, Ab-
proximity (CIP), as a novel method to investigate the con-        cam). Primary antibodies used for immunodetection
sequences of locally induced alterations of the chromatin         after Western Blot were TetR monoclonal antibody 9G9
landscape after controlled recruitment of an epigenetic ef-       (#631131, TAKARA), DDX19A (orb242165, Biorbyt
fector (43). CiA has successfully been applied to study the       or ab108462, Abcam), RNA:DNA Hybrid Antibody,
dynamics of heterochromatin formation at the Oct4 locus           clone S9.6 (MABE1095, MERCK/Sigma-Aldrich) and
in mouse embryonic stem cells (mESCs) after the recruit-          KDM1A (#61607 and #39186, Active Motif). Secondary
ment of HP1␣ (44), components of the PRC2 complex (45)            antibody used for immunofluorescence was the Goat Anti-
and, combined with a high throughput small molecule li-           Mouse IgG H&L (Alexa Fluor® 594, ab150116, Abcam).
brary screen, to identify compounds inducing the formation        Antibody used for detection of DDX19A-GST was the
of euchromatin (46). Additionally, CiA has been used to in-       goat anti-GST antibody (GE Healthcare, #27–4577-01).
4352 Nucleic Acids Research, 2021, Vol. 49, No. 8
Secondary antibodies for analysis of Western Blots were ulations (mCherry+/mCherry–) across five replicates. The
either coupled to horseradish peroxidase (GE Healthcare) gene score was derived by summarizing the average enrich-
or to IRDye® 800CW (ab216773, Abcam). ment score of all shRNAs per gene. P-values are based
on a Poisson distribution of each shRNA in each individ-
ual replicate followed by the combination of all P-values
Pooled RNAi screening
across all replicates using Fisher´s method (cumulative 2 ).
After spiking in control shRNAs at equimolar amounts, 2 is a chi-squared distribution with 2k degrees of freedom,
the shRNA-mirE library (5451 shRNAs and 8 con- where k is the number of tests being combined. This fact was
trol shRNAs) targeting 1010 chromatin-associated murine used to determine the P-value for 2 followed by a Bonfer-
genes was transduced into NIH/3T3 cells expressing the roni correction for multiple comparison to obtain a P-value
synP-mCherry reporter and rTetR-LSD1. To ensure li- for each investigated gene in the library.
brary representation, a total of 30 million cells were in-
fected with 10% transduction efficiency using conditions
Downloaded from https://academic.oup.com/nar/article/49/8/4350/6212757 by guest on 24 September 2021
Cell culture, retroviral transduction and flow cytometry
that predominantly lead to a single retroviral integration
and represent each shRNA in a calculated number of >500 NIH/3T3, Lenti-X 293T and Platinum-E retroviral pack-
cells. Cells were split into replicates and selected with 2.5 aging cell lines were cultivated in DMEM high glucose me-
mg/ml Neomycin for 7 days before starting treatment with dia (Sigma-Aldrich) supplemented with 10% FBS, 20 mM
1 g/ml doxycycline. Throughout selection >3 × 10⁶ cells glutamate, 10 mM sodium pyruvate, 10 mM HEPES (pH
per replicate were maintained at each passage to preserve li- 7.3), 100 U/ml penicillin and 100 mg/ml streptomycin in
brary representation. After 14 days of DOX treatment, cells an incubator providing 37◦ C and 5% CO2 . For retroviral
were sorted into mCherry-positive (top 6–8%, minimum of packaging of pMSCV vectors, 20 g of plasmid were pre-
5 × 10⁵ cells) and mCherry-negative (lowest 75–80%, mini- cipitated for 20 min in HBS buffer (140 mM NaCl, 25 mM
mum of 6 × 10⁶ cells, see Supplementary Figure S2) popula- HEPES, 0.75 mM Na2 HPO4 , pH 7.0) together with 125
tions using a FACS Aria III. Genomic DNA for both popu- mM CaCl2 and 10 g GagPol helper plasmid. The mix
lations and 5 replicates was isolated with phenol-extraction was added to a 10 cm dish with Platinum-E cells grow-
using PhaseLock tubes, followed by ethanol precipitation. ing at 75–85% confluence in supplemented DMEM. After
For each sample, DNA from at least 106 cells was used as 16 and 24 h, the media was replaced with fresh DMEM.
template in multiple parallel 50-l PCR reactions, each con- Supernatant containing the virus was gathered 40–50 h
taining 1 g template, 1× AmpliTaq Gold buffer, 0.2 mM after transfection, filtered through a 0.45 m filter and
of each dNTP, 2 mM MgCl2 , 0.3 M of each primer and added to the target cells at 50–70% confluence. Antibiotic
1.25 U AmpliTaq Gold Polymerase (Life Technologies). In selection for pMSCV-tetO-EF1a-mCherry-2A-Blasti with
a first round of PCRs, random barcodes and sample bar- 10 g/ml Blasticidin was started 2 days after transduc-
codes were added to the shRNA sequences using the fol- tion and kept up for 7 days. For retroviral packaging of
lowing cycling parameters: 95◦ C for 10 min; 28 cycles of pRRL-vectors, plasmids were mixed with helper plasmids
(95◦ C for 30 s, 54◦ C for 45 s and 72◦ C for 60 s); 72◦ C for 7 pCMVR8.74 (pCMVR8.74 was a gift from Didier Trono,
min and primers MM2P51 for and MM2P71 rev (Supple- Addgene #22036) and pCAG-Eco (pCAG-Eco was a gift
mentary Table S3). PCR products were combined for each from Arthur Nienhuis & Patrick Salmon, Addgene #35617)
sample, purified from a 1% agarose gel and 20 ng per sam- and 3× (w/w) excess of polyethyleneimine 25K in serum
ple were transferred to a second round of PCR, using sim- free DMEM. The mix was added to Lenti-X cells residing
ilar cycling parameters as for PCR1, but with only 10 ng in supplemented DMEM at 75–90% confluence. Media ex-
template per reaction, 6 cycles of amplification and primers changes and transduction of target cells was performed as
MM2P52 for and MM2P72 rev N708 (Supplementary Ta- described for pMSCV. Cells expressing pRRL-rTetR-LSD1-
ble S3). In the second PCR, standard Illumina P7 adaptors P2A-Hygro were selected with 500 g/ml Hygromycin and
and the Illumina N708 index were added to the sequences cells expressing SGEN with 2.5 mg/ml Neomycin for 7 days.
(total product length = 428 bp). All primers used for the Recruitment of rTetR-LSD1 was started 12 days after trans-
library preparation are listed in Supplementary Table S2. duction with SGEN by treatment with 1g/ml Doxycy-
The final libraries were cleaned up from a 1% agarose gel, cline. Inhibitor treatment with 10 M GSK-LSD1, 5 M
pooled and analysed on an Illumina HiSeq 3000 deep se- GSK343 (Sigma-Aldrich) or 400 nM TSA (Sigma-Aldrich)
quencer (150 bp read length including the 22 nucleotides was started in parallel with the first DOX induction and
of the guide strand), using standard Illumina primers. Se- maintained for the indicated number of days. Expression
quence processing was performed using a public Galaxy of GFP and mCherry was analysed every 1–3 days using a
server (www.usegalaxy.eu). All primary screen data are pro- MACSQuant Vyb flow cytometer.
vided in Supplementary Data Table S1. For each shRNA,
the number of matching reads was normalized to the to-
ChIP-qPCR
tal number of library-specific reads per lane and imported
into Microsoft Excel for further analysis. Completely de- For H3K4me2-, H3K27me3- and H3K27ac-ChIP experi-
pleted shRNAs (0 reads at T0) obtained a fold depletion ments, NIH/3T3 stably expressing the synP-mCherry re-
value of 1 × 10⁻³ . The average enrichment score for each porter, rTetR-LSD1 wt or K661A and if indicated, the re-
individual shRNA was calculated by dividing the geomet- spective shRNA, were treated with 1 g/ml doxycycline
ric mean of the normalized reads of the mCherry+ popu- for 4 days. Cells were washed once with 1× PBS, before
lation by the respective normalized reads mCherry– pop- incubation with 1% formaldehyde in 1× PBS for 15 min
Nucleic Acids Research, 2021, Vol. 49, No. 8 4353
at room temperature. Crosslinking was quenched with 225 instructions. In brief, 2 × 10⁷ NIH/3T3 cells were fixed and
mM glycine for 5 min. Cells were washed twice with 1× harvested as described in the protocol. Fragmentation was
PBS and harvested with a Corning® cell scraper in 10 ml performed in aliquots of 5 × 10⁶ cells using an EpiShear
1× PBS per 10 × 106 cells. Cells were centrifuged for 8 min Probe Sonicator (Active Motif) for 39 cycles (20 s pulse,
at 600 × g and the pellet was washed again with 10 ml 1× 30 s pause, 40% amplitude), aliquots were united again
PBS, 500 nM TSA per 10 × 106 cells. Pellets were split into and 5% were taken for input. To increase amount of pre-
aliquots of 5 × 10⁶ cells, snap frozen and stored at –80◦ C cipitated chromatin, 3 × 25 g chromatin were used for
until use. For preparation of mononucleosomes, each pellet three independent IPs with 4 g LSD1 antibody (ab17721,
was lysed in 125 l lysis buffer (10 mM Tris–HCl pH 7.4, Abcam) each, following manufacturer’s protocol. During
2 mM MgCl2 , 0.6% Igepal-Nonidet P40, 0.5 mM PMSF, DNA clean-up, the three samples were loaded onto two
1 mM DTT, cOmplete™ EDTA-free PIC, 5 mM sodium- columns and the final eluates were united. Library prepara-
butyrate) for 15 min on ice. Samples were digested with 300 tion was performed using the NEBNext® Ultra™ II DNA
U micrococcal nuclease for 16 min at 37◦ C. The reaction Library Prep Kit following manufacturer´s protocol. 1 g
Downloaded from https://academic.oup.com/nar/article/49/8/4350/6212757 by guest on 24 September 2021
was put on ice and stopped by addition of 8 M EDTA, of input DNA and 50% of precipitated ChIP DNA were
0.1% Triton X-100 and 0.1% sodium deoxycholate. Sam- used. After end repair and adapter ligation, the input was
ples were diluted by addition of 800 l Complete IP buffer amplified using standard Illumina primers i705 and i503 for
(20 mM Tris–HCl pH 8.0, 2 mM EDTA, 150 mM NaCl, 3 cycles, the ChIP sample was amplified using i706 + i504
0.1% Triton X-100, 1 mM PMSF, cOmplete™ EDTA-free for 11 cycles. Libraries were analysed on a LabChip® GX
PIC, 5 mM sodium-butyrate) and clarified by centrifuga- Touch™ Nucleic Acid Analyzer. Fragments with a size of
tion at 15 000 × g for 10 min at 4◦ C. The supernatant was 250–700 bp were sequenced on an Illumina HiSeq3000 us-
split into aliquots of 40–70 g chromatin and snap frozen. ing standard Illumina protocols.
Before IP, Drosophila melanogaster mononucleosomes were
added to the NIH/3T3 chromatin samples as spike-in con-
ChIP-Seq data analysis
trol (2–3.5 g = 5% of total chromatin). Ten percent of
the sample was taken as input. For pre-clearing, 2.5 g of Data analysis was performed on a public Galaxy server
rabbit/mouse IgG (depending on the species of antibody (www.usegalaxy.eu). After quality control, the remaining
used for IP) and 10 l of Dynabeads® Protein G were in- reads were aligned to the respective genome (mouse: mm9,
cubated with the sample for 2 h at 4◦ C with constant rota- human: hg19) using Bowtie2. Reads with same start and
tion. The beads were removed using a magnetic rack and end position on the same strand were removed from the
the sample was split into halves for IP/IgG control. 2.5 g alignment. To identify ChIP-seq peaks, we used the MACS2
of ChIP antibody or IgG were added to the samples and peak finding algorithm (50). A threefold enrichment rela-
incubated over night at 4◦ C with constant rotation. 20 l tive to input control samples was used for peak calling as
Dynabeads® Protein G per sample were blocked overnight well as the option to call broad peaks. Building a shifting
in Complete IP buffer with 0.1 mg/ml BSA. Pre-blocked model was disabled and the small nearby and large nearby
beads were incubated with the samples for 2 h at 4◦ C with region parameters were set to 5000 and 20 000, respec-
rotation to bind antibodies. Beads were washed twice with tively. The extension size was set to the respective median
low salt buffer (20 mM Tris–HCl pH 8.0, 2 mM EDTA, insert size of the ChIP-seq treatment sample for paired-end
150 mM NaCl, 1% Triton X-100, 0.1% SDS), twice with data and the estimated fragment size for single-end data.
high salt buffer (20 mM Tris–HCl pH 8.0, 2 mM EDTA, Downstream analysis was performed using the deepTools2
500 mM NaCl, 1% Triton X-100, 0.1% SDS) and once with (51) suite using the multiBigwigSummary function to com-
TE buffer (10 mM Tris–HCl pH 8.0, 1 mM EDTA) to re- pute the average scores for each of the bigWig files in ev-
move unspecific binding. Bound chromatin was eluted from ery genomic region. This analysis was performed for the en-
the beads by resuspending in 100 l SDS elution buffer tire genome by running the program in bins mode. Subse-
(1% SDS, 100 mM NaHCO3 ) and rotating for 30 min at quently the result was plotted using the plotPCA and plot-
room temperature. Elution was performed twice and the Correlation functions. Peaks were assigned to the respective
eluates were combined. Samples were de-crosslinked for 16 genes using ChIP-enrich (52) by assigning peaks to the clos-
h at 65◦ C with 2 g RNase A and 270 mM NaCl. Pro- est upstream/downstream TSS.
teinase digest was performed for 2 h at 45◦ C with 60 g Pro- The NIH/3T3 LSD1 ChIP-seq data of our study is avail-
teinase K. DNA fragments were extracted using the ChIP able at Gene Expression Omnibus (https://www.ncbi.nlm.
DNA Purification Kit (Active Motif), and amplified using nih.gov/geo/) entry GSE158441.
ORA™SEE qPCR reagent (HighQ) and qPCR primers am- The following ChIP-seq tracks were obtained from
plifying a 120 bp fragment of the EF1a promoter. Cq values published data sets in K562 cells and mapped to
were normalized to input and Drosophila spike-in control. hg19: H3K27ac (Encode sample ENCFF384ZZM),
ChIP for H3K9me3 was performed the same way, except H3K27me3 (Encode sample ENCFF936BVT), H3K9me3
that the samples were harvested after 14 days of DOX treat- (Encode sample ENCFF700FQH), H3K36me3 (En-
ment and not crosslinked before fragmentation and IP. code sample ENCFF223BKS), H3K4me1 (Encode
sample ENCFF463AQS), H3K4me2 (Encode sample
ENCFF778DNU), LSD1 (GEO sample GSM831002),
ChIP-seq
R-ChIP (GEO sample GSM2551007/8), DRIP-seq
LSD1 ChIP-seq was performed using the ChIP-IT High (GEO sample GSM1720619), GQ-seq (GEO sam-
Sensitivity® Kit (Active Motif) following manufacturer’s ple GSM2876090/1). K562 RNA-seq (GEO sample
4354 Nucleic Acids Research, 2021, Vol. 49, No. 8
GSM1557077). The following ChIP-seq tracks were ob- and twice in TE buffer (pH 8). Nucleic acids were eluted in
tained from published data sets in NIH/3T3 cells and 50 l elution buffer (50 mM Tris pH 8, 10 mM EDTA, 1%
mapped to mm9: H3K9ac (GEO sample GSM1246687), SDS) for 15 min at 65◦ C and further purified with the Nu-
H3K27me3 (GEO sample GSM1246690), H3K36me3 cleoSpin Gel and PCR Clean-up kit (Macherey-Nagel), nu-
(GEO sample GSM1246692), H3K9me2 (GEO sam- cleic acids were eluted in 50 l of elution buffer (5 mM Tris,
ple GSM1246688), H4ac (GEO sample GSM1418787), pH 8.5). DNA fragments were amplified using ORA™SEE
H3K4me3 (GEO sample GSM879920), DRIPc-seq qPCR reagent (HighQ) and qPCR primers amplifying a 120
(GEO sample GSM2104456), DRIP-seq (GEO sample bp fragment of the EF1a promoter. Cq values were normal-
GSM1720621). NIH/3T3 RNA-seq (Encode sample ized to input and Drosophila spike-in control.
ENCFF001QSC).
S9.6 antibody IP
RNA:DNA hybrid IP (DRIP)
100 l Dynabeads® Protein G were pre-blocked with
Downloaded from https://academic.oup.com/nar/article/49/8/4350/6212757 by guest on 24 September 2021
Based on a detailed assessment of various DRIP proto- 0.5% BSA/PBS for 2 h at 4◦ C. 10 × 106 non-crosslinked
cols (53), DRIP was performed as described, with slight NIH/3T3 cells were harvested, washed once in 1× PBS
adaptations to workflow #19 (53). In brief, NIH/3T3 cells and lysed in 1 ml Cell Lysis Buffer (85 mM KCl, 5 mM
were harvested, washed once with 1X PBS and cross-linked HEPES pH 8, 0.5% NP-40, cOmplete™ EDTA-free PIC)
in 1% formaldehyde/PBS for 10 min at room temperature. for 15 min on ice. Nuclei were collected by spinning 1 min
Crosslinking was quenched with 500 mM glycine for 5 min at 15 000 × g, 4◦ C. The pellet was resuspended in 750
at room temperature. Cells were lysed in 300 l of ChIP ly- l RSB buffer (10 mM Tris–HCl pH 7.5, 200 mM NaCl,
sis buffer (50mM HEPES–KOH at pH 7.5, 140 mM NaCl, 2.5 mM MgCl2 , cOmplete™ EDTA-free PIC) supplemented
1 mM EDTA at pH 8, 1% Triton X-100, 0.1% sodium- with 0.2% sodium-deoxycholate, 0.1% SDS, 0.05% sodium-
deoxycholate, 1% SDS) per 2 million cells for 30 min on ice lauroyl-sarcosinate and 0.5% Triton X-100. Cells were son-
and homogenized with a syringe every 10 min. Chromatin icated for 4 min in an EpiShear Probe Sonicator (20 s pulse,
was fragmented by sonication using an EpiShear Probe 30 s pause, 40%). After taking 5% as input, samples were
Sonicator (Active Motif) for 2 × 12 cycles (20 s pulse, 30 transferred to a 15 ml falcon tube and diluted 1:4 by addi-
s pause, 40% amplitude). The fragmented chromatin was tion of 2.3 ml RSB with 0.5% Triton X-100 (RSB+T). The
supplemented with 300 mM NaCl and 50 g of RNase A samples were subjected to pre-clearing with 5 g mouse IgG
in 450 l TE buffer (10 mM Tris–HCl pH 8, 10 mM EDTA and 35 l Dynabeads® Protein G for 1 h at 4◦ C. Magnetic
pH 8) and incubated at 37◦ C for 1 h. The cross-linked D. beads were locked and the supernatant was split into three
melanogaster mononucleosomes were treated in parallel to Eppendorf tubes. For the S9.6 antibody-specificity control,
obtain DNA for spike-in controls. To remove proteins and 40 U of RNAse H (NEB) were added to one of the tubes
reverse the cross-links, the samples were treated with 15 l and all samples were incubated for 10 min at 37◦ C before
of Proteinase K (20 mg/ml; Thermo Fisher Scientific) at adding the IP antibodies. The samples were subjected to IP
65◦ C for 16 h. Nucleic acids were extracted in two rounds with 4 g of either the S9.6 antibody or mouse IgG and
of phenol extraction using PhaseLock tubes (Eppendorf), 32 l pre-blocked beads per sample. 10 ng RNase A was
followed by ethanol precipitation at –20◦ C overnight. 15 l added to each tube before rotating at 4◦ C for 2.5 h. Beads
Dynabeads® Protein G per sample were blocked overnight were washed 4× with 500 l RSB+T and 2× with RSB.
in 1% BSA in 1× PBS. Nucleic acid precipitate was col- With each buffer change, beads were transferred to fresh
lected by centrifugation at 15 000 × g for 30 min, 4◦ C, the low-binding tubes to minimize leftover unspecific binding.
pellet was washed once with 70% ethanol and air-dried at Proteins were eluted in 40 l of 2× SDS sample buffer (125
25–30◦ C. The pellet was resuspended in 5 mM Tris–HCl, mM Tris–HCl pH 6.8, 5% SDS, 0.004% Bromophenol Blue,
pH 8.5 and concentration was determined by NanoDrop. 10% -mercaptoethanol, 100 mM DTT, 20% glycerol) for
To immobilize the S9.6 antibody, pre-blocked Dynabeads® 10 min at 70◦ C. The supernatant was transferred to fresh
Protein G were resuspended in 1 ml IP buffer (50 mM tubes and boiled at 95◦ C for 10 min for denaturation, along
HEPES/KOH at pH 7.5; 0.14 M NaCl; 5 mM EDTA; 1% with the input sample mixed with 2× sample buffer. SDS-
Triton X-100; 0.1% sodium-deoxycholate) and incubated PAGE and immunodetection of proteins were performed as
with 2 g of S9.6 antibody per sample for 4 h, 4◦ C. of Frag- described for immunodetection of proteins.
mented nucleic acids (1.5 g) and 50 ng of Drosophila spike-
in were added to the antibody/bead complexes and IP was
Immunodetection of proteins after SDS-PAGE
performed overnight at 4◦ C. For the RNAseH1 controls,
1.5 g of nucleic acids were digested with 40 U RNAse H For the analysis of protein levels, cells were harvested 13
(NEB) at 37◦ C overnight. The enzyme was inactivated by in- days after transduction and antibiotic selection. Pellets were
cubation for 20 min at 65◦ C and the sample was taken as in- lysed in cell lysis buffer (Cell Signaling Technology® ) for 30
put for the IP in parallel with the untreated samples. Beads min on ice. After 10 and 20 min of incubation, the lysate was
were washed once with 1 ml IP wash 1 buffer (20 mM Tris sonicated with an EpiShear Probe Sonicator (Active Mo-
pH 8.0, 2 mM EDTA, 50 mM NaCl, 1% Triton X-100, 0.1% tif) for 2 cycles of 20 s to release nuclear protein. The lysate
SDS), twice with 1 ml high salt buffer (20 mM Tris pH 8, 2 was centrifuged at 15 000 × g for 10 min, the supernatant
mM EDTA, 500 mM NaCl, 1% Triton X-100, 0.01% SDS), was mixed with 2× SDS sample buffer (125 mM Tris–
once with 1 ml IP wash buffer 2 (10 mM Tris pH 8, 1 mM HCl pH 6.8, 5% SDS, 0.004% Bromophenol Blue, 10% -
EDTA, 0.25 M LiCl, 1% NP-40, 1% sodium-deoxycholate) mercaptoethanol, 100 mM DTT, 20% glycerol) and boiled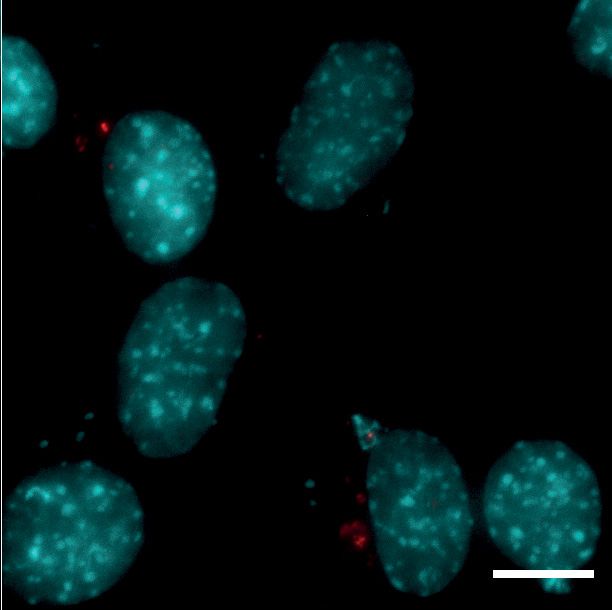
Nucleic Acids Research, 2021, Vol. 49, No. 8 4355
at 95◦ C for 10 min. Proteins were resolved by SDS-PAGE RNA:DNA unwinding assay
on a 12% polyacrylamide gel. Proteins were transferred to
RNA:DNA unwinding assay was performed as de-
an Immobilon-FL PVDF membrane at 300 mA for 90 min
scribed (54). In brief: RNA:DNA hybrids were
using a wet-tank blotting system (BioRad). Proteins were
annealed in vitro in 5 mM Tris/HCl pH 8.5.
detected using a target specific primary antibody at manu-
The sequence of the top RNA strand was: 5 -
facturer´s recommendations in combination with a species-
GAAGCUGGGACUUCCGGGAGGAGAGUGCAA-
specific HRP- or IRDye® 800CW-coupled secondary anti-
3 , and the sequence of the bottom DNA strand was 5 -C
body. Imaging was performed on a FusionFX detection sys-
GGGTTGTCAAGAATTTTAACGGCCATTTCTGTGT
tem (VILBER) using SuperSignal™ West Femto Chemilu-
TGCACTCTCCTCCCGGAAGTCCCAGCTTCTGT
minescence substrate (ThermoFisher Odyssey® CLx imag-
GTTTGTGACAAACGCAAGCTCATGTAAGTGCTC-
ing system (LI-COR).
3 . The annealed RNA:DNA hybrid has a 5 ssDNA
overhang and is labeled with Cy-5. Unwinding experiments
were carried out at 30◦ C for 60 min in 30 mM Tris–HCl
Downloaded from https://academic.oup.com/nar/article/49/8/4350/6212757 by guest on 24 September 2021
Gene expression analysis (pH 7.5), 50 mM NaCl, 5 mM MgCl2 , 2 mM DTT, 0.01%
NP-40, 0.1 mg/ml BSA, 4 mM ATP, 1 nM Cy-5-labeled
For analysis of mRNA expression levels of Ddx19a, cells
RNA:DNA hybrid substrate, in the presence of 4.79 M
were harvested 13 days after transduction with the specific
recombinant DDX19A. The reaction was stopped by the
shRNAs (Supplementary Table S3) and antibiotic selection.
addition of SDS to a final concentration of 0.5% and 20
RNA was extracted using the RNeasy Plus mini Kit (QI-
ng proteinase K (20 mg/ml). The reaction was afterward
AGEN). Reverse transcription and quantitative PCR were
loaded onto a 10% non-denaturing polyacrylamide gel and
performed in one step using the Luna® Universal One-
analysed using a FusionFX detection system (VILBER).
Step RT-qPCR Kit (NEB) and a CFX Real-Time PCR de-
tection system (Bio-Rad). Beta-2-Microglobulin was used
for normalization. qRT-PCR primers are described in Sup- Celluspot and peptide arrays
plementary Table S5. Peptide arrays containing peptides with a length of 15
amino acids were synthesized by spotting on a cellulose
membrane using an Autospot peptide array synthesizer (In-
Protein purification tavis AG) and the SPOT synthesis method (55). MODified™
Histone Peptide Arrays (Active Motif) or synthesized pep-
For GST-tag purification of GST-DDX19A, E.coli tide arrays were blocked overnight in blocking solution (5%
BL21(DE3) cells were transformed with 50 ng of pGEX- milk powder, 1× PBS, 0.1% Tween20) at 4◦ C. Both arrays
DDX19A plasmid and plated on LB agar with 35 g/ml were washed three times for 5 min with 1× PBS/Tween-20
Chloramphenicol and 50 g/ml Kanamycin. Subsequently, and pre-incubated for 10 min in interaction buffer (100 mM
50 ml LB/Kanamycin were inoculated with one colony and KCl, 20 mM HEPES pH 7.5, 1 mM EDTA pH 8, 10% glyc-
the starter-culture was cultivated at 37◦ C, 150 rpm for 6 h. erol). Binding of DDX19A-GST was performed by incuba-
500 ml LB/Kanamycin were inoculated with 6 ml of starter tion of 50 nM protein with the pre-blocked array in inter-
culture and cultivated at 37◦ C, 150 rpm until OD600 = 0.7. action buffer for 1 h at room temperature. The array was
Expression of GST-DDX19A was induced by addition of washed three times for 10 min in 1× PBS/Tween20 and in-
500 M IPTG and overexpression was performed at 20◦ C, cubated with an anti-GST antibody (GE Healthcare, #27-
150 rpm for 14 h. Cells were harvested at 5000 × g for 15 4577-01) in 5% non-fat dried milk/1x PBS/Tween-20 for 1
min, 4◦ C. Pellets were washed once in 30 ml STE buffer h at room temperature. The array was washed again as de-
(100 mM NaCl, 10 mM Tris–HCl pH 8, 1mM EDTA) and scribed and incubated with an anti-goat-HRP antibody in
frozen at –20◦ C until use. For purification, pellets were 5% milk/1× PBS/Tween-20 for 1 h. After repeated washing,
resuspended in 30 ml sonication buffer (20 mM HEPES pH twice for 10 min in PBS/Tween-20 and once for 10 min in
7.5, 0.2 mM DTT, 500 mM KCl, 1 mM EDTA, 10% glyc- PBS, the array was imaged using a FusionFX detection sys-
erol) with protease inhibitor and lysed by sonication using tem (VILBER) and SuperSignal™ West Femto Chemilumi-
an EpiShear Probe Sonicator (Active Motif). The lysate nescence substrate (ThermoFisher). Synthesized peptide se-
was cleared by centrifugation and filtration through a 0.45 quences were: H3K4 ARTKQTARKSTGGKA; H3K9 RT
m CHROMAFIL GF/PET-45/25 filter (MACHEREY- KQTARKSTGGKAP; H3K27 LATKAARKSAPATGG;
Nagel). Affinity chromatography was performed using an H3K36 APATGGVKKPHRYRP; H4K20 GGAKRHRK
NGC™ Chromatography system (BIO-Rad) and Protino® VLRDNIQ
Glutathione Agarose 4B beads (MACHEREY-Nagel).
Proteins were eluted in elution buffer (20 mM HEPES
Immunofluorescence microscopy
pH 7.5, 500 mM KCl, 0.2 mM DTT, 1 mM EDTA, 10%
glycerol, 40 mM glutathione) and subjected to dialysis into NIH/3T3 cells were cultivated until 70–90% confluency on
storage buffer (20 mM HEPES pH 7.5, 200 mM KCl, 0.2 microscopy coverslips. Cells were washed three times for
mM DTT, 1 mM EDTA, 10% glycerol). Aliquots were 5 min with 2 ml PBSCa2+ Mg2+ (Sigma-Aldrich). Cells were
snap-frozen and stored at –80◦ C. For storage at –20◦ C, fixed for 10 min at room temperature in 4% paraformalde-
proteins were transferred to a different storage buffer (20 hyde. Cells were washed as described and permeabilized
mM HEPES pH 7.5, 200 mM KCl, 0.2 mM DTT, 1 mM with 0.2% ice-cold TritonX-100 in PBS for 5 min. Cells were
EDTA, 60% glycerol) by another round of dialysis. blocked in 2 ml 5% non-fat dried milk in PBSCa2+ Mg2+ for
4356 Nucleic Acids Research, 2021, Vol. 49, No. 8
1h at room temperature. Primary antibody binding was per- peptide comprising residues 16–34 of the H3.1 tail was un-
formed overnight at 4◦ C with a concentration of 4 g/ml modified or trimethylated at K27. Binding was analysed us-
antibody in PBSCa2+ Mg2+ /5% non-fat dried milk powder. ing a Jasco FP-8300 spectrofluorometer with an automatic
Secondary antibody binding was performed at room tem- polarizer (FDP-837). Acquisitions were performed at 23◦ C,
perature for 2 h with a concentration of 0.5 g/ml antibody with excitation at 495.0 nm and emission measured at 520
in PBSCa2+ Mg2+ /5% milk powder. Cells were stained with nm. Slit width was set to 5 nm. 50 nM of peptide were
1g/ml DAPI in PBSCa2+ Mg2+ for 3 min, washed again with dissolved in 0.5 ml of anisotropy buffer (20 mM HEPES
PBS and mounted on microscopy slides using Mowiol® 4– pH 7.5, 100 mM KCl, 0.1 mM DTT, 10% v/v glycerol).
88 (Sigma-Aldrich). DDX19A diluted in dialysis buffer (20 mM HEPES pH 7.5,
200 mM KCl, 1 mM Na2-EDTA, 60% v/v glycerol, 0.2 mM
DTT) was added stepwise. Titrations were conducted in at
Image acquisition and analysis
least 3 technical replicates. Control experiments were con-
For the quantification of the S9.6 staining, samples were ducted with dialysis buffer without protein and the fluores-
Downloaded from https://academic.oup.com/nar/article/49/8/4350/6212757 by guest on 24 September 2021
analysed on a Zeiss Axio Observer.Z1 microscope equipped cence anisotropy values were corrected accordingly. For de-
with a Plan-Apochromat 63×/1.40 Oil DIC M27 objective termination of the KD -values for H3.1, the data were fitted
and an AxioCam MRm camera. The following excitation to a simple binding equilibrium:
and emission filters were used: Blue channel: excitation fil- cDDX19A
ter 335–383 nm, emission filter 420–470 nm; red channel: Signal = BL + F∗
excitation filter 538–562 nm, emission filter 570–640 nm; cDDX19A + KD
green channel: excitation filter 450–490 nm, emission filter With KD = equilibrium dissociation constant, F = signal
500–550 nm. Z-stacks covering the whole nucleus were ac- factor and BL = baseline.
quired applying an interval of 450 nm, and images were sub-
jected to deconvolution using a constrained iterative algo-
rithm and the ZENblue version 2.3 software (Zeiss), before Statistical analyses
generating maximum intensity projections. Quantitative im- Results are presented as means ± standard error of the
age analysis was done with CellProfiler™ version 2.2 (56). mean [s.e.m.]. Matching sets of samples (treated vs control)
Nuclei were identified via the DAPI staining. were normalized to the average of all samples in this repli-
cate. Values were scaled to the average of all untreated repli-
Co-immunoprecipitation of LSD1 cates set to average = 1. If not stated otherwise, statistical
significance was calculated by one-tailed unpaired t-test on
NIH/3T3 were harvested by trypsinization. The pellet was two experimental conditions with p≤0.05 considered statis-
resuspended in 2× pellet volume of nuclear lysis buffer B tically significant. Statistical significance levels are denoted
(50 mM Tris–HCl pH 7.4, 20% glycerol, 1.5 mM MgCl2 , as follows: ****P ≤ 0.0001; ***P ≤ 0.001; **P≤ 0.01; *P
420 mM NaCl, 1 mM Na3 VO4 , 25 mM NaF) supple- ≤ 0.05; n.s. = non-significant. No statistical methods were
mented with Protease inhibitor and incubated on ice for 15 used to predetermine sample size.
min. Lysate was homogenized with 25 strokes of a douncer
(0.01–0.03 mm) and incubated with rotation at 4◦ C for
30 min. Lysate was cleared by spinning down at 4◦ C, 16 RESULTS
000 × g, 30min and the supernatant was transferred to a
Development of a novel fluorescent reporter system to inves-
new tube. 1× DP buffer (50 mM Tris–HCl pH 7.4, 5% glyc-
tigate LSD1 and associated cofactors in living cells
erol, 1.5 mM MgCl2 , 150 mM NaCl, 1 mM Na3 VO4 , 5 mM
NaF) with 0.4% NP40 and protease inhibitors (1.8 ml buffer The transcriptional output of LSD1 is highly dependent on
to 1ml lysate) was added and the sample was incubated on its associated complex partners. In order to measure the
ice for 10 min before clearing through ultracentrifugation activity of LSD1 in a cellular context and in association
(30 min, 4◦ C/43 000 rpm/TI50.2). The supernatant was with its coregulators in a time-resolved manner, we estab-
transferred to a fresh tube and 5% input were taken. The lished a novel reporter system, which can be transduced
sample was incubated with 1g anti-KDM1A antibody per into cell lines of interest (Figure 1 and Supplementary Fig-
1mg protein in the lysate over night at 4◦ C. 1.5-fold of load- ure S1). In this system, the expression of a fluorescent re-
ing capacity of Dynabeads protein G were added for 2 h at porter protein (mCherry) is driven by a synthetic promoter
4◦ C with rotation. Beads were washed twice with DP/NP40 (synP) consisting of six tetracycline repressor (TetR) bind-
buffer, twice with DP buffer and twice with 150 mM NaCl. ing elements (tetO) introduced upstream of a strong EF1a
Proteins were eluted in 30 l of 2× SDS sample buffer (125 promoter (Figure 1A).
mM Tris–HCl pH 6.8, 5% SDS, 0.004% Bromophenol Blue, Following transduction and antibiotic selection, the de-
10% -mercaptoethanol, 100 mM DTT, 20% glycerol) for signed reporter construct exhibited a strong mCherry fluo-
10 min at 70◦ C and subjected to SDS-PAGE and immun- rescence signal in different cell lines (Supplementary Figure
odetection as described for gene expression analysis. S1A). Next, we generated a fusion construct of full length
human LSD1 with the reverse tetracycline repressor pro-
tein (rTetR), which was transduced into NIH/3T3 cells ex-
Equilibrium peptide binding experiments
pressing the synP-mCherry reporter (Figure 1B). This al-
Determination of KD of DDX19A and H3K27 was con- lowed to induce spatial proximity of rTetR-LSD1 to the
ducted using H3.1 peptide labeled with FITC. The H3.1 synP element by the addition of Doxycycline (DOX). Af-
Nucleic Acids Research, 2021, Vol. 49, No. 8 4357

                                                                                                                                                                 Downloaded from https://academic.oup.com/nar/article/49/8/4350/6212757 by guest on 24 September 2021
Figure 1. Generation of a fluorescent reporter system to investigate LSD1 and associated cofactors in living cells. (A) Illustration depicting the core
components of the fluorescent reporter system, which is transduced into cell lines of interest. Stable expression of mCherry is driven by a synthetic promoter
(synP), which consists of 6 Tet repressor binding sites (tetO) upstream of an EF1a promoter. (B) Cell lines expressing the synP-mCherry reporter are further
transduced with a vector expressing a fusion protein of human LSD1 and the reverse tetracycline repressor protein (rTetR) under a constitutive promoter.
Upon DOX treatment, the rTetR-LSD1 fusion protein is recruited to synP together with endogenous complex partners, leading to the suppression of
mCherry expression. (C) Flow-cytometric analysis of the mCherry expression in NIH/3T3 cells co-expressing the synP-mCherry reporter and the rTetR-
LSD1 fusion protein after treatment with DOX for the indicated number of days. Left: Bar graphs showing the median mCherry signal relative to day 0.
Circles represent individual replicates (n = 3, mean±s.e.m.). Right: Histograms depicting the distribution of mCherry signals of one representative replicate
over time (y-axis normalized to highest cell count). (D) Bar graphs depicting changes of the indicated histone marks at the synP element, analysed by ChIP-
qPCR. IPs were performed with mononucleosomes isolated from reporter cell lines at day 4 (H3K4me2, H3K27ac, H3K27me3) or day 14 (H3K9me3)
of either LSD1 wt or K661A recruitment. Bar graphs are relative to -DOX. Circles represent independent replicates (n = 3, mean ± s.e.m.; **P ≤ 0.01,
***P ≤ 0.001, ****P ≤ 0.0001, n.s. = non-significant; Student’s t-test). (E) Flow-cytometric analysis of the mCherry signal in NIH/3T3 cells expressing
the synP-mCherry reporter, rTetR-LSD1 and the indicated shRNAs at day 7 of DOX treatment. Dark grey: -DOX, light grey: neutral control shRNA,
green: positive control shRNAs +DOX. Left: Bar graphs show the median mCherry signal relative to day 0. -DOX is shown for the control shRNA
(shControl). Circles represent independent replicates (n = 3, mean±s.e.m.; **P ≤ 0.01, ***P ≤ 0.001; Student’s t-test). Right: Histograms showing the
mCherry expression profiles at day 7 ±DOX of one representative replicate. (F) Bar graphs depicting the median mCherry expression of +DOX NIH/3T3
reporter cells relative to -DOX in the presence of GSK-LSD1, TSA or DMSO. Treatment of cells was started in parallel with the addition of DOX and
maintained for the indicated number of days. Circles represent independent replicates (n = 3, mean ± s.e.m.).

terwards, LSD1 mediated effects on the synP-mCherry re-                           lysine 4 dimethylation (H3K4me2) (Figure 1D), which is in
porter gene expression over time can be detected by flow                          agreement with recent literature, stating that the activity of
cytometry or fluorescence microscopy (Figure 1B, C and                            LSD1 is highly dependent on coregulatory effector proteins
Supplementary Figure S1C, D). ChIP analysis revealed dy-                          (22) and probably heavily counterbalanced by H3K4 spe-
namic changes of the chromatin environment at the synP                            cific methyltransferases (KMTs) (24,57). Furthermore, this
promoter element after recruitment of the rTetR-LSD1 fu-                          can be explained by the fact that H3K4me2 is an interme-
sion protein. We observed a mild reduction in histone H3                          diate mark and we observed co-recruitment of Kdm5b (see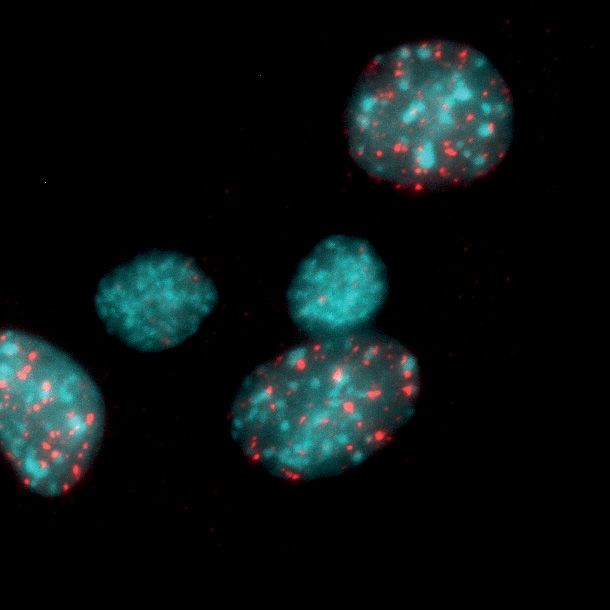
4358 Nucleic Acids Research, 2021, Vol. 49, No. 8

below), which is an H3K4me3 demethylase that continu-            the rTetR-LSD1 fusion protein (Figure 2A and Supplemen-
ously generates H3K4me2 at the locus. Histone H3 lysine 27       tary Table S1). After an initial antibiotic selection for suc-
acetylation (H3K27ac), another modification characteristic       cessful integration of the constitutively expressed shRNA
for active chromatin, showed a more pronounced reduction,        constructs, we induced recruitment of the rTetR-LSD1 fu-
whereas histone H3 lysine 9 trimethylation (H3K9me3) and         sion protein to the synP element by the addition of DOX.
H3K27me3, both associated with inactive genomic regions,         During subsequent cultivation for 14 days under constant
were increased (Figure 1D). In contrast, the recruitment         treatment with DOX, cells expressing effective shRNAs tar-
of rTetR alone to the synP-mCherry reporter induced no           geting regulators of LSD1, which are critically required for
change in reporter gene expression (Supplementary Figure         LSD1-mediated gene silencing accumulated in a cell popu-
S1C). Similarly, the recruitment of a catalytically inactive     lation that showed persistent expression of mCherry (pos-
mutant of LSD1 (K661A) (58) to the synP promoter did             itive population). Using FACS, these cells were separated
not lead to a strong reduction of fluorescent reporter gene      from the major population, which exhibited the usual re-
expression when compared to the LSD1 wt (Supplemen-              duction in fluorescent reporter signal (negative population)

                                                                                                                                  Downloaded from https://academic.oup.com/nar/article/49/8/4350/6212757 by guest on 24 September 2021
tary Figure S1C). We also investigated the consequences of       and expressed ineffective shRNAs (Figure 2A and Supple-
K661A recruitment on selected histone modifications at the       mentary Figure S2A). The representation of each shRNA
synP promoter element. As expected, recruitment of K661A         in the input library and in the sorted positive and nega-
did not lead to a reduction of H3K4me2, whereas changes          tive cell populations was quantified using deep-sequencing
in H3K27ac or H3K9me3 were comparable to those in-               of the shRNA guide strands amplified from genomic DNA
duced by recruitment of the LSD1 wt (Figure 1D). Inter-          using established protocols (Supplementary Figure S2B and
estingly, we did not observe an increase in H3K27me3 when        Table S1) (62). To rank all genes represented in the shRNA
recruiting LSD1 K661A (Figure 1D). These results demon-          library for their effect on LSD1 activity, gene scores re-
strated that the observed change in reporter fluorescence        flecting the enrichment of multiple shRNAs per gene in the
is a direct effect of LSD1 recruitment, actively changing        positive cell population compared to the negative popula-
the chromatin environment at the promoter and indicate           tion were calculated (Figure 2B, and Supplementary Table
that known coregulators of LSD1, like HDACs and lysine           S2). As expected, the screen managed to identify coregula-
methyltransferases (KMTs) such as G9a/GLP and PRC2,              tors of LSD1 that were already described as complex part-
are co-recruited and active at the synP element. Further-        ners in the literature (Figure 2B) and suppression of several
more, we observed a mechanistic connection between the           genes known to be associated with LSD1, e.g. Dnmt3a (63),
enzymatic activity of LSD1 and its ability to induce a strong    Gatad2b (NuRD) (64) and Sap25 (SIN) (65,66), were con-
reduction in gene expression and an increase in H3K27me3,        firmed to be especially important for LSD1-mediated gene
the latter probably related to the inability of PRC2 to methy-   silencing. Interestingly, the H3K4me3 demethylase Kdm5b
late histone H3 methylated at K4 (59,60).                        was ranked at position 20 in the screen, suggesting that
   To test if the reporter system was sensitive to perturba-     LSD1 requires the demethylase activity of KDM5B (67) to
tions and could thus be applied to study the influence of        generate K4me2, which then can be demethylated further
LSD1 associated coregulators, we suppressed the expres-          by LSD1 leading to stable silencing of the synP-mCherry
sion of the rTetR-LSD1 fusion construct using shRNAs             reporter in NIH/3T3 cells. In addition to already known
(Supplementary Data Table S4) targeting the rTetR or             factors, the screen also identified novel coregulators not as-
LSD1 (Supplementary Figure S1B) parts of the rTetR-              sociated with LSD1 biology so far (Figure 2B and Supple-
LSD1 fusion protein and of the known LSD1 complex part-          mentary Figure S2B).
ner Chd5 (61). Silencing of any functional part or Chd5 re-         We selected the top 100 positive and negative hits iden-
sulted in a substantially impaired ability of LSD1 to induce     tified in the screen and performed an enrichment analysis
effective silencing of the synP-mCherry reporter (Figure         using ClueGO (68) to visualize functionally related coreg-
1E). Furthermore, treatment with the LSD1 inhibitor GSK-         ulators influencing LSD1 activity as a clustered network
LSD1 or the pan-HDAC inhibitor Trichostatin A (TSA)              of the associated Gene Ontology (GO) pathways (Figure
demonstrated that the activity of rTetR-LSD1 at the synP         2C). These data show that LSD1 mainly cooperates with
element is dependent on the catalytic activity of LSD1 and       proteins linked to biological pathways associated with ly-
HDACs (Figure 1F and Supplementary Figure S1E). Con-             sine methylation including pathways regulating H3K4, K9
sequently, silencing of mCherry expression by recruitment        or K27 methylation, which constitutes the largest cluster
of rTetR-LSD1 to synP is conditioned by the presence and         in the network (Figure 2C). Other clusters comprise path-
activity of additional endogenous coregulators.                  ways associated with chromatin silencing, lysine acetylation
                                                                 and chromatin remodeling. Furthermore, the network is en-
                                                                 riched for pathways related to DNA damage response and
A multiplexed shRNAmir screen identifies essential and novel
                                                                 nuclear receptor signaling, functions which were already de-
LSD1 coregulators
                                                                 scribed to be regulated by LSD1 (7,17,32).
We applied our novel reporter system for LSD1 activity              Interestingly, one cluster in the network is connected to
to systematically probe a comprehensive selection of chro-       conformational changes of DNA (Figure 2C) and indeed
matin coregulators for their requirement to enable LSD1-         the screen identified three ATP-dependent RNA helicases
mediated silencing. To this end, we screened a focused           among the top 10 positive and negative coregulators of
shRNA library targeting 1010 chromatin-associated murine         LSD1 (Figure 2B). DDX39B, DDX23 and DDX19A be-
genes (4–6 shRNAs per gene) in a multiplexed format in           long to the so-called DEAD-box family of RNA-dependent
NIH/3T3 cells expressing the synP-mCherry reporter and           ATPases that have RNA unwinding activity and are in-
Nucleic Acids Research, 2021, Vol. 49, No. 8 4359

                    A

                    B

                                                                                                                                                                 Downloaded from https://academic.oup.com/nar/article/49/8/4350/6212757 by guest on 24 September 2021
                                                                                                                 (NuRD)

                    C

Figure 2. A chromatin-focused shRNA screen identifies novel and known coregulators of LSD1 activity. (A) Workflow describing the ChECS screening
strategy. A library composed of 5459 shRNAs targeting 1010 chromatin-related genes (GFP+) was virally transduced into rTetR-LSD1 reporter cell lines
(mCherry+). After antibiotic selection, cells were treated with DOX for 14 days and FACS sorted for high (mCherry+) or low (mCherry-) mCherry
expression. Genomic DNA was isolated from both populations and the shRNA guide sequences were amplified for Illumina sequencing. (B) Scatter
plots ranking all genes according to their effect on LSD1 activity (gene score). Left: Gene scores of all genes present in the shRNA library. The gene
score represents the Ln of the average enrichment score (read ratio mCherry+/mCherry-) of all shRNAs per gene across five replicates. Genes imposing
a positive effect on LSD1 induced silencing are coloured in blue, genes having a negative effect are highlighted in red. The position of Ddx19a, Kdm5b
and the PRC2 core components Suz12, Ezh2 and Eed is indicated. Right: Top ten genes identified in the screening procedure to positively influence LSD1
activity. Significance is represented by spot size (–log10 P-value). (C) ClueGo network clustering the top 100 positive and negative regulators of LSD1 for
their biological function (GO-annotated biological process). Biological processes of selected clusters are highlighted on the right. The statistical test used
for the enrichment was based on a two-sided hypergeometric test with a Bonferroni correction and kappa score of 0.4. Only pathways with p≤0.01 are
shown.

volved in pre-mRNA splicing, mRNA export from the                                 screen (Figure 2B). The homolog of DDX19A, DDX19B
nucleus to the cytoplasm or translation (69–73). Loss of                          has recently been shown to be involved in the removal of
DDX39B and DDX23 promoted silencing of the synP ele-                              RNA:DNA hybrid structures (so-called R-loops) and the
ment, likely due to LSD1 unrelated effects caused by dereg-                       activity of DDX19B was shown to be dependent on the
ulation of the transport, splicing or translation of compo-                       DNA damage response induced by the ATR-Chk1 pathway
nents of the reporter system, functions reported for both                         (54).
helicases previously (72,74). Among the three DEAD-box                               R-loops are highly dynamic structures that occur at dif-
helicases identified as coregulators, DDX19A was the only                         ferent regions in the eukaryotic genome and exhibit criti-
helicase identified as a positive regulator of LSD1 mediated                      cal regulatory functions during replication, transcription,
silencing and it scored with the highest significance in the                      and recombination (75–78). R-loops preferentially form at
4360 Nucleic Acids Research, 2021, Vol. 49, No. 8
GC-rich regions, where the newly synthesized G-rich RNA tion of the R-loop signal (Figure 3A). Upon suppression
hybridizes to the C-rich DNA template (79). They have of Ddx19a we noticed a significant increase in R-loop spot
been described to be associated with both up- and down- counts per nucleus compared to a neutral control shRNA
regulation of transcription (80) and occur at unmethylated (Figure 3A, B and Supplementary Figure S3A) as well as an
human CpG island promoters (81). Interestingly, R-loops enhancement of R-loop spot intensity (Figure 3A and Sup-
have been shown to colocalize with H3K4 methylation on a plementary Figure S3A, B). Subsequently, we studied the
genome-wide scale (82). alterations of R-loops at the synP element before and af-
Aiming to characterize the role of DDX19A in LSD1 in- ter DOX induced LSD1 recruitment. As expected, R-loops
duced silencing of gene expression, we further investigated at the synP promoter element were reduced following DOX
the effects of Ddx19a suppression on R-loop regulation and induced recruitment of LSD1 and this effect was strongly
gene expression on a global and local level. Two top-scoring attenuated under suppression of Ddx19a (Figure 3C). Fur-
shRNAs from our screen (shDdx19a.1/2) showed only mild thermore, we investigated R-loop dynamics at representa-
effects on cell viability, suppressed DDX19A expression tive endogenous genomic loci (Supplementary Figure S3E)
Downloaded from https://academic.oup.com/nar/article/49/8/4350/6212757 by guest on 24 September 2021
(Supplementary Figure S2C, D) and were validated to inter- upon suppression of Ddx19a expression. Two regions are
fere with LSD1 silencing activity at the synP promoter (Sup- associated with the developmental master regulators Myc
plementary Figure S2E). We next sought to determine the (86,87) and Twist1 (88,89), which are highly expressed and
mechanism by which DDX19A influences LSD1-induced associated with extensive H3K4 methylation and R-loop
silencing and analysed rTetR-LSD1 protein levels after sup- signal. In addition, we investigated R-loop dynamics at an
pression of Ddx19a to rule out that the effect of Ddx19a intergenic region on chromosome 8 (Chr8) characterized by
is merely a consequence of reduced expression or defects very low R-loop and high H3K27me3 signal (Supplemen-
in mRNA processing of the rTetR-LSD1 fusion protein. tary Figure S3E). Using DNA-RNA immunoprecipitation
However, we did not observe any reduction in expression (DRIP) followed by qPCR, we observed an increase in R-
of the rTetR-LSD1 fusion protein and no alteration of the loops upon Ddx19a suppression in all cases (Figure 3D)
expression of the synP-mCherry reporter without the ad- showing that also master regulators like Myc and Twist1 as
dition of DOX, which could lead to a false-positive result well as regions decorated with high levels of H3K27me3 re-
and be responsible for the observed remaining fluorescence spond in a similar way to suppression of Ddx19a expression
signal (Supplementary Figure S2F, G). To confirm that the as the synP element of our artificial reporter construct. As
negative effect of Ddx19a suppression of LSD1-mediated a control, we included an RNAseH1 incubation step, which
silencing is specific to LSD1 function, we investigated the reduced the DRIP signal confirming the specificity of the
effects of Ddx19a suppression on the repressive activity of antibody (Figure 3D and Supplementary Figure S3C, D).
KRAB, which we recruited to the synP element using a This is in line with our observations in the immunofluores-
rTetR-KRAB fusion protein. Suppression of Ddx19a ex- cence experiments and implies that the effect of suppression
pression did not influence the activity of KRAB, suggesting of Ddx19a expression on R-loops is not restricted to our
that DDX19A is not a general requirement for gene silenc- artificial reporter construct but also occurs at endogenous
ing and the observed function is specific to LSD1 (Supple- regions.
mentary Figure S2H). In addition, we purified recombinant DDX19A and con-
DDX19A has not been described as an interactor of firmed its ability to resolve RNA:DNA hybrids in vitro (Fig-
LSD1 (83,84) and to test if LSD1 recruits DDX19A by a ure 3E and Supplementary Figure S3F). Our data indicate
direct interaction, we performed co-immunoprecipitation that suppression of Ddx19a expression leads to the accu-
(co-IP) experiments from NIH/3T3 cell lysate. Although mulation of R-loops and interferes with the silencing ac-
other known complex partners of LSD1 like HDAC1 co- tivity of LSD1 at the synP-mCherry reporter. This obser-
precipitated with LSD1, we could not detect a direct in- vation is in agreement with the model that R-loops form-
teraction of LSD1 and DDX19A (Supplementary Figure ing over the synP element stabilize its transcriptional ac-
S2I), which could be due to low abundance of DDX19A or tivity, which is supported by recent publications showing
a weak interaction with LSD1. Thus, we aimed to further that R-loops impose various effects on chromatin regula-
characterize the effects of Ddx19a suppression on LSD1 ac- tors to promote transcription (81,82,90–93) including the
tivity in more detail. inhibition of LSD1 (38) and PRC2 (39,40).
DDX19A is involved in R-loop homeostasis LSD1 and R-loops colocalize and occupy regions associated
with highly transcribed genes
Since the homologue of DDX19A, DDX19B, actively par-
ticipates in the removal of R-loops (54), we investigated We wanted to explore if the interaction of LSD1 and
the dynamics of R-loop formation in NIH/3T3 cells af- DDX19A could be mediated through R-loops. In order to
ter suppression of Ddx19a using immunofluorescence mi- investigate if LSD1 localizes to genomic regions decorated
croscopy. We employed the S9.6 antibody, which specifically with R-loops, we analysed the genome-wide distribution
recognizes R-loops (85). To test for the specificity of the of LSD1 in two different cell lines (K562 and NIH/3T3)
signal detected with the S9.6 antibody, we used Ribonu- and compared it to features associated with R-loops and
clease H1 (RNAseH1), known to specifically degrade the histone modifications signaling either active or repressed
RNA of RNA:DNA hybrid structures. As shown in Fig- gene expression (Figure 4 and Supplementary Figure S4).
ure 3A, transient expression of RNAseH1 prior to the im- To this end, we performed an LSD1 ChIP-seq in NIH/3T3
munostaining with the S9.6 antibody led to a strong reduc- cells, employed publicly available LSD1 ChIP-seq data fromYou can also read