The State of Urban and Community Forestry in California
←
→
Page content transcription
If your browser does not render page correctly, please read the page content below
-i-

   The State of Urban and Community
         Forestry in California
                                Status in 2003
                                     and
                              Trends since 1988

                  by                                    Funded by
      Richard P. Thompson                   California Department of Forestry
                                                   and Fire Protection
  Urban Forest Ecosystems Institute       Urban & Community Forestry Program
California Polytechnic State University
           San Luis Obispo                      Technical Report No. 13
                                                       July 2006
Acknowledgements
I am grateful to the many respondents who made this study possible. Their
names and address are found in Appendix 3. The data collected for this study
is available upon request to the Urban Forest Ecosystems Institute, Natural
Resources Management Department, Cal Poly State University, San Luis
Obispo, 93407. (805) 756-2898.

                               Author
Richard P. Thompson, Ph.D., California Registered Professional Forester.
Director, Urban Forest Ecosystems Institute, Natural Resources Management
Department, Cal Poly, San Luis Obispo, CA. email: rpthomps@calpoly.edu

                                                                               Page i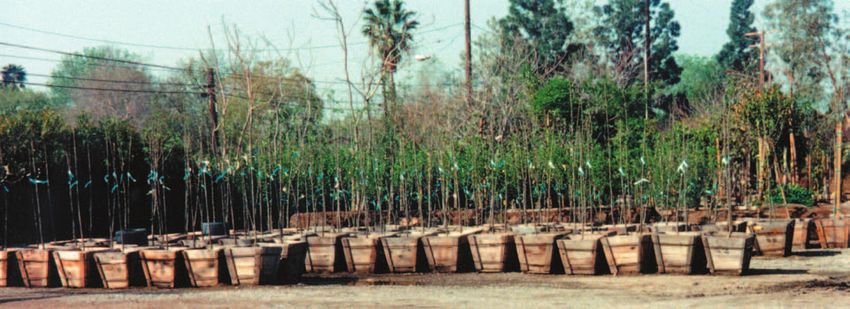
Table of Contents
Acknowledgements ..........................................................................................................................            i
Executive Summary ......................................................................................................................... iii
Introduction ...................................................................................................................................... 1
       Survey Response ........................................................................................................................ 2
Trees of the Urban Forest ................................................................................................................ 4
       Tree Inventories ......................................................................................................................... 4
       Inventory Changes - Plantings vs. Removals ............................................................................ 5
       Species Selection ....................................................................................................................... 6
       Trends in Species Selection ....................................................................................................... 8
       Nursery Stock ............................................................................................................................ 10
Managing the Urban Forest ............................................................................................................ 11
       Management ............................................................................................................................. 11
       Funding Sources ........................................................................................................................ 12
       Budgets ...................................................................................................................................... 13
       Exemplary Smaller Cities .......................................................................................................... 15
       Program Organization ................................................................................................................ 16
       Staffing ....................................................................................................................................... 17
       Contract and Volunteer Services ................................................................................................ 18
       Tree Care.................................................................................................................................... 19
       Planning and Inventories ........................................................................................................... 20
       Hazard Mitigation and Liability ................................................................................................ 22
       Utilization of Wood Material ..................................................................................................... 24
       Fire, Flood and Drought Effects ................................................................................................ 26
       Exemplary Medium-sized and Large Cities .............................................................................. 27
Community Relationships ............................................................................................................... 28
       Public Support .......................................................................................................................... 28
       Conmunity Tree Boards ............................................................................................................. 29
       Education and Communication Methods .................................................................................. 31
       Tree Ordinances ......................................................................................................................... 32
       Urban Forestry Benefits ............................................................................................................. 33
       Program Needs........................................................................................................................... 34
Literature Cited ............................................................................................................................... 35
Appendices ........................................................................................................................................ 36
       Appendix 1. References & Organizations related to Urban & Community Forestry ............... 36
       Appendix 2. 2003 California Urban and Community Forestry Survey Instrument ................. 37
       Appendix 3. Survey Respondents ............................................................................................. 46

                                                                                                                                                    Page ii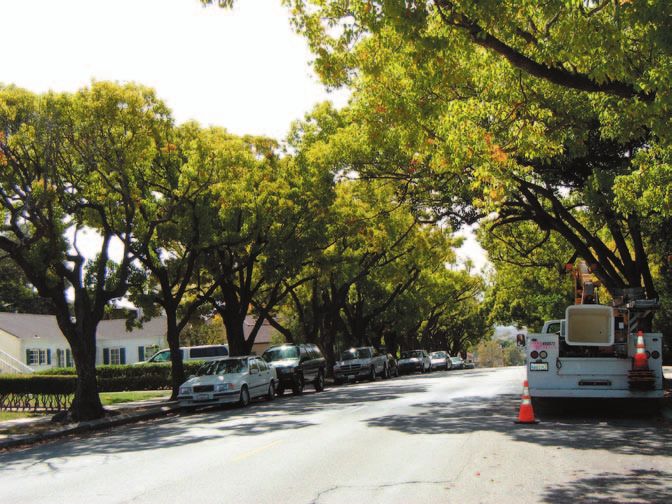
Executive Summary
♦ The number of municipal trees has increased from           ♦ Large city programs are adding full-time staff while a
  about 7 million in 1988 to an estimated 8 million in         greater number of smaller programs have reduced staff.
  2003.
                                                             ♦ Pruning of mature trees decreased sharply since the
♦ The ratio of plantings to removals has actually de-          1998 survey and is even lower than in 1992. Topping
  creased from almost 7 to 1 in 1988 to about 4.5 to 1 in      remains a problem with still over 15% of the reporting
  2003. Overall, cities have averaged roughly a 4% net         programs indicating that it is done.
  increase per year in their tree inventories since 1988.
                                                             ♦ The primary means to prevent tree hazards from oc-
♦ About 22% of the cities and counties reporting remov-        curring are to identify and abate the hazard (76% of
  ing more trees than they planted in 2003, up from 18%        programs), and replace lifted sidewalks (68%). Over
  in 1988 having declined to 15% in 1992 and 1998.             40% of the programs contested damage claims.

♦ The lack of growing space for street trees is increas-     ♦ Although those dumping greenwaste is in rapid decline,
  ingly the leading factor in constraining species choice.     the average rate of disposal increased in 1998 and
  This led to the growing dominance of small-stature,          remained steady in 2003 at around 10% of the total
  short-lived species for street tree use led by Crape         material generated. Solidwood products utilization has
  Myrtle followed by Chinese Pistache and pear species         increased significantly since 1992 to now over 20% of
  (mainly Bradford pear).                                      the reporting programs at a 10% average rate of use.

♦ The lack of desired species availability and poor qual-    ♦ Community support for municipal tree programs has
  ity stock are cited as the leading problems with nursery     improved slightly since 1988 but still over 40% do not
  stock.                                                       have Tree Boards and just over one-quarter have a tree
                                                               advocacy organization.
♦ Responsibility for maintaining trees once planted has
  increasingly shifted away from homeowners to munici-       ♦ Getting urban forestry’s message out is critical to gain
  palities.                                                    support; the 2003 data indicate a growing use of vari-
                                                               ous media/communications outlets. There was a major
♦ Urban forestry is still heavily dependent upon taxpayer      increase in the use of Arbor Day celebrations.
  support through city or county general funds. The
  average city tree budget per resident has declined in      ♦ In 1992, 65% of the respondents had a tree ordinance
  constant dollars from around $3 in 1988 to $2 in 2003;       with about the same number feeling they needed one.
  the median has declined from over $4 to about $3.            As of 2003, programs with an ordinance and those
  However, small cities have actually increased spending       needing one increased to 80%. The ordinance provi-
  somewhat while cities with populations over 100,000          sion that seems most effective is requiring tree planting
  have sharply reduced spending since 1992.                    as a condition for new development.

♦ Today, U&CF programs are predominantly housed in           ♦ The most frequently and consistently cited benefits of
  Public Works, whereas in 1988 they were found mainly         their green infrastructure are in the areas of community
  in Parks and Recreation Departments.                         pride and the economic contribution to business and
                                                               property values.
♦ Standards for pruning trees continue to be emphasized,
  as opposed to the old, unacceptable practice of “top-      ♦ As expected, the #1 need of tree programs is more
  ping.” Over 90% of the U&CF employees are certified           funding and citizen support (#3). Planting space was
  according to some professional standard, usually the         ranked #2. The need for better tree care has dropped to
  International Society of Arboriculture.                      #4 rank probably due in large part to the push for certi-
                                                               fied tree care workers, both in the public and private
♦ More programs are investing in inventories of their ur-      sector.
  ban forests, helping to reduce costs through improved
  planning.

                                                                                                                Page iii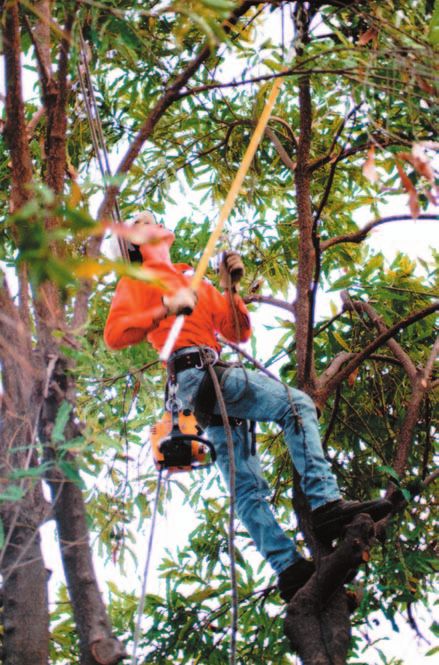
Introduction
The presence of trees and lesser vegetation is recognized
as an essential part of our living environment as society
becomes increasingly urbanized. However, growing trees
in cities is difficult and expensive. Once the benefits of
trees are understood, expenditures on their establishment
and care may be viewed more as investments in the city’s
green infrastructure rather than expenses on an amenity.
Here in California a growing number of communities are
investing in their green infrastructure as they realize its
role in achieving environmental quality standards and that
it can complement the gray infrastructure, not conflict
with it.

The California Department of Forestry and Fire Pro-
tection (CDF) has been a significant force behind this
social movement to enhance urban ecosystems. With the
California Urban Forestry Act of 1978, CDF created the          Despite these gains, funding to support a community’s tree
Urban Forestry Program to provide monetary and techni-          program has generally lagged behind other city services;
cal support for municipalities to establish and maintain a      a conclusion born-out in all CDF-funded surveys. As a
sustainable urban forest. In order to assess the program’s      result, many communities must rely to varying degrees on
effectiveness, CDF surveys municipalities periodically          volunteers and non-profit organizations for tree planting,
(about every 5 years) seeking information on a wide range       maintenance, and to lobby for increased support for their
of management issues.                                           community’s urban forestry programs.

CDF contracted with Phytosphere, Inc. to conduct the            This report on the status and trends in U&CF is organized
1988 and 1992 surveys (Bernhardt and Swiecki, 1988 and          into three main sections: 1) Trees of the Urban Forest
1992). The Urban Forest Ecosystems Institute (UFEI)1            showing trees in species composition and factors affecting
at Cal Poly, San Luis Obispo, conducted the 1998 survey         species selection, 2) Managing the Urban Forest address-
(Thompson et al. 2000). For the 2003 survey, CDF dis-           ing funding, staffing, and management practices, and 3)
seminated the survey instrument and compiled the data,          Community Involvement addressing community support,
then contracted with UFEI for analysis and reporting. A         education, ordinances, and advocacy. Although each sur-
census of city and county municipalities was attempted in       vey question was analyzed, this report presents results for
all 4 surveys. Since 1992, the survey instrument has been       only those deemed to provide meaningful trend informa-
essentially identical in order to provide the greatest amount   tion. The raw data is available upon request.
of longitudinal information (see Appendix A). The 1988
survey instrument was less detailed, limiting the trend         Finally, it is important for the reader to remember that
information on most issues to the last three surveys.           nearly all survey questions relate only to the public lands
                                                                and programs of cities and counties, a small minority
Urban and community forestry (U&CF) efforts are a re-           of the incorporated area’s green infrastructure (some
flection of how communities value the quality of life from       estimate at around 20% on average).
improvements in energy conservation, air quality, storm-
water control, wildlife habitat, civic pride, property value    Quotation (sidebar boxes) appear throughout the report.
enhancement, and many others. Today, there are thou-            They are intended to provide insightful comments from
sands of communities that are recognized as a Tree City         respondents on key programmatic issues. These remarks
USA. Over 30% of California’s incorporated cities have          were offered voluntarily.
met and maintain the standards for Tree City USA.
                                                                1
                                                                    UFEI website: www.ufei.org

The State of Urban and Community Forestry in California                                                             Page 1
Survey Response                                       40

The 2003 survey of urban and community
                                                      35
forestry in California was conducted by CDF                                   No Program
                                                                              Program
staff in 2004. The survey retained the same           30
questions as in the 1998 and 1992 surveys plus
                                                      25
a few others. Using the same questions as in
the 1992 survey was critical to provide the           20
maximum amount of trend information. This
trend information conveys an entirely differ-         15
                                                     Number of Respondents
ent dimension of information that can only be         10
detected through changes over time.
                                                          5

The same population of 468 incorporated cities
                                                    0
and 58 counties were surveyed as in 2004, at-         0-2500    2501-5000   5001-  10001-   25001-                             50001-      100001-   250000+
                                                        Population Category 10000  25000     50000                             100000      250000
tempting to create a census of this population.
Mailed surveys with several follow-up at-       Figure 1. Survey returns by city population in 2003
tempts produced responses from 137 cities and 60
15 counties. Figure 1 displays the response
                                                 50
numbers by city size category and whether the
responding city has a tree program. In con-
                                                 40
trast, the 1998 survey provided 256 responses
from cities and 14 from counties, a 29% and
                                                 30
26% response rate, respectively. This com-
pares to 51% city and 29% county response in     20
1998 and 74% and 81%, respectively, in 1992. Number of Respondents
                                                     10
Figure 1 shows a fairly normal distribution
across city size. With only 45 cities with a           0                                                                                                       1992
                                                                                                                                                             1998
                                                              0-2500    2501-5000                                                                           2003
                                                                                    5001-10000 10001-25000
population over 100,000, it appears this cat-                                                              25001-50000 50001-100000
                                                                                                                                      100001-    250000+
                                                                       Population Category                                            250000
egory is well represented (League of Califor-
                                                    Figure 2. Comparison of responding cities with tree programs
nia Cities 2006). The response from the 82
                                                     25
cities with populations between 50,000 and
100,000 was not quite half. Cities with popu-
lations over 25,000 are clearly more likely to       20

possess tree (U&CF) programs (defined by
the criteria designed to receive public funds        15
for tree planting and care). Although the 2003
response was lower, it follows a similar dis-        10
tribution pattern with those in 1998 and 1992
                                                    Number of Respondents
(see Figure 2). It is important to trend analysis
                                                       5
that similar response distributions resulted by
city size.
                                                          0                                                                                                    1992
                                                              0-2500
                                                                                                                                                              1998
                                                                        2501-5000   5001-10000 10001-25000                                                  2003
Response from cities lacking a tree program                Population Category                  50001-     25001-50000
                                                                                                         100001- 250000+
                                                                                                100000   250000
are clearly declining over time (see Figure 3). Figure 3. Comparison of responding cities with no tree program
Cities without a tree program would naturally
find this survey to be irrelevant and not bother responding. Poor response also results from not correctly identifying the
correct contact and failing to forward the survey, as requested in the instructions. However, the decline in response could
also be a result of less aggressive follow-up attempts. Nevertheless, the 2003 results should be highly representative of
urban and community forestry efforts in cities and counties with such programs.

The State of Urban and Community Forestry in California                                                                                                    Page 2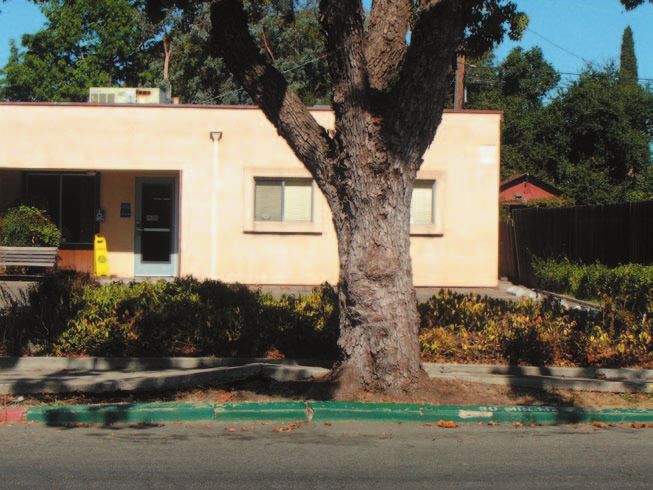
Survey Response (continued)
Using the same geographic regions as created in the 1992 survey and retained in the 1998 survey, it appears that the
2003, 1998, and 1992 surveys obtained a similar geographic distribution of respondents, as illustrated in Figure 4. If
there is any noticeable shift in response in seems to be favoring the South Coast region and away from the northeast.

As mentioned earlier, the data in this survey was collected by CDF staff during 2004 and the early part of 2005. As a
result, the data relate to an earlier point in time that varied by the respondent. The majority of responses related to Fis-
cal Year (FY) 2002-03 which generally starts on July 1, 2002. Some responses covered FY 2003-04. Therefore, the 12
month period that best describes the data, and which will be used in this report, would be calendar year 2003.

              2%                                                    1% North Interior (5%, 3%)
              North
              Coast
              (2%, 2%)
                                                                      3% Sacramento Valley
                                                                      (7%, 6%)

                                                                            5% Central Sierra
                                                                            (3%, 4%)

                18% Bay Area
                                                                                            13% San
                (21%, 20%)
                                                                                            Joaquin Valley
                                                                                            (11%, 15%)
                  12% Central Coast
                  (7%, 10%)

                                                                                  11% Southern Interior
                                                                                  (13%, 10%)

                               36% South Coast
                               (31%, 29%)

            Figure 4. 2003 Survey Response by California Region (1998 and 1992
                      responses in parentheses, respectively)

The State of Urban and Community Forestry in California                                                               Page 3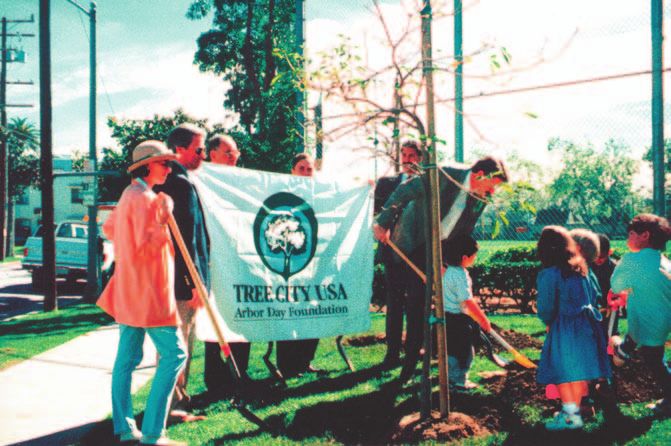
Trees of the Urban Forest
Tree Inventories
Bernhardt and Swiecki estimated that there were about
5.9 million street trees in 1988, a ratio of about 4 resi-
                                                               30
dents per street tree. City and country park trees added
about 1.2 million trees (about 5 stree street per park and     25
open space trees), for a total inventory of about 7 mil-
lion municipal trees in 1988. The 2003 survey showed            20
that ratio of residents per street tree and decreased to
about 3.5 to 1, and the ratio of street trees to park and       15

openspace had increased to about 9 to 1. Extrapolating
                                                                10
these ratios to a comparable inventory estimate to that       Number of Respondents                               92 - 88
in 1988 is problematic since the declining response rates         5
                                                                                                             98 - 92
came primarily from cities lacking an urban forestry pro-
gram. So the 2003 ratios are probably higher than the for         0
                                                                                                       03 - 98
the average city. For cities that reported in all 4 surveys                Increase
                                                                                           Decrease
(probably the most committed to urban forestry), the net
increase in tree inventories since 1988 occurred early on
                                                             Figure 5. Changes in inventory for municipalities that
(Figure 5). Therefore, it seems reasonable to conclude that
                                                                         responded to all 4 surveys
the municipal tree inventory has increased, mainly in street
trees, by no more than around 10% to 15%, giving an estimated inventory of about 8 million municipal trees in 2003.

Figure 5 indicates that the large increase in new plantings between 1988 and 1992 occurred primarily in smaller cities.
The firgure also shows that planting rates are inversely proportional to city size. This should not be too surprising given
that it does not take a large number of plantings to represent a large proportionate effect on small standing inventories
as compared to larger cities inventories. Nevertheless, the greater rate for smaller cities is promising since their small
populations create diseconomies in city service funding. Federal and state programs have been directed toward helping
smaller communities overcome these limitations -- America the Beautiful program in 1990 (goal was to plant a billion
city trees by 2000), California Proposition 70 in 1988, Proposition 12 in 2000, and more recently Proposition 40 in 2002.

Figure 6 futher shows that large cities made the greatest gain in new planting rates in 2003 than smaller cities. In fact,
medium-sized cities show a slight decline in plant-
ing rates from 1998 while small cities recovered           12%
from a noticeable drop in 1998.

                                                               10%

                                                                8%

                                                                6%

                                                                4%
                                                            Percent of Inventory Planted
                                                                                                                          1988
                                                                2%                                                      1992
                                                                                                                    1998
                                                                 0%                                              2003
                                                                           Small           Medium    Large
                      Note: Small cities, < 25,000; Me-     Figure 6. Percent of inventory planted
                      dium 25,000 - 50,000; Large >50,000        by city population category

The State of Urban and Community Forestry in California                                                              Page 4
Inventory Changes - Plantings vs. Removals
The information displayed in Figure 7 shows that                           8%
although the rate of new plantings has increased dramati-
cally, the ratio of plantings to removals has actually                      7%
decreased from almost 7 to 1 in 1988 to about 4.5 to 1
in 2003. Overall, cities have averaged roughly a 4% net                     6%

increase per year in their tree inventories since 1988.
One should not forget that most of these gains occurred                     5%

in smaller cities. Interestingly, 22% of the cities and
                                                                            4%
counties reporting removing more trees than they planted
in 2003, up from 18% in 1988 having declined to 15% in
                                                                            3%
1992 and 1998.
                                                                       Percent of Tree Inventory
                                                                            2%
Comparing those cities and counties that responded to
all 4 surveys shows that the rate of planting increased                     1%                                                   1988
                                                                                                                               1992
rapidly in the late 1980s and early 1990s (see Figure 8).                                                                   1998
However, those gains have continually eroded since 1992                     0%                                            2003

to the point to now more cities indicate they have planted                           Removed              Planted
fewer trees since 1998 that those that have increased.             Figure 7. Removals and plantings as a percent of inventory
Again, it is important to recall that these cities are prob-
ably more committed to their urban forestry program.

The increase in fire and flood damage in many cities may account for increases in removals (see “Flood, Drought & Fire
Effects”). However, it may be that the aging of the urban forest is the underlying cause. The beautiful, large shade trees
planted in the early days of city building are now reaching “old age” and are more vulnerable to damage. These struc-
turally weakened, older trees represent hazards to the utility infrastructure forcing public works departments to remove
them.

The next question is, what species are being planting to replace the removal of older and probably large shade trees?

                                                          25

                                                          20

                                                          15

                                                          10

                                                        Number of Respondents

                                                               5                                                               92 - 88

                                                                                                                          98 - 92

                                                               0                                                    03 - 98
                                                                       Increase
                                                                                               Decrease

                                                       Figure 8. Changes in new plantings for municipalities that
                                                       responded to all 4 surveys

The State of Urban and Community Forestry in California                                                                        Page 5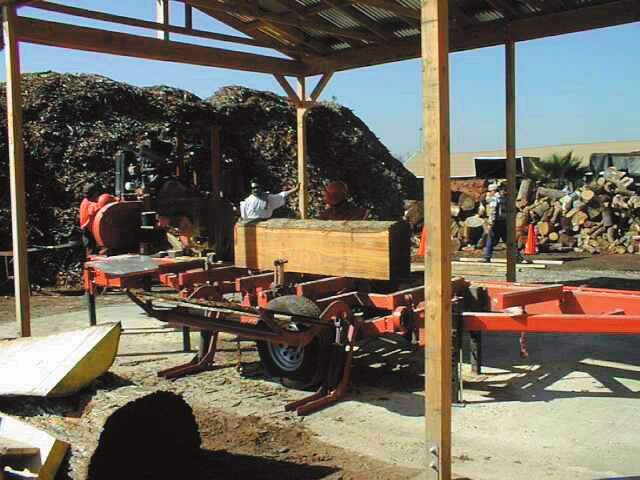
Species Selection

                  80%

                  70%

                  60%

                  50%

                  40%

                  30%

                                                                 F
                   20%

                   10%

                    0%
                                                                                                             Park
                           Shade     Aesthetics Maint. Cost                                                Street
                                                                  Space      Death Loss     Damage
                                                                                             Prone
             Figure 9. Factors affecting tree selection, 2003

As Figure 9 illustrates, street tree selection criteria are most influenced by space limitations with projected maintenance
costs the next more important consideration. Unfortunately, the factor that has the least influence on species selection
is the tree’s shade potential once mature. Now over 70%, in 1992 60% of those reporting cited growing space as the
greatest limiting factor. As one might expect, the relative importance of these influences seems more evenly distributed
for park tree species selection. It appears that concern over planting space for street trees gave way to shade preference
for park trees. The relative importance of these park tree selection factors have remaining fairly over time.

The State of Urban and Community Forestry in California                                                             Page 6
Trends in Species Selection
Figures 11 and 12 illustrate the trends in species selection over the last 15 years. Figure 11 depicts this trend by using
the top 10 species planted in 2003 and tracking their frequency of use back in the three previous surveys. One notices
that the dominance of small, short-lived species in a program’s planting list has grown since 1988 (e.g., Bradford pear,
Crape Myrtle, Chinese pistache, and Liquidambar). Another perspective on these trends is provided in Figure 12 by
starting with the 10 most frequently occurring urban forest species in 1988 and calculating their reported frequency of
planting in 1992, 1998 and 2003. From this perspective, the trend is even more obvious since larger, longer-lived spe-
cies dominated the list in 1988. The sharp decline in elms and ashes bears this out.
Comparing trends 45%
for a given species
(e.g., Liquidambar) 40%
is complicated
because the dis- 35%
tribution of the 10
30%
species by per-
centage is altered 25%
with different
species weighting 20%
between 1988 and Percent reporting
2003 base periods. 15%
Eucalyptus and
10%
ash species have
essentially disap- 5%
peared from the 2003
top 10 list. In the 0% 1998
1992
Crape Pistache Pear spp.
case of eucalyptus, Oaks spp. Sycamore 1988
Myrtle Maple Ash spp. Camphor Magnolia
alder and mulberry, s spp. spp. Brisbane
there may be sound Figure 11. Frequency of planting in past surveys for the Box
10 most commonly planted street trees in 2003
ecological or eco-
nomic reasons for 40%
reducing their use
(e.g., allelopathic 35%
effects, residues,
structural strength). 30%
We have already
seen that the trend 25%
toward smaller
20%
species is driven
by cost concerns
15%
Percent Reporting
rather than their
potential benefits
10%
(e.g., shade, energy
conservation, air
5%
quality improve-
1988
ment, flood con- 0% 1992
trol). Pine Sycamore Liquidam
1998
Ash spp. Alder 2003
s spp. bar Eucalypt Oak spp.
Elms Magnolia Mulberry
Note: 1988 data were us spp.
based on the most com-
mon species in inven-
Figure 12. Frequency of planting in later surveys for
tory, not planted. the 10 most commonly occurring trees in 1988
The State of Urban and Community Forestry in California Page 8Trends in Species Selection (continued)
Decisions to plant smaller trees are further supported by Species selection for street trees involves a compromise
the information shown in Figure 13 which summarizes between desirable shade trees and conflicts with the
respondent’s predictions of mature sizes of planting choic- pre-existing gray infrastructure. However, municipal
es. Clearly, respondents recognize the implication of their foresters need to make use of opportunities when com-
decisions by predicting significantly smaller tree heights munities renovate downtown areas. There are a number of
for street trees since 1988. There appears to be a slight designs and techniques for mitigating utility interference
increase since 1992 in street trees with mature heights over while using desirable tree species, ones that provide the
60 feet. Little change in park trees is anticipated from benefits that respondents cited in the section on “Benefits
planting decisions which is consistent with the informa- & Needs” and from a large volume of research (recent
tion on planting considerations for park trees illustrated in literture listed in Benefits & Needs section). The decisions
Figure 9. we make today will affect many generations to come.
60%
50%
“Implemented revised street
40% tree plan which requires spe-
cific tree species for site condi-
tions, i.e., well-size, overhead
wires, sewer line location,
30%
etc.” Oakland, 1998
“I have had some trouble get-
20%
ting “low” maintenance trees
added to our approved tree
Percent
10%of Reporting Programs
list due to them not provid-
ing shade and/or oxygen.”
1988
1992 Cypress, 1998
0% 1998
< 30' 2003
30-60' >=60' < 30' 30-60'
Street >=60'
Park
Figure 13. Predicted tree height at maturity of new plantings
Beneficial Size Size Restricting Effect
The State of Urban and Community Forestry in California Page 9Nursery Stock
Establishment and improvement of the urban forest begins also increased about the same in both settings. Still, the 15
with quality nursery stock. The two primary issues in gallon container size is preferred almost 3 to 1 to any other
purchasing nursery stock are the appropriate container size.
size and tree quality. As for preferred stock size, figures
14a and 14b indicate that the 15 gallon container size is The other nursery stock issues involve, availability of
the most popular in both street and park settings. Small preferred species and size, cost and, as already mentioned,
container sizes are more prone to, or even invite, damage, quality. As Figure 15 illustrates that the primary problem
while 24 inch box are often too expensive or too large is increasingly the lack of availability in preferred spe-
when using volunteers. Nevertheless, there seems to be cies. Poor quality of nursery stock follows closely behind
a slight upturn in the use of 5 gallon container stock for availability but this problem seems to have leveled-off
street trees and even in parks. The 24 gallon sizes have since 1998.
90% 90%
80% 80%
70% 70%
60% 60%
50%
50%
40%
40%
30%
30%
20%
Percent of Reporting Programs 20%
Percent of Reporting Programs
10% 1992 10% 1992
0% 1998 1998
0%
1 gal 2003 2003
5 gal 1 gal
15 gal 5 gal
24" + box 15 gal
24" + box
Figure 14a. Most common street tree nursery stock size Figure 14b. Most common park tree nursery stock size
50%
45%
40%
35% “Nurseries need to rethink their methods of raising
trees destined for municipalities. Lower growth
30%
should be left on trees, pruning methods should
25% be improved and stakes should be used only when
20%
absolutely necessary.” Fontana, 1998
15% of Respondents
Percent
10%
5%
1992
1998 Figure 15. Nursery stock factors
0%
Too expensive Species/Cultivar
2003 affecting tree programs
Size not Quality not
not available available acceptable
The State of Urban and Community Forestry in California Page 10Managing the Urban Forest
Management
One of the first issues in man- 100%
aging the urban forest is to
90%
determine whether the devel-
80%
oper, city, or homeowner pays
for establishment and upkeep. 70%
As Figure 16 shows, cities 60%
still appear to assign nearly
50%
all establishment responsibili-
ties to developers, generally 40%
Percent Reporting
as a requirement in develop- 30%
ment permits. This trend has
20%
been increasing from about
10%
75% in 1988 to around 90%
1988
in 2003. But the evidence 0% 1992
Develop. City/Co. 1998
presented in Figure 16 also Home- Develop. City/Co. 2003
Pays owner Home- Develop.
suggests that government is owner City/Co. Home-
Plants
still paying about half of the Maintains owner
bill for maintaining the trees Figure 16. Who pays for, plants, and maintains trees in new residential subdivisions
bought and planted by devel-
opers. Back in 1988, cities and homeowners shared almost equally in maintenance responsibilities. Now homeown-
ers account for half of what cities do to maintain trees in residential developments.
The maintenance role of U&CF programs is increasing in nearly all city land use categories, as illustrated in Figure
17. U&CF programs are now responsible for trees on about one-third of private property, and nearly 50% of the “open
space” in cities and counties. City responsibilities for residential trees has increased now to being almost as high as
“open space.”
60%
50% “Pleasanton has funding but little
support for a residential tree
maintenance program.”
40% Pleasanton, 1998
30%
“We shifted subdivision tree
planting to the developer. Trees
20% Reporting
Percent must be planted to get an occu-
pancy notice. This way trees are
designed into the landscape . . .
10% and have better survival.”
1992 Merced, 2003.
0% 1998
Residential 2003
Industrial
Commercial
Open Space
Figure 17. Percent of areas for which U&CF program is responsible
The State of Urban and Community Forestry in California Page 11Funding Sources
Funding is a persistent problem for urban and community Grants have not played a large role in funding due to lim-
forestry (tree) programs. Figure 18 illustrates the trend in ited sources and funds and that many grants are directed
the average percentage of funds from various sources. The toward non-profits and tree planting. This has led to the
most obvious result is that the city (or county) general fund pervasive problem of street and park trees being added
remains the primary funding source. It appeared that tree to the public inventory but no funding for maintenance
programs dependence on the general fund was declining, for which the city is then responsible (refer back to Figure
down to just over 60% of the programs on average, but the 16).
average increased in 2003 to around 70%. There appears
to be a slight growth in alternative funding sources, such Generating funds through fines is generally not desir-
as assessment districts and a little from recent earmarks in able given the social-political image impact. The only
California gas taxes. Nevertheless, urban forestry is still remaining sources of funds are fees from development
heavily dependent upon taxpayer support through city or and building. Such fees have the potential for generating
county general funds. large revenues but other regulatory pressures have raised
construction fees to politically unacceptable levels.
The heavy reliance on city general funds is to be expected
for any city program; however, under tight budget condi- The urban forest itself has the potential to generate rev-
tions, city officials are forced to cut services starting with enues from the marketing of wood resources derived from
those viewed as non-essential. If urban forestry is to be tree removals. New laws like California’s AB 939 in 1999
sustainable then the benefits that an urban forest provides have forced communities to seriously reduce dumping
must be “translated” into essential benefits. In essence of these useful materials in landfills. In turn, this has helped
urban foresters ask communities to invest major capital to spur the emergence of a new wood products industry
into building the green infrastructure, but the returns seem that uses wood recycled from our urban forests (see the
intangible or indirect. Efforts to assess private sector fees section, “Utilization of Greenwaste Resources,” pages 24
of all sorts are part of the solution in tapping these returns. and 25).
80%
70%
60%
50%
40%
Percent
30%
20%
10%
1988
0% 1992
1998
General Assess. 2003
Fund Permit Grants
District Fees Gas Tax Redev. Fines
Funds
Figure 18. Change in U&CF funding sources - average percentages
“California ranked 47th in per capita funding from the Federal Grant for Urban and Community For-
estry in 2005. The national average in 2005 was $0.12 per person. California’s funding in 2006 was
decreased to $841,500, around $0.02 per person.” CDF Urban Forestry Program Administrator
The State of Urban and Community Forestry in California Page 12Budgets
Since funding is still primarily driven by taxpayer support, Figure 20 complements these findings by showing the
it is appropriate to evaluate U&CF budgets on a dollar per trends from cities that responded to all 4 surveys. For
capita basis. Figure 19 shows that the average (mean) city every city whose budget decreased from 1988 to 1992, two
budget per resident, in constant dollars, dropped signifi- city’s budgets increased. That trend has totally reversed to
cantly after 1992. California experienced a major recession now more cities have decreasing budgets than increasing
around 1992 but has recovered since then but apparently by a 3:1 ratio over the last two survey intervals.
not equally so in the support for city tree programs. In the
late 1980s and early 90s, the average budget was over $4 Recall that one of the criteria for a city to receive “Tree
per resident, dropping by around $1/resident in the late 90s City USA” status from the National Arbor Day Foundation
and up to the present. When the median is used to express is for the community to spend at least $2/resident. This
the most likely budget/resident, the estimate drops more requirement has not changed since its beginning in 1976.
gradually but continuously after 1988 - from about $3 in Failure to adjust the $2 standard for inflation results in an
1988 to less than $2.50/resident in 2003. This indicates effectively lower standard to maintain this status.
that large cities with their large budgets have lost more
funding support since 1988 than smaller communities.
$4.50 Mean
Median
$4.00
$3.50
$3.00
$2.50
$2.00
$1.50
$1.00
$ per resident (constant, 88=100)
$0.50
$0.00
1988 1992 1998 2003
Figure 19. Per capita U&CF budgets adjusted for inflation, 1988 - 2003 *
* Note: All dollar amounts were adjusted for inflation using
the GDP Deflator, base year 1988. US Dept. of Commerce,
Bureau of Labor Statistics. 20
18
16
14
12
10
“CDF’s support of urban forest
8
is improving public awareness.
City leaders have provided fund- 6
Number of Respondents 92 - 88
ing for accelerated tree pruning.” 4
Stockton, 2003 2
98 - 92
0
03 - 98
Increase
Decrease
Figure 20. Changes in U&CF budgets per resident for
municipalities that responded to all 4 surveys
The State of Urban and Community Forestry in California Page 13Budgets (continued)
Analysis of the information in Figures 19 and 20 led to the Another perspective on the community’s commitment to
finding that tree program funding in large cities declined its tree programs is the total expenditures per tree in the
more rapidly than in smaller communities. Figure 21 sup- public inventory. This should not be confused with the
ports this conclusion showing how per capita tree budgets cost of nursery stock or even the cost of an established
vary by city size over the last 4 surveys. In 1988, per tree. Without adjusting for inflation, the average expen-
capita spending was fairly consistent across city size with diture/tree is up slightly to around $19 in 1998 and 2003
an expected drop only in the largest metropolitan areas from around $18 in 1992 and 1988. Clearly, expendi-
given their economies of size. After adjusting for inflation, tures in constant dollars are down from 1988, regardless
small cities have actually increased spending somewhat whether one calculates the average on a per resident or a
while cities with populations over 100,000 have sharply tree basis.
reduced spending since 1992.
$8.00
2003
$7.00 1998
1992
$6.00 1988
$5.00
$4.00
$3.00
$2.00
$ per resident (constant $, 1988=100)
$1.00
$0.00
20 40 60 80 100 150
Population (1000) 200 250 300 400 3500
Figure 21. Budget per resident by population group
The State of Urban and Community Forestry in California Page 14Exemplary Smaller Cities
Lompoc
• Population: 41,167
• Cindy McCall, Parks & Urban Forestry Manager
• Tree Program Budget (100% General Fund):
- $900,000 ($21.36 per capita)
- 11 Full-Time Staff, 3 FTE Part-Time
• Municipal Tree Inventory: 31,000 ($29 per tree)
17,000 Street Trees
9,000 Park Trees
5,000 Open Space
• Plantings in 2003: 1,817 (3% of current inventory)
Stone Pine, Sycamore, Magnolia, Palm, Liquidambar
• Removals in 2003: 693 (2% of inventory)
most chipped for mulch, some solidwood utilization
• Top Benefits: reduced hazards, civic pride, and energy conservation
• Top Needs: Better nursery stock, improved tree maintenance, more citizen support
• Tree Ordinance in-place and effective, detailed tree replacement policy/program for utility right-of-ways, residents
can request one 30’-40’ tree planted in street frontage
• Awards: Tree City USA since 1988, Sterling Growth Award for quality urban forestry practices, “Best Urban For-
estry Program” in 2000 from California Urban Forest Council
Claremont
• Population: 34,964
• Mark Hodnick, Community Services Department
• Tree Program Budget (100% Community Services Assessment District):
- $640,000 ($18.30 per capita)
- 2 Full-Time staff, 0.5 FTE Part-time
• Municipal Tree Inventory: 23,500 ($27.83 per tree)
20,000 Street Trees
3,500 Park Trees
1,608 acres of public parkland of which 1,480 is wilderness
• Planted 150 trees in 2003 but removed only 100; 100% wood recycled for solidwood products
• Top Benefits: business development, civic pride, increased real estate values
• Top Needs: Better nursery stock, technical information, planting space
• Very high support from city government, tree board and citizen advocates
• Tree City USA since 1986.
Monterey
• Population: 29,960
• Robert Reid, Urban Forester
• Tree Program Budget (80% General Fund, 10% grants, 10% assessments
and redevelopment funds):
- $900,000 ($30 per capita)
- 8 Full-Time staff, 0.5 FTE Part-time
• Municipal Tree Inventory: 35,000 ($25.71 per tree)
15,000 Street Trees
20,000 Park & Open Space Trees
Significant responsibilty for native Monterey Pine grove heavily impacted by
pitch canker disease
• Planted 250 trees in 2003 but removed only 178; 100% wood utilized for mulch or firewood
• Top Benefits: reduced hazards, civic pride, and energy conservation
• Top Needs: Citizen support, technical information, planting space
• Very high support from city government and tree board
• Tree City USA since 1983, “Best Urban Forestry Program” in 2002 from California Urban Forest Council
The State of Urban and Community Forestry in California Page 15Program Organization
One of the most critical issues in promoting the city tree predominantly housed in Public Works, whereas in 1988
program is the organizational “position” in the govern- they were found mainly in Parks and Recreation Depart-
ment. It is difficult for new government programs, like ments. The only other government department one might
U&CF, to break into the highest echelons of city gov- find the tree program is in Planning.
ernment in order to have its needs recognized in policy
and funding decisions. Only political pressures and There are, of course, pros and cons to this trend depending
high-profile issues can surmount the barriers to obtaining upon the philosophies, traditions, and personalities within
departmental status. The principle of “span of authority” each city or county department. After public safety, Public
for city managers limits the number of subordinate depart- Works receives the lions share of the remaining general
ment heads he/she can handle (theoretically around 8 to fund. It would seem that being aligned with Public Works
10 subordinates). Therefore, it is important to position the would therefore offer the greatest opportunity for expand-
U&CF program in the department that is most likely to ing budgets, but traditionally, heads of these departments
represent its needs. are engineers who have perceived trees as hazards rather
than assets. Research from the Western Center for Urban
From Figure 22, the departments “housing” a city’s urban Forestry Research and Education has shown that trees
tree program gone back and forth between Parks & Rec- can reduce life cycle costs for streets and parking lots
reation or Public Works. In 1992, Bernhardt and Swiecki (McPherson 2005). This information is finding its way into
found that there was a shift away from Parks & Rec de- the design and planning in Public Works departments and
partments to Public Works. The 1998 survey showed that possibly creating a valued role for urban foresters to make
trend was reversed in 2003. Today, U&CF programs are the connection between the gray and green infrastructures.
70%
60%
50%
40%
30%
20% of Respondents
Percent
10%
1988 (Approx.)
1992
0% 1998
2003
Parks & Public Planning
Rec Comm. Admin.
Works Flood
Serv
Figure 22. Location of U&CF programs within municpal government
The State of Urban and Community Forestry in California Page 16Staffing
90%
80%
70%
60%
50% Table 1. Percent of Tree Budget Spent
on Contractors by City Size Category
40%
City Size 1992 1998 2003
30% Small 55% 70% 64%
Percent of Respondents Medium 42% 55% 65%
20%
Large 22% 44% 51%
10% 88 - 92 Note: City size is the same as used in Figure 6.
92 - 98
0%
98 - 03
Increase
Decrease
Stay the same
Figure 23. Changes in U&CF staffing levels
Staffing levels in municipal urban forestry programs are subject to the same fiscal forces as in all city government.
Outsourcing of city services to contractors has been the trend for many years. The average proportion of the city’s tree
programs spent on contractors has steadily increased from 34% in 1992 to 55% in 2003. This trend combined with
reduced budgets has produced smaller staff levels in urban and community forestry programs than in 1988, as illustrated
in Figure 23. There appears to have been a sharp decrease in staffing since the 1998 survey.
Tree program full-time staffing remains steady with a slight increase of nearly 1.5 FTEs since 1998 to an average of
7 FTEs (see Figure 24). Table 1 explains why more programs show declining staff levels while the average full-time
increased -- large city programs are adding full-time staff while a greater number of smaller programs have reduced
staff. Figure 25 confirms this conclusion - those programs with more than 10 FTE employees increased from 18% in
1998 to 21% in 2003 drawing mainly from the mid-size category of 5 to 9 FTEs.
100%
9 90%
8 80%
7 70%
6 60%
5 50%
FTE
4 40%
3 30%
2 1988
Percent
20%of responding programs
1992 1988
1 10%
1998 1992
0 0% 1998
2003 2003
Full-time 0-4 5-9
10-14
FTE Part-time FTEs 15+
FTE
Figure 24. Changes in U&CF full-time & part-time employment Figure 25. Distribution of full-time U&CF staff
The State of Urban and Community Forestry in California Page 17Contract and Volunteer Services
As discussed under the Staffing section, small 70%
to mid-size city tree programs are increasing
their reliance upon private sector to the point 60%
where more than half of their budget is spent
on contract services. Table 1 indicated that 50%
larger cities are actually adding full-time staff,
while smaller cities naturally need to rely more 40%
upon the private sector. The quality work by
city staff and private sector organizations is 30%
critical to the success of any tree program.
Percent Reporting
20%
Large cities have a greater number of volunteer
and youth organizations to accomplish much 10%
of the needed work, especially tree plant- 1992
1998
ing. The 2003 survey showed a sharp drop in 0% 2003
programs reporting the use of all three types of Correctional Inst. Volunteer or Civic
Youth Org.
organization in planting and caring for urban
Figure 26. Distribution of groups that
trees - more like what was reported in the 1992 plant or care for urban trees
survey (see Figure 26).
“City program staff by ISA Certified Arborists
100%. Contractors crew leader is an ISA Certi-
fied Arborist. Proper schedules with adequate
funding eliminate potential problems.”
Irvine, 1998
The State of Urban and Community Forestry in California Page 18Tree Care
Pruning, trimming, pollarding, and 25%
topping are all terms used and misused
to describe that part of arboriculture in-
volving the removal of parts of the tree
(above and below ground) to achieve 20%
some objective. Whether that objective
is explicitly stated or even justified is
probably at the core of the controversy 15%
over this critical step in caring for urban
trees.
10%
Pruning is defined as “the removal of
Percent Reporting
parts of a plant for size control, health,
or appearance” (Rice and Rice 2000).
5%
It is a well-established principle of ar-
1992
boriculture that pruning jueveniles cor-
rectly will yield tremendous savings in 1998
0%
maintenacnce costs as the tree matures 2003
% juveniles
(“Pruning Young Trees,” International % mature
% topped
Society of Arboriculture 2006). Figure
27 illustrates that pruning of mature Figure 27. Average percent of street & park tree inventory pruned
trees decreased sharply since the 1998 by tree size and percent topped
survey and is even lower than in 1992.
However, only a slight increase in pruning jueveniles occurred indicating that reduced budgets may the cause.
Topping (a.k.a., “heading,” “tipping,” “hat-racking,” and “rounding over”) involves shortening of the central leader of
a tree to make the head fuller and keep the tree short (Rice and Rice 2000). Topping is considered a bad practice since
it is not designed to improve the health or appearance of a tree. If the wrong species for a street site is planted, frequent
structural pruning will be necessary if topping is to be avoided. Since frequent treatments are expensive and funds are
scarce, street trees often go untreated forcing programs or utilities to top to mitigate hazardous conditions. But healthy
trees that are not interfering with utilities or paving are still topped due to lack of proper training or failure to put in prac-
tice what is known. Figure 27 indicates that topping remains a problem with still over 15% of the reporting programs
indicating that it is done.
“The urban forest is being destroyed due to utility companies
‘pruning’ [quotes added] techniques. Directional pruning looks
bad to the entire public; they have no one to answer to, except
the shareholders. Help put a stop to directional pruning, better
known as ‘dollar-based’ pruning.” Novato, 1998
“Educating the public is probably the most important thing we
can do. Most residents think topping or pollarding is the right
way to trim trees because they see others trimming that way.
The public needs to be aware that this is more detrimental to
trees and just because a tree is 60 feet or taller doesn’t mean
that it’s dangerous.” Brea, 1998
The State of Urban and Community Forestry in California Page 19Tree Care (continued)
The 2003 survey indicates that the
strong growth in certifying city staff
in the late 1990s has slowed to be on-
pace with contract services, see Figure
28. Though the question asked whether
pruning standards were required, it may
be that this requirement is becoming
less of an issue as more contractors
become ISA, NAA or ANSI 1 certi-
fied. This is supported by the reduced
number of trees topped (a practice
shunned by professional organizations),
as presented earlier in Figure 27.
A final tree care practice involves the
extent to which drip irrigation systems
are used to irrigate relatively new plant-
ings as opposed to manual methods.
In all surveys since 1992, barely over
50% of the reporting programs indicated that more than half of their municipal trees are irrigated. Irrigation certainly
involves higher initial costs and provides more reliable irrigation. Shrinking budgets and more attention to planting more
xeric species may explain why this practice has not grown in use.
1
ISA: International Society of Arboriculture, NAA: National Arborists Association,
ANSI: American National Standards Institute
100%
90%
80%
70%
“Too many people still
60% perform incorrect pruning.
Those tree left standing are
50% monuments of bad examples
left to be duplicated because
40%
people see them and believe
30% it is proper work. We have
just initiated a volunteer tree
20% pruning program where vol-
unteers are trained . . .”
10% Redwood City, 2003
1992
0% 1998
Employees 2003
Contractor
Utility Co.
Co. on Priv.
Individ. On
Priv.
Figure 28. Groups required to follow pruning standards
The State of Urban and Community Forestry in California Page 20Planning & Inventories
As was just discussed, scheduled maintenance and 60%
pruning of juvenile trees is essential to avoid (1) the
high costs managing the size of mature trees, (2)
50%
hazard tree liabilities, and (3) the need for topping.
The results shown in Figure 29 indicate that manag-
ers of urban tree programs are shifting to systematic 40%
maintenance wherein trees are evaluated on regular
cycles regarding maintenance needs. The 2003 and
30%
past surveys reveal that around 70% of the programs
use a 5 year planning cycle with most others on a 10
year cycle. Only 38% of the programs believe cost 20%
efficiency improvements would result from shorten-
Average Percent of Programs 1988
ing the planning cycle, up slightly from 1998. 10%
1992
1998
In order to make the transition from reactive work 0% 2003
to planned work (e.g., tree planting, maintenance, Regular -
Systematic On-Demand
and removal), it is necessary to have, and maintain,
a detailed inventory of the urban forest. Figure 30 Figure 29. Scheduling of tree maintenance
shows that there has been a recent surge in the use
of inventories in municipalities with tree programs
- over 80% now have computerized inventories. Nearly half of the reporting programs indicated frequent to somewhat
frequent use of their inventories; with about the same percentage of use indicating rarely to frequently used.
90%
80%
70%
60%
50%
40%
30% Reporting
Percent
20%
10%
1992
0% 1998
Prgrm & 2003
Inventory No Prgm but
Inventory Prgrm & No
Inventory No Prgm & No
Inventory
Figure 30. Use of inventories by U&CF programs
“This City’s budget is extremely limited in personnel, equipment
and therefore, we are forced to practice arbor care on demand.”
San Carlos, 1998
“Just beginning a UFMP [urban forest management plan] integrat-
ing public trees with private guidelines.” Del Mar, 1998
The State of Urban and Community Forestry in California Page 21Hazard Mitigation and Liability
Today, a major consideration in urban tree management is assessments. Figure 31 illustrates the extent to which
the potential liabilities arising from decisions ranging from various methods are used to limit or address liabilities
tree selection and planting to care and removal. Munici- resulting from tree hazards. Transferring liability to own-
pal U&CF programs use a variety of methods to prevent, ers is still used when appropriate and legal. However, the
mitigate and limit the hazards that urban trees can create. primary means to prevent the hazard from occurring are
Lawsuits arising from any negligence can involve millions to (1) identify and abate the hazard (76% of reporting
of dollars in damages. programs), and (2) replace lifted sidewalks (68%). Inter-
estingly, the 2003 survey indicates that over 40% of the
As already discussed, having a quality forest inventory is programs contested damage claims, double the number in
probably the most effective tool for identifying potential the 1998 survey but on par with the 1992 survey.
hazards, planning mitigations and communicating liability
Figure 31. Methods used by municipalities to limit tree-related liability
“Our biggest success is our Concrete
Maintenance Program. The purpose of the
CMP is not only to have safe sidewalks
and effective curbs & gutters but to protect
mature street trees in the process of concrete
reconstruction.” Sunnyvale, 2003
“The City of Los Angeles ‘ Sidewalk Repair
and Tree Retention Program is very suc-
cessful. See article in WCISA and SMA
journals. Los Angeles, 2003
The State of Urban and Community Forestry in California Page 22Hazard Mitigation and Liability (continued)
As the saying goes - an ounce of prevention is worth a A fairly popular mitigation method is root pruning of
pound of cure. Prevention strategies are shown in Figure planting stock, a practice consistently used over the year
32 where proper species selection is seen as the most ef- by around one-third of the program. This must be used
fective mitigation measure. The measures that are gain- selectively since many species are damaged as a result or
ing popularity the fastest are physical root barriers and may die years later, as illustrated in Figure 33. There ap-
re-engineering sidewalks. Another, practice the gained pears to be a particular problem with liquidambars, pines,
use since the 1998 survey is to eliminate lawns around and ashes 5 years after planting.
trees, since irrigated lawns and trees don’t co-exist well.
Still, sidewalk realignment remains popular.
“We have begun to
install root barri-
ers. Encircling root
barriers are killing
many trees, we don’t
use them anymore.
Residents demand
tree removal because
of roots in sewers,
broken concrete and
mess. . . . Lots of
median trees are dam-
aged by cars, rare to
recover money. Root
pruning increases tree
life only ten years
before sidewalk lifts
again.” Santee, 1998
Figure 32. Percent citing damage mitigation
measure as “effective”
Liquidambar
Pine
Ash
Camphor
Oaks
Elms
Magnolia
Maple
Carob
Alder
Eucalyptus
Figs
Hackberry
0% 2% 4% 6% 8% 10% 12% 14%
Percent reporting
Figure 33. Species most frequently cited for failure from root pruning
The State of Urban and Community Forestry in California Page 23You can also read