Public transport network planning: a guide to best practice in NZ cities March 2010 - NZ Transport Agency
←
→
Page content transcription
If your browser does not render page correctly, please read the page content below
Public transport network planning:
a guide to best practice in NZ cities
March 2010

P Mees       Royal Melbourne Institute of Technology (RMIT), Australia
J Stone      GAMUT Centre, University of Melbourne, Australia
M Imran      Massey University, New Zealand
G Nielson    Institute of Transport Economics, Oslo, Norway

New Zealand Transport Agency research report 396

ISBN 978-0-478-35291-7 (print)
ISBN 978-0-478-35290-0 (electronic)
ISSN 1173-3756 (print)
ISSN 1173-3764 (electronic)

NZ Transport Agency
Private Bag 6995, Wellington 6141, New Zealand
Telephone 64 4 894 5400; facsimile 64 4 894 6100
research@nzta.govt.nz
www.nzta.govt.nz

Mees, P, J Stone, M Imran and G Nielsen (2010) Public transport network planning: a guide to best
practice in NZ cities. NZ Transport Agency research report 396. 72pp.

This publication is copyright © NZ Transport Agency 2009. Material in it may be reproduced for
personal or in-house use without formal permission or charge, provided suitable acknowledgement is
made to this publication and the NZ Transport Agency as the source. Requests and enquiries about the
reproduction of material in this publication for any other purpose should be made to the Research
Programme Manager, Programmes, Funding and Assessment, National Office, NZ Transport Agency,
Private Bag 6995, Wellington 6141.

Keywords: Cost recovery, mode share, network planning, non-work trips, public transport, transfers
An important note for the reader
The NZ Transport Agency is a Crown entity established under the Land Transport Management Act
2003. The objective of the Agency is to undertake its functions in a way that contributes to an
affordable, integrated, safe, responsive and sustainable land transport system. Each year, the NZ
Transport Agency funds innovative and relevant research that contributes to this objective.

The views expressed in research reports are the outcomes of the independent research, and should not
be regarded as being the opinion or responsibility of the NZ Transport Agency. The material contained
in the reports should not be construed in any way as policy adopted by the NZ Transport Agency or
indeed any agency of the NZ Government. The reports may, however, be used by NZ Government
agencies as a reference in the development of policy.

While research reports are believed to be correct at the time of their preparation, the NZ Transport
Agency and agents involved in their preparation and publication do not accept any liability for use of
the research. People using the research, whether directly or indirectly, should apply and rely on their
own skill and judgment. They should not rely on the contents of the research reports in isolation from
other sources of advice and information. If necessary, they should seek appropriate legal or other
expert advice.
Acknowledgements
The project team acknowledge the financial assistance provided by the NZ Transport Agency (NZTA),
without which this research project could not have been undertaken.

We appreciate the enthusiasm and interest shown by the members of the steering committee – Anthony
James (ARTA), Doug Weir (GW), Shannon Ussher (ECan) and Rachel Gibson (NZTA) – and thank them for
the insights and information they have provided about the current practice of public transport planning
in New Zealand. We would like to thank those who organised and participated in the various workshops
held during the project.

Finally, we thank the three external peer reviewers – Professor Robin Keans (University of Auckland),
Anne Redgrave (Horizon Regional Council) and Dr Ian Radbone (University of South Australia) – for their
constructive comments.

Abbreviations and acronyms
ARTA         Auckland Regional Transport Authority

CBD          central business district

CCC          Christchurch City Council

ECan         Environment Canterbury

GPS          government policy statement

GW           Greater Wellington Regional Council

NZ           New Zealand

NZTA         New Zealand Transport Agency

VKT          vehicle kilometres travelled

ZVV          Zürcher Verkehrsverbund (Zürich Regional Public Transport Agency)
Contents
Executive summary....................................................................................................................................................7
Abstract........................................................................................................................................................................ 10
1          Introduction................................................................................................................................................... 11
2          The network approach: meeting many objectives....................................................................... 13
           2.1         Introduction .......................................................................................................... 13
           2.2         Objectives for urban public transport .................................................................... 13
           2.3         Network planning.................................................................................................. 14
           2.4         Elements of network planning ............................................................................... 18
           2.5         Does network planning deliver?............................................................................. 21
           2.6         How change happens ............................................................................................ 22
           2.7         Conclusion ............................................................................................................ 24
3          Benchmarking public transport in New Zealand cities.............................................................. 25
           3.1         Selecting cities for comparison.............................................................................. 25
                       3.1.1          The city regions selected for comparison.................................................. 25
           3.2         Benchmarking data ............................................................................................... 26
                       3.2.1          Notes on sources and interpretation of benchmarking data ..................... 27
           3.3         What the data revealed .......................................................................................... 28
                       3.3.1          Comparing Auckland and Vancouver ........................................................ 29
                       3.3.2          Comparing Wellington and Zurich............................................................. 31
                       3.3.3          Comparing Christchurch and Schaffhausen .............................................. 33
           3.4         Institutions and policies for public transport ......................................................... 35
           3.5         Service supply and public subsidies ...................................................................... 36
           3.6         Conclusion ............................................................................................................ 36
4          Current public transport planning practice in New Zealand cities ...................................... 38
           4.1         Introduction .......................................................................................................... 38
           4.2         Auckland ............................................................................................................... 38
                       4.2.1          Institutions ............................................................................................... 38
                       4.2.2          Service standards...................................................................................... 38
                       4.2.3          The Northern Busway................................................................................ 40
                       4.2.4          Circulation within the CBD ........................................................................ 40
                       4.2.5          Orbital routes ........................................................................................... 40
                       4.2.6          Ticketing .................................................................................................. 40
           4.3         Wellington ............................................................................................................. 40
                       4.3.1          Institutions ............................................................................................... 40
                       4.3.2          Service patterns ........................................................................................ 41
                       4.3.3          Bus–rail competition on trunk routes ........................................................ 41
                       4.3.4          Design of groups of local suburban bus lines ........................................... 41
                       4.3.5          Service planning ....................................................................................... 42
                       4.3.6          ‘Orbital’ routes ......................................................................................... 42
                       4.3.7          Circulation within the CBD ........................................................................ 42
                       4.3.8          Ticketing .................................................................................................. 43

                                                                                              5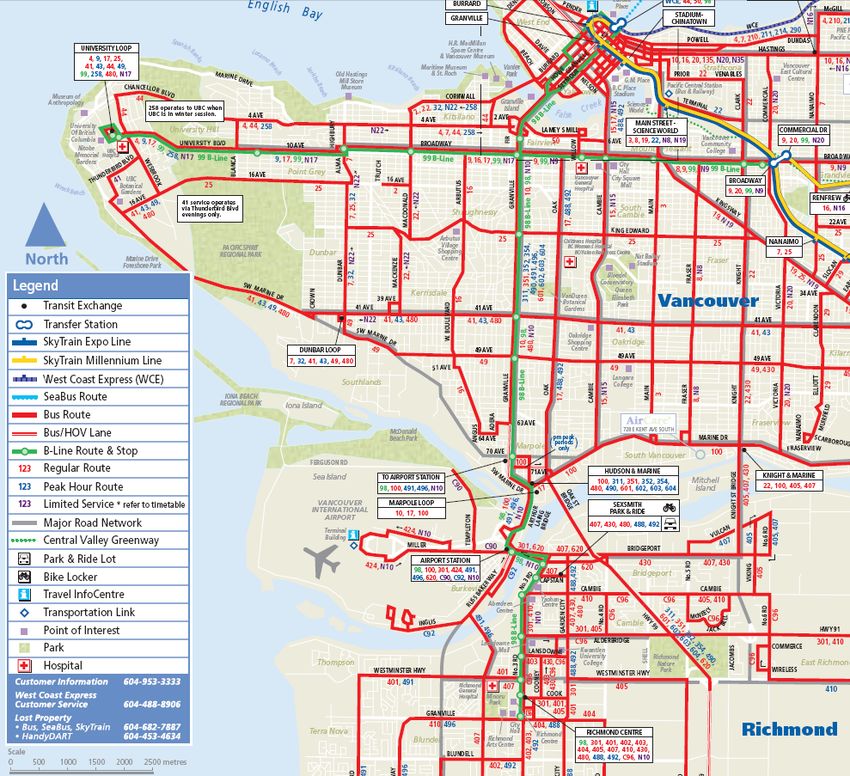
Public transport network planning: a guide to best practice in NZ cities

       4.4        Christchurch.......................................................................................................... 43
                  4.4.1          Institutions ............................................................................................... 43
                  4.4.2          ‘Core’ and ‘community’ services ............................................................... 43
                  4.4.3          Timetables on common route sections ..................................................... 44
                  4.4.4          Circulation within the CBD ........................................................................ 44
                  4.4.5          Ticketing .................................................................................................. 44
5      The potential for improved network planning in New Zealand cities................................ 45
       5.1        Introduction .......................................................................................................... 45
       5.2        Institutions and public processes .......................................................................... 45
       5.3        Network structure ................................................................................................. 46
       5.4        Network operations ............................................................................................... 48
                  5.4.1          A simple and direct network of lines......................................................... 48
                  5.4.2          Speed and reliability ................................................................................. 54
                  5.4.3          Frequency and appropriate service density in weaker markets.................. 55
                  5.4.4          Location and access to stops .................................................................... 56
                  5.4.5          Marketing the network.............................................................................. 56
6      The policy environment for network planning ............................................................................. 58
       6.1        Land-use planning and public transport network planning ................................... 58
       6.2        Restraints on car access to the CBD: parking, environment for pedestrians........... 59
       6.3        Processes for assessment under development planning laws ................................ 60
       6.4        Responses to patronage growth related to petrol price rises ................................. 60
       6.5        Current priorities................................................................................................... 61
       6.6        Conclusion ............................................................................................................ 62
7      Conclusions................................................................................................................................................... 63
8      Recommendations...................................................................................................................................... 65
9      References ..................................................................................................................................................... 66
10     Appendices .................................................................................................................................................... 68
       Appendix A: List of participants in consultative workshops ............................................. 68
                  A1             Auckland, 11 February 2009..................................................................... 68
                  A2             Wellington, 17 February 2009................................................................... 69
                  A3             Christchurch, 19 February 2009 ............................................................... 70
       Appendix B: List of participants in implementation workshops........................................ 71
                  B1             Christchurch, 28 September 2009 ............................................................ 71
                  B2             Wellington, 2 October 2009 ...................................................................... 72

                                                                                       6
Executive summary
The purpose of this research was to explore the potential for implementing the ‘network-planning’
approach to the design of public transport services, to significantly improve both patronage and
efficiency in the use of public subsidies in the urban regions of Auckland, Wellington and Christchurch.
The research was carried out between September 2008 and October 2009.

The challenge for public transport seems daunting. To achieve environmental and social objectives,
public transport must cater for travellers with very different needs, ranging from peak-period access to
the CBD to all-day access to local shops and community centres. It must provide attractive service
frequencies and operating hours to a wide range of destinations, while also maintaining high
occupancy rates. Many observers have argued that the trade-offs present an insoluble problem – but
there is evidence to counter this assertion.

Successful public transport systems in Europe and North America have managed to serve commuters,
shoppers and car-less people, while also combining high service levels with good cost recovery. Some
features of European cities, such as high population densities and limited space for cars, have made it
easier for them to achieve these outcomes, but service planning philosophies and strategies are also
critical to success. This report explores an essential element of service planning, which has come to be
called the ‘network approach’, or network planning.

One approach to diverse, ‘anywhere-to-anywhere’ travel patterns is to provide ‘tailor-made’ services
for different travel markets: express buses and trains for peak commuters; regular buses for local trips
along busy corridors; and services (such as ‘dial-a-bus’) without fixed schedules for low-demand
corridors and times. The problem with this approach is that the more public transport is tailor-made,
the more it surrenders its environmental and economic advantages.

The alternative is networks. Instead of having tailor-made public transport, the introduction of
transfers can enable provision of a ‘ready-made’ service. This approach enables ‘anywhere-to-
anywhere’ travel with high occupancy rates by carrying different kinds of travellers on the same
services. By being organised around transfers, a public transport system can offer access to a large
number of potential destinations at an affordable cost to the operator. Traditional public transport
planning has treated transfers as an inconvenience to be avoided at all costs, but the network approach
makes them the building blocks of a multidestinational system. While transfers present many new
travel opportunities, they also impose inconvenience. Creating effective transfer-based public
transport systems requires careful planning to ensure that the inconvenience is minimised.

There is clear evidence that impressive results have been achieved though network planning for public
transport services in many European and North American cities. Patronage levels have grown
considerably, while efficiency in the use of the public subsidy has improved.

To provide examples of ‘best practice’ in public transport service design, we selected three overseas
cities that had similar characteristics to each of the New Zealand cities in terms of urban form,
demographics and public transport infrastructure. The intention was to reveal, as far as possible, the
impact of the approach to public transport service design on patronage levels and efficiency in the use
of resources.

The comparator pairs chosen for this research were Auckland and Vancouver; Wellington and Zurich;
and Christchurch and the Swiss town of Schaffhausen. The choice of a comparator for Christchurch was
the most difficult. Although there are cities of comparable size with successful public transport, such
as Freiburg in Germany, these have well-developed heavy- and light-rail systems. In the absence of a

                                                    7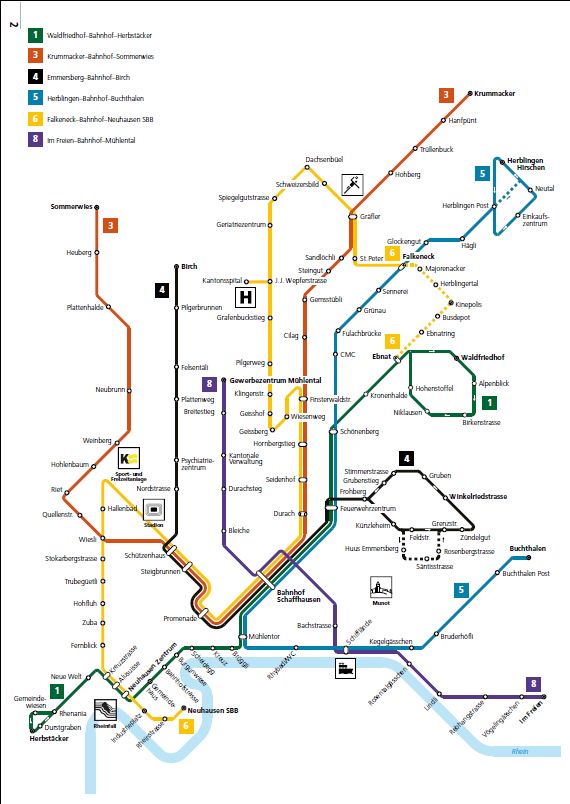
Public transport network planning: a guide to best practice in NZ cities
good comparator, we have included possibly the most successful all-bus urban transport system in
Western Europe.
Comparisons were based on population, residential density across the urban region, jobs in the CBD,
mode share for the journey to work, public transport boardings, public transport service-km, and the
level of public subsidy required per public transport boarding.
The comparisons revealed that New Zealand’s three largest urban regions have considerable potential
to build on the increases in public transport patronage and mode share that have been achieved during
the last decade. Encouragingly, the greatest potential for improvement seemed to lie with ‘non-
traditional’ trip types, which could be accommodated without imposing commensurate increases in
capital and operating costs.
The research also investigated current public transport operating practices in Auckland, Wellington and
Christchurch, and found that these practices reflected the broad history of decisions made in transport
planning in each city over recent decades.
Because of its smaller size and relative coherence in the institutional history of public transport service
planning and delivery, Christchurch had been able to develop or preserve a number of important
features of the network-planning approach, most notably a ticketing system that did not penalise
passengers who made transfers. Its cross-town ‘Orbiter’ line, introduced in 2000 at the same time as
common bus liveries and the unifying ‘Metro’ brand, had achieved a level of transfers that exceeded
the expectations of local planners. However, in both Auckland and Wellington, we found that the ability
of private operators to run ‘commercial’ services at will had hampered efforts to coordinate services
and had allowed perverse competition between different public transport modes to continue. In
Auckland, particularly, obvious opportunities to significantly reduce journey times through better
coordination of rail and bus timetables had been overlooked.
Practical experience in the international comparator cities and elsewhere suggests three key areas of
change that would improve public transport service planning in New Zealand cities:
1 Appropriate institutions and public processes:
Establish a public agency to plan the network across the whole urban region.
Redirect private-sector competition into producing best-value tenders for the delivery of part,
or all, of a publicly planned system.
Use well-designed public education and consultation programmes to manage changes.
Provide a simple fare system that avoids the imposition of penalties for transfers.
2 Network structure:
Provide a simple and stable network of lines throughout the day.
Base mode choice for different lines in the network on required capacity, comfort and speed.
Consider locations for suburban interchanges on the basis of predicted travel patterns and
efficient vehicle operations.
3 Network operations
Simplicity and directness:
- Organise the network on the principle of ‘one section – one line’.
- Avoid deviations in the physical routes chosen for bus services.
8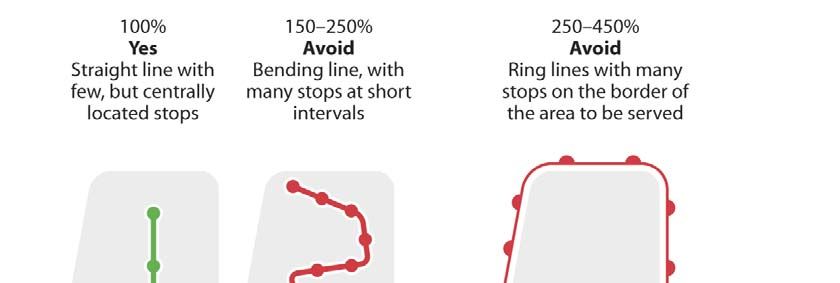
Executive summary
- Provide pendulum lines through key activity centres and interchanges.
Speed and reliability:
- Aim for travel speeds comparable to, or faster than, door-to-door travel times that can be
achieved by car.
- Provide on-road signal and traffic-lane priority to allow buses to meet connections.
- Aim to have vehicles stopping only as required to pick up and drop off passengers.
Frequency:
- Establish ’forget-the-timetable’ headways (10 minutes or less) in key travel corridors.
- Set up integrated timetables outside high-frequency areas.
Location of stops and access to services:
- Carefully plan the location of stops to minimise the number of stops and ensure their
optimal location in relation to major trip attractors, intersecting lines and pedestrian
accessways.
- Locate stops in car-free precincts close to important destinations, to give public transport
a significant competitive advantage.
- Change current access to ‘trunk’ services from ‘park-and-ride’ facilities to access by
walking, bicycle, or feeder bus, in order to cater for long-term growth in patronage.
- Ensure that walking distances between services in interchanges are very short: preferably
no more than 10 metres.
Marketing for first-time and occasional users:
- Create a simple line structure that makes the network easy to understand.
- Use maps, on-line information, vehicle livery and on-board displays to reinforce
understanding of the line layout and transfer opportunities.
While regional land-use planning in New Zealand cities has been increasingly recognising the need to
promote transit-supportive urban forms, in particular by discouraging scattered and very low-density
development, these policies cannot, on their own, ensure that public transport will improve. However,
when coupled with the network approach to the design and delivery of public transport service,
important gains could be made.
Although further research is needed to quantify the specific benefits, it is clear from the directions
outlined in this report that considerable potential exists to improve public transport at an affordable
cost and in ways that can significantly contribute to the government’s strong economic growth agenda.
9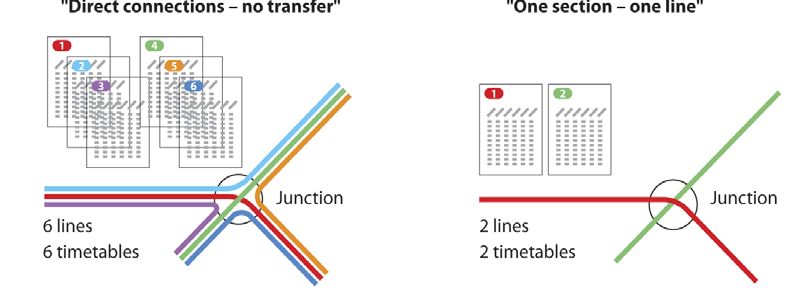
Public transport network planning: a guide to best practice in NZ cities
Abstract
This research explores the potential for the ‘network-planning’ approach to the design of public
transport to improve patronage of public transport services in Auckland, Wellington and Christchurch.
Network planning, which mimics the ‘go-anywhere’ convenience of the car by enabling passengers to
transfer between services on a simple pattern of lines, has achieved impressive results in some
European and North American cities, where patronage levels have grown considerably and public
subsidies are used more efficiently.
Three overseas cities provided examples of ‘best practice’ in public transport service design to
compare with services in Auckland, Wellington and Christchurch. The comparisons revealed that
New Zealand’s three largest urban regions had considerable potential to build on the increases in
public transport patronage and mode share that have been achieved during the last decade.
Current public transport operating practices in Auckland, Wellington and Christchurch were assessed
and key areas were identified in which public transport planning could be improved – namely:
A public institution is required to plan a network across the whole urban region, to let best-value
tenders for the delivery of part or all of this system, and to manage the political processes of
change.
Successful network operations require simple and direct lines; ‘forget-the-timetable’ frequency in
key corridors; and marketing that targets new and occasional users.
101 Introduction
1 Introduction
This report presents the findings of research carried out between September 2008 and October 2009
for the NZTA 2008/09 research programme.
The purpose of this research was to contribute to improvements in the planning and design of public
transport services in New Zealand cities, particularly in Auckland, Wellington and Christchurch.
Current passenger transport systems in New Zealand cities are overwhelmingly reliant on private cars.
The future risks of this dependence on cars – increased social and economic costs and environmental
impacts – mean that cost-effective and less-polluting alternatives must be found to efficiently serve
the urban transport task. Faster and more convenient travel by public transport is needed to replace
longer urban journeys and to maximise the efficient use of existing roads.
Because of their relatively small populations and dispersed patterns of settlement, New Zealand cities
face significant challenges in creating high-quality public transport services that are a viable alternative
to the car. Complementary policies in urban planning, infrastructure investment and transport demand
management are required to increase patronage of public transport modes. Recent research suggests
that ‘network planning’ is the critical element in making public transport successful in small-to-
medium-sized cities.
In the more successful European and Canadian urban public transport systems, network planning is
central to designing public transport services that can offer a competitive alternative to the car for
urban travel. Network planning creates maximum flexibility for travellers by making it easy for them to
transfer between different services or modes.
This report begins with a review of existing international literature in which the principles of network
planning are described, and the evidence for achievements in increased patronage and more efficient
use of public subsidies is assessed (section 2).
Section 3 then establishes the potential for achieving similar benefits in New Zealand through a process
of benchmarking Auckland, Wellington and Christchurch against international comparators on a range
of parameters covering urban form and public transport performance. The purpose of these
comparisons is not to suggest that precise imitation of public transport policies is possible or
desirable, but rather to establish that an opportunity exists to improve considerably on current
performance. The comparator cities were chosen because of their similarities to the New Zealand cities
on a range of factors known to influence public transport performance, and on the availability of useful
data on travel patterns and operating conditions.
Section 4 presents a summary of current public transport operating practices in Auckland, Wellington
and Christchurch. These practices reflect the outcomes of the various competing forces in transport
planning in recent decades in each city.
The major findings of the research are presented in section 5. Here, we describe the practical
application of the ‘network-planning’ approach to the specific conditions found in New Zealand cities.
Issues included in this analysis are:
institutions and public processes
network structure
network operations
- simplicity and directness
11Public transport network planning: a guide to best practice in NZ cities
- speed and reliability
- frequency
- attention to location of stops and access to services
- marketing – providing good information for first-time and occasional users.
The policy framework, at regional and national levels, is crucial to the future implementation of an
effective public transport network. Section 6 provides a summary of current policies in effect across the
whole transport system in New Zealand, pointing out those that are supportive and others that tend to
act against the goal of achieving improved patronage and efficiency in the operation of public transport
in New Zealand cities.
In the final section, we present our recommendations – that the development of detailed plans for
networked public transport services in Auckland, Wellington and Christchurch would provide a strong
basis for future government expenditure in public transport. Developing such plans would require the
allocation of significant resources from public transport agencies and governments, with the benefits
of ensuring cost-effective operations that maximise short-and medium-term growth in patronage, and
identifying long-term requirements for future capital investment in new rolling stock and
infrastructure.
122 The network approach
2 The network approach: meeting many
objectives
2.1 Introduction
Public transport is increasingly required to serve a range of objectives – from providing mobility to the
disadvantaged through to alleviating traffic congestion – while also making efficient use of financial
resources. These different objectives often conflict. For example, commuters to city centres prefer fast
radial services, while disadvantaged people without cars often want access to destinations in their local
areas; reducing congestion and environmental problems suggest a focus on increasing peak-period
patronage, but this may lead to poor financial outcomes by leaving staff and vehicles underutilised at
other times.
Many cities in Europe, and some in North America, have successfully met these challenges, providing
public transport that serves the needs of local travellers as well as city-centre commuters, and
combining environmental benefits with modest public subsidies and high cost-recovery ratios. Of
course, European cities, with historic city centres and high population densities, are very different from
those of New Zealand and Australia. It is often assumed that these differences provide a complete
explanation of the much greater role played by public transport in such places.
Relatively little attention has been paid to the public transport planning philosophies and practices
underlying successful systems in Europe and North America. This report explores the central element
of those operating philosophies: the ‘network-planning approach’. It suggests that the network
approach can be used in smaller, lower-density cities as well as in large, dense metropolitan cores. It
draws on the European Union’s HiTrans project1 (which applies network planning to smaller cities and
towns in Europe) and extends the approach to include New Zealand’s three largest cities. It seeks to
evaluate the potential for network planning to produce public transport systems that more effectively
serve region-wide travel needs, while ensuring efficient utilisation of resources.
2.2 Objectives for urban public transport
The historic function of public transport has been to provide mobility for people without access to cars.
Fifty years ago this meant the great majority of New Zealand urban dwellers, but by the 2006 census,
only 8% of New Zealand’s households were without cars.2 However, this still amounted to 113,000
households nationally, most of which were in major cities, and to this number must be added people
living in households that have cars but who are unable to drive because of age, disability or other
reasons. Many of these people are not in the workforce, and their travel needs are focused on access to
education, shopping and community facilities. This gives rise to spatially and temporally diffuse travel
patterns that, when combined with the relatively small number of carless households, mean that the
travel needs of the carless can be difficult to serve economically with traditional public transport
systems.
1 HiTrans is an EU-funded cooperative research project involving city and transport agencies in the UK and
Scandinavia. It produced five best-practice guides on various public transport planning themes (www.hitrans.org).
2 Statistics New Zealand: 2006 Census Regional Summary Tables, table 14 (‘not elsewhere included’ subtracted
from total).
13Public transport network planning: a guide to best practice in NZ cities
In most cities, public transport plays a role in alleviating traffic congestion, parking difficulties and the
environmental impacts of commuting by automobile. These problems are most serious in central
business districts (CBDs), and commuter public transport has historically focused on the CBD market.
Commuter services have provided direct access to the CBD in peak periods, with minimal or no service
in off-peak periods or to non-central locations. Commuter transit suffers from underutilisation of
staff, infrastructure and vehicles – many buses or trains make only one full return trip per day, making
it difficult to cover the costs.
In many cities, public transport is essential to the economic viability of the CBD. The vital commercial
hearts of New York or London could not function without public transport, which carries the great
majority of workers, shoppers and other visitors. In the 1960s and 1970s it became fashionable to
argue that smaller cities, such as those in New Zealand, did not require traditional CBDs, and that
retailing, entertainment and much employment should be decentralised to suburban centres. However,
since the 1990s, urban economists have realised the importance of ‘agglomeration benefits’ in
supporting economic growth in an ‘information economy’. This has led to a renewed focus on
prosperous CBDs and subcentres, and the effective public transport systems needed to support them
(Abusah and de Bruyn 2007). To contribute to productivity in this way, public transport needs to move
beyond the traditional commuter role, and also serve shoppers, tourists and business visitors.
Finally, there is the problem of sustainable development, highlighted by the twin challenges of climate
change and insecure oil supplies. As noted by the New Zealand government, the availability of public
transport can help mitigate the effects on households of volatile oil prices (Government of New Zealand
2009, p17). Public transport is more environmentally efficient than car travel – provided occupancies
are sufficiently high – and it can indirectly promote walking (Mees 2010). The environmental challenge
dovetails with economic efficiency, which also requires adequate occupancy rates. Empty trains and
buses do not generate sufficient revenue to cover a reasonable share of their costs; nor do they
produce better environmental results than the private car.
The challenge for public transport seems daunting. Serving all the different objectives noted above
involves catering for travellers with very different needs, ranging from peak-period access to the CBD
to all-day access to local shops and community centres. It also involves providing attractive service
frequencies and operating hours to a wide range of destinations, while also maintaining high
occupancy rates. Many observers have argued that the trade-offs present an insoluble problem – but
there is evidence to counter this assertion.
Successful public transport systems in Europe and North America have managed to serve commuters,
shoppers and people who don’t have cars, and also combine high service levels with good cost
recovery. Some features of European cities, such as high population densities and limited space for
cars, have made it easier for them to achieve these outcomes, but service-planning philosophies and
strategies are also critical to success. This report explores an essential element of service planning that
has come to be called the ‘network approach’, or network planning.
2.3 Network planning
The essential purpose of public transport is to carry people with different trip origins and destinations
in the same vehicle. These travellers can be transported with lower economic and environmental costs
than if they travelled separately. However, as homes and workplaces become more and more
dispersed, public transport faces an increasing challenge regarding the range of trip origins and
destinations.
142 The network approach
One approach to having diverse, ‘anywhere-to-anywhere’ travel patterns is to provide ‘tailor-made’
services for different travel markets: express buses and trains for peak commuters; regular buses for
3
local trips along busy corridors; and car-like paratransit for low-demand corridors and times. The
problem with this approach is that the more public transport is tailor-made, the more it surrenders its
environmental and economic advantages. A public transport system offering a direct service between
every origin and destination would have low frequencies, low occupancies, high costs and high
greenhouse gas emissions per passenger. Taxis already provide this kind of service in most cities, and
while an important part of urban life, they are not cheap and, without changes to the fuel source, do
not reduce greenhouse gas emissions or fossil-fuel consumption.
The alternative is networks. Instead of having tailor-made public transport, the introduction of
transfers can enable the provision of a ‘ready-made’ service. This approach enables ‘anywhere-to-
anywhere’ travel, with high occupancy rates, by carrying different kinds of travellers on the same
services. Visitors to Paris soon learn that this is how the city’s Metro works: nearly every trip requires a
transfer, but transfers are free and high frequencies ensure minimal waiting. Even in the dense urban
setting of Paris, it is not economically feasible to provide high-quality, transfer-free services; in
dispersed environments, the difficulties are even greater.
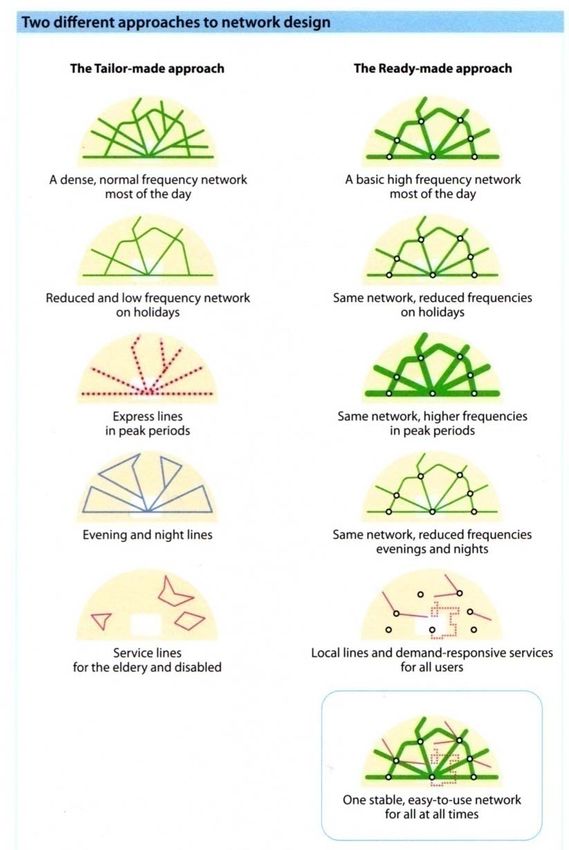
The difference between the ‘tailor-made’ and ‘ready-made’ approaches is illustrated in figure 1.1. The
idea behind the ‘ready-made’ model is to provide a stable network of routes, or ‘lines’, that operates
consistently and at high standards throughout the day and week, catering for as many different trip
types as possible with as few different lines as possible.
3 Modes of public transport (for example, dial-a-bus) that do not follow fixed routes or schedules.
15Public transport network planning: a guide to best practice in NZ cities
Figure 2.1 Two different approaches to network design (Nielsen 2005, p35)
The key operational elements of the network approach are:
integration of all modes with easy and comfortable transfers at multiple locations across a city
region
a clear and consistent ‘line’ structure that is easy for users to learn and understand
direct routes, enabling fast operating speeds
high frequencies where demand is sufficient, and coordinated timetables elsewhere.
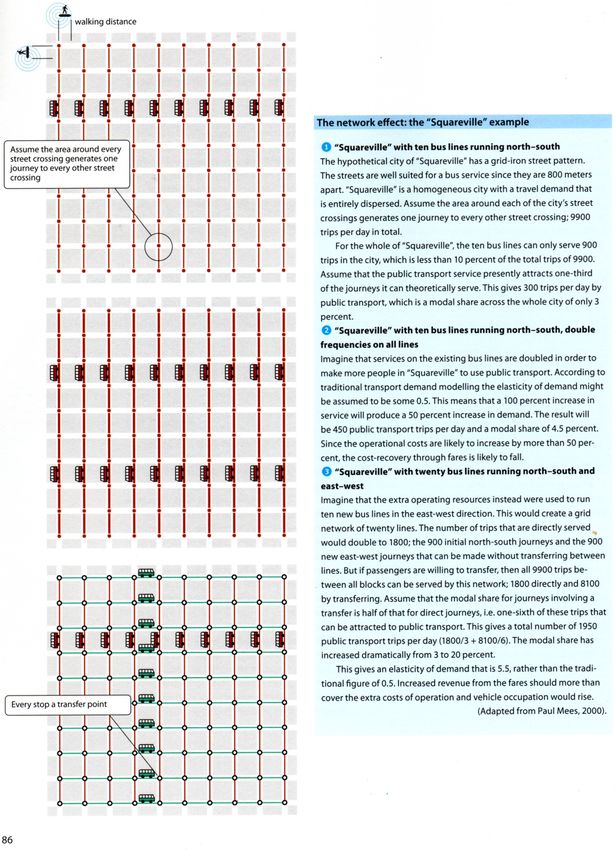
This approach relies on the efficiencies created by what has come to be called the ‘network effect’. This
can be illustrated through the example of a hypothetical dispersed, low-density city called Squareville
(see figure 2.2).
162 The network approach
Figure 2.2 The network effect: the ‘Squareville’ example (Nielsen 2005; p86; Mees 2000)
‘Squareville’ illustrates the key idea behind network planning: serving the maximum number of
possible journeys with the minimum of operational resources. Obviously, this is only a model, and
real-world cities will have their own individual requirements, but it illustrates the fact that transfer-
based systems can create large resource savings while simultaneously opening up new travel
possibilities. This provides a way around the low elasticities of demand found in traditional transport
studies, which have suggested that patronage increases less rapidly than the rate at which new services
17Public transport network planning: a guide to best practice in NZ cities
are added, leading to steadily decreasing occupancy rates. The network effect enables services to be
added in ways that increase demand at faster rates than those at which resources are added.
Transfers are the key to the network effect. As the Squareville model illustrates, transfers are integral
to a public transport system that offers access to a large number of potential destinations at an
affordable cost to the operator. Traditional public transport planning has treated transfers as an
inconvenience to be avoided at all costs, but the network approach makes them the building blocks of
a multidestinational system.
Two US researchers have commented on the importance of transfers:
Surveys asking what passengers like and dislike about transit find that transferring is at
or near the top of the list of dislikes. Passengers prefer a direct trip from their home to
their job or other destinations. The express bus in some radial systems takes this finding
to heart by designing systems based on direct routes from suburbs to CBDs. Transfers are
avoided, but at the cost of limiting opportunities for travel to non-CBD destinations. In
contrast, the multidestinational approach uses transfers to open travel paths to and from
non-CBD destinations that are reachable in radial systems only by lengthy and circuitous
travel. The intent is to induce new ridership through the provision of new travel
opportunities created by transfers in the belief that the induced non-CBD patronage will
exceed any CBD patronage that may be lost due to an added transfer.
…The differing views on transferring lead to differing views of suburban bus lines. In the
multidestinational approach, suburban bus routes are neither parallel routes to the CBD
nor specialized ‘feeder routes’ to trunk lines running to the CBD. Rather, they are treated
as general purpose routes that interlock with each other through transfers to make
intrasuburban mobility possible, while also feeding passengers onto trunk routes or
dispersing passengers from trunk routes. It is as accurate to say that a rail or bus
regional trunk line is a feeder to suburban bus lines as it is to say that bus lines feed the
trunk line, or that suburban bus lines feed other suburban buses (Thompson and Matoff
2003, p298).
While transfers present many new travel opportunities, they also impose inconvenience. Creating
effective transfer-based public transport systems requires careful planning to ensure that the
inconvenience is minimised as much as possible.
Empirical evidence for the success of public transport agencies in some cities to ‘sell’ this model of
public transport service provision to their communities, and the conditions under which this success
was achieved, are discussed in sections 2.5 and 2.6, and in the international comparisons with
New Zealand cities in section 3.
2.4 Elements of network planning
The basic idea is to transform a traditional public transport system, consisting mainly, or entirely, of
low-quality routes, into an integrated network of high-quality services.
182 The network approach
Figure 2.3 Creating a high-quality network (Nielsen 2005, p95)
19Public transport network planning: a guide to best practice in NZ cities
Four key elements of network planning underpin the creation of high-quality, transfer-based networks.
A simple line structure
The HiTrans best practice guide to network planning (Nielsen 2005) distinguishes between ‘routes’
and ‘lines’, as illustrated in figure 2.3. A route is defined (as in the standard usage of the word) as
‘the physical path traversed by a public transport vehicle’. However, it useful, particularly in
discussion of the planning and operation of bus services, to have a separate term, ‘line’, as an
operational element in a public transport system. Therefore, in a planned network, a bus ‘line’
would have a defined and unchanging physical route with a fixed stopping pattern, a specific
timetable, and a unique name and number. The idea, in part, is to give bus services something of
the coherence and permanence of train and tram lines.
Simplicity offers two important benefits: it makes the network easier for passengers to understand,
and it reduces resource requirements by limiting the number of lines that an operator must
provide. Although there are some occasions in weaker markets where multiple lines might operate
in a single corridor, creating simple structures generally means using only one line in a corridor:
the Paris Metro provides an excellent illustration of this concept in operation.
Stable line and operating patterns
As well as being simple, a network must also be stable. As figure 2.1 illustrates, the idea is to
provide a consistent, high-quality service across the network all day, rather than operating
different service types in peak, off-peak, night and weekend time periods. Where additional
services are required to cope with peak demands, this is done by intensifying the basic service
frequencies, rather than by introducing new lines or disrupting the stopping patterns on existing
lines. Under this model, the addition of express services might be achieved by adding a new ‘line’
with the same route as the all-stops line, but with a different stopping pattern. The express may
be given a name or number that indicates its relationship to the standard line.
Convenient transfers
Easy transferring requires attention to timetables and physical facilities. ‘Random’ transfers are
possible when all lines serving an interchange point operate frequently, generally every 10 minutes
(six departures per hour) or better. ‘Timed’ transfers are needed when services are less frequent,
and the timetables for connecting lines must be coordinated.
Coordinated timetables require common service frequencies and hours of operation. If frequencies
are the same on all lines, then it is possible to coordinate all arrivals and departures at an
interchange to produce a ‘pulse timetable’. Typically, this involves all the bus lines to a station
arriving shortly before the connecting train, and then leaving soon after the train departs. This
allows transfers to be made in all directions, not just to or from the CBD (Mees 2010, chapter 8;
Nielsen 2005).
The physical layout of transfer points is also crucial. Short walking distances, clear signage, and
protection from the weather and from anti-social behaviour are the key elements (Nielsen 2005,
pp100–101).
Appropriate institutions and fare systems
Transfer-based networks require transfer-friendly fare systems. This generally means that patrons
pay for the distance travelled rather than the number of transfers made, typically through a zone-
and time-based fare system. However, it is extremely difficult to arrange systems of this kind when
different public transport operators retain their own fare revenue. The division of fares among
202 The network approach
different operators is problematic, because in a genuine network, ‘weak’ lines are cross-subsidised
by ‘strong’ ones in order that the same service frequencies can be provided on all lines serving an
interchange. Network planning requires a system for pooling fare revenues to allow cross-subsidy.
The pooling of fare revenues to allow cross-subsidy and free transfers, and the planning of lines
on a whole-of-system basis, point to the need for a single agency to take responsibility for
planning and funding the network. The European Union’s HiTrans project concluded that a regional
public transport agency is an essential requirement for an effective network.
Under such a system, individual operators compete for the market, rather than in the market, by
tendering for the right to operate lines, or groups of lines, forming part of the network. Such a
system is perfectly consistent with the New Zealand Ministry of Transport’s objective of ‘healthy
and fair competition for contracted public transport services’ (NZ MoT 2009, p10), since, as the
HiTrans manual points out:
Planning and competition are not necessarily contradictory. It is more a question of
appropriate allocation of the roles of the two approaches in the institutional setup (p11).
The combination of region-wide planning by a public agency and competitive tendering for
services is becoming increasingly popular in Europe, having achieved positive results in London,
Copenhagen and Swedish cities. It is also being introduced for buses in Singapore, under that
country’s most recent land transport strategy (Land Transport Authority of Singapore 2008, pp38–
39).
In Australia, these institutional arrangements are in place in Perth, where public transport
patronage has grown steadily since the early 1990s (Stone 2009), and in Adelaide, where political
support is emerging for service improvements that have good potential to improve patronage
levels.
2.5 Does network planning deliver?
The first comprehensive comparison made between network planning and the more traditional
approaches was Mees’ analysis of public transport in Melbourne and Toronto in 2000. This
demonstrated that two cities with similar populations, incomes and urban forms had experienced very
different public transport outcomes. Per-capita public transport usage in Toronto was at least twice as
high as in Melbourne, despite a much smaller rail system and significantly lower public subsidies.
Toronto’s superior performance was the result of network planning by a single public agency that
offered travellers frequent and direct bus services, as well as easy physical connections at subway
stations and with other buses at street corners. Melbourne’s poor performance was due to indirect,
infrequent and poorly connected services – these were the consequence of unproductive competition
between two public agencies with separate responsibilities for train and tram services and a plethora of
private bus companies (Mees 2000).
Subsequent analysis of a group of US cities has confirmed the benefits of network planning. Thompson
and Matoff (2003) investigated changes in public transport service levels and patronage between 1983
and 1998 in nine growing urban regions. They found that cities that adopted a network-planning
approach significantly outperformed those that adopted a radial/direct-route approach: the ‘network’
cities recorded higher patronage increases and lower rises in subsidy levels. It is worth noting that all
nine cities appeared to have lower urban population densities and higher car-ownership rates than
Auckland, Wellington or Christchurch.
21Public transport network planning: a guide to best practice in NZ cities
Many transport analysts regard Zurich as the ‘benchmark’ city for public transport. Although its
residents are among the wealthiest city-dwellers in the world, they use public transport at very high
rates, and importantly, usage rates have been increasing at the expense of the car for at least two
decades. The Canton (or State) of Zurich, covering Zurich City, its suburbs and surrounding rural areas,
has a similar population to the Auckland region, at around 1.3 million. However, Canton Zurich’s
residents made 542 million public transport trips in 2007, compared with the 52 million trips made in
Auckland (ARTA 2008, p15; Zurcher Verkehrsverbund 2008, p14). In the City of Zurich, 63% of
residents travelled to work by public transport at the last census in 2000, while 25% went by car (the
remainder walked or cycled); the canton-wide shares were 41% and 47% respectively. In both cases, the
public transport share had increased since the previous census in 1990. For trips to school and
university across the canton, 31% were by public transport and only 3% by car – the other two-thirds of
students walked or cycled (data from the Swiss census reported in Mees 2010, chapter 8).
While Zurich has a substantial inner-city tram system and an extensive suburban rail network, this
infrastructure is not remarkable by European standards. Nielsen and other observers agree that the
critical factor behind Zurich’s superior performance is the very comprehensive network planning
covering the city and canton. Excellent services are provided not just for CBD commuters, but for off-
peak, cross-city and inter-suburban travellers as well:
The main key to market success is the network qualities of the public transport system. It
is the integrated, high frequency network with many interchanges, and the stable and
reliable operation through several decades that makes the difference (Nielsen 2005,
pp89–93).
And, like most other relatively successful European and North American cities, the ‘offer’ to Zurich
citizens of an attractive public transport network is supported by restrictive policies for such measures
as parking and road space allocation for cars, which add to the comparative advantage of public
transport over car travel for many trips. (For a more general discussion of the need for a coordinated
package of incentives for public transport and disincentives for car travel, see Vuchic 1999.) The
relative influence the public transport service can have in shifting travel mode preferences away from
the car is reinforced in the example of Schaffhausen, described in section 3. This small town has
achieved significant public transport patronage, without imposing major obstacles for car users,
through the exceptional quality of its public transport network.
Significantly, while Zurich City has a typically European high population density, the suburbs and rural
areas are actually more spacious than the suburbs of New Zealand cities, with many residents living in
small villages dispersed through farmland and forest. Zurich has found a way of extending network
planning to areas with extremely low population densities.
2.6 How change happens
One common feature of success stories in public transport network planning is the role of the public in
bringing about change. Zurich is the most celebrated example. In the 1960s and early 1970s,
policymakers sought to replace the city’s trams with an expensive underground ‘metro’ system, but the
proposal was twice defeated at referendums. A third referendum, initiated by citizen’s groups,
proposed upgrading the existing tram and bus lines to provide metro-style services. It was finally
passed in the mid-1970s, and the turnaround in the city’s public transport fortunes dates from that
time. A second successful referendum in the 1980s, this time initiated by the cantonal government,
laid the foundations for extending networked public transport to suburban and rural areas (Mees 2010,
chapter 8).
222 The network approach
These days, general acceptance of environmental and social objectives for transport policy means that
citizens’ action is no longer necessary to get public transport onto the political agenda. However,
public involvement in the planning of service changes is critically important, because there will always
be winners and losers in any restructuring of a public transport network. The losers will be those
existing travellers for whom current timetables and line structures are convenient; many of the winners
will be new patrons whose travel needs are currently not met at all. Unless network restructuring is
handled sensitively, with robust community engagement, the beneficiaries of improved services will not
have the opportunity to have their say, and the negative reactions of those who find the current
arrangements more convenient will dominate discussions.
Many restructurings of substantial networks, such as the US examples discussed by Thomson and
Matoff in section 2.5 above, were implemented at the same time as the opening of new rail lines. The
attractiveness of a new rail service can provide an excellent context in which to gain support for
changes that require transfers.
A good example of this was the recasting of bus services in the southern suburbs of Perth in December
2007, at the same time as opening the Mandurah rail line. The rail line replaced a bus lane along the
Kwinana Freeway, which had allowed direct commuter services between the southern suburbs and the
CBD. With the opening of the new rail line, direct bus services to the CBD were withdrawn and replaced
with feeder lines that doubled as cross-city links.
This reorganisation has significantly improved access to Murdoch University. The campus is about a
kilometre to the west of the Kwinana Freeway, and used to be difficult to reach from the east as most
bus services from that direction turned north at the freeway and continued to the CBD. Now, bus routes
from the east drop passengers at Murdoch Railway Station and continue to the university. The
inconvenience of the transfer to and from trains for CBD passengers has been minimised by a well-
designed interchange, a multimodal fare system, frequent train services, coordinated timetables, and
the fact that the train trip to the CBD is much faster than the previous bus trip. 2009 figures showed
that 59% of passengers boarding trains at Murdoch Railway Station arrived by bus (36% used park-and-
ride facilities, and only 5% walked), and the railway station was the busiest in suburban Perth, with
nearly 7000 daily boardings (Martinovich 2009).
These network changes were planned through a consultative process that ran in tandem with the
construction of the rail line. The result has been wide community support and substantial increases in
patronage for both city and cross-suburban trips.
Examples of successful network restructurings of all-bus systems are less common. It is often
tempting to use the capacity of new facilities, such as busways, to add additional direct services. The
busway network in Brisbane provides a current example of this: in each corridor, dozens of low-
frequency (half-hourly to hourly) routes run directly from suburban areas to the city centre. Overall
patronage carried on the busways is not spectacular by international standards, and the service pattern
leads to low occupancies, high subsidies, and confusion and congestion at busway stations. The most
successful busway systems – such as those in Ottawa (Canada), Curitiba (Brazil) and Bogota (Columbia)
– use larger vehicles for trunk services, and operate like a rail service.
A relatively recent example of a successful all-bus network restructuring is provided by the express
trunk bus services in Vancouver. First introduced in 1996, these bus rapid-transit services, branded as
B-Line, featured fewer stops and upgraded boarding and interchange facilities. They were provided
along heavily trafficked corridors that were ultimately intended for conversion to light rail. The
operating costs saved by the restructuring were redeployed to improve service levels on local routes.
23You can also read