Recommendations for Green and Healthy Sustainable Transport - "Building Forward Better" - Draft of 20 January 2021 - THE PEP
←
→
Page content transcription
If your browser does not render page correctly, please read the page content below

Draft of 20 January 2021

Preparatory meeting to the Fifth High-level Meeting on Transport, Health and Environment
25 January 2021

       Recommendations for Green and
       Healthy Sustainable Transport –
                  “Building Forward Better”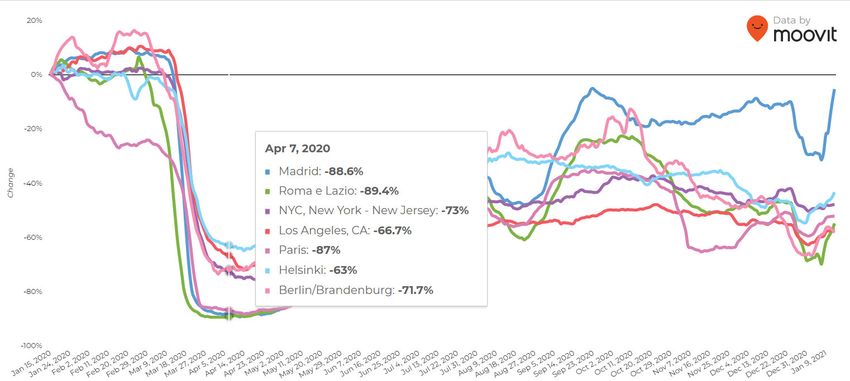
Acknowledgements

The Recommendations for Green and Healthy Sustainable Transport – “Building Forward Better”
have been developed thanks to the hard work of the Task Force members between April 2020 and
February 2021. All experts from around the world dedicated significant amount of their time to
discussing, analysis and identifying the challenges and outcomes of the COVID-19 pandemic on
the transport sector. Their deliberations led to the formulation of the recommendations proposed
within this document.

The Transport, Health and Environment Steering Committee would like to thank the following Task
Force members for their commitment to the completion of this document:

INSERT NAMES
Contents
Chapter 1: Introduction ..................................................................................................... 4
  1.1 Background ............................................................................................................. 4
  1.2 Current situation of the transport sector and outlook ..................................................... 5
     The transport sector pre-2020 ....................................................................................... 5
     Impacts of transport on environment and health .............................................................. 6
     The impact of COVID-19 on transport ............................................................................. 9
     Air pollution during COVID-19 restrictions ..................................................................... 13
Chapter 2: Actions for green and healthy sustainable transport ............................................. 15
  2.1 A new future for transport – a call for action ............................................................... 15
  2.2 The development of key recommendations ................................................................. 16
  2.3: Theme 1 .............................................................................................................. 18
  “Consideration of public space allocation for all modes of movement in the urban, peri-urban and
  rural environments with emphasis on the opportunities offered through spatial planning and
  infrastructure investment.” ............................................................................................ 18
  2.4: Theme 2 .............................................................................................................. 25
  “Increasing investment in public transport to meet current and future needs as well as to ensure
  that it is safe (and attractive to use) for users and workers.” .............................................. 25
  2.5 Theme 3................................................................................................................ 31
  “Encourage the adoption of e-mobility solutions as a fundamental part of powering public
  transport and active mobility.” ....................................................................................... 31
  2.6: Theme 4 .............................................................................................................. 36
  “Introduce mobility management solutions to manage transport demand in an environment-
  friendly and healthy way taking into account the user-perspective/raising awareness of transport
  users, to facilitate the switch to greener modes of transport and to make the transport system
  more efficient in the urban, suburban and rural environment.”............................................ 36
  2.5: Theme 5 .............................................................................................................. 41
  “Facilitate the adoption of innovation and technology in transport to increase accessibility and
  safety and to reduce emissions and environmental impacts leading to increased health benefits.”
  ................................................................................................................................. 41
  2.6: Theme 6 .............................................................................................................. 43
  “Supporting active mobility as a sustainable and healthy mode of transport. “....................... 43
  2.7: Theme 7 .............................................................................................................. 47
  “Rebuilding the transport system in a fair and inclusive way while avoiding social disparities and
  particularly taking into account the needs of vulnerable and disadvantaged groups in society.
  Take into account the social dimension of pandemics as well as the need for a just transition
  towards a green and healthy transport system” ................................................................ 47
Chapter 3: Key recommendations ..................................................................................... 51
Chapter 4: Next steps ..................................................................................................... 56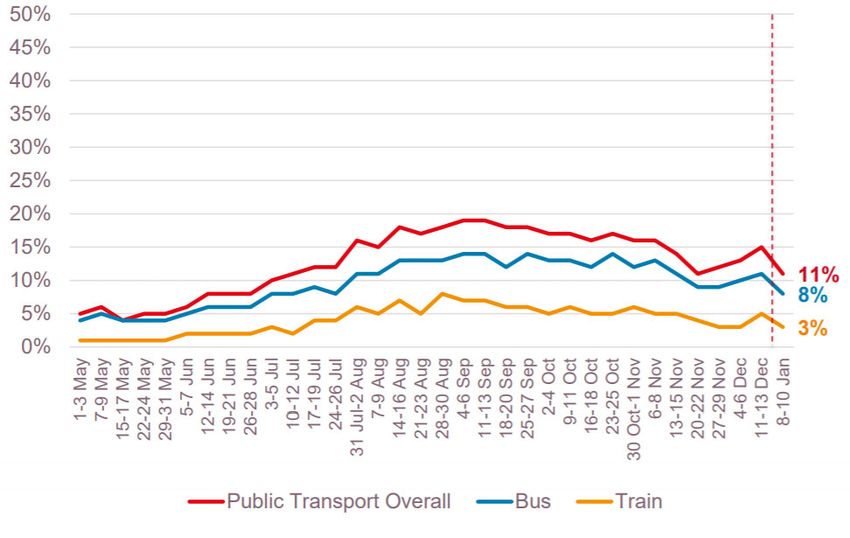
Chapter 1: Introduction
1.1 Background
The Pan‐European region has been at the forefront in the development of sustainable mobility
solutions focusing on health, environment and prosperity. The Transport, Health and Environment
Pan‐European Programme (THE PEP), firstly brings the countries of the region together, secondly
unites three core sectors of the economy – transport, health and environment ‐ and thirdly provides
countries with the opportunity to share best practice and develop new policies. It therefore provides
the platform for accelerating transformation in the transport sector and makes this transformation
irreversible. The recommendations developed by the Task Force will allow member States to lock in
sustainable transport solutions for the future given the changes to the sector brought on by the
COVID‐19 pandemic.

At the meeting of Bureau of the Steering Committee of THE PEP in April 2020, member States
discussed the COVID‐19 situation and the impact that it was having on transport, environment and
health in their countries and the need to take action. Participants agreed to establish a THE PEP Task
Force on: “The Development of Green and Healthy Sustainable Transport Recommendations” to
facilitate the transition to a new normal with sustainable and healthy transport solutions at the
heart of decision making and “building forward better”.

The objective of the Task Force was to make a synthesis of the “main lessons” learned from the
Covid‐19 crisis and to propose a set of recommendations in order to support countries in making the
change to green and healthy sustainable transport: A transition in line with the goals of THE PEP1,
the Vienna Declaration of the Fifth High‐Level Meeting of the Ministers of Transport, Health and
Environment, the Sustainable Development Agenda and the Paris Climate Agreement2 to name the
key ones.

The Task Force was composed of over 50 experts from national Ministries, International
Organizations, City Authorities, Inter‐governmental and non‐governmental organizations, Academia
and industry experts. The Task Force was chaired by the Chair of THE PEP Steering Committee, Mr.
Robert Thaler – Austria.

The Task Force met virtually over 8 monthly meetings and, based on an agreed term of reference:

      -    exchanged experiences and best practice from national actions to counter the effects of
           COVID‐19.
      -    established a framework under which the Task Force would function.
      -    developed common views on what the key themes for discussion in the recommendations
           should be.
      -    agreed a set of recommendations for the final document.

During this period, smaller, parallel drafting groups were set up to develop text for the key themes
identified by the Task Force as being fundamental to the development of the Recommendations.

The first draft of the Recommendations was discussed at the Steering Committee meeting of THE
PEP in November 2020 and, following further consultations, was finalized in January 2021. The
recommendations identified in Chapter 3 below were then included in the Vienna Declaration to be
signed at the Fifth High‐Level Meeting of the Ministers of THE PEP in May 2021.

1
    THE PEP From Paris 2014 to Vienna 2019: https://thepep.unece.org/node/87
2
    https://unfccc.int/process‐and‐meetings/the‐paris‐agreement/the‐paris‐agreement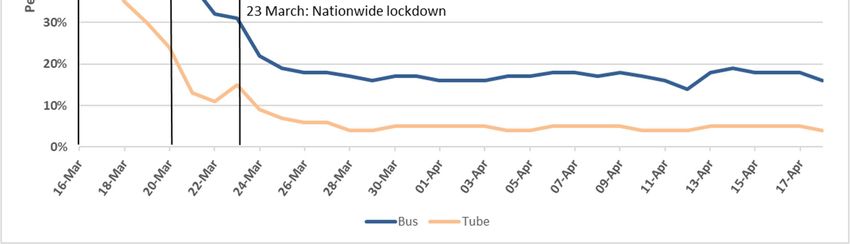
The remainder of this first chapter provides an overview of the current situation of the transport
sector looking at the pre COVID‐19 situation as well as the transport effects during the first
lockdowns and the plans for the reopening phases. Chapter 2 opens with a call for action for the
future and describes the main themes that have been identified as key areas for recommendations.
Chapter 3 sets out the conclusions and recommendations for member States. Chapter 4 sets out the
next steps for this work following the adoption of the Recommendations.

1.2 Current situation of the transport sector and outlook
The transport sector pre‐2020
The car remains the main mode of transport across the region. According to Eurostat, in relation to
EU‐28 member States, the market share of passenger road vehicle transport in relation to all
passenger transport has increased from 82.5 per cent in 2000 to 83.3 per cent in 2018. In
comparison, railways had a market share of 8.0 per cent in 2018, compared to 7.1 per cent in 2000
and motor coaches, trolley‐buses and buses a share of 8.7 per cent down from 10.4 per cent in 2000.
The share of passenger road vehicles is usually lower when looking at cities only, but still remains the
highest mode in terms of share in most cases.

The same is also true across the wider UNECE region where the car remains the main mode of
vehicle3 transport. Using UNECE data4, passenger road vehicle transport market share decreased
from 93 per cent in 2000 to 89 per cent in 20185. In comparison, railways increased from 1.6 per
cent in 2000 to 2.3 per cent in 2018, and motor coaches, trolley‐buses and buses from 5 per cent to
8 per cent.

According to a Eurobarometer6 study from 2014, 8 per cent of respondents said that cycling was
their most often used mode of transport on a typical day. Countries also report their own data,
however, methodologies to collect data can vary between countries, making data less comparable.
Recent national data shows that there can be significant differences between individual countries.
For example, at the higher end, in 2016 the modal share of cycling was 27 per cent in the
Netherlands7 and in 2017 Germany8 reported a share of 11 per cent. At the lower end, in Portugal9 in
2016 the modal share of cycling was only 1 per cent, in Slovakia10 in 2017, 2 per cent, the same as in
the United Kingdom11 in 2018. Although these numbers appear low, city‐level data shows that many
cities have seen large growth in cycling in recent years.

The mode distribution of the freight sector is different with rail having a significantly higher share
compared to passenger transport in many countries across the region, but as a whole, the road
sector remains dominant. This is even more pronounced in urban environments and other
settlements where rail and other non‐road goods deliveries are extremely limited.

3
  Data used here includes passenger cars, motorcycles, busses, trolleybuses and motor coaches, and rail
4
  A selection of 13 countries based on data availability.
5
  Or latest available year.
6
  https://ec.europa.eu/commfrontoffice/publicopinion/archives/ebs/ebs_422a_en.pdf
7
  https://www.government.nl/binaries/government/documents/reports/2018/04/01/
cycling‐facts‐2018/Cycling+facts+2018.pdf
8
  https://www.bmvi.de/SharedDocs/DE/Anlage/G/mid‐analysen‐rad‐fussverkehr‐bilder.pdf?__blob=publicationFile
9
  https://cyclingindustry.news/portugals‐answer‐to‐upping‐cyclings‐modal‐share‐start‐with‐the‐students/
10
   https://www.cyclurban.eu/countries/slovakia/#:~:text=In%
20Slovakia%2C%20cycling%20has%20a,10%25%20cycling%20share%20by%202020.
11
   https://assets.publishing.service.gov.uk/government/uploads/system/uploads/
attachment_data/file/821842/walking‐and‐cycling‐statistics‐2018‐accessible.pdf
Impacts of transport on environment and health
Transport, and in particular road transport, has a negative effect on the environment and health.
This is exemplified by air and noise pollution, injuries, illnesses and deaths caused by poor road
safety, congestion and poor urban and spatial planning, which, in turn, is exasperated by physical
inactivity that results from using transport modes on a daily basis.

In addition, in June 2019 the European Commission has revised their calculations of the societal and
environmental impacts of transport12 . The total external environmental costs of transport (linked to
greenhouse gas emissions, local air pollution, noise, energy production, habitat damage), as well as
the costs of congestion and crashes sum up in the EU to almost €1 trillion annually, with urban share
estimated to be at least 50%. Road transport causes more than 80% of such external costs
(approximately € 620 billion caused by passengers and € 200 billion by freight), including road crash
costs (some € 280 billion), congestion costs (some € 270 billion) and environmental costs (some €
270 billion).

This is a very substantial increase in relation to calculations included in the 2013 Impact Assessment,
where total external costs of transport were estimated at € 420 billion annually, with urban share
estimated at € 230 billion.

To ensure good quality of life in cities and to make them more accessible, clean and competitive, a
modal shift towards sustainable modes of transport and public transport is necessary. Increasing car
traffic in cities and metropolitan areas leads to rising external costs relating to air pollution and lost
time, which consequently also negatively effects work‐life balance.

Air pollution is a major health threat in Europe causing premature deaths and disease and transport
is a major cause of this. Although, air pollution from transport has been steadily declining in the
European Union in the past decades (see figure 1), it still remains a concern. According to data from
the European Environment Agency13 (EEA), inland transport (passenger and freight) is one of the
largest contributors to greenhouse gas emissions, responsible for about 22 per cent of all emissions
in the EU, in 2017, with the road transport sector covering more than two‐thirds of that. Coupled
with this, the road sector remains one of the biggest sources of polluting emissions including NOx
(15 per cent) and 8 per cent for PM2.5 emissions (the fourth largest polluter), but also of non‐
exhaust related pollutants from brake, tyre and road wear.

12
   https://ec.europa.eu/transport/themes/sustainable/internalisation‐transport‐external‐costs_en
13Healthy environment, healthy lives: how the environment influences health and well‐being in Europe; as; Luxembourg
2020
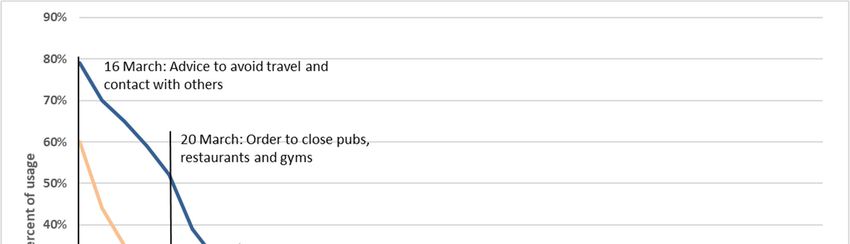
Figure 1: Pollutant emissions from transport (composite index of nitrogen oxides (NOx), non‐
methane volatile organic compounds (NMVOCs) and particulate matter (PM10)) in EU‐28, 1990‐
2017, (index 2000=100)

Source: Eurostat14

The EEA also estimates that, annually, 400,000 premature deaths in Europe are attributable to air
pollution15. During the period 2016‐2018, a significant proportion of the EU urban population was
exposed to key air pollutants above EU limit or target values and above the WHO health‐based
guidance values as set out in figure 2 below.

14
     https://ec.europa.eu/eurostat/databrowser/view/t2020_rk300/default/table?lang=en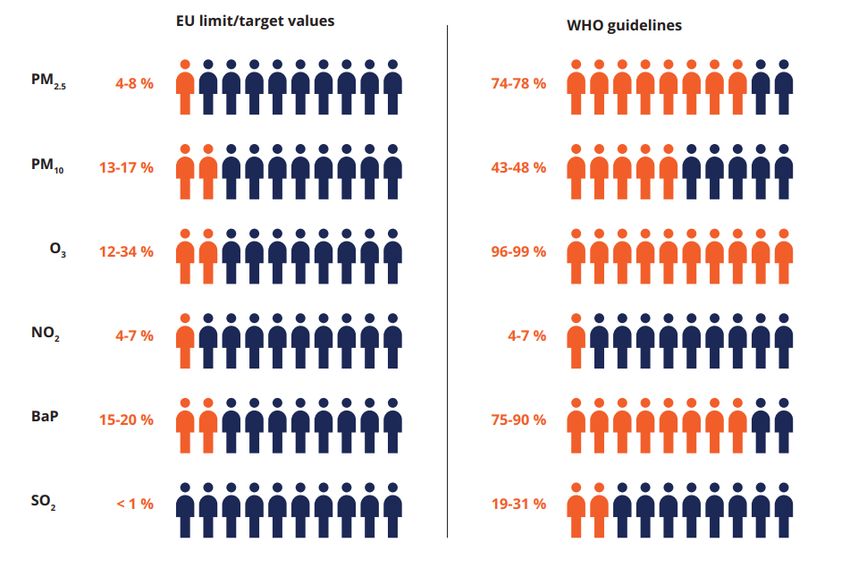
Figure 2: Percentage of the EU urban population exposed to air pollution concentrations above EU
and WHO reference values during the period 2016‐2018

Source: EEA.
Note: Particulate matter with a diameter of 2.5 µm or less (PM2.5), particulate matter with a diameter of
10 µm or less (PM10), ozone (O3), nitrogen dioxide (NO2), benzo[a]pyrene (BaP) and sulphur dioxide (SO2)

Maintaining a high level of road safety is one of the main challenges within the region. Significant
progress has been made in reducing the number of deaths and injuries as set out in Figure 3 below,
however the numbers still remain too high. While the number of road deaths has been steadily
decreasing on some types of roads (motorways) and for some types of road users (car drivers and
passengers), the reductions have been much less marked for vulnerable road users16. Moreover. In
the United States, mortality of pedestrians increased by 50% in the last decade17.
Moreover, there isCoupled with this is the problem of increased congestion. Rankings of cities made
by some international companies for 2019, based on mobile phone and GPS data, shows that
congestion levels in Europe decreased only in 30 cities out of 239 cities listed compared to
2018.9According to INRIX18 in the ten most congested cities in Europe, average traffic speed varied
from 12.9 km/h in Palermo to 24 km/h in Moscow. A similar ranking compiled by TomTom19 for 2019
shows that congestion levels in Europe decreased only in 30 cities out of 239 cities listed compared
to 2018.

16
   https://etsc.eu/safer‐roads‐safer‐cities‐how‐to‐improve‐urban‐road‐safety‐in‐the‐eu‐pin‐flash‐37/
17
   https://etsc.eu/safer‐roads‐safer‐cities‐how‐to‐improve‐urban‐road‐safety‐in‐the‐eu‐pin‐flash‐37/
18
   INRIX 2019 Scorecard: https://inrix.com/scorecard/? and TomTom Traffic Index Ranking 2019:
https://www.tomtom.com/en_gb/traffic‐
index/ranking/?country=AT,BE,BG,CZ,DK,EE,FI,FR,DE,GR,HU,IS,IE,IT,LV,LT,LU,NL,NO,PL,PT,RO,RU,SK,SI,ES,SE,CH,TR,UA,UK
Figure 3: Deaths and injuries per 100 000 passenger cars, UNECE region, 2009‐2018
1800 40000
1600 35000
1400
30000
Road traffic fatalities
Road traffic injuries
1200
25000
1000
20000
800
15000
600
10000
400
200 5000
0 0
2009 2010 2011 2012 2013 2014 2015 2016 2017 2018
Killed Injured
Source: UNECE Statistical Database, Note: Only partial data available for 2018
As a result of the increased use of motorised vehicles on a regular basis across the region, the urban
population tends to do less physical activity. According to the WHO,20 the lack of physical activity is
one of the leading risk factors for noncommunicable diseases mortality. People who are
insufficiently active have a 20 per cent to 30 per cent increased risk of death compared to people
who are sufficiently active.
Globally, 28 per cent of adults aged 18 and over were not active enough in 2016 (men 23 per cent
and women 32 per cent). This means they do not meet the global recommendations of at least 150
minutes of moderate‐intensity, or 75 minutes vigorous‐intensity physical activity per week. In high‐
income countries, 26 per cent of men and 35 per cent of women were insufficiently physically active,
as compared to 12 per cent of men and 24 per cent of women in low‐income countries. Low or
decreasing physical activity levels often correspond with a high or rising gross national product.21
The information provided in this section shows that, at the start of 2020, the transport sector still
had a long way to go before it can be identified as being green and healthy. THE PEP has been
working on a number of initiatives aimed at improving this sustainability through the
implementation of actions necessary to achieve its five priority goals. This has come primarily
through the main activities of the Steering Committee and through a number of partnerships
including on cycling, the Transdanube, green jobs, eco driving, the integration of environment and
health issues in urban and transport planning as well as other related activities such as on managed
mobility.
The impact of COVID‐19 on transport
In the framework of the information provided above, in the spring of 2020 the first wave of the
COVID‐19 pandemic triggered a drastic response in countries around the world, with many cities
20
Physical activity Factsheet, WHO, 26/11/2020, https://www.who.int/news‐room/fact‐sheets/detail/physical‐activity
21
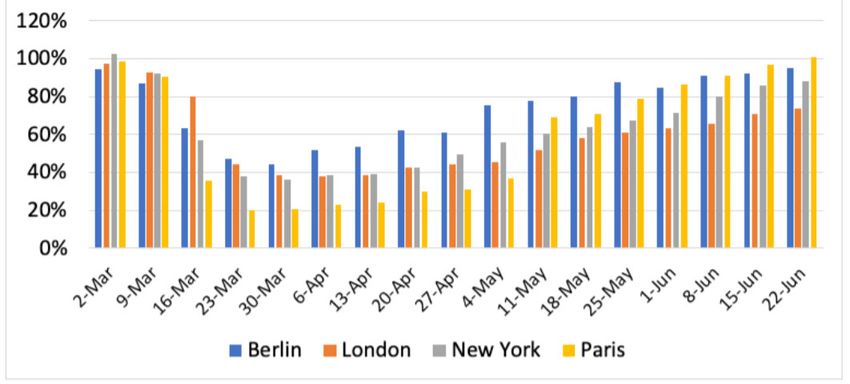
Ibid.going into complete lockdown. This imposed restrictions on people’s movement directly impacting traffic and the use of all forms of transport. GPS22 and traffic volume data23 show that in many normally congested cities, traffic levels dropped 70‐80 per cent, in some cities even as much as over 95 per cent, during the first lockdown phase. For example, the decline in vehicle miles travelled (VTM) between 2 March and 22 June 2020 in Berlin, London, New York and Paris ranged from above 40 per cent to 20 per cent compared to pre‐COVID levels (Figure 4). Of these, Paris was the hardest hit, but traffic there also recovered fast after restrictions were lifted in May. In the other cities, traffic levels remained higher throughout the period, but recovery was slower. Figure 4: Weekly vehicle miles travelled in Berlin, London, New York and Paris, as a percentage of pre‐COVID‐19 level (2 March to 22 June 2020) Source: Traffic technology today24 The freight transport sector was not immune to the effects of the first wave of COVID‐19. According to Sixfold25, a freight tracking company, truck traffic declined more than 50 per cent in Spain, 46 per cent in France and 37 per cent in Italy due to lockdowns. In April 2020, Transport Intelligence26 estimated that the road freight market in Europe could decline as much as 17 pe cent in 2020 and even in the most optimistic scenario almost 5 per cent. The International Transport Forum (ITF)27 estimates the decline in freight transport to be even larger. In Europe, the reduction in inter‐urban freight activity is projected to be about 40 per cent. However, the decline in urban freight activity in Europe is estimated to be much less than this, around 12‐14 per cent, due to growth in online shopping and associated deliveries. Similar impacts were reported on public transport. A mobility‐as‐a‐service company, Moovit, tracks the usage of public transport in cities around the world. Their Public Transit Index shows a considerable fall in public transport use during the first wave of the COVID‐19 pandemic, which has later fluctuated at a lower‐than‐normal level in many cities (see figure 5) also into 2021. 22 https://www.tomtom.com/blog/moving‐world/covid‐19‐traffic/ Field Code Changed 23 https://360.here.com/covid‐19‐impact‐traffic‐congestion 24 https://www.traffictechnologytoday.com/news/covid‐19‐news/feature‐inrix‐assesses‐the‐impact‐of‐covid‐19‐on‐uk‐ Field Code Changed and‐european‐traffic.html Field Code Changed 25 https://sixfold.com/news/effects‐of‐covid‐19‐on‐europe‐s‐road‐freight‐market 26 Field Code Changed https://www.ti‐insight.com/whitepapers/european‐road‐freight‐market‐sizing‐2020‐covid‐19‐impact‐analysis‐2/ 27 https://www.itf‐oecd.org/sites/default/files/global‐freight‐covid‐19.pdf Field Code Changed
Figure 5: Use of public transport in selected cities 15 January 2020 – 9 January 2021

Source: Moovit28

Based on public transport data from London, the lockdown measures taken to respond to the first
wave of the pandemic were reflected in bus and metro (Tube) usage, which fell to only about 15 and
5 per cent, respectively, from the end of March 2020 (see figure 6).

Figure 6: Use of bus and tube in London, 16 March‐17 April 2020

Source:GOV.uk29

28
   https://moovitapp.com/insights/en/Moovit_Insights_Public_Transit_Index‐countries                               Field Code Changed
29
   https://www.gov.uk/government/publications/slides‐and‐datasets‐to‐accompany‐coronavirus‐press‐conference‐22‐
april‐2020                                                                                                        Field Code Changed
Similar evidence on the impact of lockdowns during the first wave of COVID‐19 has been gathered in
other cities. Research30 on the impact of COVID‐19 on transport in Budapest shows that the demand
for transport halved during the spring 2020 lockdown, with public transportation experiencing an 80
per cent decline in demand. There was also a significant shift in transport modes: the use of private
cars grew from 43 per cent to 65 per cent compared to a 2018 baseline. Similarly, the share of public
transport decreased from 43 per cent to 18 per cent.

During the pandemic many people have shied away from using public transport in fear of contracting
the COVID disease. Some of these passengers have shifted to using a private car as a result of
national authorities discouraging the use of public transport, but in many areas, there is evidence of
growing enthusiasm for cycling. Several cities have responded positively to the increase in cycling by
improving infrastructure, although in some cases solutions have been temporary. The European
Cyclist Federation31 follows measures taken by authorities to promote or facilitate cycling in cities.
To date, over 2000 km of infrastructural measures have been announced, of which about 1000 km
have been implemented.

A study32 looking at different transport scenarios after the first COVID‐19 lockdown in Italy estimates
the social costs and benefits of different policy choices. Under the assumption that there are no
policy interventions, in the most optimistic scenario after the lockdown the modal split between
private cars and public transport is assumed to be 50‐50. In this case, car‐related social costs and
congestion costs are estimated to be about 11 billion euros annually. In a worst‐case scenario, where
all public transport users switch to cars, similar costs would rise to 21 billion euros. These costs
would arise from increased congestion, longer journey times, and increased risk of road crashes. The
study compares the “no policy intervention” scenario to a situation where walking and cycling are
encouraged. In this case, the assumption is that a portion of car journeys are instead done by foot or
bicycle. In the best case scenario, where public transport would capture 33 per cent of users and of
the remaining journeys 38 per cent would be made by car, 50 per cent by cycling or e‐cycling and 12
per cent by foot, the study estimates net benefits of 20 billion euros per year. The benefits arise
mainly from increased life expectancy, increased productivity and lower health care costs. The
authors conclude that there is a strong basis for investing in and promoting walking and cycling in
cities.

According to a weekly survey conducted in the United Kingdom since May 2020, after a slight
recovery during the summer, the use of public transport declined again in the autumn of 2020
during the second wave of COVID‐19 (Figure 7). Road use has, after an increase in the summer,
stayed relatively stable with around 60 per cent of those surveyed saying that they have driven a car
or a van in the last seven days. The decline in the use of public transport has not translated into a
higher proportion of people walking or biking either. According to the survey, the proportion of
cyclists has stayed between 5‐10 per cent throughout the period. During the last quarter of 2020,
the proportion of journeys made on foot has fluctuated around 40 per cent, down from a high of 50
per cent in September. Since mid‐December 2020, the use of public transport has shown signs of
falling again, following new lockdown measures introduced due to the worsening of the pandemic.

30
   Peter Bucsky, “Modal share changes due to COVID‐19: The case of Budapest”, Transportation Research Interdisciplinary
Perspectives, June 2020, https://www.ncbi.nlm.nih.gov/pmc/articles/PMC7290209/
31
   https://ecf.com/dashboard
32
   Decisio, “Social costs and benefits of post COVID‐19 lockdown mobility scenarios in Italy”, August 2020
Figure 7: Use of public transport in the United Kingdom, 1‐3 May 2020 to 8‐10 January 2021

Source: Transport Focus33

By actively discouraging public transport use many national and local authorities have sent negative
signals on the long‐term sustainability of the transport sector. There is the risk that the needed
short‐term measures introduced to limit the spread of the virus (there is currently no evidence to
show that public transport is a vector for the virus34) could have long‐term impacts on the use of
public transport and its perceived risk.

Air pollution during COVID‐19 restrictions
Data shows that the stark declines in transport during lockdowns positively contributed to air
quality, with NO2 levels dropping in many countries. Menut and others (2020)35 show that the
lockdown measures in the United Kingdom, the Netherlands, Germany, Spain, France and Italy
resulted in a reduction of NO2 concentrations between 20 to 50 per cent. Slightly smaller declines
were visible for PM2.5 and there was almost no change in O3 levels. This decline was of course
accompanied by a general decline in economic activity, the resulting temporary closure of factories
and the consequential fall in mobility.

Indeed, in several European cities NO2 levels halved as a result of the first set of lockdowns (see
table 1). However, data collected by CREA shows that pollution levels returned to previous levels
after lockdown measures were lifted. Cities with the largest reductions in pollution levels also saw

33
   https://d3cez36w5wymxj.cloudfront.net/wp‐content/uploads/2021/01/14174435/Travel‐during‐Covid‐19‐survey‐15‐
January‐2021.pdf
34
   Studies carried out by the University of Southampton: https://www.southampton.ac.uk/news/2020/07/train‐
transmission.page and by Deutsche Bahn: https://www.railtech.com/coronavirus/2020/09/17/research‐deutsche‐bahn‐no‐
increased‐risk‐corona‐infection‐train‐personnel/?gdpr=accept
35
   Laurent Menut and others, “Impact of lockdown measures to combat Covid‐19 on air quality over western Europe”,
Science of the Total Environment, vol. 741, June 2020
https://reader.elsevier.com/reader/sd/pii/S0048969720339486?token=5953F8F81AAF3F8469894F53C64F1C0F8B07092AC
439D6290731AAF8B45E1D15B14CE0FACBDDE177449C29A0B4C9C99A
the larges rebounds, indicating that in these cities policies targeting transport related emissions
could lead to the largest improvements in air quality, CREA concludes.

Table 1: Reduction in NO2 levels in selected European cities due to COVID‐19 lockdown measures

 City            Reduction %      City            Reduction %
 Bucharest        65      London             33
 Paris            60      Copenhagen         42
 Lisbon           44      Bern               37
 Milan            47      Oslo               34
 Zagreb           54      Munich             22
 Brussels         49      Prague             29
 Madrid           49      Ljubljana          31
 Warsaw           35      Vienna             23
 Moscow           35      Hamburg            20
 Athens           32      Budapest           16
 Barcelona        43      Berlin             18
 Helsinki         47
Source: CREA36, Moscow data from the Department of Natural Resources Use and the Environment
Protection of Moscow Government

While a fall in air pollution is welcome, the fact that it occurred with this background cannot be seen
as good news given the economic hardships that ensued and also as it is likely to only be temporary.

36
     https://energyandcleanair.org/wp/wp‐content/uploads/2020/06/202006‐Europe‐Rebound‐4.pdf
Chapter 2: Actions for green and healthy sustainable transport
2.1 A new future for transport – a call for action
It is difficult to say how transport and mobility will evolve in future based on the information
provided in the section above. What is clear is that transport and mobility as we know it today is not
sustainable. Traffic is the cause of several environmental, economic, social and health challenges.
Moreover, under the influence of global increase of population and welfare, the demand for
transport will continue to grow. Public transport is fundamental to urban and inter‐urban transport
but in many areas it is not as competitive as the private car. Some parts of the region are starting to
embrace active mobility solutions, but this is still in its infancy across many countries. This makes
transforming the transport and mobility for the better around public transport and active mobility
fundamental for a better future.
The COVID‐19 pandemic has done untold damage to the economies of the region and has
exasperated social inequality by increasing the socioeconomic divide and the gender gap in many
countries with low‐wage and part‐time employees particularly affected. It has also created some
short‐term benefits in terms of reduced air and noise pollution and increased attention to promoting
and providing for active mobility solutions. Furthermore, as traffic has fallen road deaths have fallen
too (although in no way in a proportional manner). However, it is also true that people have been
encouraged to get back into their cars for their commute as the common perception, often fuelled
by advice from official sources, has been that public transport was less safe. This has yet to be
proved but is creating the need for increased investment in public transport to match new
requirements.
These positive and negative outcomes provide the international community with a springboard to
take action to facilitate the achievements of the Sustainable Development Goals37 and the Paris
Climate Agreement38. We must move beyond business‐as‐usual and work together to build forward
(not back) a cleaner, healthier and more prosperous system to meet mobility and freight transport
needs, focusing on creating a more sustainable future for the sector, in which accessibility,
efficiency, environment, safety and security are given an equal footing. This evolution needs to
consider the direct impacts of the COVID‐19 pandemic, but also demographic changes caused by an
aging population and resilience towards future pandemics or similar national and international
disasters.
This aim needs to be embraced by governments, city planners and citizens alike by integrating
transport planning and spatial planning, noting the central role of public transport, understanding
the key role that new technologies can have in sustainable mobility and incentivizing healthy and
environmentally aware consumer choices. Implementing actions need to induce behavioural change
by providing users with the capability, the opportunity and the motivation to change their transport
habits. This approach to rethinking and reorganising the transport sector, offers economies a smart
recovery and creates opportunities for green investments, reducing inequalities, whilst recognizing
that the (zero emission) private car will still have a role, albeit significantly reduced, in the transport
mix within member States.
A new approach offers opportunities and possibilities. It is important, therefore, to face the
challenges together, by developing a common set of recommendations that can deal with the
37
https://sdgs.un.org/goals
38
https://unfccc.int/process‐and‐meetings/the‐paris‐agreement/the‐paris‐agreementcurrent situation and stand the test of time to facilitate the transition to more sustainable transport
and mobility.
The Task Force recognizes that this will not be easy to achieve as the themes and solutions that have
been identified below will need considerable time, effort and resources for successful
implementation. Although it is also true that some quick wins can be garnered from some of the
proposed policy actions. The recommendations provided below should be seen as a framework for
action as there is never a “one size fits all” solution and good governance and patience,
accompanied by tailored language and approaches as well as the involvement of the sectors as a
whole will be fundamental in achieving success.
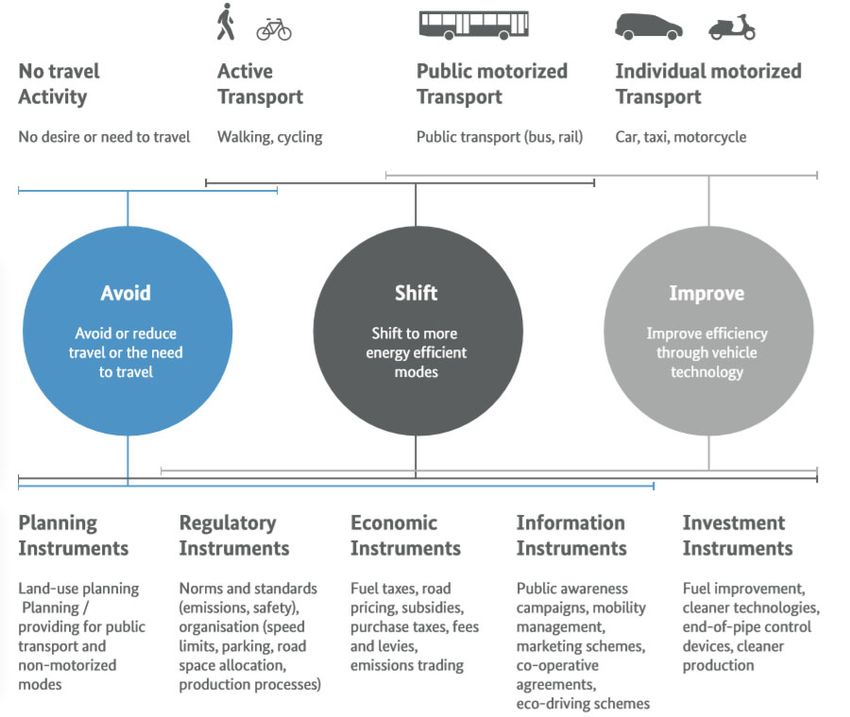
2.2 The development of key recommendations
In order to develop a concrete set of recommendations the Task Force agreed on the development
of a key set of themes where a strong focus was placed on ensuring that the principle of “Avoid, Shift
and Improve” (A‐S‐I) remains at the centre of actions to be taken. It seeks to achieve significant
greenhouse gas (GHG) emission reductions, reduced energy consumption and less congestion.
Initially developed in the early 1990s in Germany, it is now considered as the ‘gold standard’ on how
Governments can define policy initiatives to minimize the environmental impact of transport leading
to an improvement in the living standards of citizens. Inspired by the principles of sustainability, the
approach focuses on the mobility needs of people instead of car infrastructure and can best be
summarized in the figure below. 39
Figure 8: Avoid‐Shift‐Improve instruments
Source : TUMI 2019
39
https://www.transformative‐mobility.org/assets/publications/ASI_TUMI_SUTP_iNUA_No‐9_April‐2019.pdfThis principle has been applied throughout this document in a wholistic manner, taking into
consideration the interaction of the three sectors of THE PEP, whilst at the same time recognizing
that the transport and mobility sector needs to evolve beyond established practices and policies.
Based on this, and on discussions within the Task Force the following macro themes were agreed on
as a basis for the recommendations:
1. Theme 1: Consideration of public space allocation for all modes of movement in the urban,
peri‐urban and rural environments with emphasis on the opportunities offered through
spatial planning and infrastructure investment.
2. Theme 2: Increasing investment in public transport to meet current and future needs as well
as to ensure that it is safe (and attractive to use) for users and workers.
3. Theme 3: Encourage the adoption of e‐mobility solutions as a fundamental part of powering
public transport and active mobility.
4. Theme 4: Introduce mobility management solutions to manage transport demand in an
environment‐friendly and healthy way taking into account the user‐perspective/raising
awareness of transport users, to facilitate the switch to greener modes of transport and to
make the transport system more efficient. A focus should also be on innovative solutions
such as sharing mobility, tele‐work/home‐office, green logistics and delivery and
environment‐friendly solutions for the “first and last mile” in the transport chain.
5. Theme 5: Facilitate the adoption of innovation and technology in transport to increase
accessibility and safety and to reduce emissions and environmental impacts leading to
increased health benefits.
6. Theme 6: Supporting active mobility as a sustainable and healthy mode of transport.
7. Theme 7: Rebuilding the transport system in a fair and inclusive way while avoiding social
disparities and particularly considering the needs of vulnerable and disadvantaged groups in
society. Take into account the social dimension of pandemics as well as the need for a just
transition towards a green and healthy transport system.
The challenges identified in each of these themes aim to reinforce positive actions that have taken
place during the pandemic but also to avoid a “lock‐in” situation of negative practices that have
evolved. In doing so, the recommendations seek to set challenging but achievable targets for
member States. Each theme is structured as follows:
Introduction
The issue at hand (with the inclusion of relevant examples)
Outcomes and conclusions (then summarised in the form of key recommendations in
Chapter 3)
The themes and related recommendations have been developed with the aim of going beyond what
has been the crux of activities within THE PEP in order to set the foundations for a transport sector
that can lead and shape the transformation of the urban and peri‐urban environment, also through
appropriate spatial planning and economic policies, rather than having to catch‐up as has been the
case in the past.2.3: Theme 1 “Consideration of public space allocation for all modes of movement in the urban, peri‐urban and rural environments with emphasis on the opportunities offered through spatial planning and infrastructure investment.” Introduction Theme 1 examines social, economic and environmental considerations, reviews the emerging importance of developing practices and explores their impact on mobility and on the communities these systems serve with particular emphasis on public space and spatial planning. Wherever possible, the work is illustrated with examples of best practice that highlight where the issue has been addressed successfully. The issue at hand What is the impetus for Green and Healthy Sustainable Transport? This Task Force title plainly implies more than a recognition of the interaction between transportation, health and the environment and underlines that the effectiveness and efficiency of transportation (from the point of view of the public authority, the operator and the user) between nodes cannot be an end in itself but rather must, of itself, be green, healthy and sustainable in respect of those that it serves. In other words, there is implied a higher purpose to enable mobility for people to access goods and services in a healthy, efficient, comfortable and environmentally friendly manner. That this is true has been clear for some time. In the midst of a global pandemic that shows little sign of abating until a vaccine can be found, this aim becomes an imperative.40 Nowhere is this imperative more clearly evident than in the need for balanced and well‐designed allocation of public space where the day‐to‐ day interactions of people’s lives are played out. Today it is recognised globally that physical activity is important for physical and mental health for all and therefore active travel for everyone becomes extremely important. The mobility systems provided to deliver access to goods and services need to be designed in a manner that encourages walking, cycling and wheeling41 with an emphasis on connectivity at the start and end of journeys and interchange along the route,42 and which help tackle urban congestion, the costs of which put a drag of several hundreds of billions of €s/$s on the world economy.43 Of equal importance is the recognition by most countries that decarbonisation must proceed hand‐in‐hand with this aspiration to deliver widely accessible active and eco‐friendly movement systems. There is a need therefore for an ambitious and imaginative aspiration or vision for transportation across the UNECE Region that, within the overarching context of the SDGs connects the issues of decarbonisation, physical activity, environmental consciousness and public health. 40 Ruffino, P. et.al. Social costs and benefits of post COVID‐19 lockdown mobility scenarios in Italy, Decisio, (English version August 2020) 41 Where wheeling refers to all other forms of wheeled personal transportation (excluding cars and motorbikes) 42 EEA, The first and last mile ‐ the key to sustainable urban transport, Transport and environment report 2019, 2019 43 https://ec.europa.eu/transport/themes/sustainable/internalisation‐transport‐external‐costs_en
The first step in achieving this aim is to realise that all these objectives are inter‐related and action in
pursuit of their achievement requires to be integrated. It can no longer be the case that programme
for decarbonisation, health, and mobility can be seen and addressed as separate matters.

 As Higgs remarks in his recent book ‘if we are to build the city of the future, it follows that we must
first of all imagine it’.44 Imagining and delivering such interconnection and integration cannot be
achieved only by analysis and quantification, it requires design solutions that places people and their
needs at the heart of the process. This means understanding not only the principles of engineering
and physical design of artefacts, it also demands that we must master the opportunities presented
by both service design (people‐centred service design is the activity of planning and organising
people, infrastructure, communication and material components of a service in order to improve its
quality and the interaction between the service provider and its customers and their quality of life)45
and universal design (the design and composition of an environment so that it can be accessed,
understood and used to the greatest extent possible by all people regardless of their age, size,
gender, ability or disability).46 The allocation of public space should be designed to meet the needs of
all people who wish to use it, for example through the implementation of such initiatives as the
“super‐blocks” in Barcelona. While quick solutions of converting road space to cycle lanes can
provide benefits it is also important to consider longer term planning where a better solution may be
to create routes for cyclists through other public spaces.

Good examples include The Mayor of London Transport Strategy ‐ adopted in 2018 – which revolves
around the Healthy Street Approach. This approach uses ten evidence‐based indicators of what
makes streets attractive places. Working towards these indicators will help to create a healthier city,
in which all people are included and can live well, and where inequalities are reduced.47 The
overarching goal of the Mayor's Transport Strategy is that by 2041:

–    80 per cent of journeys are to be made by walking, cycling and public transport
–    All Londoners get 2 x 10 minutes of active travel each day
–    70 per cent of Londoners will live within 400 metres of the London‐wide cycle network

The strategy puts public health at the heart of city planning processes, highlighting the link between
free movement of people, environmental benefit and public health in every measure undertaken.

The Ghent circulation plan adopted in April 2017 is another great example of people centric urban
planning.48 The ultimate goal of the Circulation Plan is to unburden the city centre of car traffic,
while improving the liveability of the city for citizens and visitors and guaranteeing accessibility for
pedestrians, cyclists, busses and trams. To prevent cars from needlessly crossing the city centre, the
Circulation Plan divides the city into six sectors and one extensive car‐free/pedestrian zone, whoever
wants to move from one sector to the other, needs to make use of the inner city ring, therefore
freeing up a lot of space within the sectors, space that has been reallocated to public transport,

44
   Higgs, J. The Future Starts Here: Adventures in the 21st Century, Weidenfield & Nicolson, London, 2019
45
   See for example: Stickdorn, M. & Hormess, M. This is Service Design Doing: Using Research and Customer Journey Maps
to Create Successful Services: Applying Service Design Thinking in the Real World, 2016 and Down, L. Good Services: How to
Design Services that Work, BIS Publishers, Amsterdam, 2020
46 The term universal design was coined by the architect Ronald Mace to describe the concept of designing all products

and the built environment to be aesthetic and usable to the greatest extent possible by everyone, regardless of their
abilities. See for example: Steinfeld, E. & Maisel, J Universal Design: Creating Inclusive Environments, 2012
47
   Healthy Streets for London: http://content.tfl.gov.uk/healthy‐streets‐for‐london.pdf
48
   Ghent circulation plan aims to make the city car‐free, see video at: https://vimeo.com/379854529
cycling and walking. Thanks to the Circulation Plan, also cars that absolutely need to be in the city
centre ‐ such as suppliers, health care providers or elderly people ‐ can reach their destination faster.
One of the most inspiring aspects of the Ghent work is that very little new infrastructure was
necessary and instead space was repurposed and given over to people for walking, cycling and
wheeling.

Related to this example is also the concept of creating green corridors where natural planting and
water systems can be integrated into paths and routes used by those walking, cycling and wheeling
creating a symbiotic relationship between the natural environment and the people using it for their
mobility needs. These corridors need to be planned effectively to maximise the benefits of the
environment and the general public by either retrofitting green infrastructure into existing transport
solutions or by ensuring that ex novo urban planning merges current green infrastructure into
mobility design. Examples of this include the Brussels Green Belt that is a 63km route that circles
Brussels allowing pedestrians and cyclists to travel along a natural environment49, as well as the
‘landscape axes’ developed in Hamburg linking the green rings on the outskirts of the city to the city
centre.50

It is only by these processes that we may properly achieve the interconnected and integrated design
we seek. This vision needs to be supported by action intended to deliver on its aim. Beyond action, it
is imperative to describe the outcomes that we seek and the enabling processes and actors that can
deliver.

The current crisis is setting the scene for doing what so many cities wanted but lacked the
opportunity to do. Through transport‐oriented development, the need for motorised travel and the
trip length can be reduced. Residential, work and leisure districts must become more closely
connected and intermixed. Cities must prioritise accessible, safe, breathable, and walkable streets
through urban planning, putting people at the heart, by implementing the careful coordination of
land use, spatial and long term mobility planning with the engagement of all stakeholders from
project start. There is now a golden opportunity for policymakers to integrate and strengthen these
policies.

Outcomes and conclusions

As much as action is important, progress towards good outcomes is essential. The vertical
integration of the SDGs (particularly SDG 11 on Sustainable cities and communities, Target 11.2) with
policy and design practice at the level of member States and regional and local government will be
important. A number of desirable outcomes and conclusions can be identified with their respective
enablers that are particular for this theme.

Outcome: Enhancing accessibility for all including to green, blue and quiet places and ensuring the
needs of vulnerable groups

49
   https://www.discoveringbelgium.com/walk‐cycle‐promenade‐
verte/#:~:text=The%20Promenade%20Verte%20is%20a,discovering%20its%20history%20and%20nature.&text=Its%20rout
e%20makes%20the%20most,between%20urbanized%20and%20industrialized%20areas.
50
   http://www.centralscotlandgreennetwork.org/resources/publications/category/116‐green‐active‐travel‐route‐case‐
studies?download=409:green‐active‐travel‐grunes‐netz‐hamburg
Enablers:

–   Ensuring an optimal density of development integrating housing, essential services (e.g.
    education, health, retail, leisure etc) and employment;
–   Increased digital connectivity.
–   Ensuring a common and coordinated approach to integrated spatial and transport planning.
–   Ensuring all‐encompassing transport and mobility impact and cost benefit assessments are
    carried out as a precondition of any significant development with the support of tools such as
    HEAT to support robust financing of initiatives.
–   Having routine assessment in the city by mapping access to green, blue and quiet places, GDP
    and health to inform future planning decisions.
–   Designing new houses (e.g. social housing) with access to green and blue spaces within walking
    distance.
–   Creating green corridors that combine the benefits of ecological corridors with active mobility
    options (e.g. the Brussels Green Belt and the landscape axes in Hamburg).

–   Capitalising on the low traffic levels in cities around the world to undertake tactical cost‐efficient
    investments such as widening sidewalks, facilitating step free access, establishing dedicated bus
    lanes to name a few.
–   Balanced social development incentivised by economic, fiscal and regulatory incentives (e.g.
    provision of social housing).
–   Ensuring that spatial planning guidelines and policy decisions have a strong focus on responding
    to the needs of vulnerable users, in particular people with reduced mobility.
–   Developing, where possible, short‐distance cities (the 15 ‐or 20‐ minute city, and the ecosystem
    of the last mile) designed to bring about urban and transport planning and design aimed at
    improving the quality of life for people and meeting their by providing access to everything they
    need within a 15‐minute radius of their home.

Outcome: Minimising the adverse impact of motorised road vehicles on urban settlements and the
prioritisation of sustainable mobility

Enablers:

–   Prioritising public transport for longer trips and active travel for short trips where public
    transport is not available (see Theme 2).
–   Facilitate connectivity through efficient hubs for interchange to public transport.
–   Weather‐proofing of, and parcel/push‐chair/bike etc. storage facilities at secure and welcoming
    hubs.
–   Focusing motorised traffic on fit‐for‐purpose routes.
–   Discourage motorised vehicles through use of fiscal and physical measures and the elimination
    of ‘rat runs’ with the aim of internalising external costs; (Ghent and Barcelona examples)
–   Facilitate the development of urban logistics hubs outside urban centres to enable consolidation
    of ‘last mile’ deliveries;
–   user‐friendly Parking policy

Outcome: Ensuring informed public support and participation in the planning process for a just
transition
Enablers:
– Accelerate comprehensive efforts by public authorities to identify public concerns relevant to
the future of sustainable mobility.
– Ensuring that there is a strong partnership between local authorities, transport operators, the
community and the private sector.
– Information programmes directed at showing how improved public transport and active travel,
together with appropriate spatial planning initiatives, can ameliorate those concerns
– A continuing educational and information campaign analogous to that discouraging cigarette
smoking.Box 1: Involving the community
Partnerships
Creating partnerships with actors in the local community is an essential tool to deliver long
lasting transformative change. Some of these include:
- Partnerships with local business owners (Dublin pedestrian street trials): Success story in
Dublin, local coffee shop owner wrote a message on Twitter asking what would happen if
his street was pedestrianised in an effort to revamp his business post‐lockdown, the city
council got in touch and the whole street was trialled as a pedestrian street for a few
months. People are asking to keep it pedestrian.51
- Partnership with schools (Dublin back to school)
- Partnership with urban logistics players: Thanks to a visionary partnership between bpost
(the Belgian company responsible for the delivery of national and international mail) and
the City of Mechelen, a new ‘Ecozone’ for delivery and pick‐up of parcels has been
established in the summer of 2020. The two‐year pilot project has been launched to tackle
the challenges of the rising on‐demand economy, while addressing congestion, improving
air quality and finding best ways to serve the citizens. The ‘Ecozone’ is an area in the centre
of Mechelen that has been equipped with 19 pick‐up points – a total of 50 new Parcel
Lockers spread across the city centre. Moreover, delivery to the new lockers is done with
bike trailers in the inner car‐free city core and with electric vehicles in the overall zone. The
Parcel Lockers – being located in open spaces ‐ are accessible 24/7, easily movable, and
operate without electricity and anchoring. The collaboration between bpost and the City
was essential to identify the best locations to place the Lockers within the city, the objective
in the location hunting was to place the Lockers within a maximum 400 meters radius from
housing, public transport hubs, shopping streets and other strategic locations, or how it is
described by bpost and the city within ‘slippers distance’.52
- Partnership with employers (Smart ways to Antwerp, Belgium): The city of Antwerp in
Belgium offers tailored support to employers in the region to help them create sustainable
mobility policy for their company. (https://www.slimnaarantwerpen.be/en/employers) The
companies can get in touch with the Smart Ways to Antwerp team within the city
administration and:
– Receive support in developing a company mobility policy
– Provide a ‘mobility scan’ for the company. A mobility scan is developed by inputting
the home addresses of the employees as well as information such as their children's
school ‐ if they would have to bring the children to school before work on a daily
commute ‐ in order to assess what travel alternatives to using their car would that
specific employee have. Once the mobility scan is developed, the city also offers one‐
on‐one meetings with employees willing to switch their travel behaviour. The
mobility scan helps highlight what impact switching to sustainable travel modes
would have in terms of reducing the CO2 footprint of the company as well as the
health benefit for the employees, and the financial benefit for the company
(research show that employees that use active travel to reach work have on average
51
For further good examples from Dublin, see also: https://twitter.com/DubCityCouncil/status/1298650758829740032,
https://twitter.com/DubCityCouncil/status/1295293915831181313,
https://twitter.com/DubCityCouncil/status/1296466273296154625
52
Bpost partnership in Mechelen: https://www.bpost.be/nl/ecozone‐mechelenYou can also read