ISSUE 5.0 PUBLIC CONSULTATION - TFL CONSULTATION
←
→
Page content transcription
If your browser does not render page correctly, please read the page content below
Issue 5.0 Public Consultation
Contents
Foreword ................................................................................................................... 4
Introduction .............................................................................................................. 6
1.1 Road network management responsibilities in London ................................................................... 6
1.2 Structure of this document ............................................................................................................... 7
Managing the road network and the MTS .............................................................. 8
2.1 Managing the road network outcomes .......................................................................................... 10
Measuring the performance of the road network ................................................ 14
3.1 Journey time reliability ................................................................................................................... 14
3.2 Journey time/traffic speed.............................................................................................................. 16
3.3 Volume of demand ......................................................................................................................... 16
3.4 Delay and disruption due to planned and unplanned events......................................................... 18
3.5 Volume of road works and other incidents on the Network .......................................................... 20
3.6 Customer satisfaction ..................................................................................................................... 22
3.7 Performance reporting ................................................................................................................... 24
Maximising the efficient and reliable operation of the network ......................... 25
4.1 Corridor management approach .................................................................................................... 25
4.2 Signal timing reviews ...................................................................................................................... 25
4.3 Split Cycle Offset Optimisation Technique ..................................................................................... 27
4.4 System Activated Strategy Selection (SASS) ................................................................................... 28
Figure 4.3 .............................................................................................................................................. 29
4.5 Pedestrian Countdown ................................................................................................................... 29
4.6 Traffic signal removal ...................................................................................................................... 30
4.7 Managing the impact of new development.................................................................................... 33
4.8 Minor improvements/simplifying the road network ...................................................................... 36
4.9 Motorcycles in bus lanes................................................................................................................. 37
4.10 Minimising parking contraventions and other moving vehicle offences ...................................... 37
Minimising the impact of planned interventions ................................................. 38
5.1 The Mayor’s Code of Conduct for Road works ............................................................................... 38
5.2 The London Permit Scheme (LoPS) ................................................................................................. 40
5.3 Ensuring best practice road works .................................................................................................. 42
5.4 Lane rental ...................................................................................................................................... 45
Minimising disruption from unplanned events .................................................... 47
6.1 Minimising the occurrence of unplanned events ........................................................................... 48
6.2 Minimising Response and Clear Up Times ...................................................................................... 53
6.3 Managing traffic around road incidents ......................................................................................... 57

                                                                                                                                                          2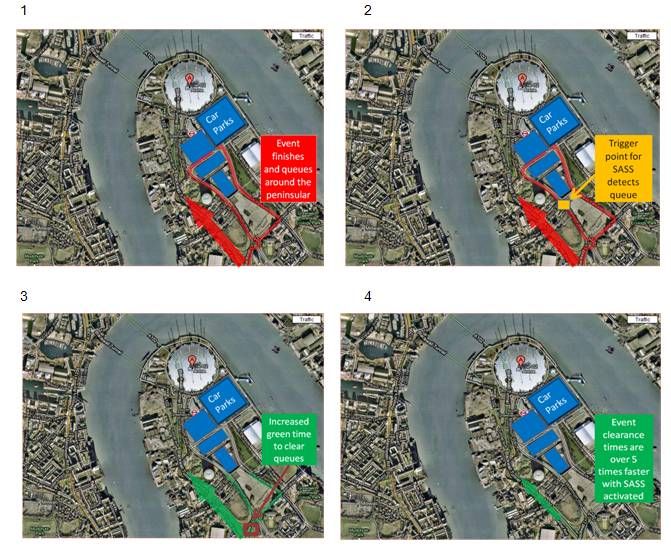
Managing demand and achieving modal shift ..................................................... 63
7.1 Managing demand corridors........................................................................................................... 63
7.2 Managing demand at key pinch points, valves and hot spots ........................................................ 65
7.3 The role of buses and bus priority measures .................................................................................. 67
Appendix 1: TLRN London-wide corridors .......................................................... 69
Appendix 2: Sub-regional corridors ..................................................................... 71
Appendix 3: Table of road network management responsibilities .................... 85
Appendix 4: Definitions ......................................................................................... 87
Appendix 5: Abbreviations and Acronyms .......................................................... 90
Appendix 6: Travel demand and levels of transport networks .......................... 92

                                                                                                                                         3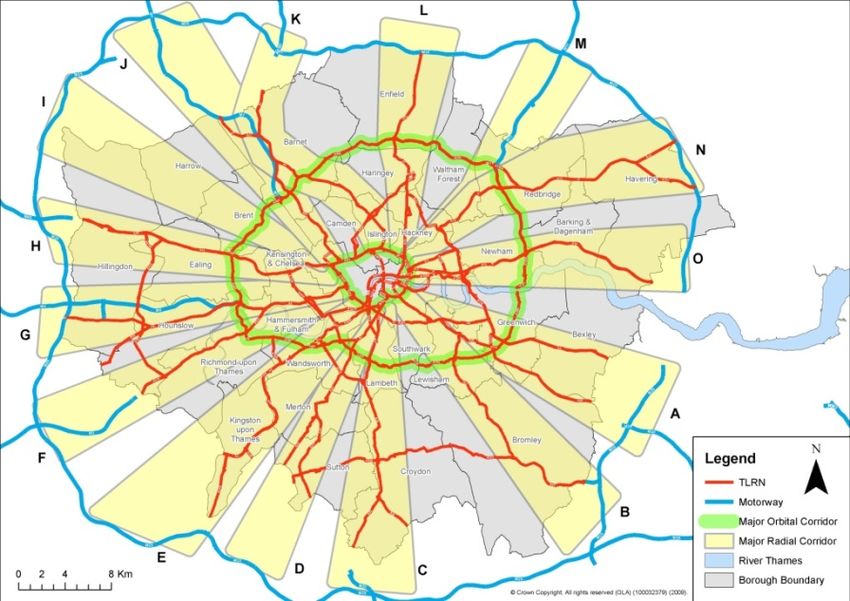
Foreword

The Capital’s 13,000km of roads are a key strategic transport asset. Of the 28 million
journey stages undertaken by Londoners every day in 2009 more than 80% were
made on the road network, including:

   •   10 million by car and motorcycle
   •   6 million by bus
   •   6 million walking trips
   •   0.5 million by cycle
   •   0.4 million by taxi

In addition, almost all freight movement into and out of the city is by road.

London’s roads comprise some of the Capital’s most important public spaces and
provide a key part of the backdrop to the social, economic and cultural life of the city.

More than half of the city’s traffic is on either the Transport for London Road Network
(TLRN) or the Borough Principal Road Network (BPRN). As a result, London’s
strategic roads are extremely busy with traffic – around 40 per cent more dense than
roads in other major UK conurbations.

London has around 20 per cent of the UK’s traffic congestion, which is estimated to
cost its economy at least £2bn a year. Three quarters of this congestion is on either
the TLRN or the BPRN. No less than 15 per cent of the UK’s traffic congestion is
therefore concentrated on less than 0.5 per cent of the country’s 400,000km of
roads.

The efficient management, operation and maintenance of London’s strategic road
network is therefore of significant economic importance not only to the Capital, but
also to the wider UK economy. At the same time, TfL needs to make sure that
London’s roads can play their part as social, economic and cultural spaces, whether
as locations for shopping and leisure in the city’s many town centres, or simply as
places for informal social activity. This means creating streets and public spaces that
are safe, attractive and accessible as well as providing the corridors along which
traffic flows.

Consequently, it is imperative that the road network functions effectively both as a
set of corridors for traffic movement and as a collection of places in which people
live, work and play. In order to demonstrate how these objectives will successfully be
achieved, Surface Transport has prepared a suite of three documents: the Network
Operating Strategy (NOS), the TLRN Implementation Plan (TIP) and the Highways
Asset Management Plan (HAMP).

The NOS sets out how London Streets, as part of TfL, will successfully manage and
operate the Capital’s road networks within the context of the Mayor’s Transport
Strategy (MTS), published in May 2010.

The TIP records TfL’s aspirations for future investment projects on the TLRN that will
create safe, accessible, attractive routes and places, through which traffic can flow
smoothly. It also outlines their costs and benefits and how they contribute towards
the MTS.

                                                                                        4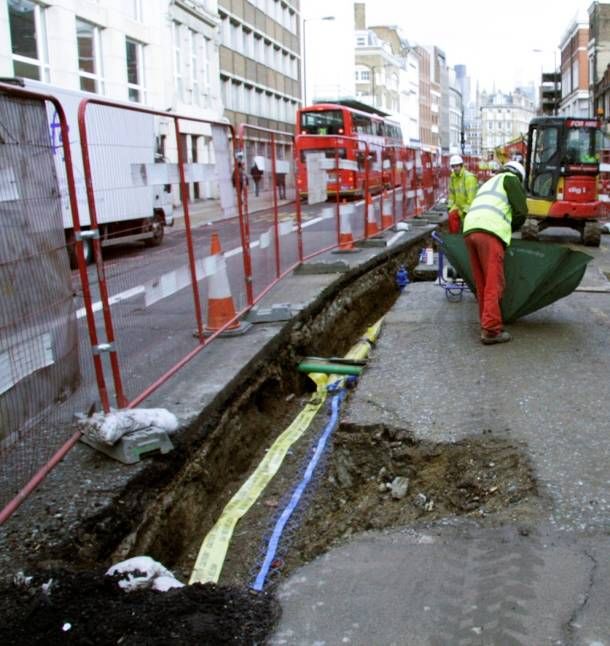
The HAMP sets out how TfL maintains its highway assets to meet user expectations,
maximises operational effectiveness and minimises asset-related risks cost
effectively.

How will we know we are being successful in our approach? When Londoners get in
their cars, on the bus, cycle or walk to their destinations, they will reliably know how
long their journey will take them, they will be assured that they can get there safely
and they will travel through some of the world’s best-designed and maintained
streets and public spaces.

 Garrett Emmerson                               Ben Plowden
 Chief Operating Officer                        Director
 London Streets                                 Better Routes and Places

                                                                                       5
Chapter 1

                                    Introduction

This document provides a strategic framework for the operational management of
London’s road network. It includes specific advice and guidance for those involved in
day-to-day decision-making at TfL, London’s boroughs and other organisations
involved with road management-related aspects of the MTS. It should be read in
conjunction with two partner documents. The first TfL’s HAMP, which sets out how
TfL will maintain its highway assets in a good state of repair to maximise their
operational effectiveness and meet user expectations cost-effectively. The second,
the TIP, which explains how TfL will develop its road network to support the Capital’s
sustainable development and regeneration, improve accessibility, safety, the urban
realm and public transport programme.

1.1 Road network management responsibilities in London

Responsibility for managing London’s road network is shared between the Highways
Agency, TfL and London boroughs. The Highways Agency manages the national
motorway network, including the M25 orbital motorway and the M1, M4 and M11.

Within TfL, London Streets is responsible for the TLRN and, through the Traffic
Management Act, has a strategic responsibility and specific powers, to coordinate
works and ensure free flow of traffic on the wider Strategic Road Network (SRN). It is
also responsible for the real-time operational control of the road network through the
London Streets Traffic Control Centre (LSTCC) and the London Streets Tunnels
Operations Centre (LSTOC), whose role is to reduce the likelihood of disruption and
minimise delays by initiating the earliest possible response to any incident or event
on the network. It is also responsible for the maintenance, management and
operation of the Capital’s 6,164 sets of traffic signals.

The London boroughs are responsible for all other Highways and Traffic
Management Act functions on the wider BPRN and local borough roads. The
successful operation of London’s road network therefore requires effective
cooperation and coordination at all these levels.

This document sets out London Streets’ overall approach to the management and
operation of the road network in London, building on the principles, policies and
proposals set out in the ‘Managing the Road Network’ section of the MTS. It includes
both those things for which it has direct operational responsibility and how it
proposes to engage with London boroughs, public utility companies and other
organisations with an involvement in road network management.

It is also intended to assist in the implementation of the developing sub-regional
strategies and borough Local Implementation Plans (LIPs), as well as providing a
framework through which to prioritise capital investment and ‘business as usual’
operational expenditure decision-making across the road network.

                                                                                     6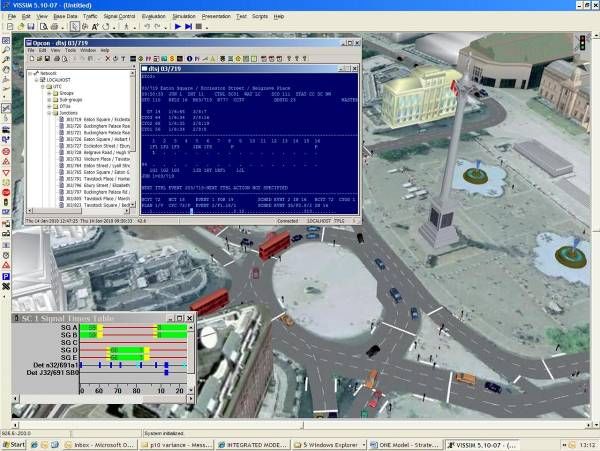
1.2 Structure of this document

Chapter 2 relates the spatial and thematic principles in the MTS to the management
of the road network at London-wide and sub-regional level, and defines operational
outcomes required to deliver the MTS’s high-level strategic goals and objectives.
Chapter 3 sets out and discusses the metrics necessary to define performance of the
network relative to these operational outcomes, and Chapters 4 to 7 outline the key
actions and initiatives London Streets is taking forward (either on its own or in
partnership with others), to deliver these operational outcomes.

                                                                                  7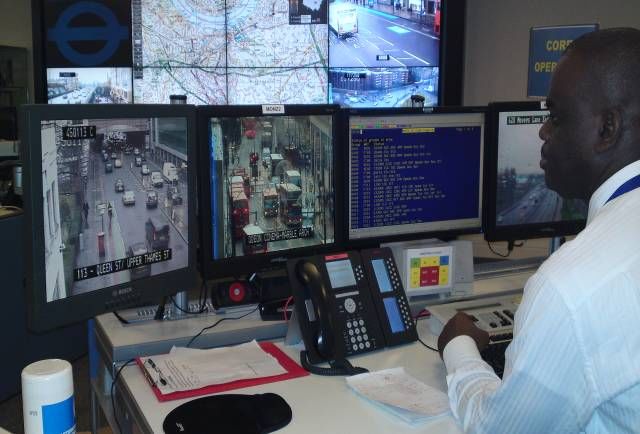
Chapter 2
Managing the road network and the MTS
The MTS sets out the wider transport planning context and spatial framework for the
management of roads in the Capital. At London-wide level, it describes a network of
strategic (multi-modal) transport corridors which include the major radial and orbital
routes into, out of, and around central London. The road-related elements of these
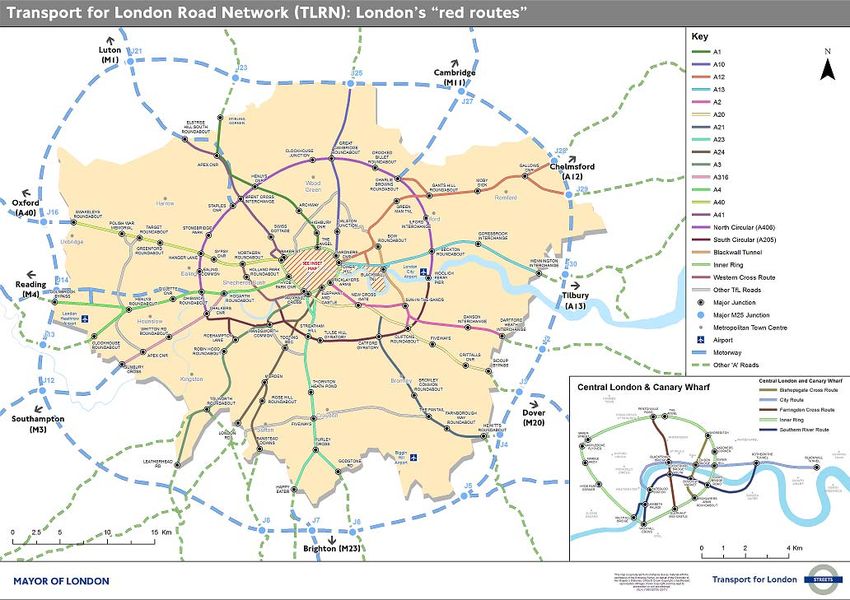
corridors largely (but not completely) correspond to the TLRN (see Figure 2.1
below):
Figure 2.1
The TLRN consists of the busiest five per cent (approximately 580km) of roads in
London, carrying more than 30 per cent of all traffic. Because of the greater
proportion of commercial freight and business-related traffic (eg commuting), the
TLRN is estimated to account for up to 40 per cent of the gross economic value of
traffic-related movement across the city.
The MTS also identifies a further network of sub-regionally significant transport
corridors. The road-related elements of these are largely composed of the BPRN
and some parts of the TLRN. These roads represent the primary focus of this
document.
Management of the remainder of the network (eg local borough roads), while still
subject to policies and proposals in the MTS, is defined in detail in individual borough
LIPs.
8
London-wide corridors: TfL has identified 23 individual road corridors on the TLRN
that relate to the London-wide strategic traffic movement. Fifteen of these relate to
the radial corridors set out in the MTS, and a further two (the north and south
Circular Roads) to the inner London orbital corridor (see map above). The remaining
six relate to strategic movement within central London (including the inner ring road).
These corridors are set out in Figure 2.2 below.

                                TLRN London-wide corridors

Figure 2.2 (a larger version of this map can be found at Appendix 1)

Sub-regional corridors: Through the development of the sub-regional strategies
TfL, working in partnership with the London boroughs, has identified a similar set of
sub-regionally significant multi-modal corridors in each of the five London sub-
regions. In the same way as the London-wide corridors in the MTS are primarily
related to the key radial and orbital corridors into, out of and around central London,
the sub-regional corridors are primarily focused around radial corridors into and out
of the 12 inner and outer London metropolitan town centres.

As part of this work, London Streets has also identified the key road management
corridors that relate to these sub-regional corridors. These are set out in map-based
and table form for each of the five sub-regions in Appendix 1.

                                                                                          9
2.1 Managing the road network outcomes

Under the specific goals and transport challenges it identifies, the MTS sets out a
series of key high-level transport outcomes.

TfL intends to deliver these outcomes through the three strategic plans outlined in
the introduction on page 7. The overlapping relationship of each of the transport
outcomes encompassed in these three documents may be summarised as follows:

   Bringing and maintaining all assets into a good state of repair
                                                                     Highways Asset
   Better Streets/Place related outcomes                             Management Plan

   Air quality and climate change

   Physical accessibility improvements
                                                                           TLRN
  Levels of crime and perception of safety                            Implementation
                                                                           Plan
  Public transport capacity and reliability

  Reducing road casualties

  An increase in walking and cycling                                    Network
                                                                        Operating
  Smoothing Traffic Flow (managing delay, improving journey             Strategy
  time reliability and resilience

  Improving road user satisfaction (for drivers, pedestrians and
  cyclists)

Figure 2.3

The MTS also sets out a strategic goal of supporting the delivery of the 2012
Olympic and Paralympic Games and its legacy. The creation of the Olympic Route
Network (ORN) and the operational management of the road network during ‘Games
Time’ is a key part of this.

In some instances, the achievement of the wider MTS objectives described above
may conflict with the primary movement or ‘link’-related objectives set out in this
strategy. For example, on high streets on the TRLN which have a significant ‘place’
function in addition to their strategic movement role. This document should therefore
be read in conjunction with the other documents mentioned in Figure 2.3 and a
balance struck between competing objectives.

A key challenge in the design and management of the road network is to optimise
the use of the network in the light of different (and sometimes competing) objectives.
These objectives can be in competition in a number of contexts, including the
allocation of road space and junction capacity and the prioritisation of different user
interests along and across road corridors. TfL is using a number of methods to
address these issues.

                                                                                       10
Some measures will achieve ‘win/wins’ across different modal groups (eg Pedestrian
Countdown at Traffic Signals [PCaTS]), which has potential benefits for pedestrians
and vehicular traffic movement – see section 4.5).
Other measures will benefit one group of road users and have a neutral effect on
others (eg ‘Split Cycle Offset Optimisation Technique [SCOOT]’ development which
will benefit vehicular traffic but have no disadvantage to pedestrians – see section
4.3).
Finally, some measures may offer clear benefits to one group of users to the
potential disadvantage of others, but provide an overall ‘net’ benefit to transport
movement along a particular corridor (eg Barclays Cycle Superhighways or bus lane
developments).
Schemes that have the potential to result in conflicting objectives are referred to
TfL’s Network Management Group (NMG) where mitigations are assessed and
decisions on how to resolve conflicts are made1.
Customer perceptions: The Mayor’s aim in smoothing traffic flow is to increase the
reliability and predictability of all journeys. This includes by tackling ‘stop-start’ traffic
conditions, which increase emissions of harmful pollutants. The aim is to improve
conditions for all existing road users (including cyclists and pedestrians), not to
create additional car journeys.
In summer 2009, TfL carried out specific research to understand the perspective of
road users on this issue. Around three quarters of both London residents and bus
drivers and two thirds of commercial vehicle drivers agreed with these aims.
% agreement with “delivering more reliable journey times,
and more free-flowing travel conditions than at present”
Agree strongly
Agree slightly
Neither / Nor
Disagree slightly
35
40 Disagree strongly
48
Don't know
38
33 19
10
13 8 13
4 12 8
5 5
London residents Commercial drivers Bus drivers
Source: Q3 - To what extent do you agree with this description of smoothing the traffic flow?
Base: London residents aged 16+ (n=1,008) / Commercial drivers in London (n=200) / London bus drivers (n=40)
Figure 2.4
1
See Appendix 4 for more information
11Recent (unpublished) national research, conducted by MVA Consultancy on behalf
of the former Commission for Integrated Transport and Motorists’ Forum, suggests
that Key Performance Indicators (KPIs) that matter most to motorists include:
• Journey times and speeds
• Journey time reliability
• Traffic delays
• Road works
• Potholes
• Safety
The research concluded that better KPI information on journey times, reliability, road
works and traffic delays would lead to motorists being more informed on the aspects
of road network performance that matter most to them and crucially, better placed to
make decisions that will improve their journey experience and reduce congestion
levels.
Road network operational outcomes: Managing congestion, smoothing traffic flow
and improving peoples’ perceptions is therefore a complex issue, made up of a
number of related factors including:
• Journey time and/or traffic speeds
• Journey time reliability
• Volume of demand
• Network capacity and availability including the amount of disruption to
road capacity through planned or unplanned events or interventions on
the network (eg highway or public utility road works, collisions,
breakdowns and special events)
• Network resilience – the ability to withstand the impacts of the planned or
unplanned events outlined above (through traffic diversion to alternative
routes) or other types of disruption including weather-related events (eg
ice, snow or flooding)
MTS themes: Under the general heading of managing the road network and
smoothing traffic flow, the MTS sets out a series of policy proposals under six key
themes:
• Maximising the efficient and reliable operation of the road network
• Minimising the impact of planned interventions on the road network with the
potential to disrupt traffic flows
• Minimising disruption from unplanned events (collisions and emergencies etc)
in ‘real-time’, as they occur, and return the network quickly and efficiently to its
planned, steady state operation as soon as possible
• Managing demand and achieving modal shift away from car-based traffic
movements towards more sustainable modes to reduce traffic growth
pressures on the network
• Where feasible, and where there is an overall congestion reduction and local
economic benefit, developing the road network
• Maintaining road network assets in a good state of repair
12As an operating strategy this document largely focuses on the first four of these
themes. The future development of the road network is considered in more detail in
the TIP and, for more local roads, in each borough’s LIP document. The ongoing
maintenance and management of TfL’s road network assets is set out in the TLRN
HAMP.
13Chapter 3
Measuring the performance of the road network
Responding to the development of the new MTS, TfL has identified a set of key
performance measures that collectively quantify the performance of the road
network:
• Journey time reliability (the strategic MTS outcome measure)
• Journey time/traffic speed
• Volume of demand
• Volume of delay and disruption due to planned and unplanned events
• Numbers of road works and other events or recorded incidents (eg ones
that impact on the availability of the network)
• Satisfaction with road network performance
While data relating to reliability, capacity, demand, customer satisfaction etc has
been routinely available for a long time on the major public transport modes (bus,
rail, Underground), historically this has not been the case for the road network. To
enable the effective operational management and monitoring of the network, TfL
therefore intends to develop, collate and publish performance data in each of these
areas. This will be done in collaboration with boroughs on an area-wide and/or
(where appropriate) corridor-related basis for both the TLRN and the wider SRN
identified in the sub-regional corridor maps. The remainder of this chapter sets out
the performance metrics that will be used.
3.1 Journey time reliability
The key measure for smoothing traffic flow set out in the MTS is journey time
reliability2. This is defined as ‘the percentage of journeys completed within five
minutes of a specified typical 30 minute journey time’. The measure introduces the
concept of an ‘allowable’ variation around a standard mean journey time for either
the network as a whole, or any individual corridor, allowing a numerical measure of
the percentage of journeys completed ‘on time’ (reliably) across the network to be
calculated.
This is illustrated in Figure 3.1 on the following page.
2
Journey time reliability scope includes all classes of light good vehicles, Heavy Goods Vehicles
(HGV’s) and cars.
14Average journey time and ‘allowable’ variation from the mean
Cut off for an acceptable
"average journey" length
% of journeys
longest 10%
of journeys
5 minute
allowable
variation
0
20 25 30 35 40
Journey time distribution
Figure 3.1
Note: Assuming an ‘allowable’ daily variation in journey time of up to five minutes (eg trips completed
within five minutes of the mean journey time are assumed to be on time) ie if the network (or an
individual route) can be managed more reliably such that nine out of ten journeys are completed
within this time, we can consider it to be 90 per cent reliable.
Journey time reliability varies across the day (being at its most reliable in the early
hours of the morning and least reliable in the AM and PM peak periods), and also by
time of year. On radial routes into and out of central London, reliability also varies
significantly between inbound and outbound journeys. It also closely relates to
overall traffic volumes relative to available capacity, particularly at key junctions and
for ‘pinch points’ on the network. The graph below shows this for a sample of six of
the 13 periods3 of 2010/11, with period 5 (August) and period 10 (Christmas)
showing improvements over other periods due to lower holiday traffic volumes.
Percentage of journeys on major roads in London completed within an
allowable excess of 5 mins for a 30 min journey P5-10 2010/11
100%
P5
98%
96% P6
94%
92% P7
90%
P8
88%
86% P9
84%
82% P10
80%
0 0 0 0 0 0 0 0 0 0 0 0 0 0 0 0 0 0 0 0 0 0 0 0
:0 :0 :0 :0 :0 :0 :0 :0 :0 :0 :0 0
: :0 0
: :0 :0 :0 :0 :0 :0 :0 :0 :0 :0
0 1 2 3 4 5 6 7 8 9 0 1
1 2 3 4 5 6 7 8 9 0 1 2 3
0 0 0 0 0 0 0 0 0 0 1 1 1 1 1 1 1 1 1 2 2 2 2
Figure 3.2
3
TfL measures performance across the year in thirteen four-week periods starting in April
15Through its London Congestion Analysis Project (LCAP), TfL has developed a
methodology for the reporting of this indicator on the TLRN London-wide corridors
using data from Automatic Number Plate Recognition (ANPR) camera pairings. It
intends to publish reliability data both for the network as a whole and the 23
individual corridors on a quarterly basis. In the longer term (using Global Positioning
Satellite [GPS]-based floating vehicle data currently provided by Traffic Master and
the DfT’s metric for journey time variability4), it also proposes to do likewise for the
sub-regional corridors in each of the five London sub-regions.
3.2 Journey time/traffic speed
TfL already collates and publishes information on traffic speeds across the Capital
and including within the central London Congestion Charging area. However, this
can be of limited use to motorists in relation to specific journeys on individual routes.
For the TLRN, using data from its network of ANPR cameras, TfL proposes to
publish on a quarterly basis average journey time data for the 23 London-wide
corridors identified in Chapter 2. In the longer term (using GPS-based floating
vehicle data), it also proposes to do likewise for the sub-regional corridors in each of
the five London sub-regions.
3.3 Volume of demand
TfL also collates and publishes information on the average volumes of vehicular
traffic using major roads every weekday, both for the whole of the Capital and on
major roads entering central London. This data, like journey time, journey time
reliability and traffic speeds, will also be published on a quarterly basis for the 23
London-wide corridors identified in Chapter 2. In the longer term, TfL also proposes
to do likewise for the sub-regional corridors in each of the five London sub-regions,
although because of the frequency of data collection, the traffic volumes will only be
updated annually.
Figure 3.3 below shows average vehicle flows, corridor journey times, traffic speeds
and journey time reliability for each of the 23 TLRN corridors, described in Chapter 2,
for the full 2010/11 financial year.
4
Reference DfT’s WebTAG 3.5.7
16AM Peak Average Journey Time Reliability, Traffic Speeds and Traffic Volumes
On the 23 TLRN corridors in periods 1-13 2010/11
2010/11
P1-13
AM Peak Year / Period Length AM flow JTs Speeds JTR
Route Type Corridor Direction kms veh/hr mins mph %
Radial A4 Inbound 29 2001 59.3 17.7 88.4%
Radial A40 Inbound 25 3268 42.4 20.7 78.4%
Radial A41 Inbound 24 1784 52.2 16.5 86.4%
Radial A1 Inbound 14 1553 39.7 12.5 81.0%
Radial A10 Inbound 20 1245 47.8 15.2 86.6%
Radial A12 Inbound 41 2004 71.1 20.2 86.5%
Radial A13 Inbound 15 3016 25.2 21.6 86.5%
Radial A2 Inbound 24 2364 36.3 23.0 85.6%
Radial A20 Inbound 27 1271 63.3 15.0 89.2%
Radial A21 Inbound 14 871 25.7 18.8 88.9%
Radial A23 Inbound 26 884 80.3 12.1 84.4%
Radial A24 Inbound 13 924 44.3 11.3 88.5%
Radial A3 Inbound 16 1767 36.7 16.6 86.9%
Radial A316 Inbound 13 1684 26.9 18.0 85.1%
Orbital A406 Clockwise 44 2803 58.6 26.8 90.4%
Orbital A406 Anti-clockwise 45 2554 71.6 22.4 87.5%
Orbital A205 Clockwise 32 846 97.5 11.7 86.1%
Orbital A205 Anti-clockwise 35 787 91.9 13.9 88.3%
Radial Blackwall North 7 2814 19.7 13.4 75.8%
Radial Blackwall South 7 2082 8.0 31.4 95.9%
Orbital Inner Ring Clockwise 17 1304 66.5 9.2 84.2%
Orbital Inner Ring Anti-clockwise 16 1244 59.7 10.2 83.1%
Central Bishopsgate North 3 814 11.9 8.3 85.6%
Central City West 5 1791 19.7 11.2 79.2%
Central Farringdon South 3 866 10.1 11.1 88.1%
Central South river East 4 717 13.9 10.7 83.0%
Central West East 8 1250 25.4 11.8 86.4%
Central Central All Directions 54 1107 168.7 12.1 86.6%
TLRN TLRN All Directions 821 1693 1530.0 19.5 88.7%
Figure 3.3
TfL is working towards increasing journey time reliability on these corridors, which is
now actively managed on a daily basis. Understanding how a corridor performs will
allow TfL to focus its congestion-relieving efforts on those areas of the corridor which
are not meeting the targets and, additionally, allow it to monitor the impact of these
efforts once they have been implemented. Chapter 4 details these interventions.
173.4 Delay and disruption due to planned and unplanned events
The LSTCC records all delay and disruption observed on the network. The data can
be analysed by both cause and severity. In 2010/11, TfL recorded the main causes
of congestion as:
Collision 28%
Breakdowns 10%
Highway authority works 16%
Utility works 12%
Congestion 7%
Obstruction 1%
Traffic signal failures 3%
Security/police checks 3%
Special events 5%
Other 7%
Figure 3.4
In addition, the LSTCC categorises the impact of incidents into four degrees of
severity:
Minimal congestion
• Traffic is very light at a location, with no traffic queuing and no noticeable
inconvenience to the road user
Moderate congestion
• Traffic is moving, with some traffic queuing which is unusual for the time of
day at the location
Serious congestion
• There is traffic congestion that is unusual for the time of day at the location or
in an area, and traffic has been stopped for less than five minutes but in
excess of the red signal time displayed on the traffic signals operating
Severe congestion
• There is traffic congestion that is unusual for the time of day at the location or
in an area and traffic has been stopped for more than five minutes
• Traffic queuing that is longer than normal for the time of day, more than for
serious congestion
The ‘serious’ and ‘severe’ categories represent the most significant congestion on
the network. In 2010/11 TfL recorded a total of 2,766 hours of serious and severe
congestion across the whole of London’s road network – spread across 1,237
individual events. TfL’s priority is to minimise serious and severe congestion.
To provide useful performance information to manage the network on a day-to-day
basis, this data is separated into that relating to planned and unplanned events on
the network, and to that relating to the TLRN and borough roads.
18Delay and disruption on the TLRN: Figures 3.5 and 3.6 (below) show periodic
breakdowns of the numbers of hours of serious and severe disruption from planned
and unplanned events on the TLRN in 2010/11, together with their types of cause.
TLRN Duration (hours) of Serious & Severe Planned Events by Category
120
100
80
Hours
60
40
20
0
P01 P02 P03 P04 P05 P06 P07 P08 P09 P10 P11 P12 P13
10/11 10/11 10/11 10/11 10/11 10/11 10/11 10/11 10/11 10/11 10/11 10/11 10/11
Special Events-Planned 2 0 2 2 0 0 0 1 6 0 0 0 0
Planned Utility 1 3 5 30 7 0 10 8 37 3 47 10 2
Highway Authority -
Planned Works 9 17 39 72 24 41 67 29 19 8 8 13 1
Figure 3.5
TLRN Duration (hours) of Serious & Severe Unplanned Events by Category
250
200
Hours
150
100
50
0
P01 P02 P03 P04 P05 P06 P07 P08 P09 P10 P11 P12 P13
10/11 10/11 10/11 10/11 10/11 10/11 10/11 10/11 10/11 10/11 10/11 10/11 10/11
Obstruction 0 3 0 1 0 0 2 11 7 2 6 0 5
Congestion 12 14 8 3 5 21 14 27 18 16 10 1 22
Utility Emergency Works 11 4 20 2 1 6 0 3 6 8 4 0 20
Unplanned Utility 0 0 0 0 0 0 5 0 0 0 0 0 0
Special Events-Unplanned 0 0 0 0 0 0 0 1 4 0 0 2 0
Security/Police Checks 0 13 13 17 2 1 3 6 11 2 0 8 7
Other 2 17 4 15 3 7 13 4 44 0 7 0 6
Highway Authority Unplanned Works 8 0 0 0 0 0 3 0 38 1 0 0 2
Highway Authority Emergency Works 1 5 0 0 5 3 3 0 1 1 1 0 0
Control Devices 6 7 7 5 0 3 20 1 3 2 11 8 2
Breakdowns 13 19 13 20 7 13 23 20 21 15 16 11 17
Accident 52 51 84 67 53 77 99 67 51 37 40 62 53
Figure 3.6
Serious and severe disruption from planned works and events peaked in period 4.
This was because there were 6 incidents recording more than 5 hours of disruption
each. Road works on the A41 Finchley Road caused severe disruption for 4 days in
total. There were 2 consecutive weekend closures of the Blackwall Tunnel
southbound from 9th and 16th July to facilitate planned maintenance works. Also
ongoing street works on the A406 Telford Road North Circular Road related to the
Bounds Green regeneration project also contributed to the total disruption recorded
in the period.
19Unplanned serious and severe disruption peaked in period 9. A total of 8 incidents of
greater the 5 hours duration were recorded. From 12th November, the A406
carriageway was closed continuously for 12 days southbound at Charlie Browns
Roundabout with a contra flow operating in the northbound carriageway to facilitate
emergency repairs to the bridge expansion joints on Woodford Viaduct. On the 24th
November a broken down HGV meant one lane (of three) was blocked eastbound on
the A13 at the junction with Renwick Road. On 29th November heavy congestion
was recorded on the Marylebone Road between A40 Westway and A501 Euston
Road related to a tube strike. Heavy snowfalls on the afternoon of 30th November
lead to severe disruptions and slow moving traffic on many roads across the capital.
The majority of delay and disruption due to planned events (eg highway or utility
road works, special events etc) is within the highway authority’s ability to influence
through its Streetworks and Traffic Management Act powers. On the TLRN, TfL will
therefore set specific targets to minimise the overall volume of serious and severe
traffic disruption on an annual basis, relative to the volume of planned work likely to
be carried out by utility companies and itself.
Special Events taking place on the road network caused approximately 147 hours of
serious and severe disruption; around half from planned events, such as the London
Marathon or State Opening of Parliament, and half from unplanned events (such as
demonstrations and marches). In 201/11, just over three quarters of the total serious
and severe disruption (2,120 hours) recorded across London was caused by
unplanned incidents and events. Almost half of this resulted from collisions and
breakdowns.
The LSTCC actively manages an average of 10,000 incidents per year and is also
involved in facilitating the smooth running of 750 events each year.
The causes of unplanned disruption are significantly less within TfL’s control.
However, in addition to monitoring and seeking to reduce the overall volume of
incidents and disruptions they cause, TfL will also focus on, and set targets in
relation to, the average duration of individual incidents.
Delay and disruption on the wider network: TfL will publish data at a sub-regional
level for the sub-regional corridors set out in Chapter 2. Through the development of
the sub-regional strategies and the new Road Management Concordat between the
Mayor and London Councils. TfL is keen to work with the boroughs to develop joint
actions to minimise disruption and maximise the performance of the network with
reference to these parameters.
3.5 Volume of road works and other incidents on the Network
Road works are necessary not only to ensure the provision of essential utility
services, but to facilitate much-needed development and improvements to the road
network and ensure it remains in a fit and proper state of repair. However, as
outlined above, they also cause significant delay and disruption to traffic and
frustration for drivers. Historically, road works have caused around one third of all
serious and severe traffic disruption in London, although this figure is now reducing,
and are conservatively estimated to cost the economy nearly £1billion every year.
20Numbers of road works on London’s roads: It is difficult to give an exact figure for
the number of road works that take place across the Capital each year, or the
amount by which they have increased or decreased. This is because prior to the
introduction of a road works permit scheme, under the New Roads and Street Works
Act 1991 (NRSWA), only utility companies were required to notify the relevant
highway authority of their intention to carry out works. Highway authorities did not
accurately record their own works. A complete record is not therefore available on
the central road works register, LondonWorks, maintained by TfL.
In 2009/2010, TfL recorded around 370,000 works across the Capital carried out by
both highway authorities and public utilities. While this is a 20 per cent increase in
the number of works recorded on the previous year, this does not mean there were
20 per cent more road works, only that reporting of highway authorities’ works had
improved. There is no indication that the overall number of road works has
increased. In fact, utilities works have decreased by 0.4 per cent since last year. It
would only be possible to give a completely accurate picture of all the works taking
place in the Capital if all boroughs implemented the common permit scheme and
recorded all the highway works (as well as utility works) on the LondonWorks
system.
Given that not all highway authority works are being captured, it is likely that the
370,000 works recorded is still a significant underestimate and that there are
significantly more than 500,000 holes dug on London’s road network every year, split
evenly between highway authorities and utilities.
Road works on the TLRN: Accurate records are, however, available for all works
carried out on the TLRN in 2010/11. In 2010/11, there were 42,038 works
undertaken. Around 55 per cent of these were planned works, with about 65% of
these being TfL (including developer-related activity) and 35% utility works. These
planned works accounted for 23% per cent of the duration of serious and severe
disruption recorded on the TLRN over the same period. Of these works:
• Only two per cent were major schemes which, while often thought of as the
most disruptive, can be well-planned and coordinated through advance
notification and engagement. In addition, opportunities to combine works can
be explored to minimise disruption as far as possible
• The majority (52 per cent) were minor schemes. These require a permit
application to be made only three days ahead of works commencing. While
minor schemes are short in duration, the limited advance notice provides
authorities with little opportunity to coordinate works and facilitate the sharing
of works sites and traffic management
Around 45 per cent of works carried out on the TLRN were unplanned (emergency or
urgent), with a split of 72% by TfL and 28% by the utilities. These accounted for 8%
per cent of the duration of serious and severe disruption recorded on the TLRN.
Unplanned highway works tend to consist of relatively quick pothole or trip repairs,
many of which are on pavements rather than carriageways. Utility companies, on the
other hand, tend to have to dig down into carriageways to undertake more time-
consuming repairs to fix burst water mains and gas leaks and, therefore, cause
significantly more disruption. Defects and failures to the gas and water main
networks, as well as carriageway and footway potholes, have also been exacerbated
in recent years by prolonged spells of cold weather.
21More than 90 per cent of works on the TLRN (unplanned and minor works) require
three days advance notice or less. This clearly demonstrates the difficulties permit
authorities have in coordinating activity effectively. However, to ensure the free flow
and expeditious movement of traffic on the TLRN, using its road works permitting
and Traffic Management Act powers, TfL will monitor and set targets to manage the
overall numbers of road works taking place on its road network at any one time, and
is keen to work jointly with London boroughs to achieve similar outcomes on the
SRN.
3.6 Customer satisfaction
Since 2005, TfL has conducted an annual customer satisfaction survey among
Londoners to assess satisfaction levels with a range of aspects of the road network
such as the maintenance and management of road and pavement surfaces; the
disruption caused by road works; and the level of traffic congestion. During 2010, a
larger TLRN-specific online survey of customer satisfaction was carried out for the
first time and this more targeted study will be used for monitoring performance over
time.
The new TLRN-specific survey only interviews people who have used the TLRN in
the last month, including non-Londoners. It is a multimodal survey and, therefore,
takes into account the views of car drivers, taxi/commercial vehicle drivers, bus
passengers, cyclists, Powered Two Wheelers (P2W) users and pedestrians. It will
take place annually every autumn (known as the “TLRN User CSS”). The key
measure of customer satisfaction will be overall satisfaction on last TLRN trip,
recorded depending on which modes the person has used in the last month, and
using the question, “Thinking about this particular journey you have made, and
taking everything into account, how satisfied were you with the stretch of the red
route that you used on that trip?”
Key results from Autumn 2010 are:
• Customer satisfaction with the TLRN scored 72 out of 100. As a comparison,
public transport generally scores 80 or above for customer satisfaction, while
Barclays Cycle Hire scored 70 in its first months of operation
• Pedestrians and bus passengers scored slightly above the TLRN average,
while car drivers scored the same as the average
• Taxi/commercial drivers and P2W riders scored slightly below average (70)
• Cyclists were significantly less satisfied with the TLRN, scoring 67 on average
Journey speed and predictability, traffic congestion, response to (and information
about) incidents and disruptions and road works are the key factors that drive overall
satisfaction across all modes:
• Traffic congestion saw the lowest satisfaction scores (63 out of 100)
• Pedestrians (score 75) were most satisfied with the speed of their journey on
the TLRN network compared to the average score of 69
• Road works management is also important, again with a relatively low
satisfaction rating (67 out of 100)
22Aspects specific to either cyclists or commercial drivers - such as condition of cycle
lanes and amount of time allowed to pick up/drop off in a loading bay – were scored
by them as poorly as traffic congestion.
Street lighting, working traffic lights and well drained roads were strengths, each
scored 74 or better. Poorer aspects were condition of surfaces and information about
disruptions. Road surface condition depended very much on the type of
vehicle/travel: it was very poorly scored in particular by cyclists (60) and P2W riders
(64) but car drivers gave a higher than average score (70).
Specific scores for each main TLRN measure covered were as follows:
Satisfaction with... Score out
of 100
working condition of traffic lights 75
street lighting 75
roads (pavements) are well drained and free from water and flooding 74 (74)
condition and clarity of road markings 73
amount and clarity of road signs giving route directions 73
traffic light timings 70
estimate accurately how long your journey would take 70
speed 69
speed of response for fixing unusual traffic problems and incidents 69
amount and clarity of roadside signs about delays and disruptions 69
up-to-the-minute information about delays and disruptions from sources 68
such as radio, satellite navigation systems, or smart-phone applications
condition of road surfaces (for pedestrians: pavements) 68 (66)
management of road works 67
traffic congestion levels 63
Base: over 5,000 trips on the TLRN (of which approximately 1,400 were by pedestrians)
Figure 3.7
Customers’ satisfaction did not vary greatly between the 15 corridors. The A10 and
A21 scored 75 each, and were the best-performing corridors. The Inner Ring Road,
A23, A13 (scored 68 each), and A2/A20/A102/Blackwall Tunnel (scored 70) were the
worst-performing. Other corridors’ scores were statistically no different from the
TLRN average.
Regarding information, radio and the TfL website were the most popular sources of
checking traffic conditions before setting out by those travelling by car, van or P2W.
Roadside messages and radio travel alerts were the most widely used sources of
information during the journey and were generally considered to be useful, although
they are low scoring aspects (scores of 68 for radio/satellite navigation and 69 for
roadside signs).
TLRN users perceive that road works are the main factor causing disruptions (69%
of London residents said they had experienced disruptions on the TLRN in the
previous three months as a result of road works). Although operational data
suggests that this is broadly true, accidents and congestion are also key contributors
to delays on the network of main roads and there is a much lower incidence of faulty
traffic lights than customers perceive.
233.7 Performance reporting
To assist with the development and prioritisation of targeted interventions to improve
network performance, and to help people better understand their impact, TfL will
develop, collate and publish the performance data outlined above. This will be done
on an area-wide and/or (where appropriate) corridor-related basis for the TLRN and,
in future, on the key sub-regional corridors that will be agreed through the
development of sub-regional strategies.
TfL intends to publish this data on a quarterly basis and will share it with London
Travel Watch for inclusion in their quarterly reports on TfL’s performance.
Through the Road Management Concordat, TfL is working with London Councils.
Furthermore, it will host the annual Managing London’s Road Network Summit
attended by highway authorities, utilities and other stakeholders in the Capital. At the
summit, network performance will be reviewed, key achievements will be presented,
and innovative approaches can be shared to encourage best practice.
24Chapter 4
Maximising the efficient and reliable operation of the network
4.1 Corridor management approach
For the 23 London-wide TLRN corridors set out in Chapter 2, TfL is working to
develop a better understanding of the reasons for varying performance, particularly
in terms of journey time reliability. This includes looking at each corridor on a link-by-
link and/or junction-by-junction basis, identifying pinch points, valves and hot spots,
and understanding how each corridor operates in relation to the surrounding road
networks. It also includes developing detailed corridor simulation models which will
allow testing of potential measures to improve journey time reliability, prioritise their
application and facilitate a corridor-based optimisation of traffic signal timings which,
in itself, will have a significant impact on stop-start traffic.
London Streets’ Network Performance Department has appointed Corridor
Managers charged with managing the overall performance of each of these corridors
on a day-to-day basis, and identifying and prioritising improvements to maximise
journey time reliability.
Through the development and implementation of the sub-regional plans, TfL is also
keen to work with the boroughs to achieve the same outcomes on sub-regional
corridors. This chapter sets out some of the key actions TfL will implement, either on
its own or in partnership with London boroughs.
4.2 Signal timing reviews
Reviewing the timings of 1,000 sets of traffic signals each year is a key Mayoral
commitment, first outlined in the Way To Go! Policy statement published in
November 2008.
Road junctions are a key constraining factor on the effective operation of the road
network. Maximising their performance is therefore an important part of efficient
network management. The efficient operation of signalised junctions is particularly
important in this regard. Because of limited road space, London has a very high
number of signalised road junctions. TfL therefore regularly reviews and collates
data on the performance of its 6,164 sets of traffic signals. Data recorded measures
stop/start delays at traffic signals for both pedestrians and vehicular traffic in terms
of:
• The number of occasions traffic queuing at a red traffic signal clears the
junction in the first green phase of the traffic signal
• The number of occasions pedestrians waiting at a ‘red man’ signal clear the
kerb during the invitation to cross ‘green man’ phase of the lights
TfL currently reviews and records performance data at 1,000 sets of traffic signals
each year. Data is recorded across six time periods: the AM peak, PM peak, the off-
peak period, late evenings, over night and at weekends.
25In 2010/11, TfL completed 1,008 signal timing reviews (519 on the TLRN, 216 on the
wider SRN and 273 on local borough roads), achieving an average 7.93 per cent
reduction in stop/start delays at traffic signals. This was achieved with no dis-benefit
to pedestrians and with improvements to both traffic and pedestrian flows across
nearly all times of the day and night.
Number of occasions when queued traffic will have cleared through the first
green phase:
Before review After review Change
(per cent) (per cent) (per cent)
Overall 72.13 80.06 7.93
AM Period 53.28 64.68 11.40
PM Peak 51.66 61.41 9.75
OP Peak 69.52 81.75 12.23
Weekend 69.70 79.39 9.69
Late Evening 90.63 94.43 3.80
Overnight 97.97 98.70 0.73
Figure 4.1
Number of occasions when pedestrians waiting to cross the road easily clear
the kerb during the first green man/blackout period:
Before review After review Change
(per cent) (per cent) (per cent)
Overall 94.10 94.77 0.67
AM Period 90.84 91.44 0.60
PM Peak 89.99 90.40 0.41
OP Peak 93.26 94.42 1.16
Weekend 93.60 94.35 0.75
Late Evening 97.64 98.63 0.99
Overnight 99.25 99.38 0.13
Figure 4.2
26Going forward, TfL will seek to prioritise its annual signal timing review programmes
to maximise journey time reliability benefits on the 23 London-wide and priority sub-
regional corridors.
4.3 Split Cycle Offset Optimisation Technique
SCOOT is an automated, intelligent traffic signal control system which can
dynamically change signal timings to best suit prevailing traffic conditions and reduce
stops and delays. Sensors buried in the road detect when traffic is building up and
computers then adjust signal timings on a second-by-second basis throughout the
day in response. SCOOT makes more than 10 million signal timing decisions per day
in London, and is effective in smoothing variations in traffic flow and responding to
disruptions caused by collisions and other unplanned incidents.
In 2008/09 approximately 2,000 of London’s 6,164 sets of traffic signals operated
with SCOOT technology. TfL is committed to installing SCOOT at an additional 1,000
sets of signals by 2012/13.
So far SCOOT technology has been installed and optimised at an additional 314
locations (225 in 2010/11). Analysis to date, suggests that these new sites are
delivering, on average, a 12.4 per cent reduction in delays and 4.5 per cent reduction
in the number of times vehicles have to stop as they travel through the network.
Case study: The A40
As part of work to improve the resilience and
journey time reliability on our key corridors, TfL
concentration has been on the roll-out of the
advanced traffic management technology to
those junctions on the road network that need it
most. Savoy Circus and Gypsy Corner are two
such junctions. At these points on the A40 the
competing demands of several main routes
coincide. Additionally at these points there is a
need to service the demands of pedestrians
wanting to cross the road. These junctions and pedestrian crossings create pinch
points where capacity needs to be maximised and SCOOT has been deployed to
achieve this.
SCOOT makes second-by-second changes to
the green time received at these traffic signals
as well as continually adjusting the way the
traffic signals interact. Since SCOOT was
installed delays to traffic have been reduced by
9.5% in the evening peak at Savoy Circus, and
19.2% in the morning peak and Gypsy Corner.
The reliability of journeys along this section has
improved by 2% with users better able to predict
when they will arrive at their destination.
Vehicles now encounter reduced queues on approaches, then experience smoother
progression between these key locations of the A40 with overall journey times down
by around three minutes.
27Further examples of high profile locations where SCOOT has recently been activated
and achieved improvements include:
• A23 Brixton Hill/Streatham Hill –18.8 per cent reduction in delay in the
morning peak
• A23 Brixton Road/Loughborough Road – 13.9 per cent reduction in delay in
the morning peak
• A207 Shooters Hill Road by Old Dover Road – 29.1 per cent reduction in
delay in the morning peak and a 27.1 per cent reduction in the evening peak
TfL plans to prioritise its SCOOT development programme to maximise journey time
and reliability benefits on the 23 London-wide and priority sub-regional corridors.
iBus and Selective Vehicle Detection (SVD): SVD is a real-time system which can
be linked with SCOOT. It prioritises buses at traffic signals, either by extending the
‘green’ time for a bus if it was about to go red, or by changing to green time earlier
than was expected if the bus arrives at a red.
Previous studies have indicated that up to five seconds per bus can be saved using
iBus SVD linked with SCOOT. The aggregated benefits of small time savings to the
bus network are significant in terms of improving reliability for bus services and
encouraging modal shift. Since May 2008, iBus SVD has been enabled, reducing
operating costs at more than 1,578 sites.
4.4 System Activated Strategy Selection (SASS)
SASS works with SCOOT, iBus or any other computer-controlled traffic signal
system. It uses network intelligence to automatically activate a different pre-
programmed signal timing operation at one or more sets of traffic signals to respond
to or pre-empt a particular traffic problem (for example a bridge lift at Tower Bridge)
to help prevent traffic congestion.
SASS is currently used at around 50 critical locations across London including many
important gyratory systems (such as Hanger Lane) to improve traffic flow. Annually
SASS intervenes approximately 100,000 times at critical traffic signals on the
network.
28Case study: SASS at The O2
SASS was introduced at The O2 in February 2009. A number of detection points
were positioned around the venue to detect the build-up of congestion, following an
event. Once a certain level of congestion had been detected, a number of automatic
changes were made to the timings at traffic signals in the local area, providing more
green time for vehicles travelling away from the arena.
The majority of traffic exiting the arena after events travels along Millennium Way,
turning right onto the A102. There is heavy demand for the right turn at Blackwall
Lane to travel north through the Blackwall Tunnel. Vehicles waiting to make this right
turn block back to the roundabout which in turn locks up and results in heavy
queuing along both Millennium Way and John Harrision Way (see Figure 4.3 below).
Prior to the implementation of SASS, clearance times for vehicles exiting The O2
were timed at more than 90 minutes. With the SASS strategy now in place, the car
parking management team has reported an average clearance time of 22 minutes.
Figure 4.3
4.5 Pedestrian Countdown
Research has show that pedestrians do not fully understand the green man,
blackout, red man sequence at traffic signal junctions, many believing that the green
man time is the time they have to cross the road, where in fact it is an invitation to
cross. As a consequence of this lack of understanding in London, over time
pedestrian green man times have been set in excess of that required to fulfil its
intended function.
29You can also read