Cape Town's Residential Property Market - Size, Activity, Performance - World Bank Document
←
→
Page content transcription
If your browser does not render page correctly, please read the page content below
Public Disclosure Authorized
Public Disclosure Authorized

                               Cape Town’s Residential
                                  Property Market
                                   Size, Activity, Performance
Public Disclosure Authorized

                                                     Funded by
Public Disclosure Authorized

                                                  A deliverable of
                                                 Contract 7174693

                                              Submitted to the World Bank
                                  By the Centre for Affordable Housing Finance in Africa
                                                       January 2018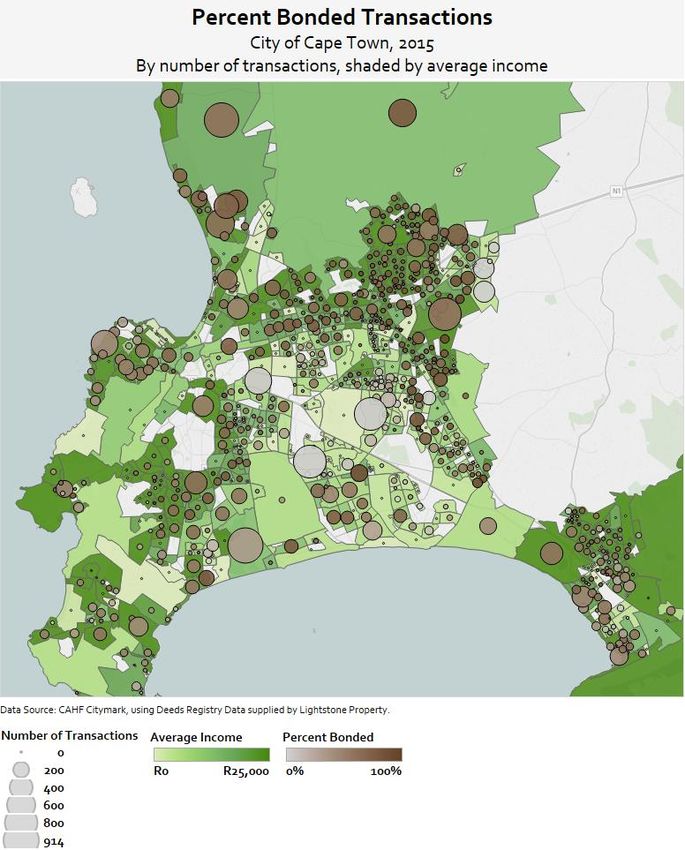
Acknowledgements

This report was prepared by the Centre for Affordable Housing in Africa, for the World Bank
as part of its technical assistance programme to the Cities Support Programme of the South
African National Treasury.

The project team wishes to acknowledge the assistance of City of Cape Town officials who
contributed generously of their time and knowledge to enable this work. Specifically, we are
grateful to the engagement of Catherine Stone (Director: Spatial planning and urban design),
Claus Rabe (Metropolitan Spatial Planning), Peter Ahmad (Manager: City Growth
Management), Louise Muller (Director: Valuations), Llewellyn Louw (Head: Valuations
Process & Methodology) and Emeraan Ishmail (Manager: Valuations Data & Business
Systems).

We also wish to acknowledge Tracy Jooste (Director of Policy and Research) and Paul Whelan
(Directorate of Policy and Research), both of the Western Cape Department of Human
Settlements; Yasmin Coovadia, Seth Maqetuka, and David Savage of National Treasury; and
Yan Zhang, Simon Walley and Qingyun Shen of the World Bank; and independent consultants,
Marja Hoek-Smit and Claude Taffin who all provided valuable comments.

Project Team:
Kecia Rust
Alfred Namponya
Adelaide Steedley
Kgomotso Tolamo
Aqua Suliali
Illana Melzer

Cape Town’s Residential Property Market: January 2018                                     2
Cape Town’s Residential Property Market
Size, Activity, Performance

ACKNOWLEDGEMENTS ................................................................................................................ 2
FOREWORD ................................................................................................................................. 6
EXECUTIVE SUMMARY ................................................................................................................. 7
1      INTRODUCTION ................................................................................................................. 11
2      THE HOUSING MARKET – AN ANALYTICAL FRAMEWORK ..................................................... 12
    2.1     THE HOUSING ASSET ................................................................................................................ 13
    2.2     PROPERTY MARKET FILTERING ................................................................................................... 16
    2.3     SEGMENTING THE HOUSING MARKET .......................................................................................... 20
3      CAPE TOWN’S RESIDENTIAL PROPERTY MARKET ................................................................. 22
    3.1     MARKET SIZE AND VALUE .......................................................................................................... 22
    3.2     MARKET ACTIVITY .................................................................................................................... 30
       3.2.1 Supply of new housing as seen on the deeds registry ..................................................... 30
       3.2.2 Resale market activity ..................................................................................................... 33
       3.2.3 Lending activity ............................................................................................................... 37
       3.2.4 Housing prices ................................................................................................................. 38
4      PROPERTY MARKET PERFORMANCE IN CAPE TOWN ........................................................... 40
    4.1     HOUSING AFFORDABILITY AND ACCESS ........................................................................................ 43
    4.2     ECONOMIC AND SPATIAL TRANSFORMATION ................................................................................. 48
       4.2.1 Economic Transformation ............................................................................................... 48
       4.2.2 Spatial Transformation.................................................................................................... 52
    4.3     SUSTAINABLE HUMAN SETTLEMENTS........................................................................................... 57
    4.4     MARKET RESPONSIVENESS ......................................................................................................... 59
    4.5     TARGETED MARKET PERFORMANCE ............................................................................................. 61
       4.5.1 Voortrekker Corridor ....................................................................................................... 62
       4.5.2 Metro South-East Integration Zone................................................................................. 63
5      CAPE TOWN BY COMPARISON: HIGH LEVEL VIEW ............................................................... 64
6      BUILDING AN INCLUSIVE RESIDENTIAL PROPERTY MARKET IN CAPE TOWN ......................... 69
    6.1    GROWING CAPE TOWN’S RATES BASE .......................................................................................... 70
    6.2    CREATING OPPORTUNITIES FOR INCLUSIVE HOUSING AND DEALING WITH GENTRIFICATION .................... 71
    6.3    UNDERSTANDING AND WORKING WITH INFORMALITY ..................................................................... 72
    6.4    CONSIDERING THE DYNAMICS AND POTENTIAL OF THE RENTAL MARKET ............................................. 74
    6.5    REALISING PRIORITIES WITH DATA-SUPPORTED DEVELOPMENT DECISIONS .......................................... 75
7      METHODOLOGY ................................................................................................................. 76
    7.1    MARKET SIZE AND VALUE ........................................................................................................... 77
    7.2    MARKET ACTIVITY .................................................................................................................... 79
    7.3    MARKET PERFORMANCE ............................................................................................................ 81

Cape Town’s Residential Property Market: January 2018                                                                                            3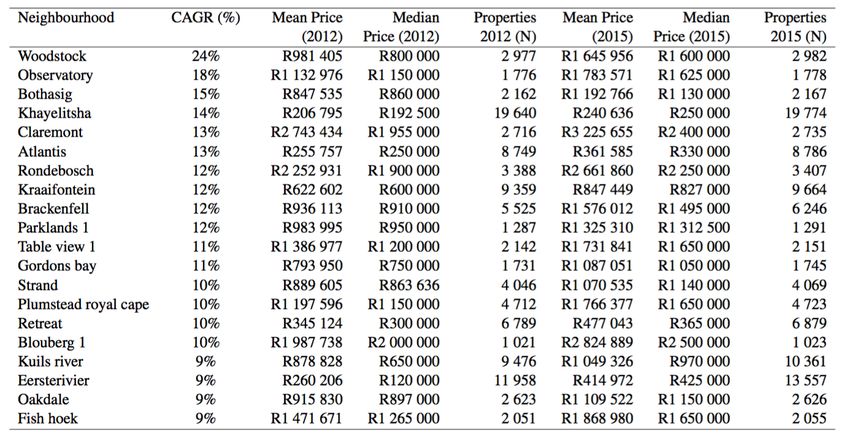
Tables
Table 1 Total Residential Properties by property type, Cape Town, 2015 .............................................................................. 26
Table 2 Total repeat transactions: all and government sponsored ........................................................................................ 35
Table 3 Churn by property type, Cape Town 2010-2015 ........................................................................................................ 36
Table 4 Cape Town population income distribution ................................................................................................................ 43
Table 5 Churn rates by market segment, Cape Town 2010-2015 ............................................................................................ 46
Table 6 Freehold Suburb Metrics, Cape Town 2012, 2015 ..................................................................................................... 54
Table 7 Sectional Title Suburb Metrics, Cape Town 2012, 2015 ............................................................................................. 54
Table 8 RDP Suburb Metrics, Cape Town 2012, 2015 ............................................................................................................. 54
Table 9 Churn rates in high performing suburbs, Cape Town 2015 ........................................................................................ 55
Table 10 Suburbs with mortgaged financed transactions under R300 000, Cape Town 2015 ................................................ 56
Table 11 Key residential market indicators: properties, transactions and bonds, all metros, 2015 ....................................... 66
Table 12 Indicators used to consider Market Size & Value ..................................................................................................... 78
Table 13 Indicators used to consider market activity ............................................................................................................. 79
Table 14 Indicators used to consider market performance .................................................................................................... 81
Figures
Figure 1 The Housing Asset ..................................................................................................................................................... 14
Figure 2 Pools and flows to enable property market filtering ................................................................................................ 17
Figure 3 Blocked pools and flows undermine property market filtering ................................................................................ 18
Figure 4 A Property Ladder in Cape Town............................................................................................................................... 19
Figure 5 Distribution of residential property in Cape Town by number and value, 2015 ....................................................... 23
Figure 6 Cape Town's most and least expensive suburbs ....................................................................................................... 23
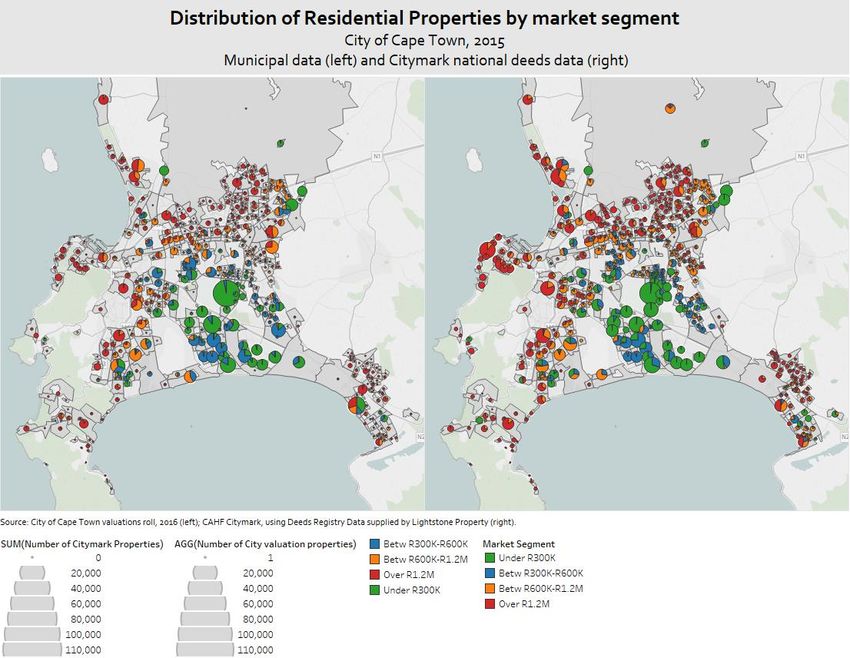
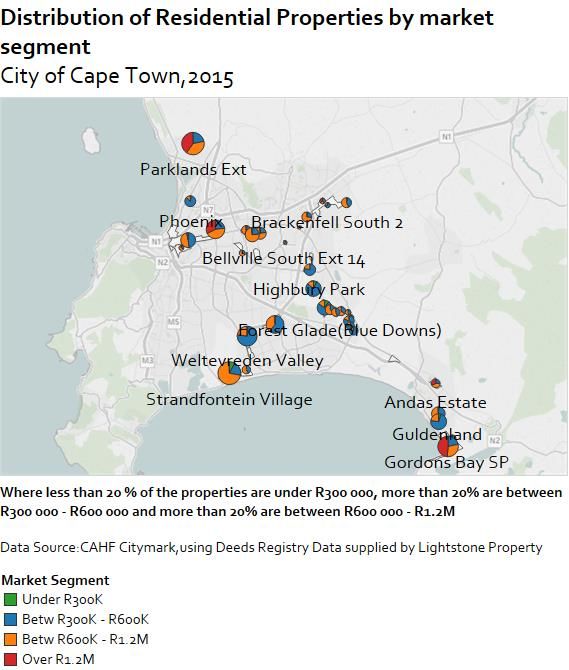
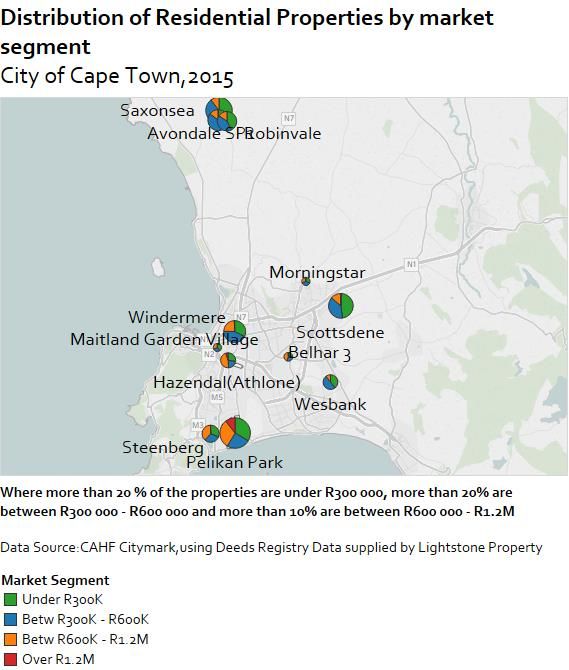
Figure 7 Distribution of residential properties by market segment, Cape Town 2015 ........................................................... 24
Figure 8 Neighbourhoods with higher levels of property value diversity, Cape Town 2015................................................... 25
Figure 9 Number of properties with an outstanding mortgage, Cape Town, 2015 ................................................................ 27
Figure 10 Cape Town's informal settlements, Code4SA ......................................................................................................... 28
Figure 12 Estimated market values for shacks not in backyards, NIDS, Wave 4 data ............................................................. 29
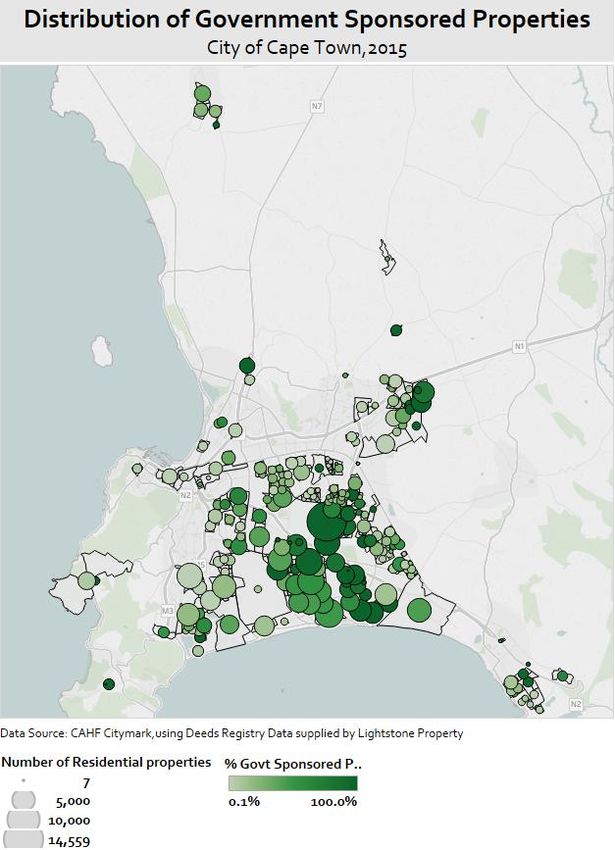
Figure 11 Distribution of government-sponsored properties, and informal settlements, Cape Town, 2015 ......................... 29
Figure 13 Percent change in total residential properties since 2010, Cape Town, 2015 ........................................................ 30
Figure 14 Percent change in total residential properties since 2010, by property type: Freehold, estate & sectional title ... 31
Figure 15 Number of new transactions, properties above R300 000, by property type: Freehold, estate & sectional title,
Cape Town..................................................................................................................................................................... 31
Figure 16 New registrations of government-sponsored properties, Cape Town 2010-2015 .................................................. 32
Figure 17 Total repeat transactions and repeat bonded transactions, Cape Town 2010-2015 .............................................. 34
Figure 18 Government sponsored properties resale transactions, financed with a mortgage, Cape Town 2010-2015 ......... 35
Figure 19 Government sponsored resale transactions, Cape Town 2010-2015 ...................................................................... 35
Figure 20 Transactions financed with a mortgage: number and value by lender, Cape Town 2010-2015 ............................. 36
Figure 21 Total mortgage loans: number by lender, 2007-2015............................................................................................. 37
Figure 22 Percent bonded transactions, Cape town 2015 ...................................................................................................... 38
Figure 23 Aggregate House Price index by market quartiles: Freehold properties (excluding RDP) by quarter ..................... 39
Figure 24 Aggregate House Price Index by market quartiles: Sectional Title by quarter ........................................................ 39
Figure 25 Key performance indicators, all residential properties: Cape Town, 2010-2015 .................................................... 41
Figure 26 Key performance indicators, properties under R600 000, Cape Town 2010-2015 ................................................. 42
Figure 27 New and repeat transactions by market segment, Cape Town 2010-2015 ............................................................ 45
Figure 28 Number of transactions financed with a mortgage bond, Cape Town, 2007-2015 ................................................ 47
Figure 29 Government-sponsored properties by market segment: value, Cape Town 2015 ................................................. 48
Figure 30 Percent resale transactions of government-sponsored properties financed with a mortgage, Cape Town 2010-
2015 .............................................................................................................................................................................. 48
Figure 31 Number of bonded transactions to government-sponsored properties. Cape Town 2007-2015, by lender, by
market segment ............................................................................................................................................................ 49
Figure 32 Value of bonded transactions to government-sponsored properties. Cape Town 2007-2015, by lender, by
market segment ............................................................................................................................................................ 50
Figure 33 Average price of resale transactions for government sponsored properties, Cape Town 2007-2015, by market
segment, with and without a mortgage ........................................................................................................................ 50
Figure 34 Estimated monthly rentals for shacks not in backyards, NIDS, Wave 4 data (entire country) ............................... 51
Figure 35 Rental yields on shacks not in backyards, NIDS, Wave 4 data (entire country) ...................................................... 52
Figure 36 Percent change in total value, Cape Town, 2012-2015 ........................................................................................... 53
Cape Town’s Residential Property Market: January 2018 4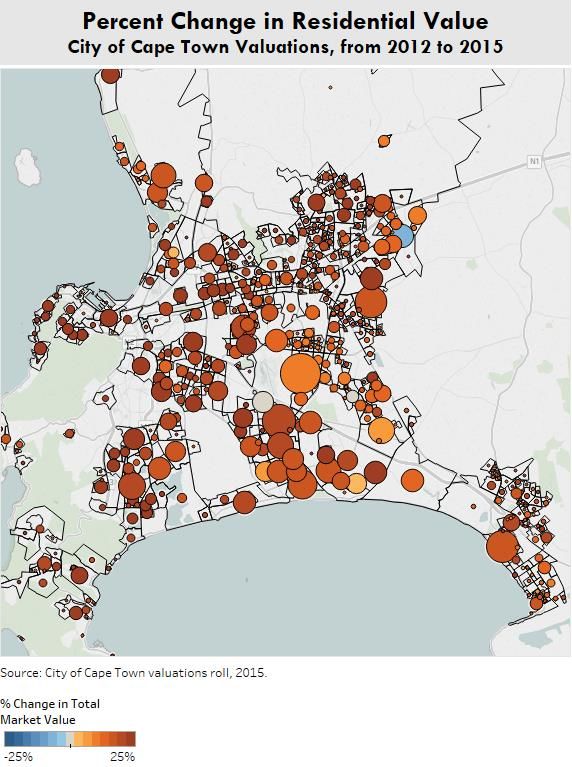
Figure 37 Total residential properties by market segment, Cape Town valuations data 2015 ............................................... 58
Figure 38 Building permit plans approved and completed, Cape Town 2012-June 2015 ....................................................... 60
Figure 39 Building permits completed: Value, City of Cape Town 2012-June 2015, by region ............................................... 61
Figure 40 Location of the Strategic Zones in Cape Town ........................................................................................................ 61
Figure 41 Key Performance Indicators, Targeted Zones in Cape Town 2010-2015................................................................. 62
Figure 42 Average price of resale transactions per year, Voortrekker Corridor, by market segment, with and without a
       mortgage, 2007-2015 .................................................................................................................................................... 63
Figure 43 Average price of resale transactions by year, Metro South East Integration Zone, with and without a mortgage,
       2007-2015 ..................................................................................................................................................................... 64
Figure 44 Market size: households and properties, all metros, 2015 ..................................................................................... 65
Figure 45 Total new & repeat transactions, all properties, all metros 2015 ........................................................................... 66
Figure 46 Total new & repeat transactions, properties under R600 000, all metros 2015 ..................................................... 67
Figure 47 Total number of mortgaged financed transactions by lender, all metros, 2007-2015............................................ 67
Figure 48 Total value of mortgage financed transactions by lender, all metros, 2007-2015 .................................................. 68

Cape Town’s Residential Property Market: January 2018                                                                                                                                 5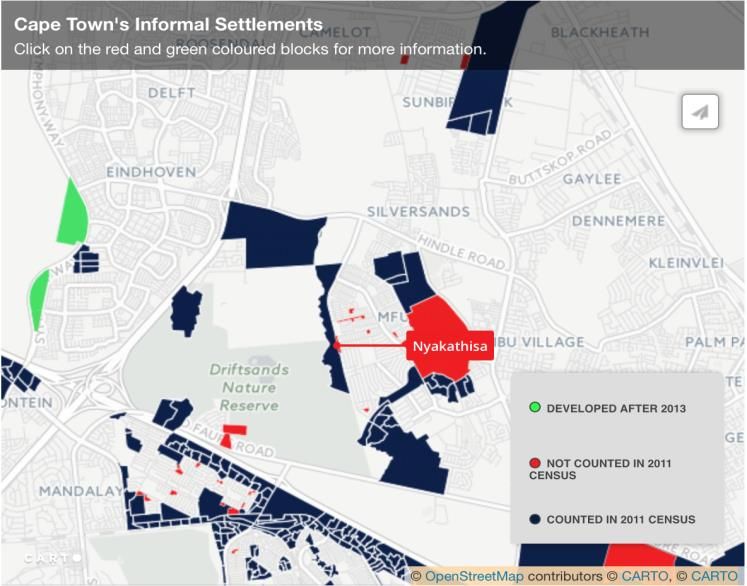
Foreword

Cape Town’s residential property market is a major asset for the city. At the end of 2015, Cape Town’s
703 8011 residential properties were worth R807 billion. The bulk of this value (77%) was held by
property owners of houses worth more than R1,2m: one third of the properties in Cape Town at the
end of 2015 represented just over three-quarters of the value. The ratio is reversed for the property
owners of the city’s lowest value properties. In this case, properties worth less than R300 000
comprised about a third of total stock, but only 3% of total value. This imbalance is a major challenge
for city government as we work to build inclusive property markets that serve all our residents and
the city as a whole.

Our city is fortunate to have a vibrant and well-functioning luxury property market, and significant
land values that make it one of the most sought-after property markets in the country. And yet, this
market serves only a small proportion of our population, and creates very real challenges in terms of
our goals for housing affordability and inclusive growth. We would like to extend our locational
benefits – the value that our sea and mountains create - to all of our residents, so that we not only
achieve our constitutional obligation to ensure access to adequate housing on a progressive basis, but
also leverage the value of the property asset for the benefit of all our residents, and to support our
goals for economic and spatial transformation.

This report sets out our current analysis of housing market dynamics in Cape Town, and draws on data
and analysis provided by the Centre for Affordable Housing Finance in Africa, as well as our own data
from the City of Cape Town. The report explores the size, activity and performance of Cape Town’s
residential property market, on a segmented basis, highlighting areas of opportunity, points of
challenge, and options for maximizing the performance of housing for the benefit of all residents,
wherever they live in our city.

The breadth of analysis possible is extensive – this report is a first step, an introduction, to Cape Town’s
residential property market. Over time, we will continue to track the metrics set out in this report –
and develop new ones – to monitor and guide the interventions that we make towards creating a city
that is sustainable and inclusive, with a well-performing property market that meets the needs of all
of its residents.

As we move forward, our ability to track and monitor property market performance across all of our
properties, from the highest to the lowest value, including both formal and informal market activity,
ownership and rental, will enhance our ability as a city to provide support. This is a fundamental role
of municipal government: to support the productive performance of the housing asset for both
individual households and the society at large, so that the homes we live in contribute substantially
to the breadth of our goals for our democracy and growth as a city and its residents. Understanding
what is going on, and for whom different aspects of the market are working or are under performing,
is the first step.

1 These figures are derived from municipal valuations property records, and thus by definition do not include unregistered
informal settlements or unregistered backyard dwelling units.

Cape Town’s Residential Property Market: January 2018                                                                    6
Executive Summary

Cape Town’s residential property market comprises 703 801 properties 2 , spread across 770
neighbourhoods (also known as sub-places), with prices ranging from as much as R25 million and
higher, to as little as no value at all. In 2015, the total value of the entire residential property market
was estimated to be R807,5 billion. Owned primarily by individual households, this represents a
significant component of household wealth in the city.

While the City is best known for its luxury property market, almost half (47%) of the entire residential
property market is ‘affordable’. This includes the 329 319 properties valued at less than R600 000 and
serving many first-time homeowners. Within this market segment, it looks like there are 191 887
government-sponsored properties that were allocated to qualifying beneficiaries since 1994. These
might include old township stock built before 1994 but transferred to residents as part of the Discount
Benefit Scheme in the mid-1990’s, as well as RDP and later BNG houses delivered as part of the
national housing subsidy programme. They might also include properties that began as serviced sites
through the Integrated Serviced Land Project, or earlier, through the IDT’s subsidized housing
programme in the very early 1990’s, that later were awarded consolidation subsidies. Cape Town’s
valuations roll has recognized 82 009 RDP properties, and the Housing Subsidy System database
retained by the Western Cape Department of Human Settlements has recorded 109 249 RDP
properties. The potential for property appreciation in this market is significant, especially given overall
property market dynamics in Cape Town.

In addition to the 703 801 residential properties that comprise Cape Town’s property market, the 2011
Census identified 143 823 households (13% of the city’s household population) living in informal
structures in 216 informal settlements. Many of these properties are not recognised on the deeds
registry or on the valuations roll. 2011 was a slight improvement on 2001 when 14,5% of households
lived in informal houses in informal settlements – however, it has been suggested that an additional
97 settlements were not included in the Census count. The percentage of informal dwellings in
settlements in the City has increased, from between 31-40% in 2001 to between 41-50% in 2011.
Between the Census 2011 and 2013, it is estimated that the number of informal settlements has grown
by a further 23 settlements.

The 2011 Census estimated that 74 800 households (7% of the population, up from 4,3% in 2001) live
in backyard shacks, including about 45 000 who live in backyard dwellings on council property.

On the whole, Cape Town’s property market has been growing steadily, with a moderate rise in
average property values and in transaction prices every year. Transaction prices (the prices that are
achieved in sales) have been slightly higher than property values (the estimated value of properties
based on trends), suggesting that demand is pushing prices up above actual values, and indicating an
opportunity for more supply (on the other hand, it could also suggest that valuations are incorrect).
The number of transactions has risen very gradually, with 32 000 transactions in 2010 to about 37 700
transactions in 2015, with a brief dip in 2011 and 2012. The majority of these transactions have been
in the resale market; new build has been dominated by the delivery of government subsidized housing.
A key challenge, however, is that the rate of new build has not matched the population growth rate –

2 These figures are derived from municipal valuations property records, and thus by definition do not include unregistered
informal settlements or unregistered backyard dwelling units.

Cape Town’s Residential Property Market: January 2018                                                                    7
suggesting a growing rather than declining housing backlog. Lender participation as a proportion of
total transactions has also been relatively consistent overall: about half of all transactions have been
financed with a mortgage. This has contributed to the relatively stable (albeit insufficient) delivery of
new housing and annual turnover (or churn) of existing housing.

Cape Town’s property market dynamics present City management with a set of challenges that are
complex and diverse. The various segments that comprise Cape Town’s property market perform
differently, in some cases for the benefit of residents, and in others exacerbating inequality. In some
areas, informal transactions, and informal housing activity more broadly, is significant, and may well
be crowding out formal markets, norms and mechanisms. In these areas, the available data indicates
that markets underperform, with low rates of churn and properties trading below replacement cost,
some informally. This reflects a context in which households struggle to access and navigate
administrative systems to access funding, obtain information and transact formally. This discount of
market value on replacement cost itself reflects poor governance, with high crime and poor
connectivity. Often city management is limited, and competes with alternative governance structures.
Secured lending is minimal, as lenders avoid additional risks - both financial and reputational – of
operating in these areas.

At the other extreme, some property market activity appears irrationally exuberant, with buyer
participation quite possibly encouraged by a belief that prices will continue to rise indefinitely. While
data reflected in this report captures the market until the end of 2015, there has been visible activity
since then that suggests substantial development activity in high value areas, with properties
subdividing or sectionalizing. While this may be positive in the sense that it densifies key areas and
contributes to the city’s growing rates base, it should be monitored closely to ensure that the city is
not inadvertently encouraging a speculative bubble.

To add to this there are some well-located areas that have historically underperformed, that are now
beginning to correct. As they do, affordability is constrained, and some households are displaced,
leading to social and political instability. The question of gentrification and displacement is a key issue
for attention.

The overall goal for building an inclusive residential property market in Cape Town suggests five broad
areas of attention for the city:

1. Growing Cape Town’s rates base: This would involve exploring how the city levies rates on
   residential properties and reconsidering how certain properties are exempted from paying
   property tax. Beyond this, it is recommended that the city grow its rates base through various
   ‘value creation’ measures that stimulate property market growth at the local level. On the one
   hand, property prices reflect underlying supply conditions, which the City can influence through
   the management of its development controls. Increasing prices might indicate limitations in the
   supply zoned or serviced land. On the other hand, prices will reflect the success or failure of city-
   led strategies designed to make some areas more habitable or to improve the quality of life of
   residents. The simple implementation of development controls in support of quality home
   improvements can also have an important impact. The city must also be awake to the risk of a
   property bubble and the impact this has on housing affordability and access. The city should
   monitor its property market to identify areas that are under- or over-performing in terms of value,
   and actively support targeted household investments or value capture on these particular metrics.

Cape Town’s Residential Property Market: January 2018                                                    8
The key goal for City management must be to see Cape Town’s property market as a single
    property market, with high and low values that all have investment potential and worth. The rates
    policy itself can assist in shifting the approach in this way – by focusing on the twin goals of
    maximizing both financial and social value of the housing asset and using the strengths of one to
    support the growth of the other.

2. Creating opportunities for inclusive housing and dealing with gentrification: The city needs to
   better understand demand for and investment interest in housing across the income and property
   spectrum, in order to understand how it might support inclusive housing and protect lower
   income households from displacement. This report provides a first step, but there is much more
   analysis that could be done, and the depth of analysis could be much richer with the City’s own
   data that captures behaviour such as the usage of infrastructure services, and household
   investment. With an understanding of areas at risk of displacement, for example, the analysis can
   then dig deep into local area dynamics and seek opportunities on the boundary.

    Understanding housing market dynamics would also put the city in a position to address the
    second challenge – ensuring that the breadth of supply matches the diversity of demand in the
    various market segments that together comprise the city’s population. Towards this goal, the city
    could identify specific land parcels with a strong social value that might not have yet been noticed
    by the private market; or from its own portfolio, those land parcels that should be protected into
    the future.

    Gentrification is feared because it appears to be about a curtailing of opportunity, as wealth
    squeezes out the poor and neighbourhoods homogenize around class. Cities can use their own
    development levers, however, to stimulate and broaden opportunity in those very same places –
    if they know where the deficit lies, and if they know how to capture land values for the benefit of
    their target.

3. Understanding and working with informality: Informal market activity is often an expression of
   formal systems not working as the market requires. The city should explore strategies to improve
   household compliance with requirements regarding planning approval. Access to simple building
   plans and active support of in situ home improvements, through expedited and supported
   development approvals would also contribute to households own efforts to improve their housing
   situations. Similarly, given that informal transactions effectively remove housing assets from the
   pool of formal, titled properties in the City and undermine the performance of the property
   market in many areas in which the State has invested significantly, it should be a matter worthy
   of urgent attention by City management.

4. Considering the dynamics and potential of the rental market: Special attention should be given
   to exploring the existence, functioning and potential of the rental market, not limited to social
   housing, but also including privately provided rental, both formal and informal. By understanding
   this breadth and how it functions, and applying its various development levers, Cape Town can
   influence the rental sector and how it meets this diversity of demand, and the extent of private
   investment that it attracts. In the immediate term, the city should consider which of its datasets
   offer an indication of rental activity, such as building permits data, utility hookups and account
   information for distribution of units and usage. A focused analysis on the supply of and demand
   for rental in the city, with particular attention on certain nodes, would be very useful.

Cape Town’s Residential Property Market: January 2018                                                 9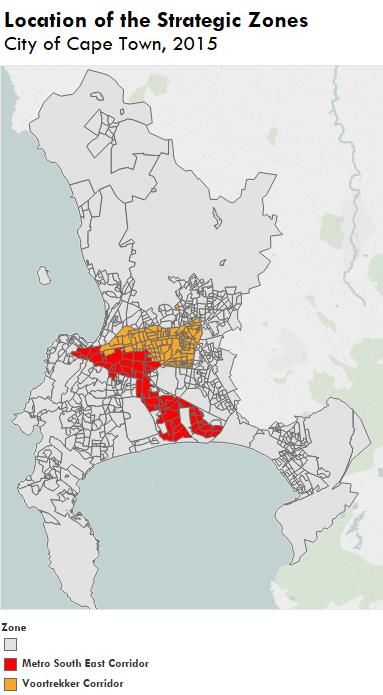
5. Realising priorities with data-supported development decisions: A key aspect of a city’s ability
   to track the property market is its ability to count it. The central source of reference must be the
   National Deeds Registry, on which the entire property market depends. The extent to which it
   represents the full property market, however, is complicated by the delayed titling process in the
   government-sponsored market, and other factors that affect low value properties in particular.
   Cape Town’s Valuations Roll is a separate database that enables the city’s property taxation
   regime – a critical component of its revenue base. At the moment, these two databases do not
   fully align. Understanding and addressing the anomalies must be a priority going forward.

    The ability to track specific markets and characteristics allows municipalities to appropriately
    manage resource allocations in terms of infrastructure investment, while monitoring any
    economic disequilibrium in property prices. This would assist Mangaung tremendously in
    understanding particular neighbourhood or area-based property market dynamics, which would
    both contribute to a more refined application of rates against property values, and to greater
    precision in the implementation of particular policy measures such as infrastructure investment
    or area-based management.

The realization of government’s commitment to access to adequate housing for all depends on well-
functioning housing markets, and not just the delivery of new housing. This report quantifies Cape
Town’s residential property market, exploring market size and value, and market activity, paying
attention to both formal and (where possible) informal market activity. It further explores property
market performance, specifically in terms of key metrics that are important to the city at this stage in
its growth and development, and given the population that it serves. Cities play a critical role in the
performance of the residential property market, through the various development levers they apply
and their overall management and governance of the neighbourhoods in which their residents reside.
Cities must therefore extend their attention to how housing markets, highly complex systems,
perform, and use this knowledge to support their overall human settlements goals.

Cape Town’s Residential Property Market: January 2018                                                10
1 Introduction South Africa’s residential property market is the largest component of the South African property market, comprising the majority of property assets within the country, and an important component of household wealth. The South African deeds registry comprises seven million properties, worth almost R6 trillion.3 Of this, about 6,1 million registered properties, or 87%, are considered residential, ranging from sectional title to freehold properties and estates; including government-sponsored homes, homes occupied by their owners or rented to others, and holiday homes; and found across the country, from rural areas (with formal title), to mining towns, to small and secondary cities, to metro municipalities. The majority of the residential property market – 62% in 2015 – includes homes valued at less than R600,000 4 . Of this, two thirds (or 43% of all properties) are homes that are valued at less than R300,000, of which the majority are estimated to be government sponsored homes: clear evidence of the significance of government’s subsidised housing programme and the sheer volume of property assets transferred to qualifying beneficiaries since 1994.5 Almost two thirds (about 57%) of the total formal residential property market is found in the eight metro municipalities. Almost one fifth (just over one million properties) is found in the Western Cape. With about 700 000 residential properties on the national deeds registry, Cape Town’s property market comprises roughly 11% of the total residential property market in South Africa, and 65% of the property market in the Western Cape. Residential property is the largest and most differentiated asset within any city, and a significant part of a city’s economy, especially insofar as it relates to household wealth, livelihoods, and the prospect of inclusive growth. As the property market grows and develops, housing can be an instrument of economic transformation, with property values growing faster than inflation and offering leapfrog opportunities to lower income households as they benefit from the appreciation of their housing asset. This creates further opportunities to leverage property with finance, supporting the development of small businesses, so important in the context of low employment. At the same time, this activity contributes to a growing revenue base for the city, and improves its ability to invest in further growth and deliver appropriate services to the breadth of its population. Understanding housing markets is a key first step in maximising the power of the housing asset for all residents and for the city itself. Cities have a myriad of tools with which to stabilise and grow housing markets, including policy, programmes and legislative oversight and management; financial resource redistribution including the ability to collect taxes and distribute subsidies; and property asset redistribution, including the acquisition and disposal of land and buildings. With a more detailed understanding of housing markets, the City can better implement a robust, supportive and coordinated housing market regime. Metro administrators can: 3 The data analysed in this report has been provided by the Centre for Affordable Housing Finance in Africa (CAHF), which draws its data from the National Deeds Registry, as provided by Lightstone. Additionally, some of the data is drawn from the City itself – this is clearly indicated. The data in this report reflects Cape Town’s property market as it stood at end 2015. 4 These market segments have been established by CAHF using Lightstone’s valuation methodology. 5 This includes housing delivered as part of the national housing subsidy scheme since 1994, as well as housing delivered prior to 1994 but transferred within the democratic administration to occupants as part of the Discount Benefit Scheme. Counting the number of government-sponsored properties in the city is surprisingly difficult, as no database is conclusive, each having been compiled for different reasons. The approach to this is clarified in the section on methodology. Cape Town’s Residential Property Market: January 2018 11
•   Better meet demand – identify housing affordability challenges and more efficiently provide well-
    located housing options, identify, capture or create momentum in as yet unrecognised areas of
    growth and development, better connecting employment and housing;
•   Better stimulate supply – identify, measure, and incentivize supply gaps (in price or location) that
    prevent an otherwise willing and able market to achieve their housing goals;
•   Invest scarce public funds more effectively and more efficiently - to reinforce and influence better
    connections between supply and demand;
•   Support sustainable livelihoods – through promotion of housing asset performance, providing the
    means for lower income families to move up and out of poverty; and
•   Build local economic viability at the neighbourhood level – through the creation of investment-
    worthy areas in which private individuals and businesses place their own resources, further
    leveraging the city’s investment, and contributing to a growing rates base.

This report provides an analysis of Cape Town’s residential property market in terms of its size and
value, activity, and performance. Market size, value and activity are status quo analyses, setting out
the shape and dynamics of Cape Town’s property market. Market performance then considers these
dynamics against specific performance objectives.

Following this introduction, Section 2 provides the analytical framework for looking the market. It
considers the role of the housing asset, how property market filtering happens, and how the housing
market can be segmented to develop appropriate responses that are relevant to all of the City’s
residents. In Section 3, the size and value of Cape Town’s residential property market is set out,
together with an analysis of current activity in terms of supply of new housing, the resale market,
lending and house prices. Section 4 then considers the actual performance of Cape Town’s property
market and whether it is responding to the City’s goals for affordable and accessible housing,
economic transformation and inclusive growth, and sustainable human settlements. The report then
considers how responsive the market is to the demand pressures that exist, and looks in some detail
at performance in the Voortrekker Corridor and the Metro South-East Integration Zone. In Section 5,
Cape Town’s property market is compared with those in the other major metros in South Africa.
Section 6 concludes with considerations towards the realization of an inclusive residential property
market in the city. The methodology for the analysis is summarized in Section 7.

2   The Housing Market – An Analytical Framework

Housing exists in a market: housing is produced, owned, rented, maintained and sold in a complex
system involving buyers and tenants (individuals, households, companies and governments), suppliers
and sellers (developers, builders, homeowners, landlords and governments), market facilitators
(financiers, estate agents, conveyancers) and regulators (the City, the province, national government,
and various public agencies and regulatory bodies). Like other economic goods, housing supply is
influenced by an expression of demand, which itself is influenced by affordability – the ability and
willingness of the buyer or tenant to invest in or pay for the housing product. In Cape Town, demand
is substantially constrained by affordability. What the supply side delivers is too expensive for what
the demand side can afford to pay. This is the case for a number of reasons, but ultimately, what it
results in, is a widening and diversifying of the housing market to include both formal and informal
housing supply. Formal housing, delivered or improved according to city building regulations with
approved building plans, on regularized land, and by registered builders, targets higher income
earners. Informal housing, often escaping observation without plan approval, built or improved by

Cape Town’s Residential Property Market: January 2018                                                12
informal builders, in backyards or on unregistered land, targets lower income earners and the poor. To bridge the affordability gap and assist poor households to access the formal housing market, the national government offers a state-subsidised housing programme. But as is evident across the country, this is not delivering enough housing, and inadequate housing circumstances persist. There is a further dimension. Unlike other economic goods, housing exists on land, a finite resource that has value relative to its location and access to services and amenities. The value of land often interferes with the value of housing: a fabulous, three-bedroom unit with a state-of-the-art kitchen, on a piece of land on the edge of the city, or where the government fails to deliver its services, may have cost more to build, but is likely to sell for less than a tiny bachelor flat in the city centre where the homeowner can have a view of the ocean and enjoy uninterrupted services supply. This is because households with affordability will compete to buy the well-located and well-serviced housing, and may be willing to pay more for these benefits. House prices are determined by the trade-offs that buyers make in choosing where and how to live, and as a result, housing markets are all about location. At the same time, the city has an important role to play in influencing housing supply and demand dynamics. Essentially, cities can influence market behavior through providing information (including outreach to external audiences as well as its own planning needs), regulation (zoning and land use restrictions and incentives), and finance (investment in infrastructure and service delivery, including subsidized housing). Cities play a significant role in place making and value creation, including managing the effects of social exclusion precipitated by gentrification, or in creating inclusionary housing opportunities. These all influence (and sometimes directly drive) housing demand and supply dynamics and create opportunities to leverage both public and private resources towards meeting housing needs and making markets perform in the interests of all residents and the city as a whole. 2.1 The Housing Asset The question of market performance – the value that housing realises for both the household and the city as a whole – is important. Housing is an asset. For households, it is likely to be the most significant investment that they will make in their lifetimes. With the national housing subsidy programme, it is also a significant investment for the State. Beyond the subsidy programme, housing markets also offer the city substantial revenue opportunities that create the budget that makes the city function. Cities want to make sure that they get the best value out of their investment. To understand housing market performance, it is useful to think about the housing unit as an individual, private asset, and to think of a functioning housing sector as a “national asset” of sorts, that contributes to the overall economy. Cape Town’s Residential Property Market: January 2018 13
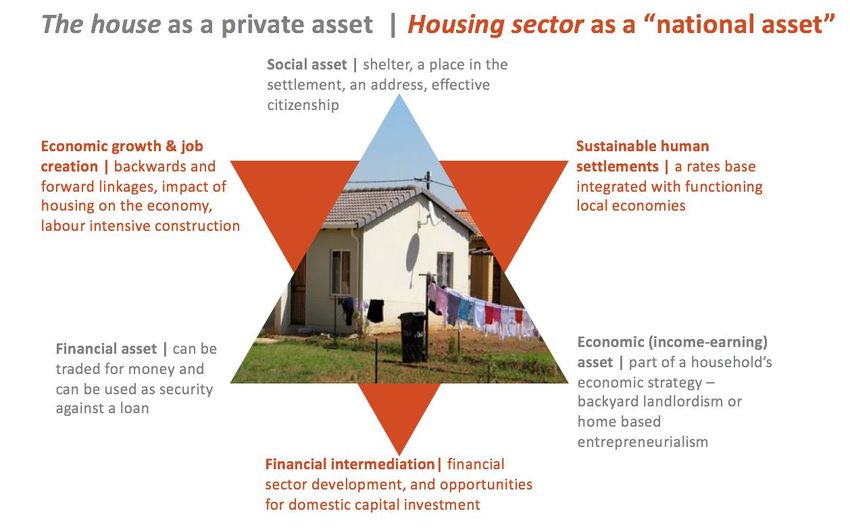
Figure 1 The Housing Asset

Source: CAHF

As a private asset, the house brings value to the household, whether they own or rent, in three main
ways. First, there is a social value. The house sits within a neighbourhood and is the place to which
family and friends come to celebrate and share life experiences, and from which the household goes
to find work or otherwise engage in society. The house itself is the site from which the household
accesses infrastructure services – water, sanitation, electricity and refuse collection. In the
neighbourhood, the household can also access social services – schools, clinics, community centres –
that profoundly impact on their quality of life. Enhancing the social asset performance of housing is
about improving the quality of the neighbourhood and creating spaces for families to come together.

The house also has a financial value: it is worth something and can be traded for money. It can also
be used to leverage a loan from a bank – the home owner can secure a mortgage loan by using the
house as collateral. This can be used to invest further in the house, to start a business, to pay for
education, or to make other significant investments. The house can also be passed on as an
inheritance to children or other family members, and in this, operates as a form of savings that
contributes towards household wealth. Enhancing the financial asset performance of housing is about
enabling incremental home improvements, improving property values, increasing access to loan
finance, and improving transaction support to ensure that households can access the financial value
of their properties when they need to.

Lastly, the house can also function as an economic asset for the household. In this, the house becomes
the base from which a household might run a small business, offer accommodation for rent, or
otherwise earn an income. In the context of high unemployment, this creates an especially important
opportunity for households to realise sustainable livelihoods. The establishment of home based

Cape Town’s Residential Property Market: January 2018                                              14
enterprises also diversifies land uses and creates more sustainable human settlements. A spaza shop
operating from a home in a residential neighbourhood saves neighbours from taking the bus to buy
milk, while creating an income stream for the shop owner.

The formality of the household’s rights over the property, and whether or not the housing unit itself
is a formal structure, impacts substantially on the performance of housing as a private asset. It is
obvious that formally titled or leased properties that are well-placed within the urban context and
constructed out of durable building materials that protect their inhabitants from the elements, offer
stronger social, financial and economic potential than informal housing. Informal housing also has
value, however. A shack in a well-located settlement may offer the household better income earning
opportunities than a formal structure that is outside an area of economic activity, or may provide
better access to economic opportunity. Similarly, an informal transaction may be worth more to the
transacting parties, even if it realises less financial value, simply because it can be concluded more
quickly. Cities need to understand these dynamics if they are to improve housing asset performance
for their residents, whether they live in formal or informal settlements.

While housing and private property is in many ways the quintessential private good, the housing
sector as a whole performs a vital role in an economy, and can therefore be thought of as a sort of
“national asset”. All supply chains associated with products and services create jobs and contribute
to the economy, and housing is no exception. Add data. But beyond this, housing impacts on the
economy in some unique ways. By understanding what makes housing different from other products
and services we can explore the critical role for cities in shaping housing markets. There are three
dimensions to this.

First, the construction, maintenance and transacting of housing (which includes both sales and leases)
contributes substantially to economic growth and job creation, which can have very tangible local
benefits. CAHF has estimated that the housing construction and rental sectors contribute about 2.4%
to Gross Value Added at the national level, equivalent in the economy to the agriculture, forestry and
fishing sectors, and to the food sector.6 The reason for this contribution has to do with the economic
activity that housing stimulates – upstream demand for building materials and labour, and
downstream demand for furniture, home improvements, and other housing services. All of this
economic activity also contributes towards employment. CAHF estimates that in 2014, the housing
construction sector created approximately 242 000 full time equivalent jobs (formal and informal)
across the country. The rental housing sector created a further 226 000 full time equivalent jobs
across the country in 2014. 7 Cities that promote housing construction and rental can use this to
stimulate job creation in their areas, further contributing to economic growth.

Second, housing constitutes a vital component of the financial system, and plays a critical role in
financial intermediation, assisting the flow of money through the economy. This is because housing
is a leverage-able asset that can be used as collateral for other loans, thereby enabling private
investment. In many developed economies, housing underpins a sizeable proportion of the assets of
the financial sector through the mortgage instrument. This in turn underpins the efficacy of the
money transmission mechanism in the household sector, enabling monetary authorities to manage

6
  See http://housingfinanceafrica.org/what-role-does-housing-play-in-african-economies/ and http://housingfinanceafrica.org/story-
housing-economy-exploring-south-africas-housing-value-chains/
7 Centre for Affordable Housing Finance in Africa (2017) Housing Economic Model: South Africa. See

http://housingfinanceafrica.org/what-role-does-housing-play-in-african-economies/ and http://housingfinanceafrica.org/story-housing-
economy-exploring-south-africas-housing-value-chains/

Cape Town’s Residential Property Market: January 2018                                                                              15
economic growth cycles. Mortgages are also useful as an investment class, given their long-term
nature. In addition, housing consumption is in most cases, the largest share of household
consumption, and often the most significant asset a household will ever have. The house is then a
fulcrum around which a household’s financial and investment decisions are made, both influencing
and enabling further financial activity.

In South Africa, while the mortgage market is well developed relative to the rest of the economy, it
serves a minority of households. This is unsurprising given the high levels of inequality that
characterise the country. However, there has been significant investment in housing by the State, and
a significant transfer of wealth through the housing subsidy programme directly to poorer households.
The failure of these assets to translate into performing financial assets through mortgage instruments
is not only disappointing for low income home owners themselves, but it also fails society in doing
little to reduce wealth disparities. Despite the formalisation of housing, many RDP properties transact
below replacement cost and owners fail to realise value, and grow their wealth through housing.
While several factors contribute to poorly performing housing markets, local government and urban
management have a significant impact on the value of housing, its market performance, and therefore
its contribution to the overall financial system.

Finally, the housing sector contributes to the sustainability of human settlements in a number of ways.
Housing and settlement patterns fundamentally shape the experience of households who live in a city
as well as the capacity they contribute and the resources they draw. Households located far away
from jobs in areas poorly served by public transport are unlikely to be able to participate in the labour
market even to the limited extent that the economy currently allows. The sheer distances require
increased public investment transport and on-going subsidisation. Segregation also limits
opportunities for social interaction and undermines critical social objectives.

A further contribution to the city sustainability is through the rates and taxes generated by property
and the ability of the city to capture this value to serve its broader development goals. As properties
appreciate in value, they increase a city’s rates base, and this contributes to the growth in city budgets
that enable them to invest in further infrastructure and services delivery, which further supports
growth.

A key point of focus for the city is to understand how the two asset triangles – housing as an individual
asset and the housing sector as a sort of “national asset”– interact, and the impact that the informal
housing sector has on both. Ultimately, the goal is to maximise housing market performance for the
benefit of City residents, as well as for the city itself. This requires careful attention to the extent to
which households can maximise the social, economic and financial performance of their housing – and
implementing measures that support them in this effort – while also enhancing the impact that the
City’s work in human settlements has on its local economy, its labour market, and its overall
sustainability as a city.

2.2 Property Market Filtering

Beyond the asset value of the stock itself, new housing supply, and functional resale markets
(including finance, market information) enable filtering: households moving from one housing

Cape Town’s Residential Property Market: January 2018                                                   16
circumstance (or pool, in the diagram below) into another to meet their particular housing needs to
the extent they can afford.8

For example, in South Africa’s current policy context, if there is sufficient supply, a household in an
informal settlement may access government-sponsored housing, may buy an existing RDP house on
the resale market, or may move directly into entry-level or starter housing, depending on their
affordability – their income and the availability of finance. As their incomes improve or their
circumstances change, they may find the opportunity to further improve their housing, moving into
something larger to accommodate a growing family, or to a better neighbourhood. As they proceed
through the housing ladder, they may find that rental housing is more appropriate for a time. Housing
needs are not static; housing circumstances must change to meet the changing needs of the
household.

Figure 2 Pools and flows to enable property market filtering

                                                    Sub-optimal rental (informal,
                                                  inadequate, backyard shack, etc.)
        Informal living, poor quality
           housing squatting, etc.                                        Affordable rental /
                                                                            social housing

                           Subsidised housing                                                        Adequate, quality, market rental

                                                                               Entry-level, formal
                                                                                    housing
    When filtering works, there is sufficient supply of affordable
    housing for ownership and rental, enabling household mobility
    and the leveraging of the housing asset.                                                          Next housing opportunity for
                                                                                                          ownership or rental

                                                              H              H                           H
                                          H                                                     H
                                                   The right home, for rental or ownership

As households move up the housing ladder, and existing housing becomes available for low income
households who do not qualify for subsidies, or indeed also for subsidy beneficiaries, the demand for
state production of new housing is replaced by available supply in the resale market. Private sector
supply then meets the needs of the sellers who use the equity from the sale of their homes to invest
in higher value housing up the ladder.

That is the ideal scenario, and what the nation is trying to achieve with its policy. The property market
does not always work this smoothly, however: there are far many more households needing housing
at the bottom end (subsidised housing, social housing or entry level housing for ownership), than there
is supply of new housing that they can afford. This means that the number of households living
informally, whether in backyard shacks or in informal settlements, or overcrowding in existing
housing, is growing, and the filtering pathways are blocked.

8Rosenthal, S (2013) Are private markets and filtering a viable source of low-income housing? Estimates from a “repeat income” model.
Forthcoming: American Economic Review
http://faculty.maxwell.syr.edu/rosenthal/recent%20papers/Is_Filtering_a_Viable_Source_of_Low-Income_Housing_%206_18_13.pdf

Cape Town’s Residential Property Market: January 2018                                                                                   17
You can also read


